


Dietary macronutrient composition has implications for human health, and excess intake of nutrients in combination with a sedentary lifestyle increases the incidence of overweight and obesity( Reference Hu, Manson and Stampfer 1 , Reference Tuomilehto, Lindstrom and Eriksson 2 ). Obese subjects have an augmented risk of developing type 2 diabetes and CVD, and this has led to an increased awareness on the prevention and treatment of obesity( Reference Ludwig, Pereira and Kroenke 3 , Reference Lindstrom, Peltonen and Eriksson 4 ). A typical diet consumed in affluent societies is high in refined and rapidly digestible carbohydrates, fat and protein, and low in dietary fibre (DF)( Reference Lindstrom, Peltonen and Eriksson 4 , Reference Riserus, Willett and Hu 5 ). In Denmark as well as in most other northern European countries, cereal products are the main contributor of carbohydrates and DF( Reference Elia and Cummings 6 ). Intervention studies( Reference Juntunen, Laaksonen and Autio 7 – Reference Johnston, Thomas and Bell 9 ) have shown that certain types of slowly digestible starches and DF (mostly soluble) may influence postprandial glycaemic responses and improve insulin sensitivity in healthy, obese and diabetic subjects. These effects were originally thought to be brought about by physical factors, i.e. resistance of starch granules against amylolysis, encapsulation of starch granules in cell walls, formation of resistant starch (RS)( Reference Englyst, Kingman and Cummings 10 ) or the presence of viscous soluble polysaccharides( Reference Wood, Braaten and Scott 11 ). However, recent studies( Reference Robertson 12 – Reference Theil, Jorgensen and Serena 14 ) have pointed to events in the large intestine having implications for glucose homeostasis and insulin sensitivity.
DF are the fraction of carbohydrates and lignin that escapes digestion in the small intestine and passes to the large intestine, where they are fermented by the colonic microbiota. Fermentation in the large intestine leads to the production of SCFA, mainly acetate, propionate and butyrate in the ratio acetate>propionate ≥ butyrate, gases (hydrogen, NH3 and methane) and other metabolites, including lactate and pyruvate( Reference Topping and Clifton 15 ). The ratio of SCFA production and absorption is dependent on fermentation substrate, microbial composition as well as colonic transit time( Reference Wong, de Souza and Kendall 16 ). Luminal SCFA concentrations decrease with a lower colonic DM content or reduced fermentability( Reference Wong, de Souza and Kendall 16 ), but absorption occurs at comparable rates along the colon in a dose-dependent manner( Reference Ruppin, Bar-Meir and Soergel 17 ). Dietary intervention studies have demonstrated that fermentation of RS( Reference Van Munster, Tangerman and Nagengast 18 ) and rye products containing arabinoxylan (AX)( Reference Bach Knudsen, Serena and Kjaer 19 ) specifically increases the production of butyrate. Most of the SCFA are either metabolised or absorbed by the colonic epithelium or metabolised by other colonic bacteria, resulting in only 5–10 % of the produced SCFA being excreted in the faeces( Reference Topping and Clifton 15 ). SCFA that reach the portal vein are transported to the liver, where the majority of the absorbed SCFA are metabolised( Reference Kristensen and Wu 20 ). Increasing the intake of DF therefore causes the increase of not only acetate but also propionate and butyrate, resulting in minor amounts of propionate and butyrate reaching the peripheral circulation with potential direct metabolic effects on peripheral tissues( Reference Priebe, Wang and Weening 13 , Reference Bach Knudsen, Serena and Kjaer 19 , Reference Robertson, Bickerton and Dennis 21 ). Reduced insulin secretion has previously been reported in pigs and healthy and overweight subjects in response to AX( Reference Juntunen, Laaksonen and Autio 7 , Reference Theil, Jorgensen and Serena 14 ) and RS( Reference Robertson, Currie and Morgan 8 , Reference Maki, Pelkman and Finocchiaro 22 ) supplementation, suggesting a link between butyrate and improved peripheral insulin sensitivity( Reference Robertson, Currie and Morgan 8 , Reference Priebe, Wang and Weening 13 , Reference Robertson, Bickerton and Dennis 21 ). The exact mechanisms underlying this association are currently unknown, but may be related to the role of butyrate in the prevention of obesity development( Reference Brighenti, Benini and Del Rio 23 ). Furthermore, increased peripheral SCFA have been shown to inhibit lipolysis within adipose tissues as indicated by the reduced plasma concentrations of NEFA after the intake of fermentable carbohydrates( Reference Brighenti, Benini and Del Rio 23 , Reference Ferchaud-Roucher, Pouteau and Piloquet 24 ). This results in the reduced availability of fatty acids for uptake into ectopic fat depots, e.g. liver and pancreas( Reference Robertson 12 ). A high DF intake and increased SCFA absorption have also been linked to the reduced secretion of the incretin hormones glucagon-like peptide 1 (GLP-1) and glucose-dependent insulinotropic peptide (GIP)( Reference Hooda, Matte and Vasanthan 25 , Reference Regmi, van Kempen and Matte 26 ). These hormones are secreted in response to increased glucose levels in the intestinal lumen and stimulate insulin secretion( Reference Baggio and Drucker 27 ). Taken together, the above-mentioned conditions link increased peripheral SCFA to improved insulin economy and glucose homeostasis.
The main objective of the present study was to investigate how increased large-intestinal fermentation stimulated by RS or AX influence the net portal flux (NPF) of glucose, SCFA, insulin and incretin hormones and their hepatic metabolism. Porto-arterial catheterised growing pigs were used as an experimental model for humans. Changes in postprandial metabolite and hormone responses were induced by formulating three diets: a refined energy-dense Western-style diet (WSD) low in DF and two high-fibre diets rich in resistant starch (RSD) or arabinoxylan (AXD). We hypothesise that increasing DF by RS or AX supplementation will increase SCFA absorption in general and butyrate in particular, leading to reduced insulin secretion.
Materials and methods
Experimental diets
In the present study, the following experimental diets were used: a low-DF WSD made of white wheat flour (Table 1) and two high-DF diets (one high in RS (RSD) obtained by replacing wheat flour with raw potato starch and high-amylose maize starch and an AX-rich diet (AXD) based on rye flakes and enzyme-treated wheat bran). The WSD was formulated to be high in saturated fat, protein and refined carbohydrates (sugars) and low in DF, thus mimicking a diet typically consumed in affluent societies. The three diets were balanced with regard to protein, fat and gross energy, but varied in DF levels and characteristics (see Tables 1 and 2 for dietary ingredients and chemical composition). The RSD and AXD were formulated to contain three times more DF than the WSD control diet. Raw potato starch was obtained from KMC, high-amylose maize starch (HiMaize®) was obtained from Ingredion, Inc. and rye flakes from Lantmännen Cerealia. DuPont Industrial Biosciences, Danisco A/S produced the enzyme-treated wheat bran, which in brief was prepared as follows: commercially available wheat bran from Lantmännen Cerealia was suspended in water (bran:water ratio, 20:80, w/w) in a closed container with a stirring device. DuPont Grindamyl PowerBake 950 (500 parts per million) and DuPont GC220 (5000 parts per million) were added to the mixture, and the temperature was increased to 50°C while stirring. The mixture was incubated for 3 h, followed by an increase in temperature to 95°C for inactivation of enzymes (10 min at 95°C). After cooling, enzyme-treated wheat bran was dried using a speed dryer and packed in paper bags. The diets were mixed in a feed production unit (Aarhus University), and samples of the experimental diets were collected immediately after production and stored at − 20°C. The insoluble marker chromic oxide (Cr2O3) was added to all the diets and fed as powdered diets. To ensure similar particle sizes across the diets, the AXD containing rye flakes was ground through a hammer mill fitted with a 3·5 mm screen.
Table 1 Ingredients of the experimental diets
WSD, Western-style diet; RSD, resistant starch-rich diet; AXD, arabinoxylan-rich diet.
* Formulated to supply 53 % energy from carbohydrates, 17 % energy from protein and 30 % energy from fat.
† A registered trademark of Ingredion, Inc.
‡ Arla Foods Ingredients Amba.
§ J. Rettenmaier and Söhne GmbH.
∥ Supplying per kg diet: 18·9 mg retinol (vitamin A), 0·15 mg cholecalciferol (vitamin D3), 1038 mg α-tocopherol (vitamin E), 31·5 mg vitamin K, 31·5 mg vitamin B1, 31·5 mg vitamin B2, 157·5 mg d-pantothenic acid (vitamin B5), 315 mg niacin (vitamin B3), 0·79 mg biotin (vitamin B7), 0·315 mg vitamin B12, 47·3 mg vitamin B6, 1260 mg Fe, 225 mg Cu, 630 mg Mn (VA Vit SL/US Anti; Vilomix).
Table 2 Feed and metabolisable energy intake, chemical composition and relative energy contribution of the experimental diets†
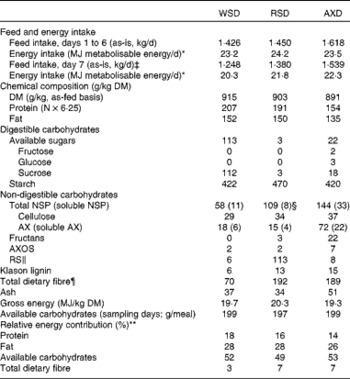
WSD, Western-style diet; RSD, resistant starch-rich diet; AXD, arabinoxylan-rich diet; AX, arabinoxylan; AXOS, arabinoxylan oligosaccharides; RS, resistant starch.
* Values were not significantly different on days 1 to 6 (P= 0·39), but differed intentionally on day 7 (P< 0·001).
† Day refers to the day within the experimental week.
‡ Providing 200 g available carbohydrates per meal.
§ Approximately 46 g RS/kg diet are included in the analysis of total NSP.
∥ Determined by the Megazyme assay (Megazyme International).
¶ Calculated as: total NSP+fructans+RS+lignin.
** Relative energy contribution calculated from protein, fat, carbohydrates and total dietary fibre.
On non-sampling days, pigs fed the same amount of metabolisable energy on all the three dietary treatments, providing the pigs a daily feed allowance corresponding to 2·3 % of average body weight on the WSD and 2·5 % of average body weight on the RSD and AXD. Meal sizes on the WSD, RSD and AXD were 498, 540 and 543 g, respectively, on an as-fed basis. The meal size fed in the evening before sampling and the two meals fed on sampling days were adjusted slightly to provide the pigs 200 g of available carbohydrates at each meal to allow comparison of acute postprandial glycaemic and insulinaemic responses (WSD, 416 g as-is; RSD, 466 g as-is; AXD, 513 g as-is). The pigs were fed three daily meals throughout the experimental period, at 09.00, 14.00 and 19.00 hours to mimic a typical human meal pattern. Each meal constituted 33·3 % of the total daily ration. The pigs were allowed 30 min to complete ingestion of a meal, after which any remaining feed was removed from the trough. Feed residues were collected and weighed to allow for later correction for feed intake.
Animals and experimental design
The pigs used in the present study were offspring from Danish landrace × Yorkshire sows cross-bred with Duroc semen from the swineherd at Aarhus University, Department of Animal Science, Foulum, Denmark. A total of six female pigs (58·8 (sem 1·6) kg) were included in the study, which was designed as a repeated 3 × 3 Latin square design. The pigs were adapted to housing in single pens without bedding material for 3–5 d, before being surgically fitted with permanent catheters in the portal and hepatic veins and in the mesenteric artery. An ultrasonic flow probe (Transonic, 20PAU probe, 18/20 mm; Transonic System, Inc.) was implanted around the portal vein to measure the portal blood flow rate. The surgical procedure has been described in detail by Jorgensen et al. ( Reference Jorgensen, Serena and Theil 28 ). The pigs were kept in individual pens (3 × 2 m) without bedding and with elevated plastic grids covering half of the pen that allowed the pigs to rest and stay dry. The pigs had access to water ad libitum and could have physical and visual contact with neighbouring pigs through railings. The pigs were weighed once per week. After a 6–9 d recovery period, the pigs were included in a 21 d experimental period with three consecutive experimental weeks. In each experimental week, the pigs were fed one of the three experimental diets for 6 d, before blood samples were collected on day 7. On sampling days, portal vein blood flow was recorded by a T201D flowmeter with P-option (Transonic Systems), for 2 min immediately before each blood sampling using Powerlab (ADInstruments). Blood was subsequently collected simultaneously from all the three catheters pre- and postprandially (times − 15, 15, 30, 45, 60, 90, 120, 180, 240 and 300 min relative to morning feeding). After sampling, catheters were flushed with 5 ml sterile saline (0·9 % NaCl) to replace fluid loss and filled with 100 IU/ml of heparin solution to prevent clotting of the catheters. For glucose, insulin, SCFA and NEFA determinations, blood was collected into heparin-coated tubes (Greiner Bio-One). For GLP-1, GIP and C-peptide analyses, blood was collected in EDTA-coated tubes (Greiner Bio-One) containing dipeptidyl peptidase IV inhibitor (10 μl/ml blood; Merck Millipore). For GIP and C-peptide analyses, aprotinin (500 KIU/ml blood; Bayer Healthcare AG) was also added. After collection, plasma was harvested by centrifugation for 12 min at 2000 g at 4°C. Plasma samples were immediately frozen at − 20°C (glucose, SCFA and NEFA) or − 80°C (insulin, C-peptide, GIP and GLP-1) until analysis. Haematocrit levels were determined from the first and last arterial and portal vein heparin-stabilised blood samples on sampling days. A fresh spot faecal sample was collected on sampling days, frozen and stored at − 20°C. By the end of every collection day, each pig was given 400 mg Fe intramuscularly (Hyofer 20 % Vet; Salfarm Denmark A/S).
The animal experiments were conducted according to the protocols approved by the Danish Animal Experiments Inspectorate, and were in compliance with the guidelines of the Ministry of Food, Agriculture and Fisheries concerning animal experiments and care of animals under study. The health of the animals was monitored throughout the experimental period, and no serious illness was observed.
Analytical methods
Chemical analyses of the diets and faeces were performed in duplicate on freeze-dried samples. DM was determined by drying to constant weight at 103°C, and ash was analysed according to the Association of Analytical Communities (AOAC) method no. 942.05( 29 ). N was analysed by Kjeltec (Kjeltec™ 2400; FOSS Analytical) and protein was calculated as N × 6·25. Gross energy was analysed on a 6300 Automatic Isoperibol Calorimeter system (Parr Instruments). The dietary content of fructans and sugars (glucose, fructose and sucrose) was determined as described previously( Reference Larsson and Bengtsson 30 ). Starch and NSP were determined essentially as described by Bach Knudsen( Reference Bach Knudsen 31 ), and Klason lignin was determined as the sulphuric acid-insoluble residue as described by Theander & Åman( Reference Theander and Åman 32 ). The RS content in the diets was analysed enzymatically using the Megazyme assay (Megazyme International Limited). The AX fraction was calculated as the sum of the arabinose and xylose fractions from the NSP analysis. AX oligosaccharides were determined from AX obtained by direct hydrolysis of the NSP fraction without starch removal and alcohol precipitation, and subtracting the values for AX after alcohol precipitation. Dietary and faecal contents of Cr2O3 were determined using the method described by Schürch et al. ( Reference Schürch, Lloyd and Crampton 33 ), and faecal SCFA was determined by GC according to Jensen et al. ( Reference Jensen, Cox and Jensen 34 ).
Plasma insulin levels were determined by time-resolved fluoro-immunometric assay as described by Lovendahl & Purup( Reference Lovendahl and Purup 35 ). Glucose and NEFA were analysed using an autoanalyser (Advia 1650 Chemistry System; Siemens Medical Solution). Glucose was analysed by glucose hexokinase II and enzymatic colorimetric determination (Siemens Healthcare Diagnostics Clinical Methods for Advia 1650), and NEFA was determined using the NEFA C ACS-ACOD assay (Wako Chemicals GmbH).
Plasma SCFA was measured by GC as described by Brighenti( Reference Brighenti 36 ) with the modification that 2-ethyl butyrate (FLUKA no. 03190; Sigma-Aldrich) was used as an internal standard instead of isovalerate. The intestinal microflora does not produce 2-ethyl butyrate, and it is consequently not present in biological samples.
The incretin hormones GLP-1 and GIP were analysed by enzyme-linked immunoassays using Linco assay kits (GLP-1 intra-assay CV = 8·8 % and inter-assay CV = 7·8 %, GIP intra-assay CV = 11·7 % and inter-assay CV = 23·4 %; Linco Research, Millipore) according to the manufacturer's guidelines. Analysis of C-peptide performed with an enzyme-linked immunoassays using the Mercodia Porcine C-peptide kit (intra-assay CV = 5·1 % and inter-assay CV = 7·9 %; Mercodia AB).
Calculations
Daily faecal bulk was calculated relative to Cr2O3 content and feed intake as described previously( Reference Bach Knudsen, Jensen and Hansen 37 ). The excretion of SCFA was calculated on the basis of faecal bulk multiplied by the concentration of SCFA in the faeces. Energy digestibility was calculated based on the chemical analyses of diet and faeces, as described previously( Reference Bach Knudsen, Jensen and Hansen 37 ). Metabolisable energy was estimated by multiplying gross energy content of the diets, calculated energy digestibilities and a factor of 0·96 (metabolisability), representing the loss of digested energy through the urine( Reference Just, Fernandez and Jorgensen 38 ). Daily intake of metabolisable energy was determined based on feed intake (kg DM/d).
The net absorption of glucose and SCFA into the portal vein and the apparent insulin production were calculated using portal–arterial differences and portal flow measurements using Fick's principle( Reference Rerat, Vaissade and Vaugelade 39 ). This was done using the following equation:
 $$ q = ( c _{p} - c _{a}) F (d t ), $$
where q denotes the amount of absorbed metabolites or secreted hormones within the time period dt. The concentration in the portal vein and the mesenteric artery is given by c p and c a, respectively, and F is the plasma flow in the portal vein. It should be noted that portal blood flow used for the calculations is based on blood flow measurements from the first sampling day due to technical problems with the flow probe. Insulin production calculated in the present study using Fick's principle is the apparent insulin production, since insulin is secreted in a pulsatile manner, with a variable half-life of approximately 10–30 min caused by liver and kidney degradation of the protein, as well as binding of the protein to receptors followed by subsequent removal from the bloodstream.
Hepatic extraction (HE) from 0–5 h after the first daily meal was determined as:
 $$HE = ( - )\frac {(1\cdot 00\times c _{h}) - (0.86\times c _{p} + 0\cdot 14\times c _{a})}{0\cdot 86\times c _{p} + 0\cdot 14\times c _{a}}\times 100, $$
where c a and c p are defined as in equation 1, where the concentration in the mesenteric artery equals the concentration in the hepatic artery. The hepatic concentration is designated as c h. The relative contributions of portal (0·86) and hepatic (0·14) arterial plasma flow to hepatic plasma flow were estimated from Kristensen et al. ( Reference Kristensen, Norgaard and Wamberg 40 ).
Statistical analyses
The effects of the different experimental diets on the observed variables were analysed using normal mixed models for repeated measurements (MIXED procedure; SAS Institute, Inc.) using the following model:
 $$Y _{ ijkl } = \mu + \alpha _{ i } + \beta _{ j } + \alpha \beta _{ ij } + \gamma _{ k } + \upsilon _{ l } + \tau _{ ikl } + \varepsilon _{ ijkl }, $$
where Y ijkl is the plasma variable, μ is the overall mean, α i is the effect of the diet (i= WSD, AXD and RSD), β j is the time after feeding (j= − 15, 15, 30, 45, 60, 90, 120, 180, 240, 300), αβ ij is the interaction between diet and time, γ k is the effect of week (k= 1, 2, 3), υ l is the random component related to the pig (l= 1, 2,…, 6), τ ikl is the random component related to the lth pig fed the ith diet in the kth week. Thus, pig and pig × diet × week were included as random components to account for repeated measurements (within pigs and within pigs within sampling days). The covariance structure of τ ikl was modelled using the spatial power option to take into account the different intervals between repeated measurements, and the residual error component is defined as ɛ ijkl . The random effects and residuals are assumed to be normally distributed and independent, and their expectations were assumed to be zero. Feed and energy intake was calculated using the same statistical model, without β j (time after feeding) and the diet × time interaction. Levels of significance were reported as being significant when P≤ 0·05 and as a tendency when 0·05 < P≤ 0·10. Data on hormone concentrations were logarithm-transformed before the statistical analyses to obtain variance homogeneity.
Results
Dietary composition
The experimental diets were formulated to provide equal amounts of energy from fat, protein and carbohydrates, but having different contents and sources of DF. The WSD served as a control diet with a total DF content of 70 g/kg DM (Table 2). The amount of DF in the RSD and AXD was 2·7 times higher than that in the WSD, with a total DF content of 192 and 189 g/kg DM, respectively. The RSD was characterised by a high RS content (113 g/kg DM) originating from raw potato starch and HiMaize®, whereas the use of rye flakes and enzyme-treated wheat bran resulted in a high AX content in the AXD (72 g/kg DM). Overall, fat (135–152 g/kg DM) and gross energy (19·3–20·3 MJ/kg DM) were comparable among the three diets. The protein content was intended to be similar in the three diets, but because the protein content in white wheat flour used for the WSD and RSD was higher than the data we had in our database, these two diets had a higher protein content than intended (207 and 191 g/kg DM, respectively) and higher than the AXD (154 g/kg DM; Table 2). The concentration of digestible carbohydrates varied from 535 g/kg DM in the WSD to 473 g/kg DM and 442 g/kg DM in the RSD and AXD, respectively.
Feed intake and fibre fermentation
The animals found the feed palatable, and feed was consumed within 30 min of feeding. The daily intake of metabolisable energy on non-sampling days was the same (23·2–24·2 MJ metabolisable energy/d, P= 0·39; Table 2), but differed intentionally on sampling days (20·3–22·3 MJ metabolisable energy/d, P< 0·001), where dietary supply of available carbohydrates was kept constant (197–199 g/meal, P= 0·19).
The daily excretion of SCFA and faecal bulk increased with increased amounts of DF. The faecal excretion of total SCFA and branched-chain fatty acids (BCFA), acetate, propionate and butyrate was highest in AXD-fed pigs, intermediate in RSD-fed pigs and lowest in WSD-fed pigs (P< 0·05; Fig. 1). The pigs fed the RSD and AXD had a daily faecal bulk of 300 and 532 g wet faeces/d, respectively, compared with 163 g in those fed the WSD (P< 0·001).
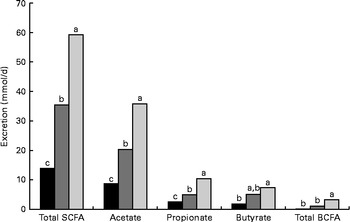
Fig. 1 Daily faecal SCFA excretion (mmol/d) in pigs fed the Western-style control diet ■, the resistant starch-rich diet ![]() or the arabinoxylan-rich diet
or the arabinoxylan-rich diet ![]() . Values are means (n 6). a,b,cMean values with unlike letters were significantly different (P≤ 0·05). BCFA, branched-chain fatty acids.
. Values are means (n 6). a,b,cMean values with unlike letters were significantly different (P≤ 0·05). BCFA, branched-chain fatty acids.
Postprandial concentrations of hormones and metabolites at different sampling sites
In general, all metabolite concentrations studied were lowest in the mesenteric artery, highest in the portal vein and intermediate in the hepatic vein, except for insulin and total and individual BCFA in AXD-fed pigs (Table 3). Insulin was highest in the portal vein, intermediate in the mesenteric artery and lowest in the hepatic vein in both RSD- and AXD-fed pigs. Except for arterial concentrations of valerate, portal concentrations of total and individual BCFA and hepatic butyrate, valerate and isobutyrate, all metabolites were affected by time in arterial, portal and hepatic plasma (P< 0·05).
Table 3 Plasma concentrations of metabolites from 0 to 5 h after the first daily meal* (Least-square (LS) means with their standard errors or 95 % confidence intervals)
WSD, Western-style diet; RSD, resistant starch-enriched diet; AXD, arabinoxylan-enriched diet; GLP-1, glucagon-like peptide 1; GIP, glucose-dependent insulinotropic peptide; BCFA, branched-chain fatty acids.
a,b,cMean values within a row with unlike superscript letters were significantly different (P≤ 0·05).
* Mean plasma concentrations are given for the mesenteric artery, the portal vein and the hepatic vein in pigs fed either the WSD, RSD or AXD.
† P>0·1.
‡ Since data were logarithmically transformed before data analysis, sem is not the correct measure of variance. Instead, 95 % CI are given.
The pigs consuming the RSD had the highest portal concentration of insulin (P= 0·04), whereas AXD-fed pigs had the lowest concentration and WSD-fed pigs had the intermediate concentration. In contrast, the diets did not affect the arterial and hepatic concentrations of plasma insulin (P>0·1). Insulin concentrations in the mesenteric artery as well as in the portal and hepatic veins increased in response to feeding, peaking 15–30 min after feeding (data not shown). In all the three sampling sites, the RSD and AXD lowered the immediate postprandial peak in insulin concentrations compared with the WSD (data not shown). A similar postprandial increase in C-peptide concentrations followed by a decline was observed for all the diets in the mesenteric artery and portal vein (data not shown). The higher DF tended to reduce and prolong arterial peak C-peptide concentrations compared with the WSD, indicated by the diet × time interaction (P= 0·05).
Fasting levels of plasma glucose were 5–6 mmol/l and concentrations increased postprandially, peaking between 15 and 90 min after feeding at approximately 11 mmol/l in the portal vein (data not shown). There was no dietary effect on arterial, portal or hepatic concentrations of glucose (P>0·1); however, a diet × time interaction was found for arterial and portal glucose concentrations (P< 0·01). This interaction revealed a higher initial increment and a faster subsequent decrease in glucose concentrations in WSD- and AXD-fed pigs compared with the response in RSD-fed pigs that showed more constant glucose concentrations (data not shown).
Arterial NEFA concentrations showed a significant diet × time interaction (P= 0·02), with lower fasting levels of arterial NEFA when pigs were fed the AXD (156 μequiv/l) compared with WSD- and RSD-fed pigs (295 and 312 μequiv/l, respectively; Fig. 2). Immediately after feeding, arterial NEFA concentrations in both WSD- and RSD-fed pigs dropped to similar levels as in AXD-fed pigs, before slowly increasing again.
Fig. 2 Arterial NEFA concentration (μeqiv/l): diet (D) P= 0·92, time (T) P< 0·001, D × T P= 0·02, in pigs fed the Western-style control diet (WSD, ![]() ), the resistant starch-rich diet (RSD,
), the resistant starch-rich diet (RSD, ![]() ) or the arabinoxylan-rich diet (AXD,
) or the arabinoxylan-rich diet (AXD, ![]() ). Samples were collected during the first 5 h after feeding. Values are means (n 6). * Mean value of AXD-feg pigs was significantly different from that of the WSD-fed pigs (P≤ 0·05). ‡ Mean value of AXD-fed pigs was significantly different from that of the RSD-fed pigs (P≤ 0·05).
). Samples were collected during the first 5 h after feeding. Values are means (n 6). * Mean value of AXD-feg pigs was significantly different from that of the WSD-fed pigs (P≤ 0·05). ‡ Mean value of AXD-fed pigs was significantly different from that of the RSD-fed pigs (P≤ 0·05).
Overall, feeding the pigs with the AXD resulted in the highest arterial and portal concentrations of acetate, propionate and butyrate, intermediate concentrations in RSD-fed pigs and lowest concentrations in WSD-fed pigs (P< 0·05). A similar pattern was observed in the hepatic vein for total SCFA, acetate, propionate and butyrate, although not statistically significant for propionate (P= 0·19). In addition, arterial acetate, as well as arterial and portal propionate and butyrate showed a significant diet × time interaction (P< 0·05), reflecting higher concentrations in RSD- and AXD-fed pigs compared with WSD-fed pigs throughout the sampling period (data not shown). Furthermore, portal concentrations of valerate (P= 0·03), caproate (P= 0·02) and isovalerate (P< 0·01), as well as arterial and portal isobutyrate (P< 0·05) were higher when pigs were fed the RSD or AXD compared with the WSD.
Effects of increased dietary fibres on net portal metabolite flux and hepatic extraction
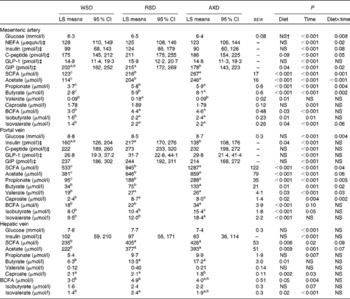
The portal blood flow increased in response to feeding (data not shown), but was not affected by the experimental diets (P= 0·27; Table 4). Overall, the NPF of energy metabolites and hormones increased in response to feeding, followed by a decrease (P< 0·05), except for the net flux of GIP and total and individual BCFA. The NPF of glucose increased immediately after feeding (Fig. 3(A)), peaked at approximately 450 mmol/h after 60–90 min in WSD- and AXD-fed pigs and decreased thereafter. Substituting wheat flour with potato and high-amylose maize starches decreased the NPF of glucose (203 mmol/h, P= 0·008) compared with the WSD and AXD (257 and 247 mmol/h, respectively). Furthermore, RSD-fed pigs showed a significant diet × time interaction (P< 0·01); RSD-fed pigs had a lower peak NPF of glucose (approximately 300 mmol/h) between 45 and 120 min after feeding. In addition, the NPF of glucose was lower within the first 90 min after feeding than in WSD- and AXD-fed pigs. Thereafter, NPF was comparable between the three diets, gradually decreasing towards the fasting levels. The NPF of total and individual SCFA and BCFA increased (P< 0·05) in response to the increased amounts of DF (Table 4). In general, the NPF of total and individual SCFA were highest in AXD-fed pigs, intermediate in RSD-fed pigs and lowest in WSD-fed pigs (Fig. 3(B) and Table 4). The increased NPF was higher for butyrate in response to the AXD (3·6 times higher) than to the WSD when compared with acetate (2·6 times higher) and propionate (3·1 times higher) (Fig. 3(C)). All SCFA were affected by the diet × time interaction (P< 0·05), showing a higher NPF throughout the sampling period in pigs fed the high DF compared with the WSD-fed pigs.
Table 4 Net portal flux of metabolites from 0 to 5 h after the first daily meal* (Least-square (LS) means with their standard errors or 95 % confidence intervals)

WSD, Western-style diet; RSD, resistant starch-enriched diet; AXD, arabinoxylan-enriched diet; GLP-1, glucagon-like peptide 1; GIP, glucose-dependent insulinotropic peptide; BCFA, branched-chain fatty acids.
a,b,cMean values within a row with unlike superscript letters were significantly different (P< 0·05).
* Mean plasma concentrations were determined in pigs fed either the WSD, RSD or AXD.
† Mean values for portal blood flow were determined based on initial blood flow measurements
‡ P>0·1.
§ Since data were logarithmically transformed before data analysis, sem is not the correct measure of variance. Instead, 95 % CI are given.
Fig. 3 Net portal flux (mmol/h) of (A) glucose (diet, P= 0·008; time (T), P< 0·001; diet × time, P< 0·001), (B) total SCFA (diet, P< 0·001; time, P= 0·009; diet × time, P= 0·006) and (C) butyrate (diet, P= 0·001; time, P= 0·02; diet × time, P= 0·04) in pigs fed the Western-style control diet (WSD, ![]() ), the resistant starch-rich diet (RSD,
), the resistant starch-rich diet (RSD, ![]() ) or the arabinoxylan-rich diet (AXD,
) or the arabinoxylan-rich diet (AXD, ![]() ). Samples were collected during the first 5 h after feeding. Values are means (n 6). * Mean value of AXD-feg pigs was significantly different from that of the WSD-fed pigs (P≤ 0·05). † Mean value of RSD-fed pigs was significantly different from that of the WSD-fed pigs (P≤ 0·05). ‡ Mean value of AXD-fed pigs was significantly different from that of the RSD-fed pigs (P≤ 0·05).
). Samples were collected during the first 5 h after feeding. Values are means (n 6). * Mean value of AXD-feg pigs was significantly different from that of the WSD-fed pigs (P≤ 0·05). † Mean value of RSD-fed pigs was significantly different from that of the WSD-fed pigs (P≤ 0·05). ‡ Mean value of AXD-fed pigs was significantly different from that of the RSD-fed pigs (P≤ 0·05).
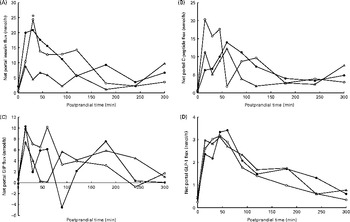
Fig. 4 Net portal flux (nmol/h) of (A) insulin (diet, P= 0·09; time, P= 0·04; diet × time, P= 0·87), (B) C-peptide (diet, P= 0·31; time, P <0·001; diet × time, P= 0·16) and (C) glucose-dependent insulinotropic peptide (GIP) (diet, P= 0·61; time, P =0·12; diet × time, P= 0·82) and (D) glucagon-like peptide 1 (GLP-1) (diet, P= 0·40; time, P <0·001; diet × time, P= 0·69) in pigs fed the Western-style control diet (WSD, ![]() ), the resistant starch-rich diet (RSD,
), the resistant starch-rich diet (RSD, ![]() ) or the arabinoxylan-rich diet (AXD,
) or the arabinoxylan-rich diet (AXD, ![]() ). Samples were collected during the first 5 h after feeding. Values are means (n 6). * Mean value of AXD-fed pigs was significantly different from that of the WSD-fed pigs (P≤ 0·05).
). Samples were collected during the first 5 h after feeding. Values are means (n 6). * Mean value of AXD-fed pigs was significantly different from that of the WSD-fed pigs (P≤ 0·05).
The NPF of insulin increased in response to feeding (P= 0·04) independent of dietary treatment (Fig. 4(A)). The AXD tended to reduce the NPF of insulin (P= 0·09), resulting in a peak NPF of insulin 15–30 min postprandially at 24, 21 and 9 nmol/h in WSD-, RSD- and AXD-fed pigs, respectively. The NPF of C-peptide was numerically lower in pigs fed the RSD (6·6 nmol/h; Table 4) and AXD (5·5 nmol/h) compared with WSD-fed pigs (7·9 nmol/h), although not statistically significant for diet (P= 0·31). Furthermore, the higher DF level appeared to postpone the peak in the NPF of C-peptide (Fig. 4(B)), peaking after 15 min in WSD-fed pigs and after 60 min in RSD- and AXD-fed pigs, although it did not reach statistical significance (P= 0·16). There was no effect of dietary treatment on the NPF of GIP or GLP-1 (P>0·1). There was no effect of time on the NPF of GIP (P= 0·12; Fig. 4(C)), whereas the NPF of GLP-1 increased in response to feeding (P< 0·01), peaked at approximately 3·1–3·3 nmol/h 60 min after feeding and followed by a decrease (Fig. 4(D)).
The NPF of glucose (Fig. 5(A)) and insulin (Fig. 5(B)) plotted on a logarithm scale against time after feeding showed a linear response in the interval of 60–240 min after feeding, as predicted by a first-order kinetic pool model where the slopes represent the rate of NPF. The slopes for the NPF of glucose were higher in WSD- and AXD-fed pigs ( − 19·5 and − 20·3 %/h, respectively) compared with − 5·1 %/h in RSD-fed pigs (P= 0·004). This was accompanied by an effect of time (P< 0·01) and a diet × time interaction (P< 0·01). The logarithm of the NPF of insulin plotted against time was − 4·5, − 4·8 and − 4·9 %/h in WSD-, RSD- and AXD-fed pigs, respectively, displaying a near-linear response, with no effect of dietary treatment (P= 0·83).
Fig. 5 Net portal flux (log scale) 60–240 min after feeding of (A) glucose (diet, P= 0·004; time, P< 0·001; diet × time, P< 0·001) and (B) insulin (diet, P= 0·83; time, P= 0·004; diet × time, P= 0·99) in pigs fed a Western-style control diet (WSD, ![]() ), a resistant starch-rich diet (RSD,
), a resistant starch-rich diet (RSD, ![]() ) or an arabinoxylan-rich diet (AXD,
) or an arabinoxylan-rich diet (AXD, ![]() ). Values are means (n 6).
). Values are means (n 6).
Discussion
Altered insulin economy
In the present study, DF in the form of AX and RS affected postprandial metabolite and hormone responses differently, despite the pigs being fed equal amounts of available carbohydrates. Consumption of the AX-rich diet increased SCFA absorption and, in particular, butyrate absorption and reduced insulin secretion. However, the action of insulin was not compromised as indicated by low fasting NEFA levels, and these findings suggest that the stimulated effect of AX on SCFA absorption and, in particular, butyrate improved insulin economy when compared with the other diets. The beneficial metabolic effects of higher DF intake are related to two distinct, yet related properties of DF; their ability to delay starch degradation in the small intestine as indicated by the delayed glucose absorption to the portal blood. The other beneficial effect is related to fermentation of mainly insoluble DF in the colon, generating SCFA with proposed direct effects on insulin secretion( Reference Robertson 12 , Reference Priebe, Wang and Weening 13 ). In the present study, insulin secretion was markedly reduced after consumption of the AXD and was associated with the highest absorption of total SCFA and butyrate. The observed insulin and glucose responses after AX feeding are in line with previous studies with whole-grain rye or rye ingredients in pigs( Reference Theil, Jorgensen and Serena 14 ) and healthy human subjects( Reference Juntunen, Niskanen and Liukkonen 41 , Reference Rosen, Ostman and Shewry 42 ). Previous studies have linked increased systemic SCFA concentrations to improvements in glycaemic control( Reference Liljeberg, Akerberg and Bjorck 43 , Reference Nilsson, Ostman and Hoist 44 ), and high butyrate absorption in particular has been associated with improved peripheral insulin sensitivity( Reference Robertson, Currie and Morgan 8 , Reference Priebe, Wang and Weening 13 , Reference Bach Knudsen, Serena and Kjaer 19 , Reference Nilsson, Ostman and Knudsen 45 ). Currently, the mechanisms underlying this improved insulin sensitivity remain unclear, but studies have suggested that adipose tissues and circulating NEFA are implicated( Reference Robertson, Bickerton and Dennis 21 , Reference Brighenti, Benini and Del Rio 23 , Reference Ferchaud-Roucher, Pouteau and Piloquet 24 ). Indeed, in the present study, lower systemic fasting NEFA concentrations were observed together with increased SCFA in response to feeding the AX-rich diet. This could indicate that prolonged absorption of SCFA energy from the gastrointestinal tract and consequently less diurnal variation in energy absorbed from the gastrointestinal tract may be responsible for the lowered insulin response. Increased SCFA absorption will in turn abolish the need for fat mobilisation, and reduce lipolysis in adipose tissues( Reference Bortz, Haff and Holmes 46 ). A recent study by Gao et al. ( Reference Gao, Yin and Zhang 47 ) showed that dietary butyrate supplementation could be used to treat and prevent obesity and insulin resistance in mice fed a high-fat diet. The authors have proposed that the beneficial effects of butyrate on insulin sensitivity were related to the reduced fat deposition and lower levels of blood lipids, thereby linking butyrate to improved insulin sensitivity through the mechanisms involving adipose tissues. Furthermore, other studies in rats have indicated a role of butyrate as a regulator of satiety signalling, by stimulating the expression of proglucagon (a GLP-1 precursor) in specific areas of the gut( Reference Zhou, Martin and Tulley 48 ). However, the results observed in the present study revealed no dietary effect on GIP or GLP-1 secretion, despite similar fasting concentrations or slightly higher postprandial concentrations than reported previously( Reference Hooda, Matte and Vasanthan 25 , Reference Regmi, van Kempen and Matte 26 ). Therefore, the present observation does not support previous studies showing a stimulatory effect of butyrate on incretin at the secretory level. Currently, it remains unclear whether dietary fibre has an effect on incretin response( Reference Karhunen, Juvonen and Huotari 49 ).
The attenuated insulin secretion in pigs consuming the AXD was further supported by the reduced C-peptide secretion in the present study. Insulin and C-peptide are co-secreted as preproinsulin; however, insulin has a much shorter half-life than C-peptide( Reference Polonsky and Rubenstein 50 ), thereby making C-peptide a more reliable marker for insulin secretion. The lower insulin and C-peptide secretion in AXD-fed pigs indicates that less insulin was required to clear glucose from the bloodstream after ingestion of a meal high in DF content compared with a low-DF diet. High insulin sensitivity in pigs fed the AXD may explain the observed patterns. Taken together, these findings support previous findings and indicate that especially AX-rich food has the potential to improve postprandial glycaemic responses in pigs and possibly in humans.
In the present study, RS supplementation did not result in an attenuated insulin response. Instead, insulin peaked at nearly the same level as pigs fed the control diet, accompanied by a delayed and prolonged net portal C-peptide flux. However, most previous studies have shown decreased insulin secretion after consumption of RS, and the insulin response in the present study was therefore unexpected and currently unexplainable.
Carbohydrate metabolism and fermentation
In the present study, consumption of RS in the RSD altered the postprandial glucose absorption profile, compared with the WSD and AXD, by reducing and prolonging glucose absorption. The slow rate of glucose absorption in the portal vein of RSD-fed pigs was supported by the kinetic analysis. Overall, the glucose absorption level was similar to that reported in previous studies in portal-catheterised pigs fed RS( Reference van der Meulen, Bakker and Smits 51 ) and rye products( Reference Theil, Jorgensen and Serena 14 , Reference Bach Knudsen, Serena and Kjaer 19 ). The prolonged glucose absorption profile is most probably a consequence of structural properties of high-amylose maize and raw potato starch used in the RSD. The high amylose content of HighMaize constituting the bulk of the RSD slows digestion due to compact structures formed by amylose. Amylose polymers form structures with small surface areas and more intramolecular bonds, making amylose inaccessible for α-amylases( Reference Englyst and Cummings 52 , Reference Batlle, Carbonell and Sendra 53 ), thus delaying starch degradation. Furthermore, tuber starches are generally more resistant to hydrolysis than cereal starches due to their higher granular surface and their large and smooth surface that inhibits enzymatic degradation( Reference Lehmann and Robin 54 ). On the contrary, cereal starches, such as rye flakes and wheat bran used in the AXD, have an open and accessible structure, facilitating easier access for α-amylases to the starch molecules( Reference Englyst, Kingman and Cummings 10 , Reference Regmi, van Kempen and Matte 26 ). The open structure may explain the differences observed in glucose absorption in the present study between the AXD and RSD despite the similar DF content.
The higher level of DF in the RSD and AXD increased colonic fermentation significantly, but to a different extent compared with the WSD. The consequence of this difference was higher SCFA absorption in pigs consuming the AX-rich diet than those fed the RS-rich diet, suggesting that in the present study, the AXD was a more effective stimulator of colonic fermentation than the RSD. The high butyrate production with the AXD is most probably caused by the high dietary content of AX and fructans( Reference Le Gall, Serena and Jorgensen 55 ). The intermediate levels observed in response to RSD feeding was, however, unexpected, since previous in vitro studies( Reference Kaur, Rose and Rumpagaporn 56 ) and in vivo studies on pigs( Reference Weaver, Krause and Miller 57 , Reference Marsono, Illman and Clarke 58 ) and human subjects( Reference Jenkins, Vuksan and Kendall 59 , Reference Noakes, Clifton and Nestel 60 ) have indicated that RS is a more butyrogenic substrate than other NSP. However, the increased faecal bulk and SCFA excretion in AXD-fed pigs compared with those consuming the RSD corroborate the observation that in the present study, the AXD was more fermentable and more butyrogenic than the RSD.
Hepatic metabolism of nutrients
The hepatic extraction of metabolites and hormones was largely unaffected by the dietary intervention, with a large variation between a specific metabolite and hormone in question. The constant hepatic extraction irrespective of dietary treatment indicates that the rate of hepatic metabolism is determined by the abundance of nutrients entering the liver, i.e. these processes may be regarded as mass action driven. Hepatic metabolism reduces the concentrations to intermediate levels, and lowest levels are reached in the mesenteric artery after the peripheral circulation. Increased hepatic clearance of insulin has previously been reported in response to RS intake and increased levels of SCFA( Reference Robertson, Currie and Morgan 8 ), and, interestingly, hepatic extraction of insulin was almost doubled in pigs fed the high-DF diet in the present study. High hepatic extraction and low peripheral insulin sensitivity in pigs fed the RS diet probably explain the observed patterns. Although these results were not statistically significant, these findings deserve further investigations.
Conclusion
In conclusion, an AX-rich diet attenuated the secretion of insulin, while the insulin response in RSD-fed pigs did not differ from the WSD. The beneficial effect of AX may be due to attenuated butyrate or SCFA absorption, which caused low systemic fasting levels of NEFA and improved insulin economy. The RSD did not raise SCFA and butyrate to the same level as when feeding the AXD; it had no effect on the fasting level of NEFA and no effect on insulin despite attenuated glucose absorption. The inconsistency between the observed glucose and insulin responses emphasises the complex relationships between the type of food ingested and the biological response in an in vivo pig model.
Acknowledgements
The authors thank Winnie Østergaard Thomsen, Lisbeth Märcher, Kasper Bøgild Poulsen, Lars Bilde Gildbjerg, Karin Johansen, Mette Lykkegaard Pedersen, Peter Scharbau Sørensen and Carsten Berthelsen for their excellent technical assistance. Lantmännen Cerealia A/S is acknowledged for providing the rye flakes, KMC Amba for providing the raw potato starch and DuPont Industrial Biosciences, Danisco A/S for supplying the enzyme-treated wheat bran.
The present study was financially supported by the Danish Strategic Research Council, project ‘Concepts for enhanced butyrate production to improve colonic health and insulin sensitivity – ButCoIns’ (project no. 10-093526), and the Nordic Centre of Excellence ‘System biology in dietary intervention and cohort studies – SYSDIET’ (project no. 070014). The Danish Strategic Research Council had no role in the design, analysis or writing of this article.
The authors' contributions are as follows: K. E. B. K., H. N. L., M. S. H. and P. K. T. were responsible for project development; A. K. I., M. S. H. and H. N. L. conducted the nutritional animal experiments; A. K. I. was responsible for the incretin analyses and for performing the statistical analyses, and drafted the first manuscript. All authors contributed, commented and approved the final content.
There are no conflicts of interest.


