


The burden of hypertension in addition to its prevalence is increasing globally, particularly in low- and middle-income countries(Reference Mills, Stefanescu and He1). According to the Non-communicable Diseases Risk Factor Collaboration, the prevalence of hypertension in the Middle East and North Africa was higher than the rest of the world between 1975 and 2015 due to unfavourable trends in Na intake, obesity and low physical activity. Moreover, hypertension is an important leading cause for morbidity and mortality in this region(Reference Azizi, Hadaegh and Hosseinpanah2). A recent meta-analysis including 417 392 Iranian adults reported the overall prevalence of prehypertension and hypertension as 31·6 and 20·4 %, respectively(Reference Afsargharehbagh, Rezaie-Keikhaie and Rafiemanesh3). Studies also showed that about 6 and 3 % new cases of prehypertension and hypertension develop each year among Tehranian adults(Reference Hadaegh, Hasheminia and Abdi4,Reference Asgari, Moazzeni and Azizi5) .
Although a favourable trend was observed during recent years, the prevalence of lipid abnormalities among Iranian population is still high(Reference Farzadfar, Danaei and Namdaritabar6,Reference Baghbani-Oskouei, Tohidi and Asgari7) . A recent report from a national survey among 21 293 adults from thirty provinces of Iran showed that 80 % of subjects had at least one lipid abnormality and the most common one was low HDL-cholesterol levels. Furthermore, most of the population did not have the desirable levels of HDL-cholesterol, non-HDL-cholesterol and LDL-cholesterol(Reference Farzadfar, Danaei and Namdaritabar6).
The association between dyslipidaemia and vascular dysfunction was reported as early as 1997(Reference Selwyn, Kinlay and Libby8). High levels of total cholesterol (TC), TAG and low HDL-cholesterol may damage the endothelium and impair nitric oxide production, release and activity leading to structural changes in arteries following the atherosclerosis process(Reference Oparil, Zaman and Calhoun9). Clinically, the role of lipid abnormalities in hypertension models was addressed in an updated systematic review by Sun et al. Accordingly, different lipid measures including TC, TAG, HDL-cholesterol, TC/HDL-cholesterol, apoB and lipoprotein (a) were reported as independent predictors for hypertension development in cohorts conducted among the USA, Europe, China and the Middle East population(Reference Sun, Liu and Xiao10).
Previously, during about 6-year follow-up, using logistic regression analysis only among Tehranian women, we found significant association of TAG, TC/HDL-cholesterol and TAG/HDL-cholesterol with incident hypertension(Reference Tohidi, Hatami and Hadaegh11). In the present study, we extend our previous work by examining the associations between different lipid measures and related indices with incident hypertension, using survival analysis, among the whole population of the oldest cohort of Middle East and North Africa region named the Tehran Lipid and Glucose Study (TLGS) during more than 12-year follow-up.
Methods
Study design and population
The TLGS is a population-based ongoing cohort conducted on a representative sample of the Tehranian population for determining the prevalence and incidence of non-communicable diseases. Detailed explanations and design of the TLGS have been published elsewhere(Reference Azizi, Ghanbarian and Momenan12). Briefly, participants recruited in two phases, that is, the first (1999–2001, n 15 005) and the second (2002–2005, n 3555) phases and data collection has been continued at approximately 3-year intervals on the follow-up phases. From the second phase, lifestyle intervention only through community education was applied for nearly one-third of the participants.
Of the 18 555 participants who enrolled in the first (1999–2001) and second phases (2002–2005) of the TLGS, we excluded people aged < 20 years (n 5747) and those with prevalent hypertension (n 2660). Finally, after exclusion of those who had missing data including data of BMI (n 190), waist circumference (WC, n 33), systolic and diastolic blood pressures (SBP and DBP, respectively, n 311), TAG (n 247), TC (n 1), HDL-cholesterol (n 13), smoking (n 29), physical activity (n 445), family history of premature CVD (n 4), type 2 diabetes mellitus (T2DM, n 4) and those without follow-up after baseline recruitment (n 1536), 7335 participants were remained for data analysis; response rate ≈ 72·3 % (Fig. 1).
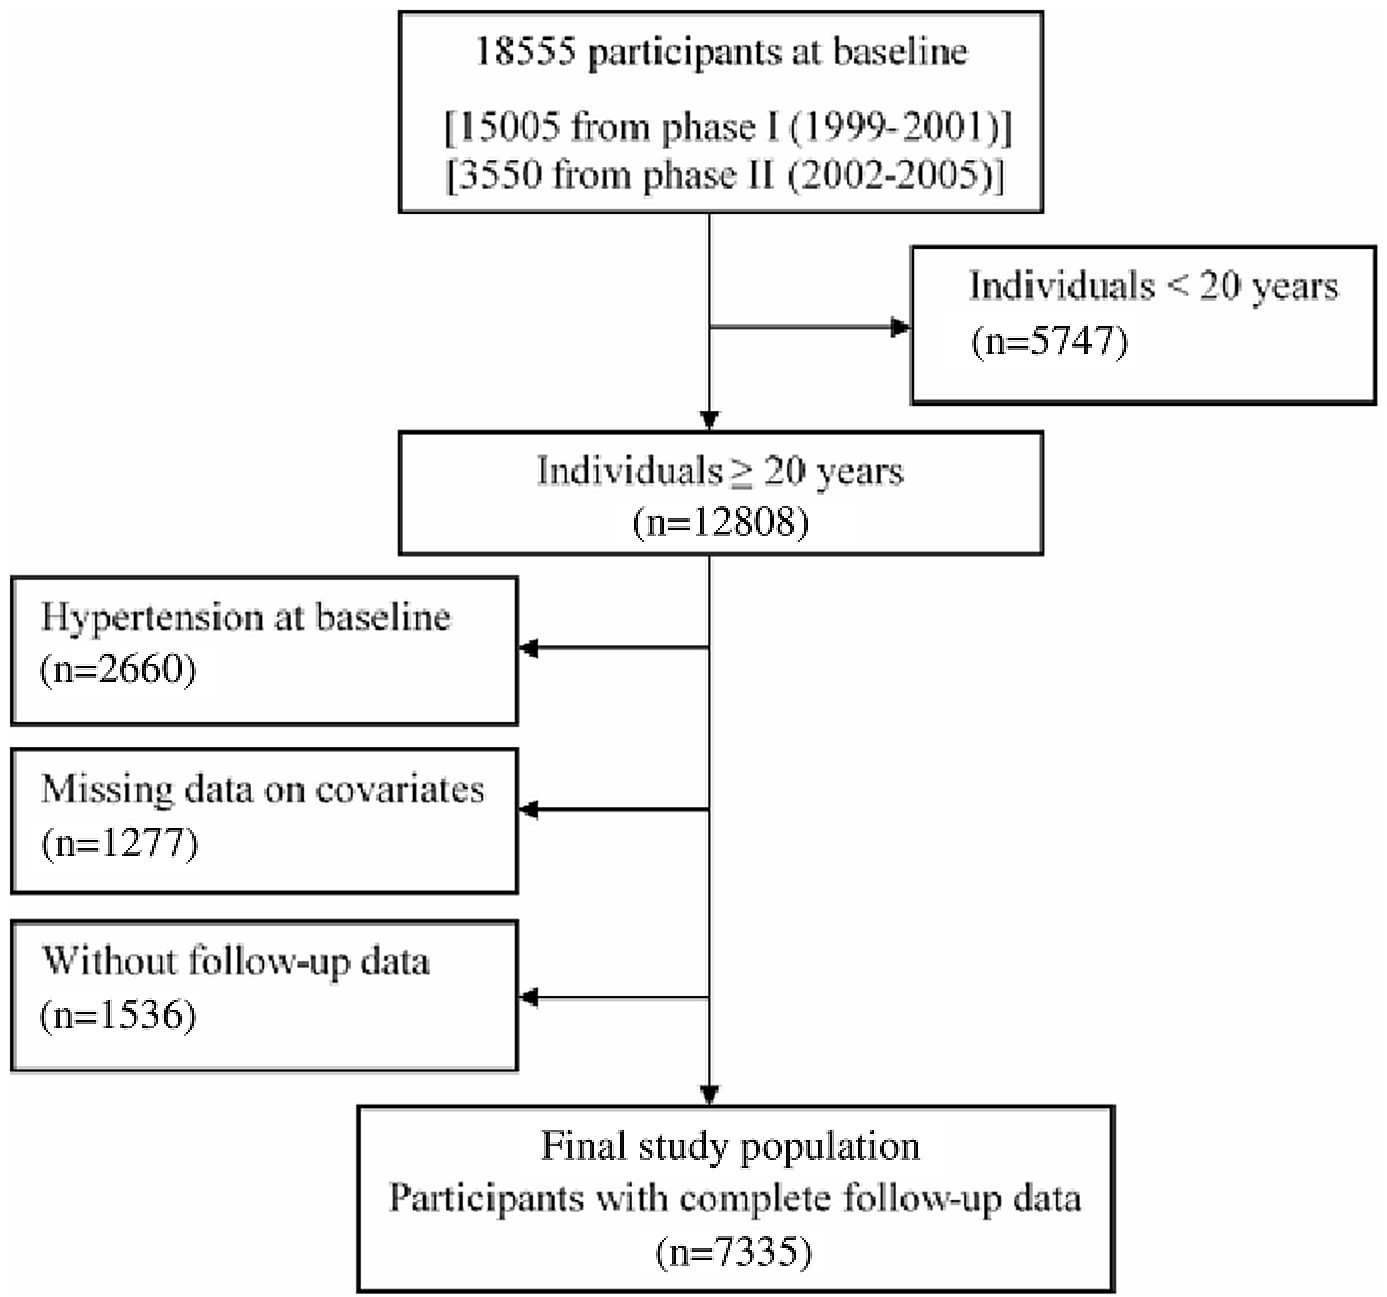
Fig. 1. Flowchart of the study population.
Dietary assessment
Since we did not have precise dietary assessment at the baseline, we used the dietary variables from phase III of TLGS (2005–2008). The regular dietary intakes of participants over the previous year were collected using a validated and reliable FFQ(Reference Asghari, Rezazadeh and Hosseini-Esfahani13–Reference Mirmiran, Esfahani and Mehrabi15).
We also considered the nutritional data of the participants from phases IV (2008–2011), V (2012–2015) and VI (2016–2018) for dietary exposures because long-term diet is more important than the baseline measures. Carried forward method was used to impute the missing dietary intake values during follow-up(Reference Hu, Stampfer and Rimm16). We used the alternative approach that providing more weight to the recent diet, with reducing within subject variation. This approach was applied according to the Hu et al. formula(Reference Hu, Stampfer and Rimm16).
Out of 7335 participants, 1752 had nutritional data at baseline and during follow-up. Of these, forty-seven participants were excluded because of daily energy intake < 2092 and 17573 kJ/d (< 500 and > 4200 kcal/d). The final analysis among participants with nutritional data was conducted on 1705 participants.
Informed written consent was obtained from all participants, and the research protocol of this study was approved by the ethics committee of the Research Institute for Endocrine Sciences, Shahid Beheshti University of Medical Sciences, Tehran, Iran.
Clinical, anthropometric and laboratory measurements
A pretested questionnaire for collecting demographic data, education¸ medications, smoking behaviour and family history of premature CVD was completed by a trained interviewer. Height in a standing position without shoes and with shoulders in normal alignment was measured using a tape metre. Weight was measured with minimally cloths and without shoes, using digital electronic weighing scale (Seca 707, Seca Corp; range 0·1–150 kg) and recorded to the nearest 0·1 kg. BMI was calculated as weight in kg divided by square of height in metres. WC was measured at the level of umbilicus.
To determine blood pressure (BP), two separate measurements were performed on the right arm in a sitting position after at least 15 min of rest using a standardised mercury sphygmomanometer (calibrated by Iranian Institute of Standards and Industrial Researches) and the mean of two measurements was considered as the individual’s BP.
After 12–14 h overnight fasting, a venous blood sample was collected from each participant between 07.00 and 09.00 hours and centrifuged within 30–45 min of collection. A standard oral glucose tolerance test was also performed for all non-diabetic subjects. Fasting plasma glucose was measured by an enzymatic colorimetric assay using the glucose oxidase method with both intra- and inter-assay coefficients of variation < 2·3 %. Serum TC, TAG, and HDL-cholesterol were measured using the enzymatic colorimetric methods using cholesteryl ester hydrolase and cholesterol oxidase for TC assay and lipoprotein lipase and glycerol phosphate oxidase for TAG assay. For measurement of HDL-cholesterol, precipitation of the apoB containing lipoproteins with phosphotungistic acid was firstly done. Both intra-assay and inter-assay coefficients of variation were below 2·1 and 3·0 %, respectively, for all lipid parameters. All biochemical measurements were performed at the TLGS research laboratory on the same day of blood collection using commercial kits (Pars Azmoon Inc) and a Selectra 2 chemistry auto-analyser (Vital Scientific). The quality of assays was monitored using assayed serum controls in two different concentrations (TruLab N and TruLab P; Pars Azmoon Inc.). Non-HDL-cholesterol was calculated by subtracting HDL-cholesterol from TC; TC/HDL-cholesterol and TAG/HDL-cholesterol were calculated by dividing TC and TAG to HDL-cholesterol, respectively. LDL-cholesterol was determined using the modified Friedewald formula to include those with TAG concentrations more than 4·52 mmol/l(Reference Chen, Zhang and Pan17).
In the first phase of the TLGS, physical activity level was assessed by the Lipid Research Clinic questionnaire, while considering the lack of precision of the Lipid Research Clinic(Reference Ainsworth, Jacobs and Leon18), the Modifiable Activity Questionnaire, which measured all three types of activity (leisure time, job and household activities) in the past year, was used in the second phase and the rest of the follow-up examinations(Reference Kriska, Knowler and LaPorte19).
Definitions
Family history of premature CVD was assessed by asking participants whether their female or male first-degree relatives, aged ≤ 65 or ≤ 55 years, respectively, had experienced CVD. Daily or occasionally cigarette smoking was considered as current smoking habit.
Low physically active subjects were defined as who have physical activity less than 3 d per week or do not attained a minimum of at least 600 metabolic equivalent task (MET)-minutes per week at first or second phase of TLGS, respectively.
T2DM was defined based on at least one of the following criteria: fasting plasma glucose ≥ 7 mmol/l, 2-h post-challenge glucose ≥ 11·1 mmol/l or using anti-diabetic drugs. Hypertension at baseline and during follow-up examinations was defined as SBP ≥ 140 mmHg, DBP ≥ 90 mmHg or using anti-hypertensive medications.
Statistical analyses
Continuous and categorical variables were reported as means and sd or median (interquartile range (IQR)) and frequencies (%) as appropriate. Comparison of the baseline characteristics of respondents (those with complete data at baseline who entered the study) and non-respondents (those with missing data at baseline or without follow-up after baseline recruitment) was done using the Student’s t test for normal distributed continuous variables, the χ 2 test for categorical variables and the Mann–Whitney U statistic for skewed and ordered variables. Continuous and categorical variables for respondents were compared according to quartiles of TC levels using one-way ANOVA and χ 2 test, respectively.
Cox proportional hazard regression was used to examine the association between quartiles of different lipid measures and related indices (the first quartile as reference) as well as a 1 sd increase in each lipid parameter with incident hypertension in 2 models as: model 1 adjusted for age and sex and model 2 further adjusted for BMI, WC, smoking, physical activity, family history of premature CVD, T2DM, being in educational intervention group, lipid-lowering medication and SBP, the potential confounding variables for hypertension development according to literature review(Reference Asgari, Moazzeni and Azizi5,Reference Sun, Liu and Xiao10) . Interactions between lipid measures and related indices with sex were examined using likelihood ratio test in multivariate analysis. Since we did not find any interaction (all P values > 0·05), the analysis was performed in the whole population.
To examine the role of baseline BP on the association between lipid measures and related indices with incident hypertension, we also stratified our baseline population according to being normotensive (i.e. SBP < 120 mmHg and DBP < 80 mmHg) or prehypertensive (i.e. 120 < SBP < 140 mmHg and 80 < DBP < 90 mmHg) as defined by Joint National Committee 7(Reference Chobanian, Bakris and Black20). Accordingly, we examined the interaction between being in normotensive and prehypertensive groups with lipid measures using likelihood ratio test, in multivariate analysis. We ran two sensitivity analyses. Firstly, all of the mentioned analyses were repeated after exclusion of subjects with T2DM at baseline (n 379) and those who are on lipid-lowering medication (n 99). Secondly, among participants with dietary variables, we ran another Cox proportional hazard analysis adjusting for main dietary variables for hypertension (energy intake, carbohydrate (% of energy), dietary fat (% of energy), dietary fibre, cholesterol, Na and K) to examine the association between lipid measures as categorical and continuous variable with incident hypertension. We performed statistical analyses using SPSS for windows version 20 and STATA version 14. A P-value < 0·05 was considered to indicate statistical significance.
Results
Basal characteristics of the study population
Overall, data of 7335 (men = 3270) individuals with a mean age of 39·0 (sd 13·2) years were included in the analyses. In comparison between respondent and non-respondent subjects, respondent ones are older and have more frequencies of being smoker and T2DM; they also have higher BMI, WC, SBP, and DBP and higher serum levels of TAG, LDL-cholesterol, non-HDLC, TC/HDL-cholesterol and TAG/HDL-cholesterol (Table 1).
Table 1. Comparison of baseline characteristics between the respondent v. non-respondent participants
(Number and percentages; mean values and standard deviations; median values and 95 % confidence intervals)
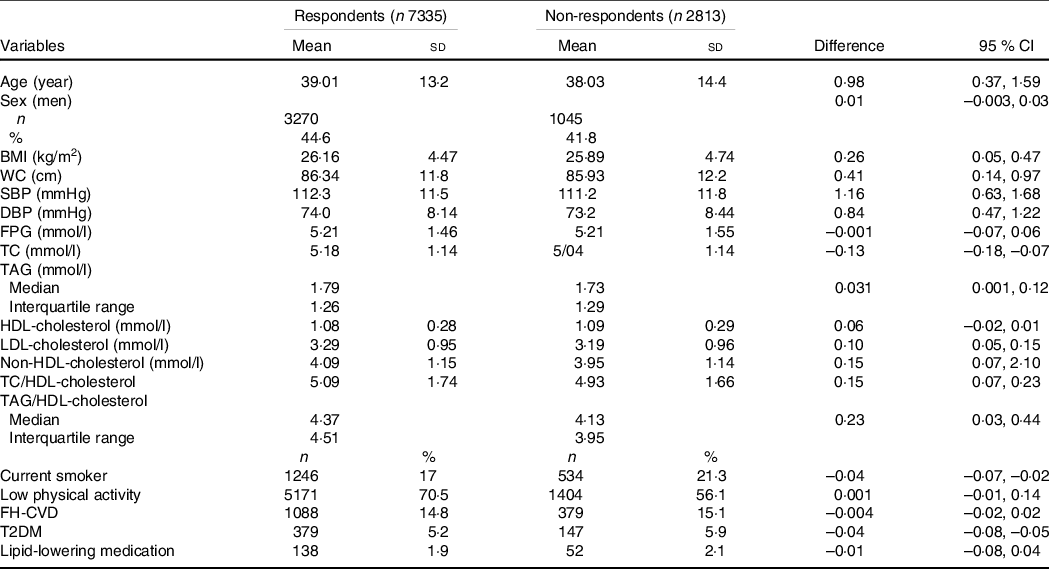
WC, waist circumference; SBP, systolic blood pressure; DBP, diastolic blood pressure; FPG, fasting plasma glucose; TC, total cholesterol; FH-CVD, family history of premature CVD; T2DM, type 2 diabetes mellitus.
Table 2 shows comparison of baseline characteristics of the study population by quartiles of TC. Generally, subjects in the fourth quartile of TC compared with lower quartiles were older, more generally and centrally obese, less physically active and more likely to have T2DM. They also have more family history of premature CVD and history of lipid-lowering medication. Furthermore, SBP, DBP, fasting plasma glucose and all lipid measures including TAG, HDL-cholesterol, LDL-cholesterol and non-HDL-cholesterol as well as TC/HDL-cholesterol and TAG/HDL-cholesterol were higher in the fourth quartile.
Table 2. Baseline characteristics of the study population by quartiles of total cholesterol
(Number and percentages; mean values and standard deviations; median values and 95 % confidence intervals)
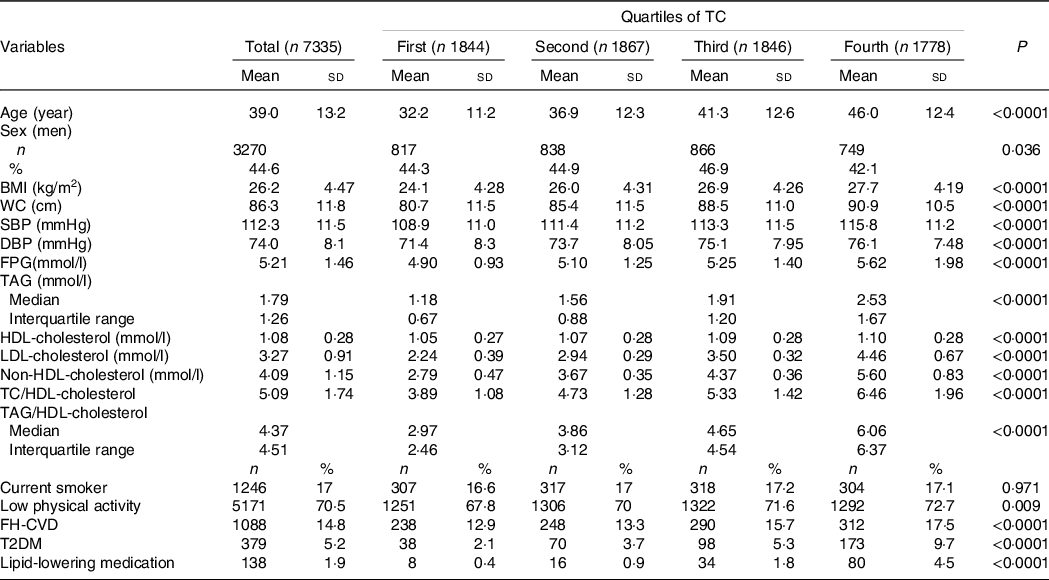
TC, total cholesterol; WC, waist circumference; SBP, systolic blood pressure; DBP, diastolic blood pressure; FPG, fasting plasma glucose; FH-CVD, family history of premature CVD; T2DM, type 2 diabetes mellitus.
Among a subpopulation with dietary data, intake of dietary variables by quartiles of TC is shown in online Supplementary Table S1. Compared with participants at the lowest quartile of TC, generally those at the highest quartile consumed less dietary fat, SFA, MUFA, fibre, K, fruit and vegetables and consumed more meat and cholesterol.
Incidence rate of hypertension
During a median follow-up of 12·89 years (IQR: 7·85–15·93) after the baseline examination, 2413 participants experienced hypertension, including 1126 men and 1287 women; corresponding incidence rates per 1000 person-years were 30·3 (95 % CI 28·6, 32·1) and 26·5 (95 % CI 25·1, 28·0), respectively.
Associations of different lipid measures with incident hypertension
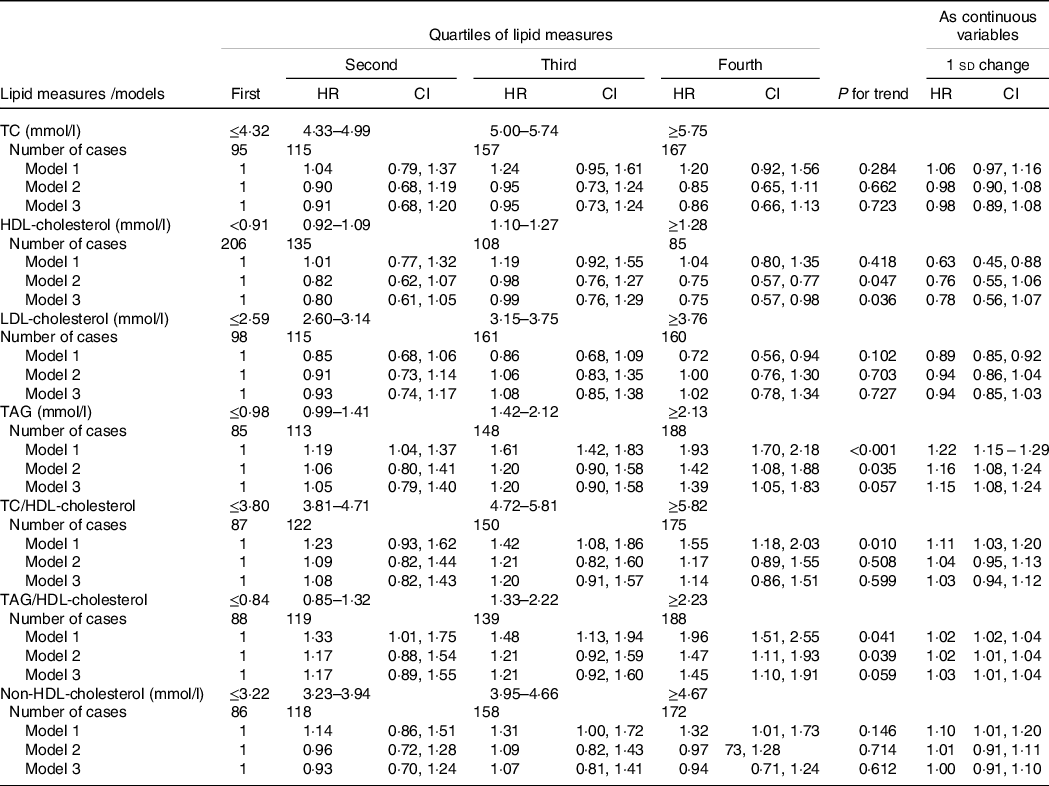
Results of Cox proportional hazard regression analysis investigating relation between different lipid measures as categorical or continuous variables with subsequent hypertension are presented in Table 3. Accordingly, across quartiles of TC, LDL-cholesterol and non-HDL-cholesterol, compared with the first quartile as reference, the third and fourth quartiles of the first two mentioned lipid measure and second, third and fourth quartiles of the last one were associated with higher risk for incident hypertension only in age- and sex-adjusted model (model 1). For TAG, TC/HDL-cholesterol and TAG/HDL-cholesterol while all quartiles are associated with significant risk of hypertension in model 1 (all P values < 0·0001), in model 2 only the third and fourth quartiles maintained their significant associations. Regarding HDL-cholesterol, subjects who are in the third and fourth quartiles of HDL-cholesterol have generally lower risk for the development of hypertension in multivariate-adjusted model. Moreover, we found significant trends in the association between quartiles of TAG, HDL-cholesterol, TC/HDL-cholesterol and TAG/HDL-cholesterol with incident hypertension (all P for trends ≤ 0·01) in multivariate analyses. Considering lipid measures as continuous variables, a 1 sd increase in TAG, TC/HDL-cholesterol and TAG/HDL-cholesterol increased the risk of incident hypertension in multivariate models; the corresponding hazard ratios and CI were 1·06 (95 % CI 1·02, 1·10), 1·04 (95 % CI 1·01, 1·09) and 1·04 (95 % CI 1·01, 1·09), respectively. Each 1 sd increase in HDL-cholesterol decreased the risk of incident hypertension by 6 % (hazard ratio: 0·94, 95 % CI 0·89, 0·98) in multivariate-adjusted model.
Table 3. Multivariate-adjusted HR (CI) of lipid measures for incident hypertension among the total population
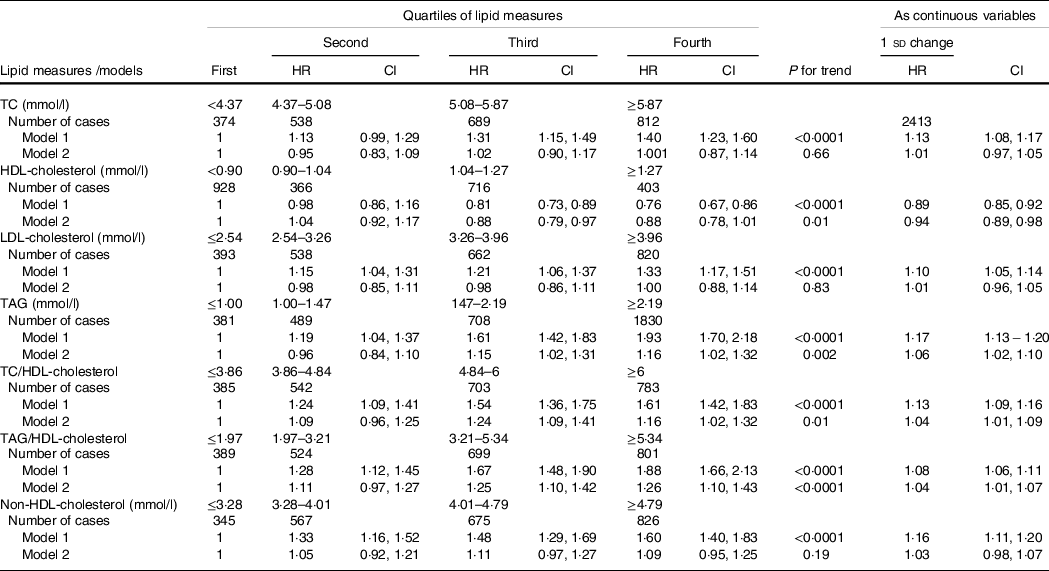
HR, hazard ratio; TC, total cholesterol.
* Lipid measures are considered as categorical and continuous variables.
† Model 1: adjusted for age and sex; model 2: multivariate adjusted for age, sex, BMI, waist circumference, smoking, physical activity, family history of premature CVD, type 2 diabetes mellitus, being in educational intervention group, lipid-lowering medication and systolic blood pressure.
The association between TAG, TAG/HDL-cholesterol and HDL-cholesterol, whether as continuous or categorical variables with incident hypertension, did not change even after adjustment for TC (data not shown).
Sensitivity analyses
In the present study to show the robustness of our results, we performed four sensitivity analyses. First, we examined the association between different lipid measures and incident hypertension according to the baseline status of BP (i.e. being in normotensive or prehypertensive groups). Accordingly, only among normotensive participants we found significant association between increasing trends of TAG, HDL-cholesterol and TAG/HDL-cholesterol with incident hypertension, although no significant interactions were found between baseline BP status and these lipid measures (Table 4).
Table 4. Multivariate-adjusted HR (CI) of lipid measures for incident hypertension stratified by baseline blood pressure status
(Hazard ratios and 95 % confidence intervals)*
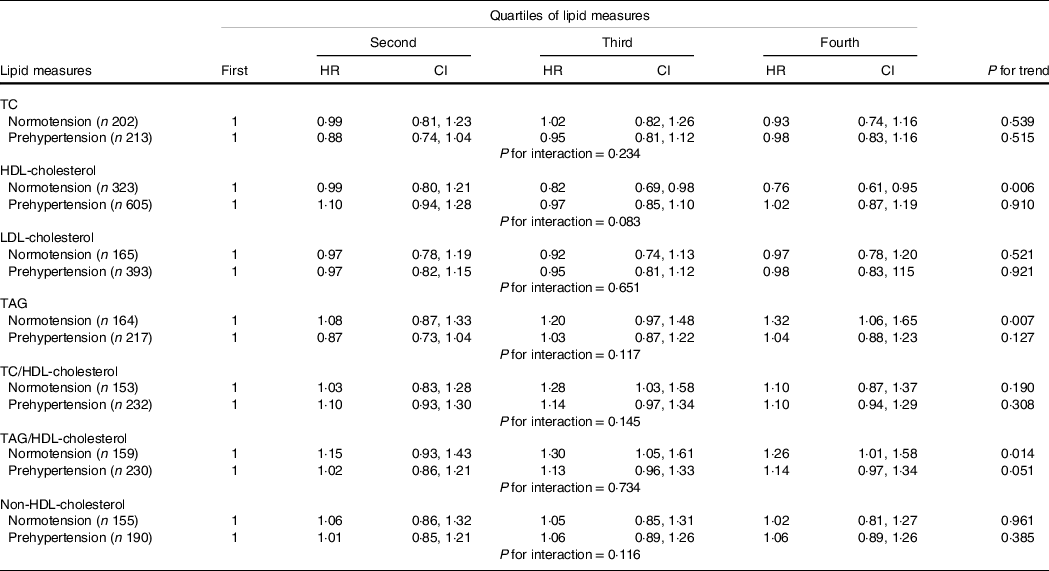
HR, hazard ratio; TC, total cholesterol.
* Multivariate model adjusted for age, sex, BMI, waist circumference, smoking, physical activity, family history of CVD, type 2 diabetes mellitus, being in intervention group, lipid-lowering medication and systolic blood pressure.
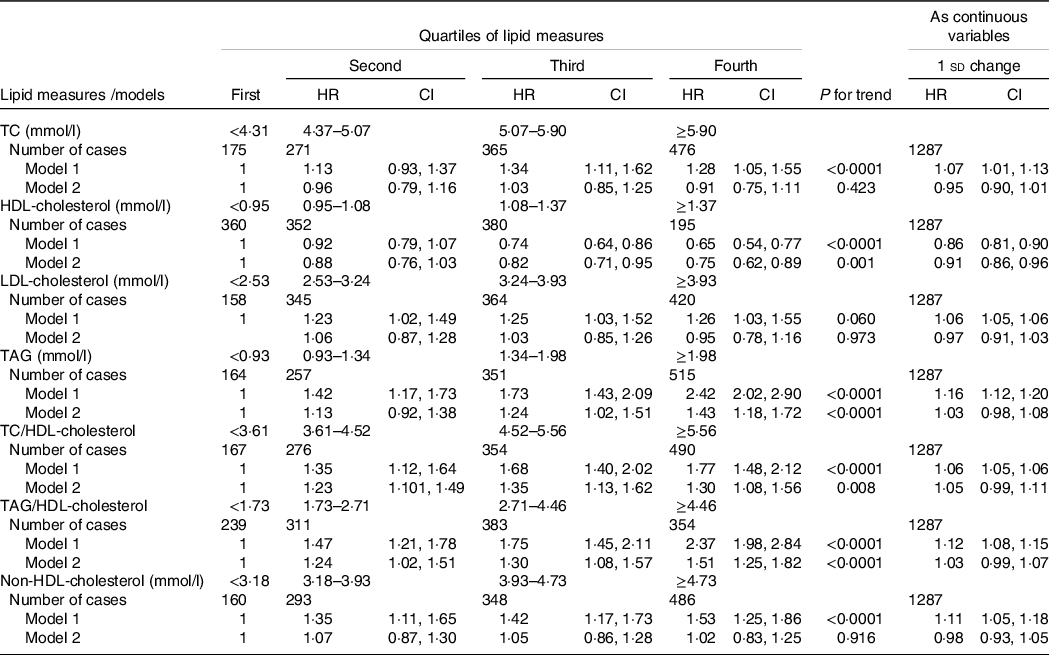
Second, by excluding patients who had T2DM at baseline (n 379) and those using lipid-lowering drugs (n 99) results remained essentially unchanged (Table 5).
Table 5. HR (CI) of lipid measures for incident hypertension among the population without T2DM and not on lipid-lowering medication
HR, hazard ratio; T2DM, type 2 diabetes mellitus; TC, total cholesterol.
* Lipid measures are considered as categorical and continuous variables.
† Model 1: adjusted for age and sex; model 2: multivariate adjusted for age, sex, BMI, waist circumference, smoking, physical activity, family history of premature CVD, intervention group and systolic blood pressure.
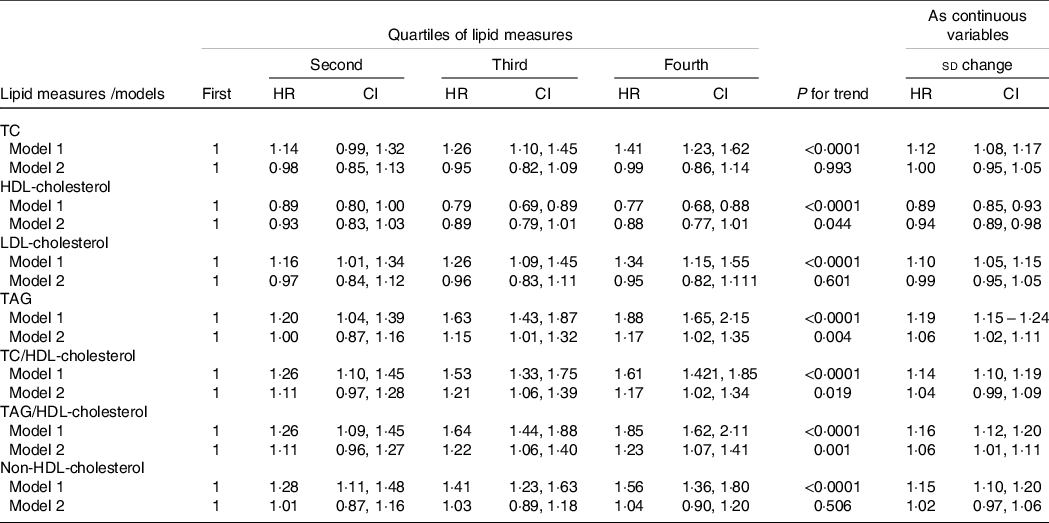
Third, despite the lack of interaction between sex and each lipid measure, we performed sex-stratified analysis in order to compare our findings with other studies. Accordingly, as shown in Table 6, similar to analysis that performed among the whole population, among women we found significant associations between trends of HDL-cholesterol, TAG, TAG/HDL-cholesterol and TC/HDL-cholesterol with incident hypertension in multivariate analysis. Among men participants, however, only a 1 sd increase in TAG or TAG/HDL-cholesterol was associated with 8 % significant risk for incident hypertension in multivariate analyses; however, we did not find significant trends for these lipid measures as categorical variables (Table 7).
Table 6. HR (CI) of lipid measures for incident hypertension among women
HR, hazard ratio; TC, total cholesterol.
* Lipid measures are considered as categorical and continuous variables.
† Model 1: adjusted for age; model 2: multivariate adjusted for age, BMI, waist circumference, smoking, physical activity, family history of premature CVD, type 2 diabetes mellitus, being in intervention group, lipid-lowering medication and systolic blood pressure.
Table 7. HR (CI) of lipid measures for incident hypertension among men
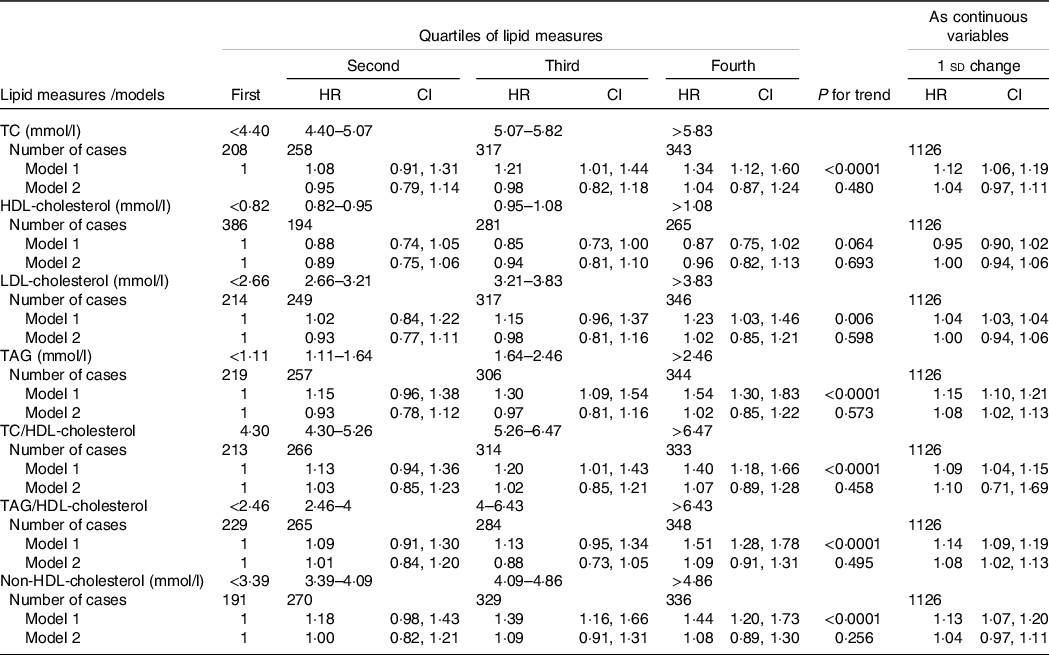
HR, hazard ratio; TC, total cholesterol.
* Lipid measures are considered as categorical and continuous variables.
† Model 1: adjusted for age; model 2: multivariate adjusted for age, BMI, waist circumference, smoking, physical activity, family history of premature CVD, type 2 diabetes mellitus, being in intervention group, lipid-lowering medication and systolic blood pressure.
Fourth, since nutritional status could potentially affect the levels of lipid measures, we prepared an additional analysis adjusting for specific nutrient including energy intake, carbohydrate (% of energy), dietary fat (% of energy), dietary fibre, cholesterol, Na and K. As shown in Table 8, participants in the highest v. lowest quartile of HDL-cholesterol, TAG and TAG/HDL had significant risk of hypertension after adjustment for dietary cofounding factors (model 3). Moreover, a 1 sd increase in TAG and TAG/HDL-cholesterol was significantly associated with the higher risk of incidence hypertension in the multivariate analysis (1·15 (95 % CI 1·08, 1·24) and 1·03 (95 % CI 1·01, 1·04), respectively) (model 3).
Table 8. Multivariate-adjusted HR (CI) of lipid measures for incident hypertension among participants with nutritional data
HR, hazard ratio; TC, total cholesterol.
* Lipid measures are considered as categorical and continuous variables.
† Model 1: adjusted for age and sex; model 2: multivariate adjusted for age, sex, BMI, waist circumference, smoking, physical activity, family history of premature CVD, type 2 diabetes mellitus, being in educational intervention group, lipid-lowering medication, and systolic blood pressure; model 3, further adjusted for energy intake, carbohydrate (% of energy), dietary fat (% of energy), dietary fibre, cholesterol, Na and K.
Discussion
During more than a decade follow-up, we demonstrated that higher levels of TAG, TAG/HDL-cholesterol and TC/HDL-cholesterol are independently associated with incident hypertension after adjustment for a large set of covariates including age, sex, BMI, WC, smoking, physical activity, family history of premature CVD, T2DM, being in educational intervention group, lipid-lowering medication and SBP, while higher level of HDL-cholesterol was associated with decreased risk. These associations were also noted independent of the baseline BP status (i.e. being in normotensive or hypertensive groups). Moreover, the same findings are also preserved among those not on lipid-lowering medications and free of T2DM at baseline. The significant associations between TAG, HDL-cholesterol and TAG-HDL-cholesterol and incident hypertension were also shown after adjustment for TC. The relationship between TAG and TAG/HDL-cholesterol and incident hypertension resisted to adjustment for dietary confounding factors.
Several cohort studies conducted in the USA, Europe, Asia and the Middle East and North Africa region supported the association between dyslipidaemia and hypertension. Among different lipid measures, TAG and HDL-cholesterol showed the most consistent associations with hypertension development in predicting models(Reference Sun, Liu and Xiao10). In agreement with our results, cohort studies from the San Antonio Heart Study(Reference Haffner, Miettinen and Gaskill21) in 1996 until the Vascular Metabolic Clinical Universidad Navarra (VMCUN) cohort(Reference Sánchez-Íñigo, Navarro-González and Pastrana-Delgado22) in 2016 and recently in 2020 TLGS, researchers found higher levels of TAG were associated with developing hypertension, independent of well-known risk factors including the baseline level of BP(Reference Asgari, Moazzeni and Azizi5).
Our results agree in part with studies showing higher baseline levels of HDL-cholesterol were independently associated with lower risk of incident hypertension, in a linear fashion(Reference Hwang, Fujimoto and Kahn23–Reference Laaksonen, Niskanen and Nyyssönen26). However, among Japanese working-age men, it was shown that both low and high levels of HDL-cholesterol were associated with risk of hypertension, that is, a U-shaped association(Reference Otsuka, Takada and Nishiyama27). Hence, as it was suggested by Hwang et al. the lower risk of HDL-cholesterol for incident hypertension was mainly attributable to HDL-cholesterol subclass and measuring HDL-cholesterol subclasses provided additional information compared with total HDL-cholesterol(Reference Hwang, Fujimoto and Kahn23).
Abbasi et al. showed that insulin action, as estimated by the insulin suppression test, is significantly related to the plasma TAG/HDL-cholesterol and that the magnitude of the relationship between this ratio and the estimate of insulin action assessed by euglycaemic–hyperinsulinaemic clamp was comparable to that between the clamp and homoeostasis model assessment of insulin resistance; hence, the authors suggested this lipid ratio as a surrogate for insulin resistance(Reference Abbasi and Reaven28). We previously found among Tehranian adults, TAG/HDL-cholesterol is a significant independent predictor for incident hypertension and CHD during short-term follow-up in women and men, respectively(Reference Tohidi, Hatami and Hadaegh11,Reference Hadaegh, Khalili and Ghasemi29) and it was also shown that this lipid ratio is a significant risk factor for T2DM(Reference Bozorgmanesh, Hadaegh and Ghaffari30). In the present study, a significant linear association between TAG/HDL-cholesterol with incident hypertension was shown. Actually, in terms of the risk as assessed by hazard ratio, it seems that the association between TAG/HDL-cholesterol and hypertension was stronger compared with TC/HDL-cholesterol, HDL-cholesterol and TAG levels alone (the corresponding hazard ratios for the fourth quartile compared with the reference were 26, 16, 0·88 and 16 %, respectively). Recently, in a Chinese cohort study, it was shown that a 1 unit increase in TAG/HDL-cholesterol was associated with 3 % increased risk of incident hypertension in multivariate analysis(Reference Liu, Guan and Zhao31). Likely, in a Spanish cohort during a mean follow-up of 8·5 years, it was shown only among men there was a significant association between top quintiles of TAG and TAG/HDL-cholesterol with incident hypertension; the values reached to 98 and 90 % for the last quintiles of these measures, respectively(Reference Sánchez-Íñigo, Navarro-González and Pastrana-Delgado22). Our study was performed among both sexes, and no significant interactions were found between sex and each of lipid parameter and their related ratios. Despite this, according to our data analysis (as shown in Tables 6 and 7) in both sexes among different lipid measures, only TAG and TAG/HDL-cholesterol generally showed more associations with incident hypertension.
The pathophysiological mechanism underlying the association between dyslipidaemia and hypertension was addressed in other studies. Briefly dyslipidaemia, particularly TAG-rich lipoproteins, impairs endothelial function and consequently disturbs nitric oxide production, leading to increasing in peripheral vascular resistance. Moreover, dyslipidaemia decreases arterial compliance by increasing arterial stiffness. On the other hand, HDL-cholesterol stimulates nitric oxide production and has a protective function through antioxidant activity(Reference Oparil, Zaman and Calhoun9,Reference Laaksonen, Niskanen and Nyyssönen26) . In the present study, the multivariate analyses were adjusted for important potential confounding factors including both general and central adiposity measures. However, other obesity-related residual confounders such as insulin level might be involved in the pathway between lipid disorders and incident hypertension(Reference Wang, Han and Hu32). Previously, we showed that higher fasting serum insulin concentrations and homoeostasis model assessment of insulin resistance were associated with incident hypertension among women, whereas these associations were not seen after controlling for obesity measures in men(Reference Arshi, Tohidi and Derakhshan33). Moreover, TAG-rich lipoproteins and LDL-cholesterol have been shown to be toxic for endothelial cells, although HDL-cholesterol might have a protective role(Reference O’Connell and Genest34). In the present study, the role of TC, LDL-cholesterol and non-HDL-cholesterol in hypertension development was not independent of other risk factors. However, we found a significant independent risk for TC/HDL-cholesterol, an issue that might be attributable to the HDL-cholesterol per se. Similar to our findings, in the men participants of the Physician Health Study the significant association between increasing trend of TC/HDL-cholesterol was stronger than that of TC and HDL-cholesterol alone(Reference Halperin, Sesso and Ma25). Actually, we also found strong associations between TAG, HDL-cholesterol and TAG/HDL-cholesterol, independent of TC level with incident hypertension, issues that were poorly addressed in other studies. Among Japanese-Americans in the presence of LDL-cholesterol, the protective role of total HDL-cholesterol was disappeared in the multivariate analysis(Reference Hwang, Fujimoto and Kahn23). In a Spanish cohort, it was shown among women the significant risk of the fifth quintile of TAG/HDL-cholesterol significantly decreased after further adjustment for levels LDL-cholesterol, SBP and DBP; however, the corresponding risk remained significant among men(Reference Sánchez-Íñigo, Navarro-González and Pastrana-Delgado22).
Strengths of this study include the relatively large sample size with long duration of follow-up and high quality of data acquired from the participants including values of all lipid parameters that were assayed in a single laboratory by a same method and quality control protocol. Importantly, BP as well as other confounders was accurately measured using standardised protocols rather than relying on self-reported data. Moreover, this study conducted among both sexes while main studies in this filed were performed in each sex separately(Reference Tohidi, Hatami and Hadaegh11,Reference Sesso, Buring and Chown24–Reference Otsuka, Takada and Nishiyama27) . Finally, extensive adjustment for potential confounding factors was done.
However, this study has some limitations. First, we did not measure serum apo, lipoprotein subclasses and TAG content of lipoproteins. Second, in the present study only single baseline lipid values were used to assess the associations between lipid measures and incident hypertension, that is, changes in serum lipid levels during follow-up time that might be affected by dietary changes or initiating lipid-lowering medication were not considered. Third, although several observational studies have indicated that higher alcohol consumption is considered as a risk factor for elevated BP(Reference Mills, Stefanescu and He1,Reference Fuchs, Chambless and Whelton35) , we did not have data on alcohol consumption in the TLGS cohort. Finally, this study was conducted in the metropolitan city of Tehran that precludes extrapolation of our results to the rural regions.
In conclusion, TAG, TAG/HDL-cholesterol and TC/HDL-cholesterol were independently associated with increased risk of incident hypertension, while higher level of HDL-cholesterol was associated with decreased risk during a long-term follow-up in the oldest cohort of the Middle East and North Africa region. These associations were generally stronger among women than men and were independent of the baseline BP and diabetes status. Importantly, the significant associations between higher levels of TAG and TAG/HDL-cholesterol with incident hypertension were found even after adjustment for dietary confounding factors. Hence, more attention should be given to detection and prevention of hypertension among population with these lipid abnormalities.
Acknowledgements
The authors wish to thank the study participants and the TLGS research team and laboratory staff for their passionate support. This manuscript is the result of the MD thesis of Dr Amirreza Hadaegh.
This study was initially supported in part by grant No. 121 from the National Research Council of the Islamic Republic of Iran and then by grant No.7–23283 from the Shahid Beheshti University of Medical Sciences.
A. H., M. T. and F. H. raised the presented idea and designed the study. S. A. conducted the statistical analyses. S. H.-N. analysed and interpreted nutritional data. F. H., M. T., A. H. and N. B. interpreted the results. A. H., S. A. and M. T. developed the first draft of the manuscript. F. H., M. T., N. B. and F. A. critically reviewed the manuscript. All authors have read and approved the final manuscript.
The authors declare that they have no competing interests.
Supplementary material
For supplementary material referred to in this article, please visit https://doi.org/10.1017/S0007114521004657


