


Se is an essential micronutrient for health. Se is incorporated as selenocysteine into selenoproteins, which are encoded by twenty-five separate genes containing an in-frame UGA codon. Selenoproteins are involved in neutralising reactive oxygen species and inflammation, both of which increase during ageing(Reference Fairweather-Tait, Bao and Broadley1,Reference Chrousos2) . Excessive levels of reactive oxygen species are detrimental, ultimately leading to cellular senescence that accumulates over time and can contribute to the ageing phenotype(Reference Chrousos2). A suboptimal Se status may contribute to disease risk and progression since Se status has been associated with inflammation(Reference Tseng, Ho and Hsu3) and disease(Reference Sun, Wang and Gong4) including metabolic dysfunction, CVD, cognitive decline, cancer and inflammatory bowel disease often following a U-shaped curve. Thus, there is an increasing interest in Se status with its ability to provide antioxidant properties through selenoproteins(Reference Robberecht, De Bruyne and Davioud-Charvet5). Therefore, focusing on dietary intakes and Se status of very old adults is important to help maintain and improve the ageing process. The richest dietary sources of Se are Brazil nuts, followed by protein-rich animal products, such as meat, offal and seafood, with lesser amounts in cereal products, fruits and vegetables(Reference Combs6) with important regional differences due to differences in soil Se(Reference Rayman7). Mean dietary Se intake in older adults (≥ 75 years) who participated in the UK NDNS survey (n 167) (2008/09 and 2009/10) was 40 µg/d (42 µg/d for males and 39 µg/d for females)(Reference Roberts, Steer and Maplethorpe8). These values are well below the UK reference nutrient intake (75 and 60 µg/d, respectively, for men and women)(9) and the US RDA (55 µg/d)(10). Furthermore, 30 % of males and 52 % of females (n 224) aged ≥ 65 years had intakes below the lower reference nutrient intake of 40 µg/d(9). To date, there is limited information on dietary intake of Se among very old adults. However, an earlier analysis using data from ≥ 85-year-olds (n 791) from the Northeast of England who participated in the Newcastle 85+ Study found that over 50 % had dietary Se intakes below the lower reference nutrient intake(Reference Perri, Mendonça and Jagger11).
Objective biomarkers of Se status have the potential to overcome some of the well-known limitations associated with dietary intake data. These biomarkers include the plasma selenoprotein extracellular glutathione peroxidase (GPx3), which plateaus at serum Se concentrations ranging from 70 to 100 µg/l(Reference Combs6,10,Reference Nève12) , and selenoprotein P (SELENOP), which plateaus at serum Se concentrations ranging from 90 to 125 µg/l(Reference Xia, Hill and Li13–Reference Hill, Xia and Akesson17). Due to their sensitivity to low to moderate Se status, these plasma/serum biomarkers may be suitable for assessing Se status in older populations with lower Se intakes due to their sensitivity to low to moderate Se status(Reference Bates, Thane and Prentice18).
Generally with age, there is a reduction in energetic intake due to various physiological changes including appetite hormones, gut physiology, transit time, decreased energetic input and medication side effects. Thus, there is a reduction in nutrient intake and status in the body(Reference ter Borg, Verlaan and Hemsworth19). However, few studies have explored Se status in very old adults (Appendix Table 1). One of the few studies looking at Se status over time, a 9-year longitudinal study in France, found that 65-year-olds who survived the duration of the follow-up (n 1288) had a higher baseline serum Se (1·10 µmol/l; 86·5 µg/l) compared with those who died (n 101) (1·01 µmol/l; 79·5 µg/l)(Reference Akbaraly, Arnaud and Hininger-Favier20). Furthermore, a study in free-living Italian adults (> 65 years) found mean Se concentrations of 0·94 µmol/l (74·0 µg/l), while institutionalised adults of > 85 years had lower concentrations of 0·8 µmol/l (62·9 µg/l)(Reference Olivieri, Girelli and Azzini21).
In the UK, the NDNS survey reported that the median plasma Se concentration was 74·1 µg/l in free-living adults above 65 years (n 883). A review of Se status in very old adults found Se concentrations ranging from 88·9 µg/l in Italy (n 76, 86 years) to 113·7 µg/l in China (n 380, > 90 years)(Reference Robberecht, De Bruyne and Davioud-Charvet5). Furthermore, studies that inform the derivation of dietary Se recommendations rarely include data on very old adults (≥ 85 years). For example, the WHO/FAO of the United Nations recommendations are for adults up to 65 years(22), the Scientific Committee for Food recommended a population reference intake for adults without consideration of older adults(10) and the European Food Safety Authority pointed out that estimates of Se requirements to optimise selenoprotein concentrations come from studies involving adults aged 18 up to 64 years(23). This evidence gap is important because very old adults are the fastest growing sub-population of older adults. In addition, there is great heterogeneity in this sub-group ranging from those who are relatively healthy to the larger proportion who suffer from multi-morbidity(Reference Collerton, Davies and Jagger24). These differences can lead to difficulties in determining dietary requirements and in preparing public health recommendations. The aims of this study were: (1) to assess the Se status (by measuring total serum Se and SELENOP concentrations and GPx3 activity) and its determinants in 85-year-old adults from the Newcastle 85+ Study and (2) to quantify relationships between serum Se concentration and SELENOP concentration and GPx3 activity.
Methods
Study population
This study used participant data and samples collected at baseline in the Newcastle 85+ Study, which is a longitudinal study of health outcomes and trajectories of 1042 participants born in 1921. This study explores the cross-sectional data of these participants. Participants were registered with GPs from North Tyneside or Newcastle upon Tyne primary care trusts and were recruited from sixty-four centres (Northeast England). The only exclusions were individuals with end-stage terminal illness and those who could not be visited by a lone nurse without posing risks. Baseline assessments used in these cross-sectional analyses were undertaken between 2006 and 2007(Reference Collerton, Davies and Jagger24).
Ethics approval
The study was conducted in accordance with the Declaration of Helsinki. The Newcastle and North Tyneside local research ethics committee (06/Q0905/2) approved the research and all participants provided written and informed consent. For those who lacked capacity, a carer or relative provided consent in line with the UK Mental Capacity Act 2005.
Socio-economic, lifestyle and other covariates
Baseline assessments (2006/2007) were undertaken in each participant’s place of residence (home or an institution) by research nurses who underwent 6 weeks of training(Reference Collerton, Davies and Jagger24). Questionnaires, functional tests, fasting blood samples, medical record reviews, dietary intakes and body weight measurements were taken at the initial health assessment (online Supplementary Material Table 1)(Reference Collerton, Barrass and Bond25,Reference Martin-Ruiz, Jagger and Kingston26) . General practice medical records were analysed to obtain information on current medication, service usage and disease information.
Participants were classified into the National Statistics Socio-Economic Classification three-class scheme based on their main previous occupation(Reference Chandola and Jenkinson27). Education was determined by the duration of full-time higher education. Self-rated health was subjectively assessed and categorised as excellent/very good, good or fair/poor. Cognitive impairment was classified as scores ≤ 25 points out of 30, on the Standardised Mini-Mental State Examination. BMI was calculated as kg weight/m2 height and fat-free mass (kg) was estimated using the Tanita-305 body fat bioimpedance instrument (Tanita Corp.). Medication use, including non-prescribed medication, was determined using GP records and packaging at participant interviews. Smoking and alcohol questionnaires recorded habit status, frequency, past habits and duration. Physical activity was assessed using a purpose-built questionnaire and validated by comparison with accelerometery(Reference Innerd, Catt and Collerton28). Se intake (µg/d), total energy intake (kcal) and protein intake (g) were determined using the 24-h multiple pass recall(Reference Perri, Mendonça and Jagger11,Reference Sales, Silva and Costa29) . Disease count was calculated using a selected list of chronic diseases (online Supplementary Material Table 2)(Reference Collerton, Davies and Jagger24).
Biomarkers of selenium status
Few studies have used blood samples stored for as long as 16 years for the estimation of Se status, but a review of the literature suggested that Se in serum is stable over long time periods (at least 10–15 years) and that serum SELENOP is stable during freeze-thaw cycles over long periods of time(Reference Saito, Sato and Hirashima30). Serum samples stored for > 10 years retained linear correlations between the biomarkers of Se status suggesting stability(Reference Cabral, Kuxhaus and Eichelmann31–Reference Hughes, Fedirko and Jenab34). Consequently, baseline blood samples collected in 2006/2007 (n 757) that had been stored at –80°C were analysed for biomarkers of Se status by scientists blinded to the data. This included serum Se (µg/l) and SELENOP (mg/l) concentrations and GPx3 activity (U/l). Total serum Se concentration was measured by the total reflection X-ray fluorescence using a bench-top spectrometer (S4 T-STAR, Bruker Nano GmbH) for 2000 s per sample. As a reference, a gallium standard (1000 µg/l) was used to dilute participant serum in a 1:2 ratio, as described elsewhere(Reference Hughes, Fedirko and Jenab34). Eight microlitres of the diluted solution was applied to polished quartz glass slides (Bruker Nano GmbH), and these were dried overnight in an incubator at 37°C. Serum standard Seronorm was used as a control (concentration of 87 µg/l determined by ICP-MS) (Seronorm™ Trace Elements Serum L-1 SeronormTM, Cat#201405, Lot-Nr 1309438, Sero AS). The inter- and intra-assay CV from the ten assay runs were below 10 % at 76–99 µg/l. The total reflection X-ray fluorescence method is comparable to inductively coupled plasma optical emission spectroscopy and ICP-MS and produces congruent results(Reference Jablan, Besalú and Žarak35,Reference Lossow, Schlörmann and Tuchtenhagen36) . Serum SELENOP concentration was analysed using a validated immunoluminometric, commercial ELISA (selenOtest, selenOmed GmbH). The sandwich ELISA used 5 µl of serum and human SELENOP-specific monoclonal antibodies in addition to three controls that represented the assay’s working range. Absorbance at 450 nm was measured using a photometer, standards of known concentration were included in each assay run and a standard curve was fitted to the data. Each sample was measured in duplicate, and the mean SELENOP concentrations were calculated. The high, low and medium SELENOP concentration standards produced by the manufacturer for the selenOtest were each measured in twelve assays (i.e. 96-well plates) and yielded results well within the specified range defined by selenOmed, with CV between runs of 7·3 % (high standard), 12·4 % (low standard) and 3·7 % (middle standard). The concentrations measured were within the specified range of the standard (provided by selenOmed GmbH), and the three controls (low, medium, high) had SELENOP concentrations of 0·58, 2·3 and 9·3 mg/l, as indicated by the manufacturer. GPx3 activity was analysed using a coupled-enzyme reaction measuring NADPH consumption(Reference Flohé and Günzler37). Serum samples (including control serum) were incubated at 20°C with 0·27 mg/ml NADPH, 1 mM sodium azide (NaN3), an enzyme buffer containing 3·4 mM reduced glutathione and 0·3 U/ml glutathione reductase. The reaction was initiated using hydrogen peroxide. At 340 nm, reductions in UV absorption were proportional to NADPH consumption, which reflected GPx3 activity. Assays were carried out in triplicate and the mean activity was reported. The inter-assay CV was below 15 % and intra-assay CV was below 10 % as noted in these analyses and another study(Reference Schomburg, Schweizer and Holtmann38).
Cut-offs for selenium status
Currently, there is no consensus for suboptimal selenoprotein concentrations or activity for very old adults; therefore, cut-offs were selected based on average values or centiles in other populations(Reference Thomson39) (Appendix Table 2). For serum Se, a lower cut-off of 70 µg/l from a multicounty analysis was used since this population of very old adults had a suboptimal serum Se concentration(Reference Combs6) (Appendix Table 2). The SELENOP cut-off (4·5 mg/l) was determined as the mean SELENOP concentrations devised from the EPIC-Europe cohort(Reference Hughes, Fedirko and Jenab34) (mean 3·9 and 4·3 mg/l in males and females) and an American Se supplementation study(Reference Burk, Norsworthy and Hill15) (mean 5·5 mg/l). Additionally, cut-offs for deficiency were used to allow comparisons between those participants with suboptimal and deficient Se status. Both the deficient serum Se cut-off (< 45 µg/l) and SELENOP (< 2·6 mg/l) were devised using the 2·5th centile from a healthy sub-group (n 1915, 51 % females, 59 (sd 7) years at blood collection) of the EPIC cohort study(Reference Moghaddam, Heller and Sun40).
Statistical analyses
IBM statistical software package version 27.0 (SPSS) was used to perform the exploratory and statistical analyses, and P < 0·05 was considered statistically significant. To determine normality of the continuous variables, the Shapiro–Wilk test and quantile–quantile (QQ) plots were used. Se status biomarkers were used as continuous variables in the main analyses and categorised into optimal and suboptimal and non-deficient and deficient sub-groups based on biologically relevant cut-offs as described above. Descriptive statistics were used to summarise the baseline characteristics of all participants and of those with biomarker concentrations above and below the selected cut-offs. Differences in characteristics between the cut-offs were assessed using χ 2 test (categorical) and Kruskal–Wallis (for ordered and non-normally distributed data). R Studio was used with the libraries ggplot, ggvenn and venndiagram to plot a Venn diagram indicating the participants who had suboptimal and deficient concentrations of serum Se and SELENOP using the same cut-offs described above. R studio was also used with the libraries ggplot, rms and hmisc to produce restricted cubic splines to determine nonlinearity using likelihood ratio test. A P non-linearity < 0·05 was considered as a relationship deviating from linearity. Ordinary least squares regression models with three knots at the 10th, 50th and 90th percentiles were visualised as plots.
Predictors of baseline selenium status
Linear regression models were used to determine the predictors of each of the biomarkers of Se status (serum Se, SELENOP and GPx3 activity). The Se biomarkers were the dependent variables, and the independent variables were sex (men/women, binary); occupational status (routine/manual, intermediate, managerial/professional occupations, categorical); education (0–9, 10–11, ≥ 12 years, categorical); self-rated health (excellent/very good, good, fair/poor, ordinal); energy intake (continuous); protein intake (continuous); Se intake (continuous); medication use (continuous); BMI (continuous); fat-free mass (continuous); waist:hip ratio (continuous); Standardised Mini-Mental State Examination (continuous); disease count (0–1, 2, ≥ 3, categorical); number of medications (continuous); smoking status (current, former, never, categorical); physical activity (continuous); alcohol drinker (yes/no binary) and high-sensitivity C-reactive protein (continuous). The chosen covariates were based on findings from previous literature(Reference Bates, Thane and Prentice18).
The analyses were repeated using logistic regression models to determine the predictors of each biomarker of Se status when categorised as a binary variable using the selected cut-offs (70 and 45 µg/l for serum Se; 4·5 and 2·6 mg/l for SELENOP).
Results
Baseline selenium status and participant characteristics
Table 1 summarises the 5th–95th percentiles of biomarkers of Se status. The median concentrations were serum Se 53·6 µg/l, SELENOP 2·9 mg/l, GPx3 activity 142·1 U/L and Se intake 39·1 µg/d. Baseline characteristics of all participants and for those with biomarker concentrations above and below the suboptimal and deficient cut-offs are shown in Table 2 and Appendix Table 3, respectively. The median Se intake for all participants did not differ significantly between participants with suboptimal or optimal Se concentrations (< 70 or ≥ 70 µg/l) (P = 0·06) but did for those with deficient and non-deficient Se concentrations (< 45 or ≥ 45 µg/l) (P < 0·001). Those with suboptimal Se concentration (< 70 µg/l) were more likely to be male (P = 0·010), live in institutions (P = 0·002), have higher physical activity (P = 0·001), higher medication usage (P < 0·001), lower cognitive score (P = 0·007), higher high-sensitivity C-reactive protein (P = 0·002), higher free thyroxine (T4) (P = 0·03), higher BMI (P = 0·002) and higher fat-free mass (P < 0·001). Those with suboptimal SELENOP concentration (< 4·5 mg/l) were more likely to have lower protein intake (P = 0·03) and higher waist:hip ratio (P = 0·02) and free T4 (P = 0·021). Those with deficient Se concentration (< 45 µg/l) were more likely to live in institutions (P < 0·001), have lower protein intake (P = 0·03), higher medication usage (P < 0·001), lower alcohol intake (P = 0·006), lower physical activity (P < 0·001), lower cognitive score (P < 0·001), higher high-sensitivity C-reactive protein (P = 0·005) and lower free tri-iodothyronine (T3) (P < 0·001). Those with deficient SELENOP concentration (< 2·6 mg/l) were more likely to have lower education (P = 0·04), lower protein intake (P = 0·005) and have higher free T4 (P < 0·001).
Table 1. Biomarkers of selenium status (serum Se, selenoprotein P, glutathione peroxidase 3 activity) of study participants represented by percentiles (5–95th)

SELENOP, selenoprotein P; GPx3, glutathione peroxidase.
Table 2. The characteristics of study participants represented by suboptimal Se status cut-offs (Numbers and percentages; mean values and standard deviations)
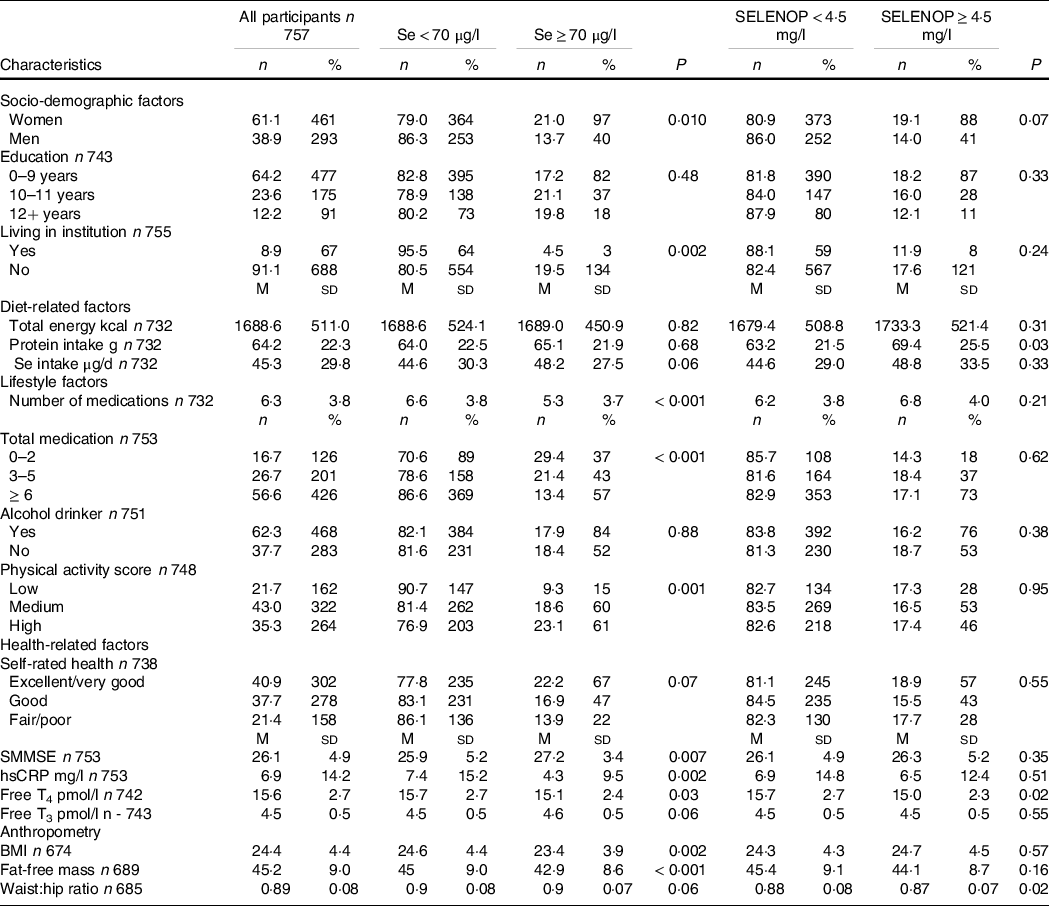
SELENOP, selenoprotein P; SMMSE, Standardised Mini-Mental State Examination; hsCRP, high-sensitivity C-reactive protein; Free T4, free thyroxine; Free T3, free triiodothyronine.
The characteristics are displayed for all participants and those with concentrations above and below cut-offs for suboptimal/optimal Se and selenoprotein status. P values determined using Mann Whitney U or Kruskal Wallis tests for continuous variables or χ 2 test for categorical variables. P values indicate the difference between suboptimal and optimal status.
Most participants (81·8 %, n 619) had suboptimal serum Se concentration, that is, below 70 µg/l, and suboptimal (82·8 %, n 627) SELENOP concentration, that is, below 4·5 mg/l. Participants with optimal Se status as judged by serum Se concentration ≥ 70 µg/l were more likely to be optimal for SELENOP (P < 0·001). Almost a third of participants (30·6 %, n 232) had deficient serum Se concentration, that is, below 45 µg/l, and over a third (39·9 %, n 302) had deficient SELENOP concentration, that is, below 2·6 mg/l.
Relationships between biomarkers of selenium status at baseline
A Venn diagram (Fig. 1) revealed the overlap between the participants who were considered to have suboptimal Se status. There was a 79 % overlap in those who were considered suboptimal for serum Se (< 70 µg/l) and for SELENOP (< 4·5 mg/l). Considering Se deficiency, that is, serum Se concentrations below 45 µg/l and SELENOP below 2·6 mg/l (2·5th centile of EPIC)(Reference Moghaddam, Heller and Sun40), there was an overlap of 41 % of participants. Restricted cubic splines and likelihood ratio tests revealed a linear association between serum Se and SELENOP (χ 2 (df = 1) = 0·96, P = 0·33) and nonlinear associations between serum Se and GPx3 activity (χ 2 (df = 1) = 7·88, P = 0·005) and between SELENOP and GPx3 activity (χ 2 (df = 1) = 4·86E+1, P = 3·20E-12) (Appendix Fig. 1).
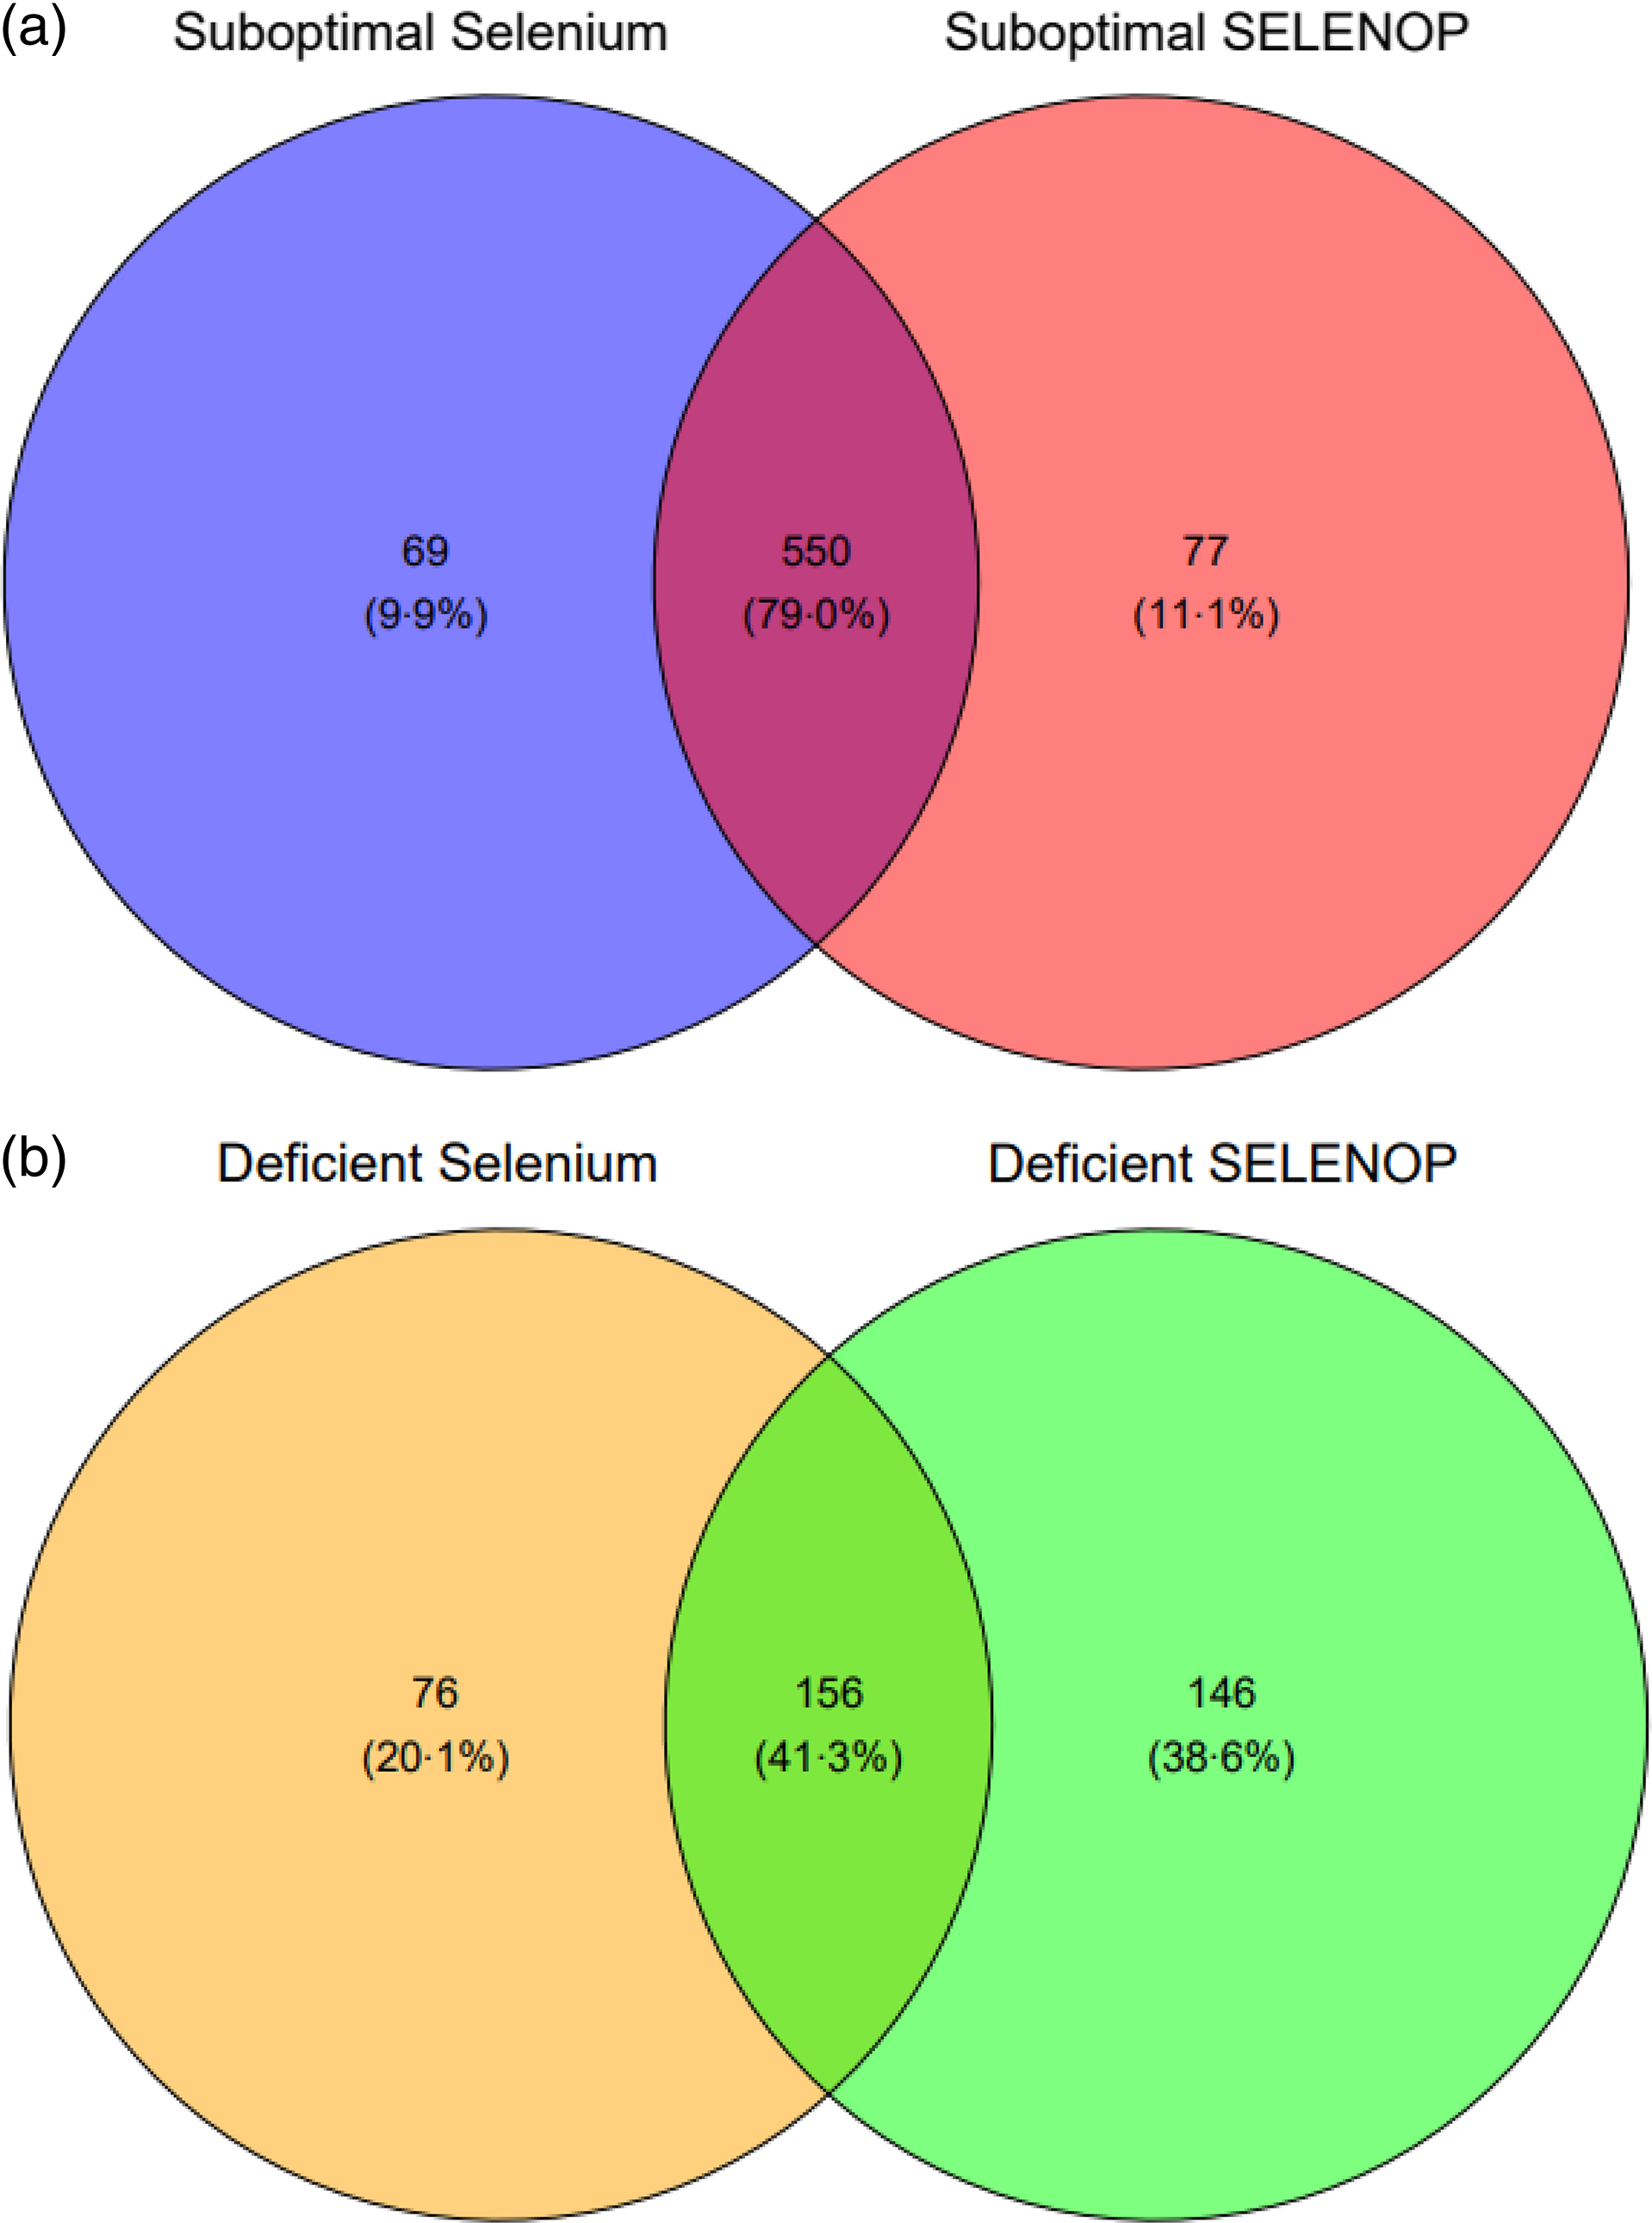
Fig. 1. (a) Venn diagram depicting the overlap of suboptimal concentrations of biomarkers of Se status. Suboptimal concentrations were defined in those who had serum Se < 70 µg/l and selenoprotein P < 4·5 mg/l. (b) Venn diagram depicting the overlap of deficient concentrations of biomarkers of Se status. Deficient concentrations were defined as serum Se < 45 µg/l and selenoprotein P < 2·6 mg/l.
Predictors of biomarkers of selenium status
In the fully adjusted regression models (Table 3), a higher protein intake was a significant predictor of each biomarker of Se status. In addition, serum Se concentration was higher in females (β 8·38 (sd 3·04), P = 0·006), those with higher waist:hip ratios (β 24·66 (sd 12·19), P = 0·04), lower in those with poor self-rated health (β –2·31 (sd 1·11), P = 0·04) and with a higher disease count (β –1·07 (sd 0·51), P = 0·04). Similarly, GPx3 activity was higher in females (β 30·92 (sd 8·23), P < 0·001) and lower in those with higher BMI (β –2·17 (sd 0·74), P = 0·003) and those who were more physically active (β –1·32 (sd 0·60), P = 0·03).
Table 3. Significant predictors of the biomarkers of Se status (Beta-coefficients and standard errors)
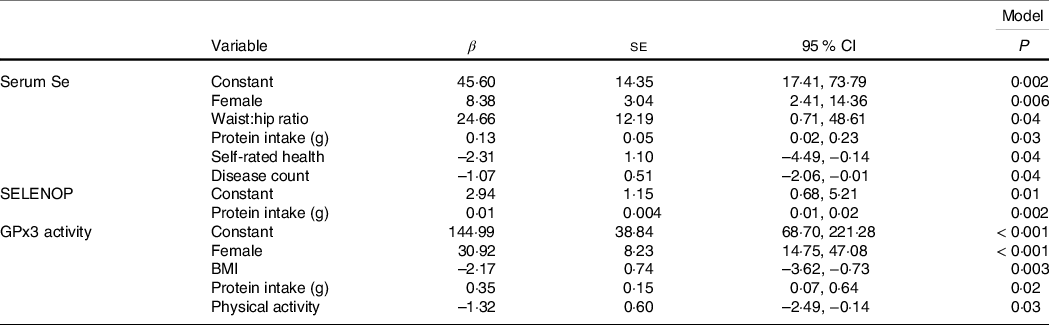
SELENOP, selenoprotein P; GPx3, glutathione peroxidase.
When using the selected suboptimal cut-off, a lower medication use (3–4 medications compared with > 6) was a significant predictor of optimal Se concentration (≥ 70 µg/l) (Exp(β) 2·03 (1·045–3·937) P = 0·04) and non-deficient Se concentration (≥ 45 µg/l) (Exp(β) 1·68 (1·039–2·729) P = 0·03) (1–2 medications compared with > 6) (Exp(β) 2·10 (1·062–4·134) P = 0·03). A higher disease count was a significant predictor of deficient Se concentration (< 45 µg/l) (Exp(β) 0·85 (0·747–0·964) P = 0·01). A higher protein intake was a predictor of optimal SELENOP concentration (≥ 4·5 mg/l) (Exp(β) 1·02 (1·007–1·040) P = 0·005) and non-deficient SELENOP concentration (≥ 2·6 mg/l) (Exp(β) 1·02 (1·003–1·029) P = 0·02) and non-deficient Se concentration (≥ 45 µg/l) (Exp(β) 1·02 (1·001–1·031) P = 0·03).
Discussion
Over 80 % of the 85-year-old adults in this study had suboptimal serum Se and SELENOP concentrations and over 40 % had deficient Se status when judged by reference values derived from healthy adults of all age categories. Higher protein intake was associated with higher concentrations of all three biomarkers of Se status. In addition, sex, waist:hip ratio, disease count and self-rated health predicted serum Se concentration and sex, BMI and physical activity predicted GPx3 activity while only protein intake predicted SELENOP concentration. The negative association of number of medications taken and suboptimal SELENOP concentrations, which is in line with recent research(Reference Hackler, Demircan and Chillon41), indicates that concurrent illness is a noteworthy risk factor for suboptimal Se status, particularly among very old adults.
Many studies have reported suboptimal Se intakes in older adults(Reference Combs6,Reference de Jong, Gibson and Thomson42,Reference Stoffaneller and Morse43) , but measurements of multiple functional biomarkers (serum Se, SELENOP, GPx3 activity) of Se status are scarce. Serum Se and SELENOP concentrations in the 85-year-old adults in the present study are generally lower than in other UK older adults (generally for adults < 80 years) (Appendix Table 1)(Reference Brown, Pickard and Nicol44–Reference Broome, McArdle and Kyle46). For example, in a British cohort (n 119) (50–64 years), mean SELENOP concentration was 4·9 mg/l(Reference Hurst, Armah and Dainty14). Furthermore, in the EPIC-Europe cohort (n 966, mean 60 years, 70 % women from Denmark, France, Germany, Greece, Italy, the Netherlands, Norway, Spain, Sweden and UK), participants had a mean serum Se of 81·9 µg/l and SELENOP of 4·3 mg/l(Reference Hughes, Fedirko and Jenab34). Likewise, in the Malmö Preventive Project (n 4366, mean 70 years), participants in quintiles 2–5 had SELENOP concentrations ranging from 4·3 to 20 mg/l(Reference Schomburg, Orho-Melander and Struck33). A study of southeastern US adults (n 191, 40–79 years, 61 % earning below $15 000 per year) found a mean serum Se of 117·6 µg/l, a mean SELENOP concentration of 4·7 mg/l and a mean GPx3 activity of 132·0 U/L(Reference Hargreaves, Liu and Buchowski47). In that study, GPx3 activity was lower than the activity of the Newcastle 85+ Study participants despite the younger age range. This difference may be driven by socio-economic status. Furthermore, there is wide heterogeneity from the literature in defining ‘adequate’, ‘optimal’ and ‘deficient’ concentrations of Se biomarkers. Authoritative reports on dietary Se requirements often vary because of differences in techniques and criteria used including which Se biomarkers are chosen, reference cohort is analysed and the criteria for devising the respective cut-offs. For example, in the UK, dietary recommendations for Se established by the Committee on Medical Aspects of Food and Nutrition Policy (COMA) in 1991 were based on the Se intake required to maximise the activity of GPx3(48). It was suggested that GPx3 activity plateaued when whole blood Se was 100 µg/l, that is, the system was saturated(9,Reference Thomson, Rea and Doesburg49) . Alternatively, as used in our analyses, a lower cut-off of 70 µg/l has been suggested for the optimisation of GPx3 activity(Reference Combs6,Reference Nève12) (Appendix Table 2). More recently, other organisations (D-A-CH and European Food Safety Authority (EFSA))(Reference Xia, Hill and Li13,23,Reference Kipp, Strohm and Brigelius-Flohe50) have used the achievement of a plateau in SELENOP when considering the dose–response relationship between Se intake and SELENOP to indicate optimal Se intake.
The results are in agreement with former studies indicating that SELENOP and GPx3 activity require a higher Se intake for full and saturated expression of these two biomarkers(Reference Xia, Hill and Li13,Reference Hurst, Armah and Dainty14) . This may be because both serum selenoproteins are towards the lower end of the selenoprotein hierarchy(Reference Behne, Hilmert and Scheid51–Reference Burk and Hill53), which may mean that higher intakes of Se are needed to maximise the expression. This interrelationship is further complicated by tissue hierarchy, where organs lower in the hierarchy such as the liver, where SELENOP is synthesised, are depleted first, prior to endocrine tissues or the central nervous system(Reference Schomburg54,Reference Burk and Hill55) . Likewise, the kidney, where GPx3 is synthesised, is also compromised in times of Se deficiency(Reference Renko, Werner and Renner-Müller56).
The prevalent suboptimal (over 81 % of participants) and deficient (over 40 % of participants) Se status observed in this population of very old adults may indicate suboptimal Se intake. As expected, protein intake was a significant predictor of all three biomarkers of Se status. Protein-rich foods are generally rich in Se, and intakes of such foods have correlated with SELENOP in older women(Reference Moschos16). Waist:hip ratio predicted serum Se and BMI predicted GPx3 activity. Higher adiposity measures are associated with increased inflammation and greater oxidative stress(Reference Keaney, Larson and Vasan57), which is negatively associated with Se status(Reference Nichol, Herdman and Sattar58–Reference Ghayour-Mobarhan, Taylor and New61). Furthermore, females had higher concentrations of all three biomarkers of Se. In contrast, males had higher serum Se concentrations in a Spanish study of ≥ 80-year-olds(Reference Gámez, Ruiz-López and Artacho62), although sex was not associated with differences in Se concentrations in other studies(Reference Bates, Thane and Prentice18,Reference Monget, Galan and Preziosi63,Reference Imai, Suzuki and Kashiwazaki64) . Poor self-rated health and a higher disease count were associated with lower concentrations of serum Se and were also predictors of Se status in another British cohort of older adults(Reference Bates, Thane and Prentice18). Higher levels of physical activity were negatively associated with GPx3 activity. In contrast, in a 12-week walking programme, GPx3 activity increased in sedentary, postmenopausal women (65 years)(Reference Rusip and Suhartini65). Changes in GPx3 activity can be associated with oxidative stress, whereby GPx3 functions to detoxify free radicals that increase after intense physical activity(Reference Powers and Hamilton66). However, in our population, higher physical activity was associated with lower GPx3 activity, which highlights the need for more research to explore the relationship between GPx3 activity and physical activity among very old adults.
Like other nutrients, there are potential health consequences to suboptimal Se status. Our analyses have found associations between lower Se status and higher medication count, poorer self-rated health, lower cognitive performance, higher inflammation (high-sensitivity C-reactive protein), higher free T 4 , lower free T3, higher BMI, fat-free mass and waist:hip ratio, although these are cross-sectional associations and do not imply causation. On the other hand, very old adults may have adapted to a lower Se supply and have mechanisms to cope with this limited intake without a major detriment to health(67). In a study of Se-deficient rats, there was no negative effect on lifespan – indeed, lifespan was increased for those with restricted Se intake(Reference Yim, Clish and Gladyshev68). These findings may indicate a pro-longevity effect of suboptimal Se status. Although, to date, no studies in humans have found these associations and often reveal the converse, an increase in ageing and disease, thus pro-longevity mechanisms appear counterintuitive given the many reports of increased health risks with suboptimal Se status(Reference Alehagen, Opstad and Alexander69). These findings stress the need for future longitudinal analyses to determine the potential relevance of suboptimal and deficient Se status in very old adults.
This is the first cross-sectional study to date that has measured Se status using three specific biomarkers in ≥ 85-year-old adults. A major strength to this study is the availability of three established biomarkers of Se status. Another key strength of this study is the large sample size (n 757) with inclusion of all participants regardless of living status. However, biomarkers of Se status were only assessed in baseline samples, and thus, other characteristics could not be followed up. Further research is needed to establish the cut-offs for optimal Se status in very old adults especially given the documented U-shaped relationship between Se status, chronic disease and mortality risk(Reference Sun, Wang and Gong4,Reference Rayman70) .
Conclusions
When judged by the criteria for optimal Se status derived using dietary reference intakes, there was a high prevalence of suboptimal Se status in this population of 85-year-olds. This may be due to the fact the Se dietary reference intakes are based on experimental studies using younger adults. The clinical consequences of these findings are currently unclear, so it will be important to undertake longitudinal studies of the relationship between Se intake and Se status at baseline and subsequent health outcomes. It is likely that those individuals with Se and SELENOP deficiencies (below 45 µg/l and 2·6 mg/l, respectively) are at particularly elevated health risks, as has been seen in studies with younger adults. However, this hypothesis will need to be tested using longitudinal observational studies.
Acknowledgements
We thank the operational support from the North of England Commissioning Support Unit and the local general practitioners and staff in addition to the research, management and administrative teams and the study participants and their families for providing the data. We would also like to thank the research team at Charité Berlin and selenOmed GmbH, namely Dr. Petra Seemann and Qian Sun, Julian Hackler and Sophie Jahn for support in analysing the biomarkers of Se status.
The Newcastle 85+ Study was jointly funded by the Medical Research Council and Biotechnology and Biomedical Science Research Council (G0500997), now part of UK Research and Innovation (UKRI) in addition to the Newcastle Healthcare Charity. The following waves were funded by the Dunhill Medical Trust (R124/0509), Newcastle University, UK Medical Research Council and the British Heart Foundation (606013333). Overall, the project was supported by National Institute for Health Research Newcastle Biomedical Research Centre based at Newcastle upon Tyne Hospitals NHS Foundation Trust and Newcastle University (A.G.). Analyses in the lab of LS were supported by Deutsche Forschungsgemeinschaft (DFG Research Unit 2558 TraceAge, Scho 849/6–2 and CRC/TR 296 ‘Local control of TH action’, LocoTact, P17). This individual research study received no additional funding. However, this work was supported by the Medical Research Council (MRC) and Versus Arthritis as part of the Medical Research Council Versus Arthritis Centre for Integrated Research into Musculoskeletal Ageing (CIMA) [MR/R502182/1]. The MRC Versus Arthritis Centre for Integrated Research into Musculoskeletal Ageing is a collaboration between the Universities of Liverpool, Sheffield and Newcastle. We would also like to acknowledge the generous donations provided by Cumbria Community Foundation and Beverley Charitable Trust Fund throughout the associated PhD programme of study.
G. P., T. R. H. and J. C. M. were responsible for conception and design of the study; L. S., K. D., T. S. C. were responsible for the biomarker analyses, G. P. was responsible for statistical analyses; G. P. was responsbile for writing the manuscript and had primary responsibility for the final content of the manuscript; T. R. H., J. C. M., C. M-R, C. P., L. R., K. D., T. S. C., R. E., J. S. W. and L. S. critically reviewed and revised the manuscript for scientific content and approved the final version. All authors have read and agreed to the published version of the manuscript.
L. S. holds shares of selenOmed GmbH, a company involved in Se status assessment. The other authors declare no conflicts of interest. The funders had no role in the design of the study; in the collection, analyses or interpretation of data; in the writing of the manuscript or in the decision to publish the results.
Supplementary material
For supplementary materials referred to in this article, please visit https://doi.org/10.1017/S0007114523002398


 Open access