


CVD is the leading cause of deaths related to non-communicable diseases, and improving the detection and treatment of CVD is a major goal of clinical medicine( Reference Hunter and Reddy 1 ). Low serum 25-hydroxyvitamin D (25(OH)D) concentrations are frequently reported in populations worldwide( Reference Andersen, Molgaard and Skovgaard 2 – 7 ), and there are a number of potential mechanisms implicating low vitamin D status in cardiometabolic risk. There appears to be a role for vitamin D in the development of insulin resistance: vitamin D receptors are strongly expressed in pancreatic β-cells( Reference Wang, Zhu and DeLuca 8 ), and the active form of vitamin D (1,25-dihydroxyvitamin D) may protect against insulin resistance in peripheral tissues such as skeletal muscle( Reference Dirks-Naylor and Lennon-Edwards 9 ). Animal and in vitro studies suggest that 1,25-dihydroxyvitamin D is a potent negative regulator of renin gene expression and may prevent the over-stimulation of the renin–angiotensin system( Reference Li 10 ) – a regulatory pathway that plays an essential role in blood pressure.
A recent review of systematic reviews and meta-analyses found that highly convincing evidence of a clear role of vitamin D does not exist for CVD, hypertension or type 2 diabetes( Reference Theodoratou, Tzoulaki and Zgaga 11 ). However, the epidemiological evidence associating serum 25(OH)D concentrations and cardiometabolic risk has been largely cross-sectional in design and focuses on adult populations, with conflicting results. Using data from the 17- and 20-year follow-ups of the Western Australia Pregnancy Cohort (Raine) Study, we investigated the prospective associations between serum 25(OH)D concentrations and cardiometabolic risk factors including BMI, insulin resistance, HDL-cholesterol, TAG and systolic blood pressure (SBP). To our knowledge, this is the first prospective study examining associations between serum 25(OH)D concentrations and cardiometabolic risk factors in adolescents and young adults.
Methods
Participants
The Raine Study is a prospective, population-based, longitudinal study and its methodology has been described previously( Reference Newnham, Evans and Michael 12 ). In brief, a total of 2900 pregnant women from the public antenatal clinic at King Edward Memorial Hospital and surrounding private clinics in Perth, WA, were recruited between May 1989 and November 1991, and they gave birth to 2868 live children. These children underwent assessment at birth and at ages 1, 2, 3, 5, 8, 10, 14, 17 and 20 years. Recruitment and all follow-ups were approved by the ethics committees of King Edward Memorial Hospital for Women and the Princess Margaret Hospital for Children, Perth, WA. Informed and written consent was obtained from the participant and/or their primary caregiver at all follow-ups.
Serum 25-hydroxyvitamin D concentrations
Serum 25(OH)D concentrations were determined at the 17- and 20-year follow-ups. Venous blood samples were collected from an antecubital vein after an overnight fast and stored at −80°C until analysis. Serum 25(OH)D2 and 25(OH)D3 concentrations were measured using isotope-dilution liquid chromatography tandem MS (LC-MS/MS; RDDT), according to published methodology( Reference Maunsell, Wright and Rainbow 13 ). The method for the quantification of vitamin D metabolites (25(OH)D2 and 25(OH)D3) in serum/plasma used hexa-deuterated 25(OH)D3 as an internal standard on either the API 4000 QTRAP system (AB Sciex) or the Agilent 6410 QQQ LC-MS/MS system (Aligent Technologies). Serum Calibration Standards containing nominal amounts of 25(OH)D2/25(OH)D3 from Chromsystems were used to generate calibration curves. Tri-level quality control samples containing 25(OH)D2/25(OH)D3 designated as level low, level 1 and level 2 were purchased from UTAK Laboratories (PM Separations). At 17 years, the CV for 25(OH)D3 was 7·1 % at 27 nmol/l, 5·0 % at 75 nmol/l and 5·3 % at 164 nmol/l, and the CV for 25(OH)D2 was 8·8 % at 23 nmol/l, 6·7 % at 66 nmol/l and 6·7 % at 150 nmol/l. At 20 years, the CV for 25(OH)D3 was 5·8 % at 28 nmol/l, 5·2 % at 80 nmol/l and 9·2 % at 188 nmol/l, and the CV for 25(OH)D2 was 7·9 % at 25 nmol/l, 6·6 % at 75 nmol/l and 10·4 % at 185 nmol/l.
Cardiometabolic risk factors
Participants at 17 years were weighed to the nearest 100 g using a Wedderburn Digital Chair Scale, and height was determined to the nearest 0·1 cm using a Holtain Stadiometer. At 20 years, weight was measured to the nearest 100 g using Personal Precision scales UC-321 (A&D Company), and height was measured to the nearest 0·1 cm using a wall-mounted Seca 202. BMI was calculated as weight in kilograms divided by height in metres squared. Fasting blood samples at the 17- and 20-year follow-ups were analysed for serum glucose, HDL-cholesterol and TAG, determined enzymatically using an Architect c16000 Analyser (Abbott Laboratories) (intra-assay CV were 1·0 % for glucose, 2·0 % for HDL-cholesterol and 1·9 % for TAG). Serum insulin was determined using an Architect i2000SR Analyser (intra-assay CV 1·78 %) (Abbott Laboratories). The homoeostasis model assessment for insulin resistance (HOMA-IR) score was calculated as follows: HOMA-IR score=(fasting insulin (μU/ml)×fasting glucose (mmol/l))/22·5( Reference Matthews, Hosker and Rudenski 14 ). Resting blood pressure at 17 and 20 years was obtained using an oscillometric sphygmomanometer (Dinamap ProCare 100; Soma Technology). After 5 min of quiet rest, six automatic recordings were taken every 2 min with subjects in the supine position and with an appropriate cuff size. The averages of the last five readings of SBP were calculated.
Potential confounding variables
Participants were classified as Caucasian if both parents were Caucasian, or as non-Caucasian if one or both parents were of an alternate ethnicity. Physical activity at the 17-year follow-up was assessed using a self-reported questionnaire based on exercise outside of school hours per week, with exercise defined in three categories as activity causing breathlessness or sweating (≥4 times/week, 1–3 times/week and <once per week). At 20 years, physical activity was assessed using a self-reported questionnaire that recorded time spent in moderate or vigorous physical activity (≥4 times/week, 1–3 times/week and <once per week).
A baseline measure of family income was available at the 17-year follow-up, completed by the primary caregiver, with twelve categories ranging from $1–$8000/year to ≥$104 000/year (Australian dollars). At the 17- and 20-year follow-ups, the participants answered the question ‘do you currently smoke cigarettes’. At the 17- and 20-year follow-ups, the use of hormonal contraception (HC) (yes/no) was reported by the participant.
A self-reported, semi-quantitative FFQ developed by the Commonwealth Scientific and Industrial Research Organisation in Adelaide, Australia( Reference Baghurst and Record 15 ), was used at the 17-year follow-up to assess alcohol intake (g/d). This 212-item FFQ assesses usual dietary intake over the previous year, collecting information on the frequency of consumption of individual foods, mixed dishes and beverages, along with information on usual serving sizes in relation to a standard serving size (in household units). Participants were asked how often they usually drank six types of alcohol (low-alcohol beer, regular beer, alcoholic soda, wine/champagne, sherry/port/liqueur and spirits). Frequency was recorded as never, rarely, times per month, times per week or times per day.
At the 20-year follow-up, alcohol intake (g/d) was assessed using a self-reported, semi-quantitative FFQ developed by the Anti-Cancer Council of Victoria for use in the ethnically diverse Australian population( Reference Ireland, Jolley and Giles 16 ). The questionnaire includes three questions on alcohol consumed over the last 12 months. Participants were asked to report how often they drank beer, wine and/or spirits, with six types of alcohol specified (low-alcohol beer, full-strength beer, red wine, white/sparkling wine, fortified wine, spirits/liqueurs) and ten frequency choices ranging from ‘never’ to ‘every day’. A second question asked how many glasses of beer/wine and/or spirits they usually drank on days they were drinking (total number of glasses per day, ranging from one to ten or more). A third question asked about the maximum number of glasses of beer/wine and/or spirits they drank in 24 h (maximum number of glasses per 24 h ranging from one to two to nineteen or more).
Addressing potential seasonal effects
Models investigating HDL-cholesterol, TAG and HOMA-IR were not adjusted for season as these biomarkers change relatively quickly over time, and the blood samples for these biomarkers were collected on the same day as that for the measurement of serum 25(OH)D concentrations. Similarly, SBP changes relatively quickly over time, and it would not be appropriate to adjust for season if serum 25(OH)D concentrations and SBP measurements were taken on the same day. Although 95 % of participants had blood samples for serum 25(OH)D concentrations and SBP measurements taken within 31 d of each other, approximately 5 % of the participants had measurements taken >31 d apart. In order to determine whether the time difference between measurement of serum 25(OH)D concentrations and SBP influenced the association between serum 25(OH)D concentrations and SBP, we deseasonalised the serum 25(OH)D3 concentrations using sine and cosine curves( Reference van der Mei, Ponsonby and Dwyer 17 ) and moved the projected date back to match the day SBP was measured. This technique has previously been reported by Lucas et al.( Reference Lucas, Ponsonby and Dear 18 ). For models investigating BMI, which changes relatively slowly over time, we used deseasonalised serum 25(OH)D3 concentrations( Reference van der Mei, Ponsonby and Dwyer 17 ).
Statistical analyses
Characteristics of the participants for whom full data for cardiometabolic risk factors and HC were available were described at both the 17- and 20-year follow-ups. A three-level variable for sex (to distinguish females not using HC, females using HC and males) was used to assess the interactive effects of HC use on the relationship between serum 25(OH)D concentrations and all outcomes, except BMI. For BMI, there was no difference between females not using HC and females using HC. Additional power was required to demonstrate statistically significant differences between females and males; therefore, for the BMI model, we used a two-level variable for sex. HOMA-IR, TAG and HDL-cholesterol were not normally distributed, and therefore log-transformations were applied.
Hierarchical linear mixed models with maximum likelihood estimation (MLE) were used to investigate associations between serum 25(OH)D concentrations and cardiometabolic risk factors (BMI, HOMA-IR, TAG, HDL-cholesterol, SBP) over time. All models included adjustment for sex and BMI (excluding the model with BMI as an outcome) and investigated possible interactions between time, serum 25(OH)D concentrations and each of sex or BMI. The hierarchical structure accounted for potential correlation between a small number of siblings.
Additional covariates (race, physical activity, family income, smoking status, alcohol intake and month of birth) were then included individually to determine whether a significant association with the outcome was detected or whether the covariate influenced any relationship between serum 25(OH)D concentrations and the outcome. Sample sizes were held fixed for these comparisons based on the sample without missing data for each covariate in turn. Owing to considerable missing data for some covariates, models utilising MLE for covariates (structural equation models in Stata) were also used to investigate possible bias the loss of sample may have introduced. These models were not longitudinal models but rather approximations achieved by identifying repeated measures on the subject as a per person cluster, resulting in an adjusted, robust variance. The sibling adjustment was not made in these models. These models were used to determine whether multiple imputation was necessary.
Although some of the additional covariates were significantly associated with the outcomes, the analysis determined that these associations were independent of the relationship with serum 25(OH)D concentrations. The significance of the relationship between serum 25(OH)D concentrations and the outcome was unaltered by the inclusion of the additional covariates, and variations in the magnitude of the relationships (the coefficient) were considered to be minimal (online Supplementary Tables S1 and S2). Hence, it was determined that multiple imputation to facilitate inclusion of variables that had no effect on the relationship of interest was unnecessary.
Analyses were performed using IBM SPSS Statistics Release version 19.9.9.1 (IBM SPSS Inc., 2010) and StataCorp 2011 Stata Statistical Software: Release 12 (StataCorp LP). Statistical significance was defined as two-tailed P<0·05. The regression tables are reported per 1 nmol/l change in serum 25(OH)D concentrations and as log-transformations of HOMA-IR, TAG and HDL-cholesterol.
Results
Participant characteristics
Full data for outcome variables and HC were available for 1015 participants at the 17-year follow-up and for 1117 participants at the 20-year follow-up. A CONSORT flow diagram is shown in Fig. 1, and participant characteristics for males and females are shown in Table 1. Mean serum 25(OH)D concentrations were 73·6 (sd 28·2) and 75·4 (sd 25·9) nmol/l at the 17-year follow-up in males and females, respectively and were 70·0 (sd 24·2) and 74·3 (sd 26·2) nmol/l at the 20-year follow-up in males and females, respectively. At the 17-year follow-up, only four participants had detectable serum 25(OH)D2 concentrations, ranging from 5·44 to 8·12 nmol/l. At the 20-year follow-up, thirteen participants had detectable serum 25(OH)D2 concentrations, ranging from 5·24 to 7·07 nmol/l.

Fig. 1 CONSORT flow diagram. 25(OH)D, 25-hydoxyvitamin D; SBP, systolic blood pressure; HOMA-IR, homoeostasis model assessment for insulin resistance.
Table 1 Characteristics of the Raine Study participants for whom full data on outcome variables and hormonal contraceptive use were available (Numbers and percentages; mean values and standard deviations; medians and interquartile ranges (IQR))

25(OH)D, 25-hydroxyvitamin D; HOMA-IR, homoeostasis model assessment for insulin resistance; SBP, systolic blood pressure; NR, not reported.
Deseasonalised serum 25-hydroxyvitamin D3 concentrations and BMI
In a univariate analysis, deseasonalised serum 25(OH)D3 concentrations were inversely associated with BMI (coefficient −0·02; 95 % CI −0·03, −0·02; P<0·001) and the association persisted after adjusting for sex (Table 2). A significant three-way interaction between time, sex and serum 25(OH)D3 concentrations indicated that the relationship between serum 25(OH)D3 concentrations and BMI changed over time differently in males compared with females (P=0·026). No change over time was detected in the association for males, whereas for females the inverse association was stronger at 20 years compared with 17 years (Fig. 2). The model estimates that a 1 sd increase in serum 25(OH)D3 concentration (approximately 25 nmol/l) was associated with a reduction in BMI of 0·4 kg/m2 in females at 17 years, 0·6 kg/m2 in females at 20 years, 0·6 kg/m2 in males at 17 years, and 0·5 kg/m2 in males at 20 years.

Fig. 2 A graphical representation of the three-way interaction in the BMI model showing an inverse association between deseasonalised serum 25-hydoxyvitamin D3 concentrations and BMI that does not change over time in males, but is stronger in females, at 20 years compared with 17 years. 25(OH)D, 25-hydoxyvitamin D. ![]() , 17 years;
, 17 years; ![]() , 20 years.
, 20 years.
Table 2 Adjusted associations between deseasonalised serum 25-hydroxyvitamin D3 (25(OH)D3) concentrations and BMI (Coefficients and 95 % confidence intervals)
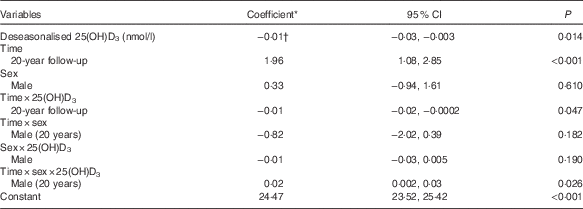
* Estimated difference in BMI from the reference category of categorical variables or per 1 unit increase of continuous variables.
† Shown in the Table is the coefficient for females, 17-year follow-up. Females, 20-year follow-up: coefficient −0·03; 95 % CI −0·04, −0·02; P<0·001. Males, 17-year follow-up: coefficient −0·03; 95 % CI −0·04, −0·01; P<0·001. Males, 20-year follow-up: coefficient −0·02; 95 % CI −0·03, −0·01; P=0·001.
Serum 25-hydroxyvitamin D concentrations and insulin resistance
In a univariate model, serum 25(OH)D concentrations were inversely associated with log-HOMA-IR (coefficient −0·003; 95 % CI −0·005, −0·002; P<0·001) and the inverse association was maintained after adjusting for BMI (coefficient −0·002; 95 % CI −0·003, −0·001; P<0·001) (Table 3). No significant interactions were found between time, serum 25(OH)D concentrations and each of sex or BMI. The model estimates that a 1 sd increase in serum 25(OH)D concentrations was associated with a 5 % decrease in HOMA-IR.
Table 3 Adjusted associations between serum 25-hydroxyvitamin D (25(OH)D) concentrations and log-homoeostasis model assessment for insulin resistance (Coefficients and 95 % confidence intervals)
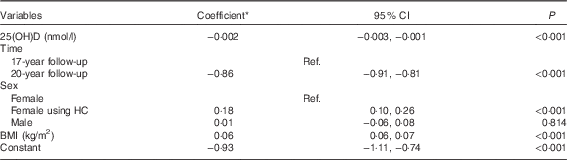
Ref., referent values; HC, hormonal contraception.
* Estimated difference in log-homoeostasis model assessment for insulin resistance from the reference category of categorical variables or per 1 unit increase of continuous variables.
Serum 25-hydroxyvitamin D concentrations and TAG
In a univariate model, serum 25(OH)D concentrations were positively associated with log-TAG (coefficient=0·001; 95 % CI 0·0004, 0·002; P=0·03). A significant interaction between serum 25(OH)D concentrations and sex indicated that the relationship between serum 25(OH)D concentrations and log-TAG differed in males when compared with females (P=0·016). There was a positive association in females not using HC after adjusting for BMI (coefficient 0·0023; 95 % CI 0·0008, 0·0038; P=0·003) (Table 4), as well as a similar effect in females using HC. Coefficients from the model estimate that a 1 sd increase in serum 25(OH)D concentrations was associated with a 6 % increase in TAG in females. There was no significant association between serum 25(OH)D concentrations and TAG in males (P=0·738).
Table 4 Adjusted associations between serum 25-hydroxyvitamin D (25(OH)D) concentrations and log-TAG (Coefficients and 95 % confidence intervals)
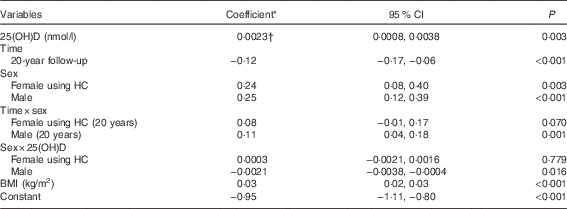
HC, hormonal contraception.
* Estimated difference in log-TAG from the reference category of categorical variables or per 1 unit increase of continuous variables.
† Shown in the Table is the coefficient for females not using HC. Males: coefficient=0·00015; 95 % CI −0·0008, 0·001; P=0·738.
Serum 25-hydroxyvitamin D concentrations and HDL-cholesterol
Serum 25(OH)D concentrations were positively associated with log-HDL-cholesterol in a univariate model (coefficient 0·0005; 95 % CI 0·0002, 0·0008; P=0·004). However, there was no association between serum 25(OH)D concentrations and HDL-cholesterol after adjusting for BMI (online Supplementary Table S3), and no significant interactions were found between time, serum 25(OH)D concentrations and each of sex or BMI.
Serum 25-hydroxyvitamin D concentrations and systolic blood pressure
There was no difference in the relationship between serum 25(OH)D concentrations and SBP when we moved the projected date of blood measurement back to match the day SBP was measured. Therefore, we did not deseasonalise serum 25(OH)D concentrations or adjust for season in models with SBP as the outcome measure. An inverse association between serum 25(OH)D concentrations and SBP (coefficient −0·02; 95 % CI −0·04, −0·003; P=0·023) in a univariate analysis was not significant after adjusting for BMI (online Supplementary Table S4). No significant interactions were found between time, serum 25(OH)D concentrations and each of sex or BMI.
Discussion
This study has shown that serum 25(OH)D concentrations are inversely associated with BMI and HOMA-IR in an adolescent and young adult population. Serum 25(OH)D concentrations were positively associated with TAG in females only. There were no significant associations between serum 25(OH)D concentrations and HDL-cholesterol or SBP.
The inverse association between deseasonalised serum 25(OH)D3 concentrations and BMI was consistent between 17 and 20 years in males, but increased over time in females. Similarly, an inverse association between serum 25(OH)D concentrations and waist circumference was identified by Gagnon et al.( Reference Gagnon, Lu and Magliano 19 ) in a prospective study of 4164 adults participating in The Australian Diabetes, Obesity and Lifestyle (AusDiab) Study and by Ganji et al.( Reference Ganji, Zhang and Shaikh 20 ) in a cross-sectional study of 5867 adolescents participating in the US National Health and Nutrition Examination Survey (NHANES).
We found a significant inverse association between serum 25(OH)D concentrations and HOMA-IR, a result that is supported by a number of other studies in children and adolescents( Reference Ganji, Zhang and Shaikh 20 – Reference Hirschler, Maccallinni and Gilligan 26 ), including the study by Ganji et al.( Reference Ganji, Zhang and Shaikh 20 ). The prospective study by Gagnon et al.( Reference Gagnon, Lu and Magliano 19 ) also found that serum 25(OH)D concentrations were inversely associated with HOMA-IR in adults. However, Nam et al.( Reference Nam, Kim and Cho 27 ) found no significant associations between serum 25(OH)D concentrations and insulin resistance or fasting glucose in a cross-sectional study of 1504 children and adolescents participating in the Korean NHANES, after adjusting for age, sex, physical activity, alcohol consumption and supplement use. Although a 6-month trial supplementing 4000 IU/d (100 μg/d) of vitamin D in thirty-five obese adolescents found significant improvements in HOMA-IR compared with placebo( Reference Belenchia, Tosh and Hillman 28 ), vitamin D supplementation trials in adults have shown mixed results on glycaemic status, insulin resistance and insulin sensitivity( Reference Beilfuss, Berg and Sneve 29 – Reference Zhu, Cai and Wang 41 ).
There may be associations between vitamin D responsiveness, vitamin D-receptor (VDR) gene polymorphisms and insulin resistance. Associations between SNP and responses in insulin sensitivity to vitamin D supplementation of 4000 IU/d (100 μg/d) were determined in eighty-one South Asian women( Reference Jain, von Hurst and Stonehouse 42 ). The improvement in insulin sensitivity was significantly greater in women with the FokI Ff genotype compared with women with the FokI FF genotype. Therefore, differences in the VDR gene may explain differences in response of insulin sensitivity to vitamin D supplementation. Further explorations of the influence of SNP on responsiveness of cardiometabolic risk factors to vitamin D intervention are warranted.
We found a positive association between serum 25(OH)D concentrations and TAG in females. Other observational studies have shown an inverse association( Reference Gagnon, Lu and Magliano 19 , Reference Skaaby, Husemoen and Pisinger 43 ), or no association( Reference Nam, Kim and Cho 27 ), between circulating 25(OH)D concentrations and TAG. However, our finding was supported by a recent randomised-controlled trial in 200 hypertensive adults with low serum 25(OH)D concentrations: Pilz et al.( Reference Pilz, Gaksch and Kienreich 44 ) showed that vitamin D supplementation significantly increased TAG compared with placebo. Although the authors hypothesised that this result was a chance finding, they noted that further validation from additional studies is warranted. In contrast, a trial in 200 healthy overweight subjects participating in a 12-month weight-reduction programme found that, compared with the placebo group, vitamin D supplementation lowered TAG but increased LDL-cholesterol( Reference Zittermann, Frisch and Berthold 45 ). We found no statistically significant associations between serum 25(OH)D concentrations and HDL-cholesterol, which is supported by the studies by Nam et al.( Reference Nam, Kim and Cho 27 ) and Gagnon et al.( Reference Gagnon, Lu and Magliano 19 ). A recent review of vitamin D supplementation and lipid profile found that most randomised-controlled trials showed no effects, or even adverse effects, on serum lipids( Reference Challoumas 46 ).
We found no independent association between serum 25(OH)D concentrations and SBP. This finding conflicts with a systematic review and meta-analysis of twenty-two cross-sectional studies and eight prospective studies (largely in adult populations), which showed that circulating 25(OH)D concentrations were inversely associated with risk of hypertension( Reference Wu, Li and Zhang 47 ). However, the results of vitamin D supplementation trials and SBP are equivocal. A meta-analysis of sixteen randomised trials on the effects of vitamin D supplementation on blood pressure in adults showed an overall non-significant reduction in both SBP and diastolic blood pressure( Reference Kunutsor, Burgess and Munroe 48 ). The trial by Pilz et al.( Reference Pilz, Gaksch and Kienreich 44 ) showed that vitamin D supplementation had no significant effect on SBP.
There is growing interest in the health effects of sun exposure beyond the synthesis of vitamin D, and it is plausible that serum 25(OH)D concentrations are merely a biomarker of previous sun exposure. Recent in vivo experiments indicate that chronic skin exposure to low-dose UV radiation (UVR) limits the development of obesity and signs of the metabolic syndrome in mice fed a high-fat diet( Reference Geldenhuys, Hart and Endersby 49 ). Skin exposure to UVR induces several immune effector molecules, and low-dose UVR irradiation of the skin has been shown to lower blood pressure in healthy volunteers, independently of vitamin D, through modulation of nitric oxide bioavailability( Reference Liu, Fernandez and Hamilton 50 ). Further investigations to elucidate the vitamin D-independent effects of low-dose exposure to UVR on cardiometabolic risk factors are warranted.
Strengths of our study include the young age of the cohort and the prospective design based on a longitudinal cohort. We were able to investigate confounders that potentially impact upon serum 25(OH)D concentrations and cardiometabolic risk factors, including race, month of birth, BMI, physical activity, family income, hormonal contraceptive use, smoking status and alcohol intake. However, despite our best efforts to adjust for confounders, we cannot rule out the possibility of residual confounding. Weaknesses of our study include the measurement of physical activity, which was not based on a validated questionnaire and may be subject to self-reporting bias. Furthermore, our assessment of physical activity did not differentiate between indoor and outdoor activities. The non-significance of physical activity in relation to cardiometabolic risk factors may reflect the limitations of the measurement, rather than the true absence of an association between physical activity and the outcome. In light of the evidence associating genetic factors with responses in insulin resistance to vitamin D supplementation( Reference Jain, von Hurst and Stonehouse 42 ), it is possible that genetic variation may modify the association between serum 25(OH)D concentrations and cardiometabolic risk factors. In our study, no data were available for genetic factors relating to vitamin D; further studies in this area would benefit from investigating factors such as the FokI Ff genotype.
Although we used the same laboratory for measuring serum 25(OH)D concentrations using LC-MS/MS methods at both follow-ups, this laboratory was not participating in an external quality control scheme at the time of analysis. Laboratories using LC-MS/MS methods have been shown to give higher results than those certified to the international standard reference method developed by the National Institute of Standards and Technology and Ghent University( Reference Black, Anderson and Clarke 51 ), which may have partly contributed to the relatively high serum 25(OH)D concentrations in our population. Given that our population of adolescents/young adults has relatively high vitamin D status in comparison with those in other countries( Reference Black, Burrows and Jacoby 52 ), our findings may not be generalisable to all populations. Furthermore, although the availability of data from two cohort follow-ups in adolescence and young adulthood enabled us to examine changes over time, we cannot infer causality in the relationship between serum 25(OH)D concentrations and cardiometabolic risk factors.
Our results show that serum 25(OH)D concentrations are independently associated with a number of cardiometabolic risk factors in adolescents and young adults, with differential effects on BMI with time between sexes. In particular, the finding that serum 25(OH)D concentrations were inversely associated with BMI and insulin resistance would suggest a cardio-protective benefit, but this may be offset by the positive association between serum 25(OH)D concentrations and TAG. Well-designed clinical trials in those with insufficient vitamin D status may be warranted to determine any causal, beneficial effect of vitamin D supplementation on insulin resistance in adolescents and young adults, while monitoring for any deleterious effect on TAG.
Acknowledgements
The authors gratefully acknowledge the Raine Study participants and their families. The authors also thank the Raine Study Team for cohort coordination and data collection.
Core funding for the Raine Study is provided by the University of Western Australia; the Faculty of Medicine, Dentistry and Health Sciences at the University of Western Australia; the Telethon Kids Institute; the Women and Infants Research Foundation; Curtin University; and the Raine Medical Research Foundation. Data collection and biological specimens at the 17-year follow-up were funded by the National Health and Medical Research Council (Programme grant ID 353514 and Project grant ID 403981) and the Ada Bartholomew Medical Research Trust. Data collection for the 20-year follow-up was funded by the National Health and Medical Research Council Project ID 1022134.
T. A. M., L. J. Beilin and W. H. O. designed the study; T. A. M., L. J. Beilin and W. H. O. conducted the study; P. G. H. provided essential reagents or provided essential materials; S. B. and L. J. Black analysed the data; L. J. Black, S. B. and T. A. M. wrote the paper; C. E. M., R.-C. H., W. C. S. P.-D., R. M. L. and P. H. H. provided critical revision of the manuscript for important intellectual content; T. A. M. had primary responsibility for the final content. All the authors read and approved the final version of the manuscript.
The authors have no potential conflicts of interest.
Supplementary Material
For supplementary material/s referred to in this article, please visit http://dx.doi.org/10.1017/S0007114516001185


