


Racial and ethnic minority populations in the USA have a heightened risk for numerous chronic diseases including obesity and the related co-morbidities, such as CVD and diabetes(Reference Kurian and Cardarelli1–Reference Sundquist and Winkleby3). Due to the strong, positive relationship between excess fat accumulation and cardiometabolic disease risk(Reference Müller, Lagerpusch and Enderle4,Reference Barreira, Staiano and Harrington5) , it is vital to thoroughly investigate body composition as a component of health in minority populations. Multi-compartment models are considered the gold standard method for analysis of body composition(Reference Wang, Deurenberg and Guo6,Reference Heyward and Wagner7) , as they allow for a molecular level assessment of several constituents of the body such as total body water (TBW), bone mineral content (BMC) and soft tissue mineral content. Multi-compartment models require a minimum of two devices to measure additional compartments of the body; although error exists for each device, the propagation of errors does not meaningfully impact the validity of multi-compartment models (total error of the measurement = 0·59–0·89 % fat)(Reference Fosbøl and Zerahn8). Therefore, multi-compartment models have been established as the criterion method for measuring body composition and validating new body composition techniques.
However, multi-compartment models may not be the most feasible or practical technique in all research and clinical settings. Therefore, single-device two-compartment models (e.g. air displacement plethysmography (ADP), bioelectrical impedance analysis/spectroscopy (BIA/BIS)) and three-compartment (3C) models (e.g. dual-energy X-ray absorptiometry (DXA)) are more commonly utilised to estimate fat mass (FM) and fat-free mass (FFM). As two-compartment models measure fewer body compartments, several assumptions must be met for accurate measures of body composition. BIA and BIS devices may be influenced by various factors including hydration, body proportion (e.g., length of limbs and trunk) and fat distribution(Reference Fosbøl and Zerahn8,Reference Heyward and Wagner9) , while ADP may be influenced by fat-free body density estimations(Reference Fosbøl and Zerahn8). Previous studies have observed slight physiological differences in these components in racial and ethnic minorities. Specifically, differences in trunk and limb length(Reference Wagner and Heyward10), FFM characteristics (e.g. TBW:FFM ratio, density of FFM)(Reference Tinsley, Smith-Ryan and Kim11), FM and FFM distribution in the trunk and limbs(Reference Hinton, Fan and Ng12), as well as differences in BMC(Reference Wagner and Heyward10,Reference Visser, Gallaoher and Deurenberg13) , and total body density(Reference Tinsley, Smith-Ryan and Kim11) have been reported. Racial and ethnic variations in body compartments may influence the ability of body composition models to accurately assess body composition.
Investigations that have evaluated the validity of body composition models in racial and ethnic minorities are limited. Few studies have used a criterion multi-compartment model to determine validity(Reference Bosy-Westphal, Schautz and Later14–Reference Gibson, Holmes and Desautels16); the majority of studies include only one racial and ethnic category(Reference Stout, Eckerson and Housh17–Reference Hicks, Heyward and Baumgartner20) and evaluate a single body composition technique(Reference Bi, Loo and Henry21–Reference Prior, Cureton and Modlesky23) which limits the ability to compare validity across multiple devices and populations. Furthermore, technology has advanced since initial validity studies were conducted, and therefore conclusions are based on outdated models and software. Validity investigations evaluating up-to-date technology in a more diverse sample may improve our ability to select the appropriate method in order to accurately assess body composition in specific racial and ethnic populations. Therefore, the purpose of this study was to assess the validity of existing body composition methods (four devices and three multi-compartment models) compared with a 4-compartment, molecular level criterion model for measures of body fat percentage (% fat) and FFM in a multi-ethnic sample stratified by race and ethnicity.
Experimental methods
Participants
One hundred and thirty-four individuals were screened for eligibility (Fig. 1). Following screening, 110 adults (55 % Female; Table 1) enrolled in the present study. Participants were stratified by self-reported race and ethnicity in the following cohorts: African American/Black (AA, n 22), Caucasian/White (W, n 22), Asian (A, n 22), Hispanic (H, n 22), Native American (NA, n 1) and Multi-racial (MR, n 21; including Hispanic and White (n 11), Hispanic and Black (n 1), Black and White (n 6), Black and Asian (n 3)). To identify race and ethnicity, participants were asked to provide paternal and maternal racial and ethnic identification and region of origin (e.g. Central America, Northern Europe, South Asia). The distribution of the sample by race and ethnicity, age and BMI (kg/m2) is displayed in Table 2. G * Power software was used to calculate sample size requirements (matched pairs t test) to ensure statistical power of 0·8 at an α level of 0·05 for analyses in the total multi-ethnic sample. A previous study by Bosy-Westphal et al.(Reference Bosy-Westphal, Schautz and Later14) assessed the validity of a bioelectrical impedance device compared with a 4C criterion model in a multi-ethnic sample (including Asian, Caucasian, Afro-American, Hispanic). The reported mean difference (MD) between methods for measures of FFM was 0·8 (sd 1·9) kg; the calculated effect size (0·42) estimates forty-seven participants would be sufficient to power analyses in the total sample. Participants were excluded if their BMI was <18·5 or >39·99, if they were pregnant or planning to become pregnant, if they had gained or lost greater than 3 kg in the previous 2 months, had been diagnosed with a musculoskeletal disease, had been diagnosed with a musculoskeletal injury limiting daily activities in the previous 3 months, actively participated in 7 d/week of resistance or aerobic training, had used anabolic steroids in previous year, had a self-identified or clinically diagnosed eating disorder or had been diagnosed with a disease that may have resulted in significant changes in TBW (e.g. renal disease) or weight status (e.g. thyroid abnormalities). This study was conducted according to the guidelines laid down in the Declaration of Helsinki, and all procedures involving human subjects/patients were approved by the University’s Biomedical Review Board. Written informed consent was obtained from all subjects/patients.

Fig. 1. CONSORT diagram.
Table 1. Participant characteristics
(Mean values and standard deviations)

% fat, body fat percentage; FFM, fat-free mass.
Table 2. Distribution of sample by BMI and age
(Frequency and percentage within each race and ethnic sample)

Experimental design
For this cross-sectional, observational study, participants reported to the laboratory for a single testing session after a 12 h fast including abstention from caffeine, alcohol and tobacco. Participants refrained from strenuous exercise for a minimum of 24 h prior to testing. Following enrolment, participants provided a urine sample to assess hydration by urine specific gravity (for inclusion, urine specific gravity had to be between 1·002 and 1·029 measured by a refractometer). A research technician measured height to the 0·1 cm using a portable stadiometer (Perspective Enterprises) and weight to the nearest 0·1 kg using a calibrated scale (Tanita Inc.). Participants then provided a saliva sample for baseline TBW estimates. Bioelectrical impedance body composition measurements were completed followed by ingestion of deuterium oxide (D2O). The remaining body composition assessments (DXA, ADP) were then completed. Three hours following ingestion of D2O, participants provided a second saliva sample for analysis of TBW. From the aforementioned procedures, FM, FFM and % fat were collected from each device (BIA/BIS, DXA, ADP) as well as calculated using multi-compartment models. The details for each model and device are described below.
Body composition
Body composition was assessed by eight existing body composition models, including two 4C models, three 3C models and 3 two-compartment models. The criterion 4C and BIS 4C model were completed using a 4C model described by Wang et al.(Reference Hinton, Fan and Ng12) (Equation 1) to determine FM.
 $${{\rm{FM}}({\rm{kg}}) = 2.748\,({\rm{BV}})-0.699\,({\rm{TBW}}) + 1.129\,({\rm{Mo}})-2.051\,({\rm{BM}}){\rm{}}}$$
where BV is the body volume (L), TBW is the total body water (L), Mo is the total body bone mineral (kg) and BM is the body mass (kg). For the criterion 4C model, TBW was assessed with deuterium dilution, BV was estimated by ADP and Mo was calculated from a total BMC measure estimated by a full body DXA scan (Mo = BMC × 1·0436)(Reference Heymsfield, Lichtman and Baumgartner25). For the BIS 4C model, TBW was assessed by bioelectrical impedance spectroscopy; BV and Mo were measured using the same procedures as the criterion. Both models are described in Table 3. The BIS 3C and D2O 3C models (Table 3) were assessed using the following 3C model(Reference Wang, Deurenberg and Guo6) (Equation 2) to determine FM.
 $${\rm{FM}}\left( {{\rm{kg}}} \right) = 2.118\left( {{\rm{BV}}} \right) - 0.780\,\left( {{\rm{TBW}}} \right) - 1.351\,\left( {{\rm{BM}}} \right)$$
Table 3. Methods for 3-compartment (3C) and 4-compartment (4C) body composition models

BV, body volume; TBW, total body water; Mo, total body bone mineral; BM, body mass; ADP, air displacement plethysmography; D2O, deuterium dilution; DXA, dual-energy X-ray absorptiometry.
For 4C and 3C models, Equations 3 and 4 were used to estimate % fat and FFM following calculation of FM.
 $$\% \;{\rm{fat}}\; = \;\left( {{{{\rm{FM}}} \over {BM}}} \right)\;{\rm{x}}\;100$$
 $${\rm{FFM}}\,\left( {{\rm{kg}}} \right) = {\rm{BM}} - {\rm{FM}}$$
The remaining body composition models estimated % fat, FM and FFM from single device measures: ADP, BIS (SFB7 ImpediMed), IB (InBody 770) and DXA.
Dual-energy X-ray absorptiometry
For each participant, a trained technician performed and analysed a full body DXA (GE Lunar iDXA; enCORE Software Version 16) scan to determine lean soft tissue, FM, BMC and % fat. Prior to testing, participants were asked to remove all metal, thick clothing and heavy plastic to reduce interference with the scan. Birth date, height, weight and race were entered into the DXA software. Participants were positioned supine in the centre of the scanning table and were instructed to remain still and breathe normally for the duration of the scan. The regions-of-interest were manually adjusted by the DXA technician.
Deuterium dilution
TBW was measured by a criterion 3-h D2O dilution protocol in accordance with the International Atomic Energy Agency guidelines for isotope dilution(Reference Davidsson26). A research technician prepared a large batch of the D2O solution composed of 5 l of tap water and 515 g of D2O. Individual doses of 58, 67, 79, 95 and 114 g were prepared to ensure an excess of at least 0·05 g 2H/kg of body mass. Based on body mass and sex, participants consumed one of the aforementioned doses of the D2O solution after providing a 2 ml baseline saliva sample. The exact dose of D2O was recorded to the nearest 0·01 g for each participant. During the 3-h equilibration period, participants were allowed to have up to 250 ml of water. The volume consumed by each participant was recorded. Three hours following ingestion, participants provided a post-saliva sample. Saliva samples were stored in −20 °C freezer until batch analysis was completed in triplicate via isotope-ratio mass spectroscopy at the University of Wisconsin Isotope Ratio Mass Spectrometry Laboratory. The baseline and D2O-enriched saliva samples were used to calculate TBW including the correction factor for non-aqueous exchange of D2O(Reference Schoeller, Van and Peterson27).
Bioelectrical impedance
Two bioelectrical impedance devices (BIS: SFB7 ImpediMed (10–500 kHz); IB: InBody 770; Biospace Co. (1–1000 kHz)) were used to assess TBW. For BIS, participants laid supine on a table with arms separated from the torso and legs separated from each other. Prior to testing, height, weight, age and sex were entered into the device, and each electrode site was cleaned with an alcohol wipe. Two electrodes were placed 5 cm apart on the dorsal side of the right wrist and hand, and two electrodes were placed on the dorsal side of the right ankle and foot for total body measures. Device default settings for resistivity coefficients, the hydration constant (0·732), body density (1·05 kg/l) and the body proportion constant (4·30) were used to estimate TBW, total body FFM and % fat. All validity conclusions are based on results obtained using the device’s default coefficients and constants.
For IB, participants were asked to stand upright for 5 min prior to measurement of TBW. Participants stood barefoot on the device with their soles in contact with the foot electrodes with legs separated and were instructed to grasp the device handles with their palm, fingers and thumb making contact with the hand electrodes. Arms were raised to separate from the torso and participants were asked to stand still during measurement. Device software automatically estimated TBW, FFM and % fat.
Air displacement plethysmography
Prior to each BV measurement, the device (BodPod®, COSMED USA, Inc.) was calibrated according to the manufacturer guidelines. Participants were asked to wear a cap and tight-fitting clothing such as a bathing suit or compression shorts, and to remove all metal including jewellery, watches and glasses prior to measurement to reduce isothermal air. Body mass was measured to the nearest 0·01 kg using the device’s included scale (Tanita Inc.). During the assessment, participants were seated in an upright position and asked to minimise movement. Body volume was measured by a minimum of two trials that were within 150 ml of each other. Thoracic gas volume was measured via manufacturer instructions. In the event measured thoracic gas volume could not be obtained in three trials (n 49), the value was estimated by the software’s standard prediction equations. Previous investigations have reported no significant differences between predicted and measured lung volume in adults(Reference Demerath, Guo and Chumlea28,Reference McCrory, Mole and Gomez29) .
Statistical analysis
Mean values and standard deviation of % fat and FFM for each model, as well as MD and CI between each model and the criterion were calculated for the entire sample and within each racial and ethnic cohort; data obtained from the one Native American enrolled were only included in full sample analyses. Total error (TE =√∑(predicted-actual)2/n), standard error of the estimate (SEE =√∑(predicted-actual)•√1-r 2) and Pearson’s correlation coefficients (r) were completed to determine the agreement of each body composition model (BIS 4C, BIS 3C, D2O 3C, ADP, DXA, IB, BIS) for estimates of % fat and FFM compared with the criterion. Subjective ratings of agreement between the model and criterion were reported according to the Heyward and Wagner(Reference Heyward and Wagner7) validity subjective rating scale. Separate paired samples t tests were also performed to evaluate the agreement between the criterion and each body composition model. To assess individual variability, Bland–Altman plots for % fat and FFM were constructed and proportional bias was assessed by linear regression analyses for each body composition model. An α level of 0·05 was set a priori. Statistical analyses were performed using SPSS (IBM Corp., IBM SPSS Statistics for Windows, Version 21.0).
Results
Multi-compartment device measures
For the total multi-ethnic sample, measures of % fat and FFM from multi-compartment models were excellent to ideal (% fat: TE = 0·94–2·37 %, SEE = 0·39–1·99 %; FFM: TE = 0·72–1·78 kg; SEE = 0·30–1·62 kg) compared with the criterion. Of the multi-compartment models, lowest error was observed for the D2O 3C, followed by the BIS 3C and BIS 4C models. All multi-compartment models demonstrated significantly different means (P < 0·001) for % fat (BIS 4C: MD (CI) = −1·5 % (−1·8, −1·1), Cohen’s d = -0·8; BIS 3C: MD (CI) = −0·9 % (−1·3, −0·50), Cohen’s d = -0·4; D2O 3C: MD (CI) = 0·8 % (0 6, 0 9), Cohen’s d = 1·1) and FFM (BIS 4C: MD (CI) = 1·1 kg (0·8, 1·4), Cohen’s d = 0·8; BIS 3C: MD (CI) = 0·7 kg (0 3, 1·0), Cohen’s d = 0·4; D2O 3C: MD (CI) = −0·6 kg (−0 7, −0 5), Cohen’s d = -1·1), compared with the criterion (% fat: 25·6 %; FFM: 54·1 kg). Bland–Altman plot analyses (Fig. 2(a)–(c)) demonstrated individual variability was smallest for the D2O 3C model (limits of agreement (LOA): −0·1 to 1·7 %). Proportional bias was present for all multi-compartment models (P < 0·05) (Fig. 2(a)–(c)).
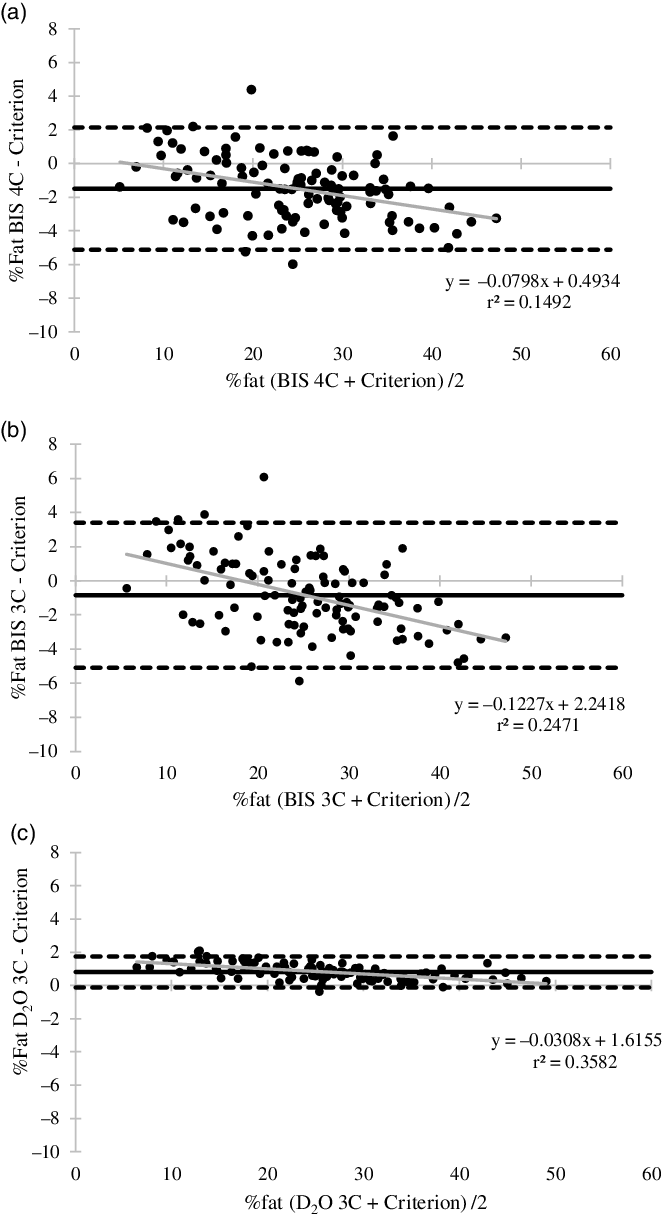
Fig. 2. Bland–Altman plot analyses and regression for multi-compartment models body fat percentage estimates. (a) Bioelectrical impedance spectroscopy 4C model (95 % limits of agreement (LOA) = −5·1–2·4 %; mean difference (MD) = −1·5 %; regression equation: P < 0·001); (b) bioelectrical impedance spectroscopy 3C model (LOA = -5·1–3·4 %; MD: −0·8 %; regression equation: P < 0·001); (c) deuterium dilution 3C model (LOA = -0·1–1·7 %; MD = 0·8 %; regression equation: P < 0·001). Black dashed line, LOA; black solid line, mean difference; grey solid line, regression line.
When stratified by race and ethnicity (Table 4), measures of % fat from the D2O 3C, BIS 4C and BIS 3C models were very good to excellent for all participants, with the highest error (TE = 2·7 %, SEE = 1 %) observed for Caucasian/White individuals. For measures of FFM, all multi-compartment models provided valid results for all races and ethnicities (Table 4). For BIS 4C, D2O 3C and BIS 3C, TE indicated FFM results were excellent to ideal.
Table 4. Validity statistics comparing the 4C criterion with four multi-compartment models for measures of body fat percentage and fat-free mass
(Mean values and standard deviations)

% fat, body fat percentage; FFM, fat-free mass; TE, total error; SEE, standard error of the estimate; 4C, four-compartment model; BIS, bioelectrical impedance spectroscopy (ImpediMed); DXA, dual-energy X-ray absorptiometry; BV, body volume; D2O, deuterium dilution; 3C, three-compartment model.
*Indicates significant difference from criterion (P < 0 05); subjective rating scale according to Heyward and Wagner(Reference Heyward and Wagner7) adapted from Lohman(Reference Lohman50).
For % fat and FFM measures in Asian and Hispanic individuals, MD were observed for all multi-compartment models compared with the criterion (Asian: % fat: 0·7–2·1 %, P < 0·05, FFM: −0·4 to 1·4 kg, P < 0·05; Hispanic: % fat: 0·8–1·8 %, P < 0·01; FFM: −0·6 to 1·3 kg, P < 0·05). For Multi-racial individuals, MD was significant between the BIS 4C % fat and FFM estimates (% fat: −1·3 %, P = 0·008; FFM: 1·0 kg, P = 0·008) and D2O 3C % fat and FFM estimates (% fat: 0·7 %, P < 0·001, FFM: −0·6 kg, P < 0·001) compared with the criterion; for Caucasians, MD was significant for BIS 4C, D2O 3C and BIS 3C (% fat: −1·8 to 1·1 %, P < 0·05; FFM: −0·to 1·4 kg; P < 0·05) compared with the criterion. In the African American/Black sample, the D2O 3C estimates demonstrated the only significant MD (% fat: 0·8 %, P < 0·001; FFM: −0·6 kg; P < 0·001). For all races and ethnicities, the BIS 4C and BIS 3C models underestimated % fat values (∼1–2 %) and overestimated FFM (∼1 kg), with the opposite relationship observed for the D2O 3C model (Table 4).
Single device measures
In the total sample, % fat measures were very good to excellent for DXA, ADP and IB (TE = 2·71 %, 2·52 %, 2·89 %; SEE = 1·53 %, 1·55 %, 2·87 %) and fairly good for BIS (TE = 4·12 %, SEE = 4·03 %). FFM estimates from DXA, ADP and IB were excellent to ideal (TE = 1·80 kg, 1·77 kg, 2·15 kg; SEE = 1·21 kg, 1·19 kg, 2·14 kg) and estimates from BIS were good to very good (TE = 3·12 kg, SEE = 3·10 kg). For the total sample, ADP and DXA had the lowest error, followed by the IB; BIS demonstrated the highest error. DXA and ADP estimates of mean % fat (DXA: MD (CI) = 2·0 % (1·5, 2·4), Cohen’s d = 0·8; ADP: MD (CI) = −1·7 % (−2·2, −1·2), Cohen’s d = -0·7) and mean FFM (DXA: MD (CI) = −1·1 kg (−1·5, −0·8), Cohen’s d = -0·6; ADP: MD (CI) = 1·2 kg (0·9, 1·5), Cohen’s d = 0·7) were significantly different (P < 0·001) compared with the criterion (% fat: 25·6 %; FFM: 54·1 kg). IB (% fat MD (CI) = −0·5 % (−1·2, 0·2), Cohen’s d = -0·1, P = 0·138; FFM MD (CI) = 0·4 kg (−0·1, 1·0), Cohen’s d = 0·2, P = 0·109) and BIS (% fat MD (CI) = −0·6 % (−1·5, 0·2), Cohen’s d = -0·1, P = 0·142; FFM MD (CI) = 0·7 kg (−0·01, 1·3), Cohen’s d = 0·2, P = 0·054) means were not significantly different from the criterion. Bland–Altman plot analyses (Fig. 3(a)–(d)) demonstrated individual variability for the total sample was greatest for the BIS % fat measures (LOA: −8·5 to 7·6 %) and smallest for the DXA (LOA: −1·2 to 5·4 %) and ADP (LOA: −5·2 to 1·4 %) devices. Proportional bias was present for BIS, DXA and ADP (P < 0·01) but not for the IB (P = 0·449) (Fig. 3(a)–(d)).
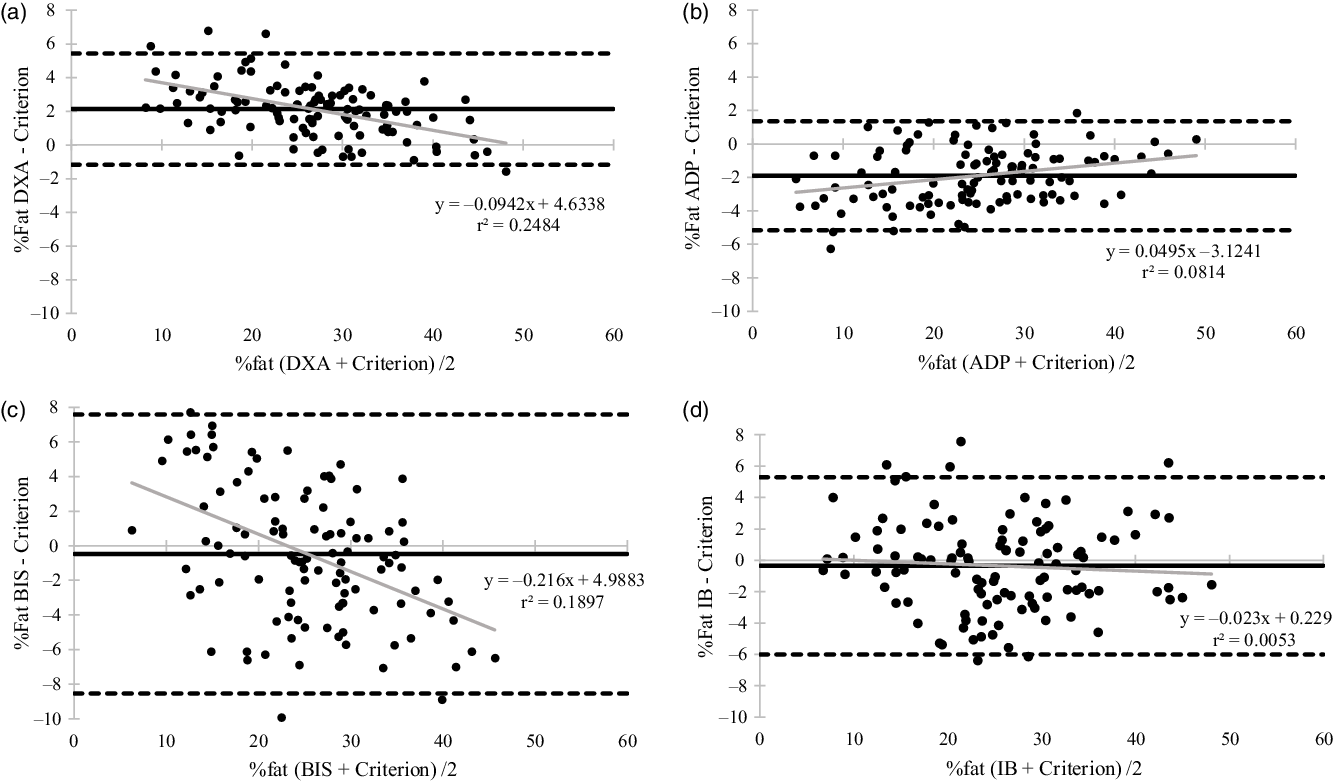
Fig. 3. Bland–Altman plot analyses and regression for single device body fat percentage estimates. (a) Dual-energy X-ray absorptiometry (95 % limits of agreement (LOA) = −1·2–5·4 %; mean difference (MD) = 2·1 %; regression equation: P < 0·001); (b) air displacement plethysmography (LOA = -5·1–1·4 %; MD = -1·9 %; regression equation: P = 0·003); (c) bioelectrical impedance spectroscopy (LOA = -8·5–7·6 %; MD = -0·5 %; regression equation: P < 0·001); (d) InBody (LOA = -6·0–5·3 %; MD = -0·4 %; regression equation: P = 0·449). Black dashed line, LOA; black solid line, mean difference; grey solid line, regression line.
When stratified by race and ethnicity, according to TE, % fat estimates for DXA were very good to excellent for all races and ethnicities (Table 5). ADP estimates were ideal to very good for all races and ethnicities according to TE. Based on TE, the BIS device estimates for % fat were fairly good to poor for African American/Black, Caucasian/White and Multi-racial samples, but performed more accurately for Asian and Hispanic participants. The IB produced more valid % fat estimates compared with the BIS for all races and ethnicities, except Asian which demonstrated similar results between devices (Table 5). IB measures were very good to excellent for Hispanic and Multi-racial participants; slightly less accurate results were observed for Asian, African American/Black and Caucasian/White individuals.
Table 5. Validity statistics comparing the 4C criterion with four single device models for measures of body fat percentage and fat-free mass

% fat, body fat percentage; FFM, fat-free mass; TE, total error; SEE, standard error of the estimate; DXA, dual-energy X-ray absorptiometry; ADP, air displacement plethysmography; BIS, bioelectrical impedance spectroscopy (ImpediMed); IB, InBody.
*Indicates significant difference from criterion (P < 0 05); subjective rating scale according to Heyward and Wagner(Reference Heyward and Wagner7) adapted from Lohman.
For FFM measures, the DXA and ADP produced excellent to ideal results for all races and ethnicities. Similar to % fat estimates, the IB FFM measures were more valid compared with the BIS ranging from good (W: TE = 2·5 kg) to ideal (H: TE = 1·8 kg); BIS estimates were between fairly good to good and very good to excellent (Table 5). Although TE/SEE results varied by race and ethnicity, all groups demonstrated significant MD (P < 0·05) for estimates from the DXA (% fat: 1·5–2·4 %; FFM: −1·5 to −0·7 kg) and ADP (% fat: −2·2 to −1·2 %; FFM: 0·7–1·7 kg) compared with the criterion (Table 5). For all races and ethnicities, there were no significant differences in % fat and FFM for the BIS (P = 0·126–0·957) and IB (P = 0·078–0·994) compared with the criterion, except for Asian individuals; the BIS was significantly different compared with the criterion (% fat: −1·4 %; FFM: 1·1 kg; P < 0·05) (Table 5). For % fat and FFM, ADP and DXA produced the most accurate estimates, followed by the IB and then BIS. For each race and ethnicity, DXA overestimated % fat (∼2 %) and underestimated FFM (∼1–2 kg), with the opposite relationship observed for ADP (underestimated % fat ∼1–2 %, overestimated FFM ∼1 kg).
Discussion
Few investigations have evaluated the validity of current body composition technology across diverse populations. Identifying the most valid body composition models and devices across varied racial and ethnic populations may improve the ability of investigators and clinicians to select the appropriate method to accurately assess body composition and understand health implications among these populations. Results did not vary meaningfully between each race and ethnicity, except BIS which performed poorly for body composition measures in African American/Black, Caucasian/White and Multi-racial samples (% fat TE = 4·3–4·9 %). The multi-compartment models evaluated can be utilised in a multi-ethnic sample, as well as in each individual race and ethnicity, to obtain highly valid results for both % fat and FFM. Estimates from DXA, ADP and IB are also valid for mean estimates. The BIS, using manufacturer provided settings (e.g. body proportion, resistivity coefficients, etc.), may demonstrate greater total error for all racial and ethnic cohorts and results should be interpreted cautiously.
Previous literature evaluating body composition validity in minority populations and multi-ethnic samples has primarily focused on single device (DXA, ADP, BIA/BIS) estimates of % fat, FM and FFM(Reference Bosy-Westphal, Schautz and Later14,Reference Collins, Millard-Stafford and Sparling30–Reference Sasai, Nakata and Nemoto32) . There are limited data comparing alternative multi-compartment models to a criterion; however, alternative multi-compartment models(Reference Gibson, Holmes and Desautels16,Reference Kupper, Bartz and Schultink33) and the DXA(Reference Vasudevan, Mohan and Mohan18,Reference Forrester, Sheehan and Joffe34,Reference Wagner, Heyward and Gibson35) are commonly used as a criterion to validate single device measures. Wang et al.(Reference Wang, Deurenberg and Guo6) evaluated several multi-compartment model estimates of FM in a multi-ethnic sample compared with 6C criterion and found disparate SEE values between 0·22–4·19 kg and MD between 0·78–4·75 kg. The models that were determined to be the most accurate incorporated a measurement of TBW and demonstrated SEE (0·97–1·08 kg) and MD (0·78–1·02 kg) values comparable to the SEE and MD observed in the present study for FFM (SEE = 0·30–1·62 kg; MD = -0·6 to 1·1 kg). The multi-compartment models in the present study performed similarly across each race and ethnicity and demonstrated excellent agreement. Bland–Altman analyses demonstrated the D2O 3C model (LOA: −0·1 to −1·7 %) had the lowest individual variability and BIS 3C (LOA: −5·1 to 3·4 %) had the greatest. The small MD, narrow LOA and ideal TE/SEE values from the D2O 3C model were likely a result of the large contribution of D2O TBW estimates to both the D2O 3C model and the 4C criterion. Proportional bias was observed for all multi-compartment models; for each model, individuals with greater % fat were significantly underestimated.
For the single device body composition measures, DXA and ADP demonstrated very good to excellent agreement for % fat, and excellent to ideal agreement for FFM measures for the multi-ethnic sample and in each race and ethnicity. However, for both devices, estimates of % fat and FFM were significantly different than the criterion. A recent study evaluating the reliability of body composition devices in adults reported standard error of the measurement values for % fat and FFM of 0·45 and 0·72 kg, respectively, for DXA and 1·28 and 1·30 kg, respectively, for ADP(Reference Schubert, Seay and Spain36). These results indicate the MD observed in the present study are beyond the sensitivity of the device, suggesting that investigators should cautiously interpret results and recognise the likelihood of a true over or underestimation of measures. The IB and BIS % fat and FFM estimates were less accurate in all races and ethnicities. However, IB did not display any proportional bias, suggesting it would perform similarly across a broad sample of individuals. Overall, devices did not perform better in Caucasian/White individuals, compared with other races and ethnicities. Validation studies that have evaluated DXA in multi-ethnic samples have demonstrated SEE values of 1·6 kg for FFM(Reference Tylavsky, Lohman and Blunt37) and 2·8 % for % fat(Reference Prior, Cureton and Modlesky23), similar to the present study results (1·8 kg, 2·7 %, respectively). In individual races and ethnicities, previous literature has reported smaller MD (−0·2 to −0·3 % fat)(Reference Wagner and Heyward38,Reference Collins, Millard-Stafford and Evans39) and similar TE (2·39 %)(Reference Wagner and Heyward38) for African American/Black participants and slightly larger MD (2·1–4·2 %)(Reference Deurenberg-Yap, Schmidt and van Staveren40) in Asian individuals compared with the present study. Previous literature has not established DXA validity in Hispanic and Multi-racial individuals. For ADP, studies investigating multi-ethnic samples have reported SEE values of 2·7 %(Reference Fields, Wilson and Gladden41) and MD ranging from −1·8 to 2·4 % for % fat(Reference Fields, Wilson and Gladden41–Reference Lowry and Tomiyama43), similar to the present study (SEE = 1·55 %; MD = 1·9 %). However, these studies had very small minority representation (7–30 % of sample) and only included African American/Black and Asian participants. For Hispanic cohorts, to our knowledge, validity studies have only included Mexican individuals and found SEE results (% fat: −1·4 %; FM: 2·3 kg)(Reference Alemán-Mateo, Huerta and Esparza-Romero22,Reference Alemán-Mateo, Romero and Morales31) , similar to our findings (SEE = 1·2 %), but smaller MD (% fat: −0·99 %) compared with a 3C criterion than the present study (MD: 2·4 %)(Reference Alemán-Mateo, Romero and Morales31). Body fat percentage results in the present study demonstrated better agreement between ADP and a 4C criterion for African American/Black participants (SEE = 1·6 %, MD = 1·8 %) compared with previous literature in a younger male population (SEE = 4·7 %; MD = -3·6 %)(Reference Collins, Millard-Stafford and Evans39). In Asian participants, ADP has primarily been validated against a DXA criterion, which makes comparison difficult; however, SEE (2·6 % v. 1·6 %)(Reference Sasai, Nakata and Nemoto32) and MD (−3·9 % v. 2·1 %)(Reference Bi, Loo and Henry21) values were larger than the current study.
Several studies have investigated the validity of BIA devices(Reference Bosy-Westphal, Schautz and Later14,Reference Forrester, Sheehan and Joffe34,Reference Chen, Jiang and Yang44,Reference Aglago, El and El45) ; however, few have utilised a multi-compartment criterion for comparison(Reference Bosy-Westphal, Schautz and Later14,Reference Deurenberg and Deurenberg-Yap46,Reference Stolarczyk, Heyward and Goodman47) . Similar to the present study, Bosy-Westphal et al.(Reference Bosy-Westphal, Schautz and Later14) investigated the validity of FFM measures in Hispanic, Caucasian, African American and Asian participants and reported MD values of 0·4, 0·7, 1·5and 0·7 kg, respectively, and TE values of 1·9, 2·1, 2·2 and 1·9 kg, respectively. These results align with the IB TE and MD values reported in the present study, but are smaller than BIS error observed in this study. In a larger sample of Asian individuals (n 298), SEE (4·5 %) was larger than both bioimpedance devices in the present study (2·7–3·1 %). An older study evaluating BIA FFM estimates compared with a 4C model in Hispanic females reported variable results depending on the specific regression equation utilised(Reference Stolarczyk, Heyward and Goodman47); overall results demonstrated lower SEE (1·3–2·0 kg) compared with BIS, similar SEE compared with IB and similar TE (1·6–3·2 kg) to both devices in the current study. To our knowledge, only one study has evaluated the validity of the IB device compared with a 4C criterion, although the 4C equation utilised bioelectrical impedance technology as opposed to isotope dilution. This study evaluated 146 African American, Caucasian and Hispanic individuals and reported larger TE (5·1–5·5 %) and SEE (4·8–5·2 %) values than the current study for the total sample(Reference Gibson, Holmes and Desautels16). Within each race and ethnicity, MD results were similar for African American/Black individuals (−0·34 %) and larger for Caucasian/White (−2·13 %) and Hispanic (1·4 %) participants compared with our study findings. Results from the current study suggest the BIS, which is commonly used in clinical settings(Reference Kim, Shin and Hwang48,Reference Lim, Han and Il49) , should be evaluated in larger, multi-ethnic populations to ensure validity.
Bioelectrical impedance devices, which demonstrated the largest TE and SEE for all races and ethnicities, require several assumptions regarding body proportion, body density and resistivity of tissue(Reference Fosbøl and Zerahn8). A previous investigation in our laboratory (Blue et al. – unpublished) observed significantly different relative arm and leg lengths between races and ethnicities; African American/Black participants had longer arms and legs compared with Asian and Caucasian/White individuals. Device estimates may be improved by allowing users to incorporate a measure of limb length or utilising a different body proportion coefficient. Additional components that may influence BIA/BIS measures such as fat distribution, fat-free body density, total body density and TBW:FFM ratio should be investigated further to determine if adjusting standard coefficients and algorithms may improve accuracy when evaluating a broad, diverse sample.
Although this study enrolled a diverse sample, there are limitations to address. There was not sufficient enrolment of Native American individuals; race-specific analyses could not be completed and thus results are not generalisable to Native American participants. Additionally, the sample size did not allow for analyses to be evaluated by sex within each racial and ethnic group. To improve generalisability within Hispanic and Asian samples, a single country or region of origin was not selected; however, the diversity within those racial and ethnic categories (e.g. East Asian v. South Asian) suggests future studies should evaluate ethnic groups separately. Furthermore, future studies should aim to include multiple sites to improve the ability to enroll Native Americans and a larger cohort of racial and ethnic minorities.
The current study results suggest the multi-compartment models evaluated should be utilised to obtain the most valid results for both % fat and FFM in a multi-ethnic sample, as well as in each individual race and ethnicity. As TBW is a large component of multi-compartment models, utilising isotope dilution provided the most valid estimates (D2O 3C), even beyond models that measured an additional body constituent (e.g., Mo in BIS 4C model). Additionally, results suggest that single device estimates from DXA and ADP are valid for mean estimates, but individual variability may be high. IB and BIS devices demonstrated the greatest error compared with all other models; BIS estimates were not valid in African American/Black, Caucasian/White and Multi-racial samples when utilising the manufacturer’s default settings. To our knowledge, this is one of the first studies to include individuals who identify as more than one race and ethnicity; results for this cohort were similar to the other races and ethnicities. Overall, the most accurate estimates for all races and ethnicities were obtained from D2O 3C, BIS 4C, BIS 3C (TE = 0·9–2·4 %), followed by DXA, ADP, IB (TE = 2·5–2·9 %) and then BIS (TE = 4·12 %). Results did not vary significantly between races and ethnicities, except for BIS which was less accurate for African American/Black, Caucasian/White, Multi-racial individuals.
Acknowledgements
This study was supported by the National Strength and Conditioning Association Foundation.
All authors approved the final manuscript version and contributed as follows: conceptualization (M. N. M. B., A. E. S. R.), methodology (M. N. M. B., A. E. S. R., G. M. T., B. K. N., E. D. R., D. P.), funding acquisition (M. N. M. B., A. E. S. R.), investigation (M. N. M. B., K. R. H., G. J. B., H. E. C., L. M. G., A. E. S. R.), formal analysis (M. N. M. B., A. E. S. R.), writing original draft (M. N. M. B., A. E. S. R.), and reviewing and editing (all authors).
There are no conflicts of interest.


