Combating anaemia or Fe deficiency requires a cohesive approach, as its occurrence is suggested to be multifactorial. Fe supplements have been widely used to correct Fe deficiency in at risk groups, whereas in the general population either modification of the diet or Fe fortification in selected food vehicles may be implemented( 1 ). Dietary modification requires long-term objectives, and evidence from recent experimental trials has shown that Fe fortification, which is considered a medium-term strategy( Reference Pasricha, Drakesmith and Black 2 ), will not completely improve general Fe status, whilst the efficacy of oral Fe supplementation in improving Fe status is often limited by low adherence as a result of adverse events following supplementation( Reference Souza, Batista Filho and Bresani 3 ). The measurement of different Fe parameters is fundamental to determining of Fe status, due to a broad spectrum which extends between Fe deficiency and Fe overload, which both occur due to the failure of Fe homoeostasis, and causes flaws at functional and structural levels( 4 ). The presence of anaemia can be confirmed with a single biomarker of Hb concentration, whilst measurement of ferritin concentration is deemed to be the best measurement to identify Fe deficiency( Reference Lopez, Cacoub and Macdougall 5 ), on condition that there is no presence of inflammation( 6 ). Hepcidin has been reported to be a systemic Fe regulator( Reference Andrews and Schmidt 7 ), and a clearer understanding of the interaction between inflammation, erythropoiesis, and hypoxia, which are regulated by hepcidin, may benefit in designing effective Fe interventions that may result in fewer adverse events( Reference Pasricha, Drakesmith and Black 2 ). Understanding of this interaction may require clinical laboratory-based Fe interventions that are focused on measuring hepcidin and designed to be implemented in a specific population, instead of the general population( Reference Pasricha, Drakesmith and Black 2 ).
Vitamin D, a secosteroid hormone, which exists in two major forms (D3 and D2)( Reference Holick, Binkley and Bischoff-Ferrari 8 ) has recently been implicated in the stimulation of erythroid precursors and ultimately rate of erythropoiesis( Reference Yoon, Kim and Yoo 9 ). An in vitro study carried out in human cell lines demonstrated that administration of 25-hydroxyvitamin D (25(OH)D) and 1,25-dihydroxyvitamin D (1,25(OH)2D) for 6 h led to a 50 % reduction in hepcidin mRNA expression( Reference Bacchetta, Zaritsky and Sea 10 ), supporting the postulated hypothesis that hepcidin suppression may facilitate Fe status regulation by increasing Fe uptake and storage. Evidence from a pilot human study using seven healthy subjects, supplemented with single oral dose of vitamin D2 (2500 µg), supports the in vitro findings and showed that serum hepcidin concentration was significantly reduced by 34 % following 24 h (P<0·05) and by 33 % after 72 h (P<0·01) of supplementation. However, serum ferritin concentration, which signifies Fe stores, was found to have significantly decreased( Reference Bacchetta, Zaritsky and Sea 10 ). A small sample size limits interpretation of the findings; however, the significant decline observed in serum hepcidin concentration, in addition to the evidence from the in vitro study( Reference Zughaier, Alvarez and Sloan 11 ) warrants larger-scale investigations.
To the best of our knowledge, limited and inconsistent published evidence exists supporting the link between concurrent incidence of Fe and vitamin D deficiencies in the normal population, as previous studies were predominantly carried out in kidney disease, heart failure or diabetic patients( Reference Han, Kim and Kim 12 ). There is a paucity of randomised controlled trials (RCT), investigating the effect of the vitamin D supplementation administered routinely, as an Fe absorption enhancer on Fe status, especially in populations at risk of Fe deficiency. The present study integrates the two strategies of supplementation and fortification to treat Fe deficiency using vitamin D3 supplements in combination with the consumption of Fe-fortified foods, in premenopausal UK women with low Fe stores. Based on the existing evidence from observational, human interventions and in vitro studies, anaemia was clearly associated with the incidence of vitamin D deficiency, though no clear mechanism has been identified( Reference Sim, Lac and Liu 13 ). The proposed theory, however, revolves around the mechanism of action of vitamin D that affects hepcidin expression, pro-inflammatory cytokine production, and rate of erythropoiesis( Reference Sim, Lac and Liu 13 – Reference Ernst, Tomaschitz and Grübler 16 ). We hypothesise that vitamin D supplementation will exert further improvement in haematological indices, and the measurement of plasma hepcidin concentrations, parathyroid hormone (PTH) and vitamin D binding protein (VDBP) concentrations will enable the investigation of a potential mechanism linking vitamin D and Fe deficiencies.
Methods
Subjects
Fifty premenopausal women aged 19–49 years were recruited to the study using posters, emails and press releases as a recruitment medium at the University of Chester and the wider city of Chester, UK. The inclusion criteria were females, healthy and non-pregnant or lactating. Exclusion criteria were history of gastrointestinal and metabolic disorders, blood donation within the past 6 months and regular consumption of nutritional supplements.
Sample size
Sample size was estimated using serum ferritin concentrations (µg/l) from a double-blind placebo-controlled study carried out in previous study in women aged 20–40 years with serum ferritin concentrations of <22 µg/l( Reference Scholz-Ahrens, Schaafsma and Kip 17 ). The study was designed to determine the effect of 8 weeks Fe-fortified milk supplementation on Fe stores. The study found no significant difference in mean serum ferritin concentration at baseline between the Fe-fortified group (13·3 (sd 6·9) µg/l) and the control group (12·6 (sd 6·8) µg/l) (P=0·69). At post-intervention, mean serum ferritin concentrations were significantly higher (17·7 (sd 11·9) µg/l) in the Fe-fortified group, compared with 10·6 (sd 8·1) µg/l in the control group (P=0·01). With a Cohen’s effect size (d) of 0·7, the total sample size required in the present study was 26 per group (power=0·80, α error probability=0·05). Allowing for a 20 % dropout rate, the total sample size required was estimated to be 62 (thirty-one subjects/group). The sample size was estimated using of G-Power Software (version 3.1.7).
Recruitment and screening
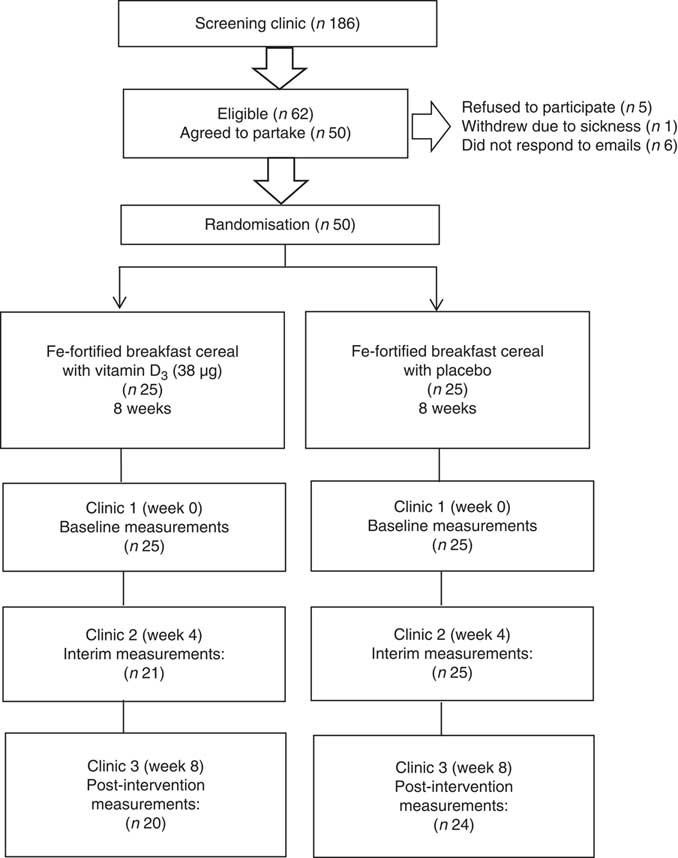
A total of 186 women attended the initial screening clinics and sixty-two were eligible based on the plasma ferritin concentration threshold of <20 µg/l to define marginal Fe deficiency and plasma 25(OH)D concentration of <250 nmol/l. However, twelve of the eligible subjects withdrew from participating in the study. The reasons were sickness (n 1), did not respond to the invitation email (n 6) and declined to participate following the screening session (n 5). After screening, fifty subjects were included and randomised.
Study design
A placebo-controlled, double-blind RCT was carried out for a period of 8 weeks. The data collection phase was between September 2015 and April 2016. The study design consisted of two phases. Phase 1 was the recruitment and screening phase when potential subjects were screened for Fe deficiency. Phase 2 was the intervention phase where all subjects consumed Fe-fortified breakfast cereal, together with either vitamin D3 supplements (vitamin D group) or placebo (placebo group) daily, for 8 weeks. This study was conducted according to the guidelines laid down in the Declaration of Helsinki, and all procedures involving human subjects were approved by the Faculty of Life Sciences Research Ethics Committee (FREC reference: 1078/15/SF/CSN). Written informed consent was obtained from all subjects. The present study was registered at ClinicalTrials.gov (trial registry number: NCT02714361 – www.clinicaltrials.gov).
Phase 1 (screening)
All subjects attended a screening clinic to ascertain plasma ferritin concentration, which was used to indicate physiological Fe stores in the present study. During the screening clinic, 4 ml of blood was collected in a lithium heparin blood collection tube at the clinical laboratory within the Department of Clinical Sciences and Nutrition, at the University of Chester by the researcher, a trained phlebotomist. The plasma sample collected was used to determine the concentration of ferritin and 25(OH)D. Eligible subjects were then invited to continue to phase 2 of the study. Subjects who had abnormally high plasma ferritin concentrations from the screening (n 2) were excluded from study and were advised to arrange a consultation with their general practitioner.
Phase 2 (intervention)
A total of fifty subjects who were eligible to participate in the study were randomised to receive either 38 µg of vitamin D3 or placebo. Both groups were instructed to consume an Fe-fortified breakfast cereals with either vitamin D3 or a placebo, daily for 8 weeks. The subjects were also provided with ultra-high temperature (UHT) semi-skimmed milk and were required to consume 60 g of pre-weighed Fe-fortified cereals provided in sealed plastic containers with 200 ml of milk every day morning for the duration of the study. Subjects were instructed to consume the vitamin D3 capsules or placebo capsules with 200 ml of water daily, in the evening, for the duration of the study. All subjects were reminded not to modify their dietary habits and physical activity, in addition to abstaining from donating blood during the course of the study.
Study clinics
Subjects were all required to attend clinics after overnight fasts of approximately 8 h and were expected to attend three clinics in total. Subjects were asked to consume only water during the overnight fast. Each clinic lasted approximately 30 min and took place between 08.00 and 10.00 hours. Details of each clinic are as follows:
Clinic 1 (week 0, baseline): height (cm) was measured using a digital stadiometer and body weight (kg) measured using weighing scales, followed by collection of a 30 ml fasted venous blood sample collection. Subjects were given a 3-d food diary to be completed within the first week and returned at the next clinic. A 4-week supply of both Fe-fortified breakfast cereals in individually pre-weighed sealed plastic containers and UHT semi-skimmed milk was provided to the subjects, together with a supplement bottle, containing 8 weeks of supplements with assigned subject identity (ID). The protocol was explained to subjects and an email reminder was sent to the subjects 1 d before the following clinic.
Clinic 2 (week 4, interim): body weight was measured and a 30 ml fasted venous blood was drawn. Subjects were given a further 3-d food diary to be completed during the week before the final clinic and the previous food diary was collected. A further 4-week supply of Fe-fortified breakfast cereals and UHT semi-skimmed milk was provided to the subjects.
Clinic 3 (week 8, post-intervention): body weight was measured and a 30 ml fasted venous blood was drawn. The final 3-d food diary and supplement bottle with any remaining capsules, for assessment of the compliance, were collected.
Randomisation and blinding of subjects
The randomisation process was carried out using computer-generated software (www.randomization.com) by a third party, independent to the study. Subjects (n 50) were randomised to two groups: vitamin D3 (vitamin D group) or placebo (placebo group). The third party allocated sixty-two capsules of vitamin D3 and placebo into each identical supplement bottle, according to the generated plan. An excess of six capsules in each bottle enabled the researcher to estimate compliance once the study was completed. Each tamper-proof bottle was then sealed and numbered, ready to be provided to subjects.
The subjects and researcher were blinded to which groups subjects were assigned to. The researcher administered the numbered supplement bottle (i.e. 001) to the subjects based on the sequence that subjects attended their baseline clinic (week 0). The blinding was maintained throughout the study period of 8 weeks and allocation was not unlocked until the end of the data analysis.
Iron-fortified breakfast cereals
The Fe-fortified breakfast cereal used in the study was a commercially available whole grain rice and wheat flakes cereal (Weight Watchers UK Ltd). Both breakfast cereal and UHT semi-skimmed milk were provided to the subjects at clinics 1 and 2. Subjects were instructed to consume one pre-weighed tub of cereal (60 g) containing approximately 9 mg of Fe with 200 ml of UHT semi-skimmed milk (Tesco PLC), daily. Each subject was also given a measuring cup to measure approximately 200 ml of UHT semi-skimmed milk to consume with the cereal, to ensure standardisation of meal consumed by each subject. It was emphasised during the first clinic that the subjects needed to consume the cereal daily. However, in the event of missing a tub of the provided cereal, it was advised that the cereal was consumed immediately or double the amount the following day.
Subjects were asked to record and report any problems regarding consumption of the provided cereal during the interim clinic (week 4) and were requested to notify researcher of any adverse events during the course of study. The specific cereal was selected as it is fortified with Fe, and previous Fe-fortified cereal studies have reported the use of between 7 and 18 mg of total Fe. A total of 9 mg Fe in the present study provides approximately 60 % of the reference nutrient intake per d for women aged 19–50 years( 18 ). The nutritional content of the breakfast cereal as stated on the product label is shown in Table 1.
Table 1 Nutritional composition of iron-fortified breakfast cereal*

* Nutritional composition information sourced from the product label.
Vitamin D supplement and placebo
The supplement used was vitamin D3 cholecalciferol (38 µg, 1500 IU; Pharma Nord ApS) liquefied in cold-pressed olive oil and encapsulated in a clear soft gel 7 mm diameter capsule. Each capsule was made of a combination of olive oil, gelatine, glycerol and purified water. The supplements were packaged in blister packs and manufactured specific to the research requirement and according to pharmaceutical standards (European Commission (EC) and Scandinavia).
The matching placebo was custom produced to the requirement of the study by Pharma Nord. Placebo was identical to the gel capsule in appearance, size, colour and taste but without the active ingredients. A certificate of analysis provided by the manufacturer confirmed the vitamin D content of supplements (36·6 μg, with limits 30·4–57 μg).
Assessment of compliance
Compliance to the supplementation (%) was estimated as follows: (62 – remaining capsules in the bottle)/56×100. For the total duration of 8 weeks, subjects were required to consume fifty-six capsules of vitamin D3 or placebo.
Anthropometric measurements
Height (cm) and weight (kg) were measured using electronic scales (model 875 SECA) and a wall-mounted digital stadiometer (model 264 SECA) at baseline and repeated at subsequent clinics as previously described. The instruments used were calibrated before every measurement. BMI was then calculated using the equation: BMI=weight (kg)/height (m2) and categorised using threshold values from the WHO.
Blood handling
Both whole blood and plasma obtained from the venepuncture were used for analysis. The blood sample was collected in lithium heparin and EDTA blood collection tubes (BD Company) for blood biomarker analysis. Whole blood was used immediately after each clinic to measure full blood counts. Venous blood samples collected were centrifuged for 10 min (1600 g ) at 4°C to obtain plasma samples required for Fe and vitamin D biomarker assays, which were then aliquoted into microcentrifuge tubes and stored at –80°C before being used for analysis. Plasma samples were used to analyse Fe status biomarkers (C-reactive protein (CRP), ferritin, soluble transferrin receptor (sTfR) and hepcidin) and vitamin D metabolism biomarker (25(OH)D, PTH and VDBP) concentrations.
Measurement of iron and vitamin D biomarkers
Whole blood samples were used to measure full blood count indices using an automated Ac.T diff haematology analyser (Beckman Coulter Inc.). The intra-assay CV for this measurement was 1·9 %.
Plasma samples were used for the analysis of ferritin and 25(OH)D concentrations using a miniVIDAS automated immunoanalyser (Biomerieux), with the detectable range of >1·5 µg/l and 20·3 nmol/l, respectively. The analytical reliability of 25(OH)D assay in miniVIDAS automated analyser used in the present study achieved the set performance target by vitamin D external quality assessment scheme, with intra-assay CV of 4·7 and 2·0 % for ferritin and 25(OH)D, respectively. A number of plasma samples were re-analysed using 25(OH)D ELISA kit (Calbiotech Inc) (n 32 samples from nineteen participants) and human ferritin ELISA kit (Elabscience Biotechnology Co. Ltd) (n 3 samples from two participants), as the concentrations were below the detectable range of the miniVIDAS immunoanalyser. Plasma CRP, hepcidin, sTfR and VDBP concentrations were each measured using commercially available human ELISA kits specific to each biomarker (Quantikine Human Immunoassay ELISA Kit; R&D Systems Inc.); and plasma PTH concentrations were measured using commercially available human ELISA kits (Calbiotech Inc). The intra-assay CV were 11·3 % (25(OH)D), 12·9 % (ferritin), 2·7 % (CRP), 11·5 % (hepcidin), 5·0 % (sTfR), 11·3 % (VDBP) and 7·0 % (PTH).
Assessment of dietary intake
Subjects were required to complete a 3-d food diary during the first and last weeks of the intervention (to include two weekdays and one weekend day) to estimate their habitual dietary intake. The diary comprised instructions on how to appropriately record dietary intakes, including a guide to portion sizes, how to describe the foods/drinks in detail, together with a sample diary. In each section of the diary, there were columns for time of consumption, location, description of food/drink consumed, brand and amount/quantity for the subjects to complete. Subjects were also requested to specify any physical activity performed during that particular day. If the foods/drinks consumed were home-made, there were also recipe sections provided for the subjects to specifically note in the diary.
Dietary records were analysed for nutritional content using Nutritics Professional Nutrition Analysis Software (Nutritics Ltd). The food items used for the analysis were derived from McCance and Widdowson’s ‘The Composition of Foods’( 19 ). The dietary reference values (DRV) from the Committee on Medical Aspects of Food Policy 1991( 18 ) in combination with the Scientific Advisory Committee on Nutrition (2015)( 20 ) were used as a reference to compare the intake of energy, macro- and micronutrients of the subjects.
Statistical analysis
All statistical analyses were performed using IBM SPSS Statistic Data Editor Software (version 21; IBM Corporation). Shapiro–Wilks or Kolmogorov–Smirnov tests were used to determine the normal distribution of data as appropriate. Descriptive statistics were used to describe frequencies, means and standard deviations. Baseline comparisons between the groups (vitamin D and placebo groups) were carried out using the independent t test for normally distributed data or the Mann–Whitney test for non-normally distributed data. Mixed-model repeated-measures ANOVA was performed to determine the effect of intervention and the interaction with time points for all Fe status and vitamin D status blood biomarkers. Post hoc analyses were carried out when intervention×time point interactions were observed, to identify the differences within or between the groups. Changes in all Fe status and vitamin D status blood biomarkers from baseline (week 0) to post-intervention (week 8) between the two groups were compared and analysed using the independent t test for normally distributed data or the Mann–Whitney test for non-normally distributed data. Sub-group analyses (n 32) were carried out in subjects with a plasma ferritin thresholds of <15 µg/l to ascertain whether the severity of Fe deficiency influenced subjects’ Fe status response. Pearson’s or Spearman’s correlation coefficient tests were performed as appropriate, to investigate the association between (i) baseline concentration of Hb and 25(OH)D with changes in Fe status biomarkers and vitamin D biomarkers and (ii) Fe and vitamin D biomarkers. Differences and associations were considered significant with a P value ≤0·05 (two-sided).
Results
Baseline characteristics of subjects
Of a total of 186 women screened, sixty-two were eligible and fifty women commenced the study. Four subjects dropped out after the first clinic due to feeling unwell (n 2) or without specific reason and did not respond to emails (n 2). A further two subjects dropped out after the interim clinics due to ill health; therefore, forty-four subjects completed the intervention. The baseline characteristics are reported based on the data available for the total of fifty subjects (including drop-outs). Fig. 1 shows a flow diagram of study phases.

Fig. 1 Flow diagram of the screening and intervention phases.
The baseline characteristics of subjects are summarised in Table 2. The subjects recruited were aged between 19 and 49 years, with a mean age of 27·4 (sd 9·4) years. The majority of subjects were white (80 %), followed by Asian (12 %) and others (8 %). The mean plasma ferritin and 25(OH)D concentrations were 11·5 (sd 5·6) µg/l and 38·3 (sd 21·4) nmol/l, respectively. This indicates that the subjects were largely Fe deficient (plasma ferritin <15 µg/l, n 32)( 21 ) and vitamin D deficient (Institute of Medicine deficient threshold of plasma 25(OH)D <30 nmol/l, n 31)( Reference Ross, Taylor and Yaktine 22 ) at screening and eligible for the study. The mean plasma 25(OH)D concentration did not change from screening to when eligible subjects commenced the study at baseline (P=0·205), which ranged between 5 and 10 d. On the contrary, a higher mean plasma ferritin concentration was observed at baseline (13·2 (sd 7·8) µg/l) compared with screening (11·5 (sd 5·6) µg/l) (P=0·012). The concentrations of both plasma ferritin and 25(OH)D were not corrected for inflammation, as no subjects had elevated plasma CRP concentrations (<10 mg/l) at all time points, indicated by mean of <4 mg/l in both groups.
Table 2 Baseline physical characteristics, iron and vitamin D status and dietary intake of subjects (n 50) (Mean values and standard deviations)

25(OH)D, 25-hydroxyvitamin D.
* Significant difference between the vitamin D and the placebo group at baseline. The independent t test or the Mann–Whitney test was used depending on normal distribution of data.
There were no significant differences in the subjects’ baseline physical characteristics (height, weight and BMI) between the vitamin D group and the placebo group. No significant differences were observed in subjects’ Fe and vitamin D status (Hb, plasma ferritin, plasma hepcidin and plasma 25(OH)D concentrations) between the vitamin D group and the placebo group at baseline. With reference to dietary intake, no significant differences were detected in energy, protein, carbohydrate, fat, Fe, vitamin D, Ca and vitamin C intake between the vitamin D group and the placebo group, except for carbohydrate (as percentage of energy). When excluding dropouts (n 6) from the analysis, no significant differences were found in physical characteristics, Fe and vitamin D status and dietary intakes at baseline between the two groups.
Different thresholds were used to classify anaemia (Hb <110 g/l), Fe deficiency (plasma ferritin <15 µg/l) and vitamin D deficiency (plasma 25(OH)D <30 nmol/l). Prevalence of anaemia, Fe deficiency and vitamin D deficiency at baseline were 12 % (n 6), 64 % (n 32) and 62 % (n 31), respectively. It was observed that 13 % of the vitamin D-deficient participants were also anaemic and a higher proportion were Fe deficient (61 %). This indicates the possible association between Fe status and vitamin D status, which has been shown in previous observational studies.
Compliance and adverse events
Overall mean compliance of supplementation was 92·9 (sd 8·0) %, indicating good compliance. Compliance was similar in both groups with 93·2 % in the vitamin D group compared with 92·6 % in the placebo group. No subjects reported any adverse events associated with the consumption of supplements.
The consumption of Fe-fortified breakfast cereal was examined using the diary recorded by the subjects during the first and last weeks of the intervention. All subjects recorded consumption of the provided Fe-fortified cereal at breakfast every day in both diaries, indicating good compliance. There were also no adverse events reported by the subjects connected to the cereal consumption.
Effect of vitamin D supplementation on iron and vitamin D status biomarkers
No increase was observed in the concentrations of the two main Fe status biomarkers: Hb and haematocrit level from baseline (week 0) to post-intervention (week 8) in the vitamin D group, compared with the placebo group (Table 3). Fig. 2 shows the improvement in Hb concentration (4 g/l) in the vitamin D group was significantly higher compared with the placebo group (–3 g/l) (P=0·037). The improvement in haematocrit level was also significantly higher in the vitamin D group (1·8 %) compared with the placebo group (–0·5 %) (P=0·032). In the vitamin D group, consumption of vitamin D3 supplements with the Fe-fortified cereals, however, did not impact the other Fe status biomarkers including erythrocytes, mean corpuscular volume (MCV), mean corpuscular Hb (MCH), mean corpuscular Hb concentration (MCHC), plasma ferritin, plasma hepcidin and plasma sTfR, compared with the placebo group.
Table 3 Effect of intervention on iron and vitamin D status biomarkers from baseline to post-intervention (n 44) (Mean values and standard deviations)
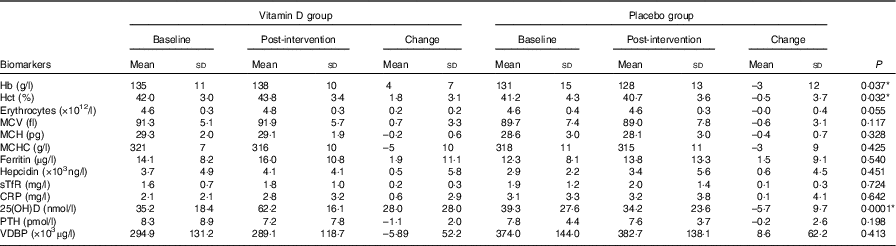
Hct, haematocrit; MCV, mean corpuscular volume; MCH, mean corpuscular Hb; MCHC, mean corpuscular Hb concentration; sTfR, soluble transferrin receptor; CRP, C-reactive protein; 25(OH)D, 25-hydroxyvitamin D; PTH, parathyroid hormone; VDBP, vitamin D binding protein.
* Significant difference in changes from baseline (week 0) to post-intervention (week 8) observed between the vitamin D and placebo groups. The independent t test or the Mann–Whitney test was used depending on normal distribution of data.
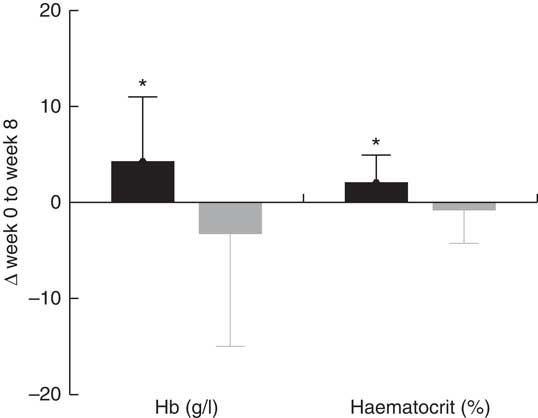
Fig. 2 Effect of intervention on mean Hb concentration and haematocrit level from baseline (week 0) to post-intervention (week 8). Values are means, with standard deviations represented by vertical bars. Mean change in Hb concentration (4 g/l) and haematocrit level (1·8 %) are significantly higher in the vitamin D (![]() ) group compared with the placebo (
) group compared with the placebo (![]() ) group. * Represents significant difference from the placebo group (P<0·05).
) group. * Represents significant difference from the placebo group (P<0·05).
Effect of vitamin D supplementation on vitamin D status biomarkers
As expected, plasma 25(OH)D concentration was significantly higher in the vitamin D group, compared with the placebo group at 4 weeks and post-intervention, relative to baseline. The increase from baseline to post-intervention in plasma 25(OH)D concentration in the vitamin D group (28·0 nmol/l) was significantly higher than the change in the placebo group (–5·7 nmol/l) (P=0·0001) (Table 3). From the total number of forty-four subjects who completed the study, the increase from baseline to 4 weeks in plasma 25(OH)D concentration in the vitamin D group (23·1 nmol/l) was also significantly higher than the change in the placebo group (0·2 nmol/l) (P=0·0001). In addition, the increase at post-intervention from 4 weeks in the vitamin D group (5·0 nmol/l) was also significantly higher than the change in the placebo group (–5·9 nmol/l) (P=0·003) (mean (sd) not shown in Table 3 and online Supplementary Table). However, no significant difference was observed between the vitamin D group and the placebo group in plasma PTH and plasma VDBP concentrations.
Time effect of the intervention within each group on iron and vitamin D status biomarkers
In the vitamin D group, mean Hb concentration was significantly higher at post-intervention (138 (sd 10) g/l) compared with the baseline (136 (sd 12) g/l) (P=0·035) (online Supplementary Table). No significant difference in Hb concentration was observed within the placebo group, between each time point. In the vitamin D group, mean haematocrit level was significantly higher at post-intervention (43·8 (sd 3·4) %) compared to both baseline (42·5 (sd 3·2) %, P=0·017) and 4 weeks (42·7 (sd 3·2) %, P=0·044). No significant difference in haematocrit level was observed within the placebo group, between each time point.
In the vitamin D group, the mean erythrocyte count was significantly higher at post-intervention (4·8 (sd 0·3)×1012/l) compared with the baseline (4·6 (sd 0·3)×1012/l) (P=0·007). No difference in erythrocyte count was observed within the placebo group, between each time point. In the vitamin D group, mean MCHC was significantly lower at post-intervention (316 (sd 10) g/l) compared with both baseline (320 (sd 8) g/l, P=0·028) and 4 weeks (320 (sd 8) g/l, P=0·032). No difference in MCHC was observed within the placebo group, between each time point.
Difference within groups in MCH was observed in both groups. In the vitamin D group, mean MCH was significantly lower at post-intervention (29·1 (sd 1·9) pg) compared with 4 weeks (29·3 (sd 1·8) pg) (P=0·017). In the placebo group, mean MCH was significantly lower at post-intervention (28·1 (sd 3·0) pg) compared with both baseline (28·7 (sd 3·0) pg, P=0·008) and 4 weeks (28·7 (sd 3·0) pg, P=0·0001).
No significant difference was observed within both groups in MCV, plasma ferritin, plasma hepcidin and plasma sTfR concentrations, between each time point. Based on a WHO ferritin normal threshold of >15 µg/l, there were ten subjects in the vitamin D group who had an increase in their plasma ferritin concentrations from baseline to 4 weeks. The number of subjects who had increased plasma ferritin concentrations was slightly higher (n 13) from the 4 week time point to post-intervention, to an overall mean plasma ferritin concentration of 16·0 (sd 10·8) µg/l which is within the normal range. A similar trend was observed in the placebo group; however, the majority of the subjects in the placebo group (n 16) remained Fe deficient at post-intervention, indicated by an overall mean plasma ferritin concentration of 13·8 (sd 13·3) µg/l.
A sub-group analysis carried out in subjects who were Fe deficient based on a plasma ferritin threshold of <15 µg/l at baseline showed no significant effect of vitamin D3 supplementation on all biomarkers of Fe status.
Association between different variables of iron and vitamin D biomarkers
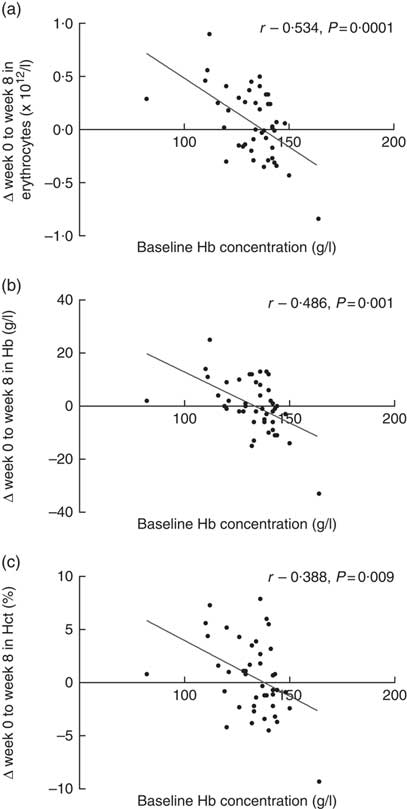
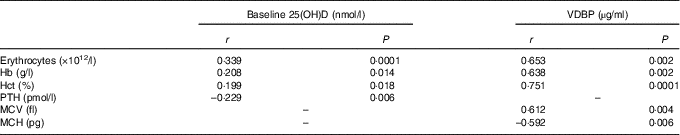
Baseline Hb concentrations were found to have a significant impact on the subjects’ response to Fe-fortified breakfast cereal consumption (Fig. 3). The more anaemic the subjects were at baseline, the greater the improvement in erythrocyte counts, Hb concentrations and haematocrit levels. Strong and moderate inverse associations between baseline Hb concentration and change in erythrocytes, Hb concentration and haematocrit levels were noted. No significant association was observed between baseline plasma ferritin concentrations with any of the changes in Fe status biomarkers. However, we acknowledge that if vitamin D stimulates erythropoiesis, it will draw on both endogenous reserves and stimulate dietary Fe and this is indistinguishable in the present study. However, a strong and positive association was observed between plasma ferritin and plasma hepcidin concentrations (r 0·605, P=0·0001, data not shown), indicating the role of hepcidin in suppressing Fe uptake once the subjects’ Fe stores are replete. Positive associations were observed between baseline plasma 25(OH)D concentrations with erythrocyte count, Hb concentration and haematocrit level as well as a significant inverse association with plasma PTH concentration, as expected (Table 4). Interestingly, improvement in plasma VDBP concentrations was found to be strongly associated with the recovery of several key full blood count indices (Table 4).
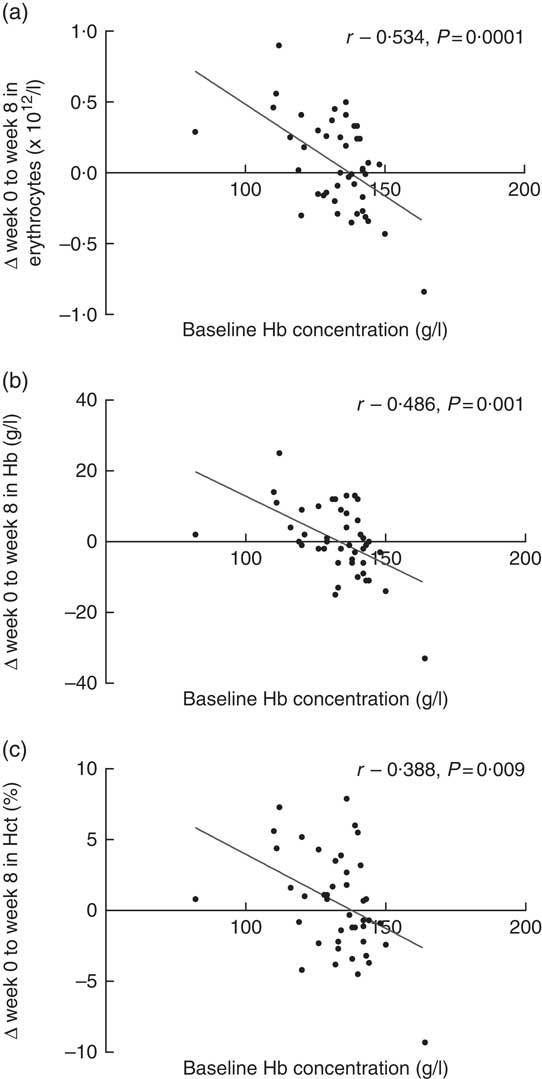
Fig. 3 Association between baseline Hb concentrations, and change from baseline (week 0) to post-intervention (week 8) in (a) erythrocyte count, (b) Hb concentration and (c) haematocrit (Hct) level (n 44).
Table 4 Association between iron and vitamin D biomarkers (n 44)
25(OH)D, 25-hydroxyvitamin D; VDBP, vitamin D binding protein; Hct, haematocrit; PTH, parathyroid hormone; MCV, mean corpuscular volume; MCH, mean corpuscular Hb.
Dietary iron intake following vitamin D supplementation and iron-fortified cereal consumption
Increases in dietary Fe intake were expected in both intervention groups, as both received Fe-fortified cereals. However, changes in both groups were non-significant. In the vitamin D group, mean dietary Fe intake was 16·5 (sd 1·8) mg/d at baseline and 16·8 (sd 2·3) mg/d at post-intervention (0·3 mg/d, P=0·6); and in the placebo group, dietary Fe intake was 16·6 (sd 2·7) mg/d at baseline and 17·5 (sd 2·9) mg/d post-intervention (1·0 mg/d, P=0·134).
Discussion
We investigated the effect of vitamin D3 supplementation on Fe status with a dose of 38 µg consumed with an Fe-fortified breakfast cereal (9 mg). To the best of our knowledge, this is the first RCT reporting the increase in two key haematological indices: Hb concentrations and haematocrit levels following consumption of vitamin D with Fe-fortified foods indicated by increased Hb concentrations and haematocrit levels.
Hb concentrations reflect the presence or absence of anaemia and oxygen-carrying capacity required for normal cell functions, whilst haematocrit levels indicate the proportion of circulating erythrocytes relative to the whole blood total volume. The shifts (increase or decrease) in these two key indices of Fe status are typically interrelated( Reference George-Gay and Parker 23 ). The change in Hb concentration (4 v. –3 g/l, P=0·037) and haematocrit levels (1·8 v. –0·5 %, P=0·032) were significantly higher in the vitamin D group as opposed to the placebo group. It was observed that these two biomarkers were improved in the vitamin D group, whilst diminishing in the placebo group, suggesting that daily consumption of Fe-fortified cereal with vitamin D supplements, compared with only Fe-fortified cereal, may exert an additional beneficial effect on Fe status.
Studies carried out in clinical settings among Fe-deficiency anaemia and hypertensive patients( Reference Ernst, Tomaschitz and Grübler 16 , Reference Sooragonda, Bhadada and Shah 24 ) or healthy adults( Reference Madar, Stene and Meyer 15 ) observed no improvement in Hb or serum ferritin concentrations. However, Hb concentration and haematocrit levels were found to be significantly higher in the intervention group at 8 weeks in a Fe/vitamin D fortification study by Toxqui et al. ( Reference Toxqui, Pérez-Granados and Blanco-Rojo 25 ), but no significant impact on any Fe status biomarkers was observed in a Ca/vitamin D fortification study by Hennigar et al. ( Reference Hennigar, Gaffney-Stomberg and Lutz 26 ). Mean baseline concentration of Hb was 134 (sd 14) g/l, and seven of the subjects (n 50, vitamin D=3, placebo=4) were anaemic based on the WHO threshold of <120 g/l( 21 ).
A greater improvement in these biomarkers may have been observed with a higher proportion of anaemic subjects at baseline; however, it was evident in the present study that the baseline concentration of Hb dictates the subjects’ response to the intervention. It was previously demonstrated in a meta-analyses by Casgrain et al. ( Reference Casgrain, Collings and Harvey 27 ) that participants’ response to Fe intervention vastly depends on their initial Fe status and that the improvement is greater in anaemic participants, as the Fe requirements are higher due to physiological demands. The mean baseline concentration of plasma 25(OH)D was also found to influence the response to intervention. Greater improvement was observed in the erythrocyte counts, haematocrit levels and Hb concentrations, if the subjects were vitamin D deficient at baseline. Factors such as (i) amounts/form of Fe and vitamin D used in the study (low/high/none or fortification/supplementation), (ii) duration of interventions or (iii) baseline characteristic that defines anaemia or vitamin D deficiency using different thresholds, contribute to inconsistencies in published findings.
The active metabolite of vitamin D, calcitriol, has recently been demonstrated in pilot human studies to play a role in the suppression of the hepcidin expression, which is dictated by a gene known as antimicrobial peptide (HAMP)( Reference Bacchetta, Zaritsky and Sea 10 , Reference Smith, Alvarez and Kearns 14 ). Vitamin D has been demonstrated in previous studies to be capable of increasing proliferation of erythroid precursors in the bone marrow to support erythropoiesis by decreasing the expression of pro-inflammatory cytokines which cause the suppression of hepcidin. Decreased cytokines and suppressed hepcidin lead to higher Fe bioavailability for erythrocyte production and Hb synthesis( Reference Smith, Alvarez and Kearns 14 ).
The mechanism of action of vitamin D in exerting additional effects on the recovery of Fe status was proposed to revolve around suppression of hepcidin expression, pro-inflammatory cytokine production and rate of erythropoiesis. Under normal circumstances, Fe homoeostasis involves the circulation of transferrin-Fe complexes that move to the bone marrow to produce erythrocytes in erythropoiesis. The senescent erythrocytes will degenerate and will be engulfed by macrophages. Fe is then reutilised and released back into the circulation to repeat the same erythropoiesis process( Reference Smith, Alvarez and Kearns 14 ). Depending upon physiological demands, haem and non-haem dietary Fe will enter the labile Fe pool from intestinal Fe uptake and when increased concentrations of pro-inflammatory cytokines are present, production of the erythrocytes in the bone marrow is suppressed. This will then lower the half-life of erythrocytes as a result of elevated macrophages and phagocytic activity activation. IL-6 and IL-1β are among the cytokines that are capable of stimulating the liver into increasing the production of the HAMP gene, which leads to increased or decreased Fe uptake( Reference Smith, Alvarez and Kearns 14 ).
Observational studies in different populations previously reported the concurrent incidence of both vitamin D deficiency and anaemia( Reference Han, Kim and Kim 12 , Reference Shin and Shim 28 ). Whilst it is evident that hepcidin is the principal Fe regulator, the underpinning mechanism of the action of vitamin D on Fe status is unclear, as there are very limited evidence in humans and are largely from in vitro and in vivo studies.
We hypothesise that the action of vitamin D on the recovery of Fe status occurs via a mechanism by which vitamin D suppresses plasma hepcidin expression, leading to an increase in ferroportin availability for Fe uptake, and ultimately increases plasma ferritin concentration in subjects with low Fe stores. A recent in vivo study observed that a single bolus oral ingestion of 2500 µg vitamin D2 led to a significant decrease in serum hepcidin concentrations at 24 h (34 %, P<0·05) and 72 h (33 %, P<0·01)( Reference Bacchetta, Zaritsky and Sea 10 ). Vitamin D also potently decreased the transcription of the HAMP gene that regulates hepcidin expression; however, no significant improvement in Fe stores was observed following supplementation, which is likely due to the inclusion of healthy Fe replete subjects at baseline in the study. A further in vitro study reported at least a 15-fold suppression of the HAMP gene in a monocyte cell line (Tamm–Horsfall protein 1; THP-1) after 6 h of treatment with 1,25(OH)2D( Reference Zughaier, Alvarez and Sloan 11 ), indicating the direct action of vitamin D on HAMP gene transcription. The in vivo part of the study in which thirty-eight kidney patients were supplemented with vitamin D3 (1250 µg) found a moderate, significant, negative association between the serum hepcidin and serum 25(OH)D concentrations (r –0·38, P=0·02)( Reference Zughaier, Alvarez and Sloan 11 ).
The findings from the present study showed that vitamin D supplementation led to improvement in two key indices of Fe status Hb and haematocrit and are consistent with limited published evidence( Reference Toxqui, Pérez-Granados and Blanco-Rojo 25 ).
Hepcidin expression was suppressed in a vitamin D supplementation study (carried out without any Fe intervention)( Reference Smith, Alvarez and Kearns 14 ) and in an earlier study( Reference Bacchetta, Zaritsky and Sea 10 ) in an attempt to investigate the underlying mechanism behind the action of vitamin D on Fe regulation. Both studies did not observe a significant effect of the vitamin D intervention on the improvement of Fe stores, indicated by plasma ferritin concentrations, which is consistent with the present study. On the contrary, the present study did not observe any significant influence of vitamin D intervention on hepcidin expression, as reported in previous studies( Reference Bacchetta, Zaritsky and Sea 10 , Reference Smith, Alvarez and Kearns 14 ). However, five subjects had increased Hb concentrations, haematocrit levels and simultaneously decreased hepcidin concentrations. In this group of subjects, mean Hb concentration and haematocrit level were significantly higher at post-intervention (137 (sd 15) g/l; 44·1 (sd 5·0) %) compared with baseline (127 (sd 13) g/l; 39·5 (sd 3·2) %) (P=0·042; 0·043), simultaneously with significant reduction in hepcidin concentration from 8·1 (sd 8·0) ng/ml at baseline to 3·1 (sd 3·3) ng/ml at post-intervention (P=0·043). However, five subjects who had increases in both Hb concentrations and haematocrit levels did not show a reduction in hepcidin concentrations.
The present study observed a strong association between plasma hepcidin and plasma ferritin concentrations; however, both biomarkers were not affected by vitamin D supplementation. The vitamin D3 dose used in the present study may have been a limitation and was not sufficient to substantially affect hepcidin expression; thus, no improvement was observed in the recovery of Fe stores indicated by plasma ferritin concentrations. Also, the vitamin D used in the present study may have not been sufficient to act on both biomarkers in a relatively short study duration of 8 weeks, to allow for a substantial effect to be observed.
An intriguing finding in the present study was the strong link between VDBP concentration and Fe status improvement, which has not been identified previously. Improvement in plasma VDBP concentrations was strongly associated with the recovery of the erythrocyte counts (r 0·653, P 0·002), MCV (r 0·612, P=0·004), haematocrit levels (r 0·751, P=0·0001), Hb (r 0·638, P=0·002) and MCH concentrations (r –0·592, P=0·006). On the basis of this observation, further substantial restoration may be observed in other Fe status biomarkers, especially plasma hepcidin and plasma ferritin concentrations, if a higher dose of vitamin D is used. Similar studies by Bacchetta et al. ( Reference Bacchetta, Zaritsky and Sea 10 ) and Smith et al. ( Reference Smith, Alvarez and Kearns 14 ) used much higher doses of vitamin D in single boluses of 2500 µg vitamin D2 and 6250 µg vitamin D3, respectively. VDBP is known for its role as a 25(OH)D transporter, and Dastani et al. ( Reference Dastani, Berger and Langsetmo 29 ) previously demonstrated an association between 25(OH)D and VDBP. This observation is sufficient to connect the action of vitamin D with improvement of Fe status, and warrant further investigation.
The subjects’ energy, macronutrients, Fe and vitamin D intake were unchanged from baseline to post-intervention. Interestingly, the mean daily Fe intake of subjects, in particular, was 1·7-fold higher at baseline, relative to typical Fe intake of adult women reported in the UK National Diet and Nutrition Survey( Reference Bates, Lennox and Prentice 30 ). This increased intake remained higher at post-intervention. This may be due to the fact that participants may have increased their intake of Fe-containing foods after being informed of their Fe-deficient status following screening but before they commenced the study. Despite reduction in the placebo group, the present study also demonstrated the effectiveness of Fe-fortified breakfast cereal (irrespective of vitamin D intervention) on raising principal Fe biomarkers which is in agreement with the recent findings( Reference Quintero-Gutiérrez, González-Rosendo and Pozo 31 – Reference Karl, Lieberman and Cable 34 ).
The present study shows that concurrent incidence of both vitamin D and Fe deficiency exists in women with low Fe stores, and the clinical aspects of the findings may potentially be applied to the recovery of Fe status in Fe-deficient population at a healthcare level through the therapeutic use of vitamin D supplementation as a novel Fe absorption enhancer. Fe-fortified breakfast cereals were found to be efficient as a food fortification vehicle, which could be a suitable adjunct in the management of Fe deficiency. One limitation of the study was the failure to attain required sample size, with a shortfall of eight participants due to twelve eligible subjects who decided not to partake in the study following screening. A major strength of the present study is the double-blind RCT study design carried out in a specific population of marginal and low Fe stores, which allows interpretation of findings to be extrapolated in clinical settings and included specific measurement of vitamin D biomarkers which was not measured in previous studies.
In conclusion, vitamin D, consumed daily in supplement form, at a dose of 38 µg (1500 IU), was shown to lead to the recovery of Hb concentrations and haematocrit levels in female subjects with marginal and low Fe stores. The finding in the present study that shows baseline concentration of Hb plays a role in dictating subjects’ response to intervention adds to and strengthens the existing published literature. The study also demonstrated concurrent incidence of both Fe and vitamin D deficiencies in subjects, supporting the findings from observational studies carried out in various settings, and was the basis of the postulated hypothesis related to vitamin D mechanism of action on Fe status regulation. A strong link between VDBP up-regulation and Fe status improvement, which has not been recognised previously, was also identified and merits further investigation.
Acknowledgements
The authors would like to thank the subjects for their time and participation in this study.
This research received no specific grant from any funding agency, commercial or not-for-profit sectors.
S. M. designed the research; S. F. A. F. conducted the research and analysed the data; S. M. and S. F. A. F. composed the article; S. M. had primary responsibility for final content. Both authors read and approved the final manuscript.
There was no conflict of interest.
Supplementary material
For supplementary material/s referred to in this article, please visit https://doi.org/10.1017/S0007114519000412