


National surveys have shown that the proportion of older adults within most populations (defined as those >60 years) is increasing, and by 2050 global projections indicate that the number of older adults worldwide will be more than 2 billion (21 % of the population)( 1 ). With such profound shifts in demographics also comes the corresponding increase in the prevalence of the chronic diseases of ageing including CVD, cognitive impairment and associated co-morbidities( Reference Lim, Vos and Flaxman 2 ). Maintenance of optimal nutritional status has been cited as an achievable goal in preventing or delaying the development of chronic disease( Reference Reedy, Krebs-Smith and Miller 3 ), and recent emphasis has been placed on the protective roles of micronutrients, including the B-vitamins.
Both vitamin B12 (B12) and folate are essential co-factors in intracellular one-carbon metabolism, which is involved in DNA synthesis, cellular regulation processes and amino acid metabolism( Reference Selhub 4 ). Both vitamins are thought to be associated with cardiovascular health and cognitive function. A recent meta-analysis (n 82 334) indicated a 10 % lower risk of stroke and a 4 % lower risk of overall CVD with folic acid (FA) supplementation( Reference Li, Huang and Zheng 5 ), whereas in a longitudinal study of older adults (>60 years, n 501) higher concentrations of vitamin B12 were associated with a decreased rate of brain volume loss over 6 years( Reference Hooshmand, Mangialasche and Kalpouzos 6 ). Estimates of vitamin B12 deficiency in older populations range from 5 to 40 %, depending on the marker of measurement and the deficiency cut-off selected( Reference Andrès, Loukili and Noel 7 ). The consequences of a B12-deficient state can include the development of megaloblastic anaemia, irreversible demyelinating neurological disease/paresthesias and the potential for impaired immune and cognitive function( Reference Stabler 8 ). Hence, the early detection of deficiency and awareness of the factors that can affect B12 status is important. In terms of folate, since the introduction of mandatory FA fortification of grains in the USA to reduce the incidence of neural tube defects, the prevalence of deficient and low folate status in the US population has substantially decreased( Reference Pfeiffer, Caudill and Gunter 9 ). Conversely, there is an accompanying increased incidence of high blood folate concentrations (>45 nmol/l), which has led to concerns of potential adverse effects, especially when combined with low vitamin B12 status, as frequently observed in older adults( Reference Morris, Jacques and Rosenberg 10 ).
To date, mandatory FA fortification does not occur in the European Union (EU). Uniquely within the EU, however, both Ireland and the UK have a voluntary but liberal food fortification policy that includes FA. The foods most commonly fortified with FA are breakfast cereals, but not all are fortified( Reference Hennessy, Walton and Flynn 11 , Reference Flynn, Anderson and Burke 12 ). In addition, there are reports of varying degrees of FA enrichment of foods, and enrichment also appears to be inconsistent across time and across products( Reference Kelly, Gibney and Boilson 13 ). Moreover, foods that are fortified or rich in B12 are not necessarily consumed by the older population. For instance, dairy foods, which are a particularly good source of B12, are only consumed in the recommended amounts by only 4 % of older Irish adults( Reference Laird, Casey and Ward 14 ).
A recent Irish National Survey that previously examined vitamin B12 and folate status was limited to a small number of older adults and had a narrow range of demographic and clinical data( Reference Hopkins, Gibney and Nugent 15 ). Therefore, the aims of this study were (i) to report the B12 and folate status of a large, nationally representative sample of the older Irish population (n >5000) and (ii) to investigate the demographic, socio-economic, geographic, seasonal, health and lifestyle determinants of these vitamin concentrations in this population, which is subject to a voluntary, but liberal, food fortification policy.
Methods
Study population
Participants were recruited as part of The Irish Longitudinal Study on Ageing (TILDA), a nationally representative cohort of community-dwelling adults aged ≥50 years, designed to investigate how the health, social and economic circumstances of the older Irish population interact in the determination of ‘healthy’ ageing. Full details of the study design, sampling and methodology have been published previously( Reference Kearney, Cronin and O’Regan 16 , Reference Whelan and Savva 17 ). The first wave of data collection (Wave 1) was conducted between October 2009 and July 2011, using a stratified clustered procedure to randomly sample postal addresses from the Irish Geo-Directory (a listing of all residential addresses in the Republic of Ireland). All postal addresses in Ireland were assigned to one of 3155 geographic clusters using RANSAM (a random sampling design for Ireland) where all household residents aged ≥50 years were eligible to participate; a sample of 640 of these clusters was selected, stratified by socio-economic group and geography to maintain a population representative sample. Clusters were selected with a probability proportional to the number of individuals aged ≥50 years in each cluster. At Wave 1, 8175 adults completed a computer-aided personal interview (CAPI) (response rate of 62 %). Approximately 72·1 % (n 5895) consented to, and participated in, a health assessment that included donating a blood sample. In total, folate measurements were available for 90·7 % (n 5350) and B12 measurements were available for 88·5 % (n 5219) of these participants. Missing data were randomly dispersed across clusters and were generally because of sample assay failures or insufficient sample volume. The study was conducted according to the guidelines set out in the Declaration of Helsinki, and ethical approval was granted by the Faculty of Health Sciences Research Ethics Committee of Trinity College Dublin.
Lifestyle and supplement use
During the CAPI, data were collected regarding sex, age, province of residence (Leinster – East/South East; Munster – South/South West; Ulster and Connacht – North and West), habitation status (living alone yes/no), current smoker status (yes/no), current alcohol status (yes/no) and household housing wealth (measure of economic resource ‘asset wealth’ coded above or below the average for the sample). A list of up to twenty medications including both prescription and non-prescription medications and dietary/vitamin supplements were recorded by interviewers. Once entered into the data set, they were assigned WHO Anatomical Therapeutic Chemical Classification codes and binarised to yes/no for FA supplement use (single tablet or multi-vitamin) and for use of vitamin B12 (injection or single tablet or B12 in multi-vitamin). Classification codes were also binarised to yes/no for the commonly prescribed medications of older adults, which have been associated with B-vitamin concentrations including metformin, proton pump inhibitors (PPI), statins and thyroxin medications( Reference Lam, Schneider and Zhao 18 , Reference Ham, Enneman and van Dijk 19 ). Self-reported physical activity was assessed by the International Physical Activity Questionnaire (IPAQ). Physical activity levels were also dichotomised and defined according to the IPAQ categories: physically active=minimally or health enhancing physically active; not physically active=inactive or insufficiently active. During the health assessment, anthropometric measurements including height (to the nearest 0·01 m) and weight (to the nearest 0·01 kg) were measured with Seca™ (Seca Ltd) using a standardised protocol. BMI was then calculated and obesity was classified as a BMI >30 kg/m2. Seasonality was examined and defined as winter (December through February), spring (March through May), summer (June through August) and autumn (September through November).
Blood samples
A non-fasting blood sample was collected by venepuncture into one 10-ml K2EDTA tube (BD, Becton, Dickinson Limited) by a trained phlebotomist. Samples were kept chilled and centrifuged (3000 rpm for 15 min) and aliquots were labelled and stored at −80°C until required for analysis. Plasma total B12 and folate concentrations were determined by microbiological assays, as previously described( Reference Molloy and Scott 20 , Reference Kelleher and Broin 21 ). The inter-assay CV for plasma B12 and folate were <10·9 %. B12 status profiles (pmol/l) were defined as follows: <148, deficient; 148–<185, low; 185–<258, low normal; >258–601, normal; and >601, high( Reference Bailey, Carmel and Green 22 , Reference Arendt and Nexo 23 ). Folate status profiles (nmol/l) were defined as follows: <6·8, deficient; 6·8–10·0, low; >10–23·0, low normal; >23·0–45·0, normal; >45·0, high( Reference Selhub, Morris and Jacques 24 ). These cut-offs were selected to allow for comparison with previous studies and to give an indication of the population range.
Statistical analyses
Base population weights were calculated by comparing TILDA with the 2011 Irish Census with respect to age, sex, educational attainment, marital status and urban v. rural residence (weights reflected the reciprocal of the selection probability). The staged stratified clustering sample design of TILDA was accounted for when computing CI and standard errors. Prevalence estimates and descriptive statistics were adjusted using modified base weights that accounted for survey non-response, non-attendance at the health assessment component of the study and whether or not respondents provided a blood sample. TILDA participants with plasma total B12 and folate concentrations more than 3 sd above the mean or who were missing data on other covariates were excluded from the analysis, resulting in 5158 results for total B12 and 5290 results for plasma folate (the +3 sd cut-off was applied to remove outlying high values, likely attributable to measurement error). Weighted prevalence estimates are reported as percentages with 95 % CI. Weighted geometric means are presented along with B12 and folate concentrations categorised by the stated biomarker cut-offs, stratified by the population characteristics. Pairwise comparisons of proportions by B12 and folate status cut-offs were computed across variables of interest, and false-discovery rate correction for multiple comparisons was applied (P<0·041, achieving q<0·05). Multiple linear regression estimated the effects of health, lifestyle, geographic and socio-economic factors on B12 and folate concentrations. Multiple imputation (twelve cycles) was used to impute missing information on asset wealth in the final statistical models (information was missing for <5 % of participants). All analyses were carried out using STATA 14 (StataCorp).
Results
The population characteristics of the TILDA cohort have been published comprehensively elsewhere( Reference Kearney, Cronin and O’Regan 16 , Reference Whelan and Savva 17 ). In short, of the participants included in this combined analysis, the mean age was 63·6 years (age range 50–98) and 53 % were female. The proportion who reported currently consuming alcohol was 76·8 %, whereas 15·6 % were current smokers. The prevalence of reported combined B12 supplementation (injection and/or supplements) was 2·6 %, with women reporting significantly higher usage than men (3·5 v. 1·7 %; P<0·001, respectively). The prevalence of FA supplementation was 2·8 %, with significantly more women than men reporting supplementation use (3·6 v. 2·0 %; P<0·001, respectively).
Prevalence of biomarker status
The estimated distribution of both B12 and folate status by age group is displayed in Fig. 1. The prevalence of deficient or low B12 status was 12 %, whereas 15 % had deficient or low folate status. High B12 status (>601 pmol/l) was observed in 3·1 % of the population, whereas 8·9 % had high folate status (>45 nmol/l). The prevalence estimates by demographic and lifestyle factors are displayed in Table 1 for total B12 and Table 2 for plasma folate. Participants reporting supplement use had significantly higher concentrations of both total B12 and folate and had lower rates of deficiency compared with non-supplement users. For both biomarkers, men had significantly lower concentrations as did the oldest old (>80 years) (P<0·001). For both total B12 and folate, those who were obese, smoked or reported lower mean asset wealth had significantly lower biomarker concentrations and higher rates of deficiency/low status. Seasonality was also significantly associated with both biomarker concentrations (P<0·001). Concentrations of total B12 were the highest in spring and the lowest in summer (318·9 v. 304·5 pmol/l), whereas plasma folate concentrations were also the highest in spring but lowest in autumn (19·5 v. 16·4 nmol/l) (but we note that in the regression analyses, the effects of seasonality were only robust for folate concentrations in autumn v. winter). When examined by geographic area, participants residing in the North and West of the Island (Connaught and Ulster) had lower plasma folate compared with those living in the East and South East (Leinster region) (16·2 v. 21·1 nmol/l). For medications, only metformin use was associated with lower total B12 concentrations (272·9 v. 315·7 pmol/l; P<0·0001) and a higher prevalence of B12 deficiency (11·0 v. 4·8 %; P<0·0001). There were no statistically significant differences in the concentration of total B12 or folate by statin, PPI or thyroid medication use (data not shown).
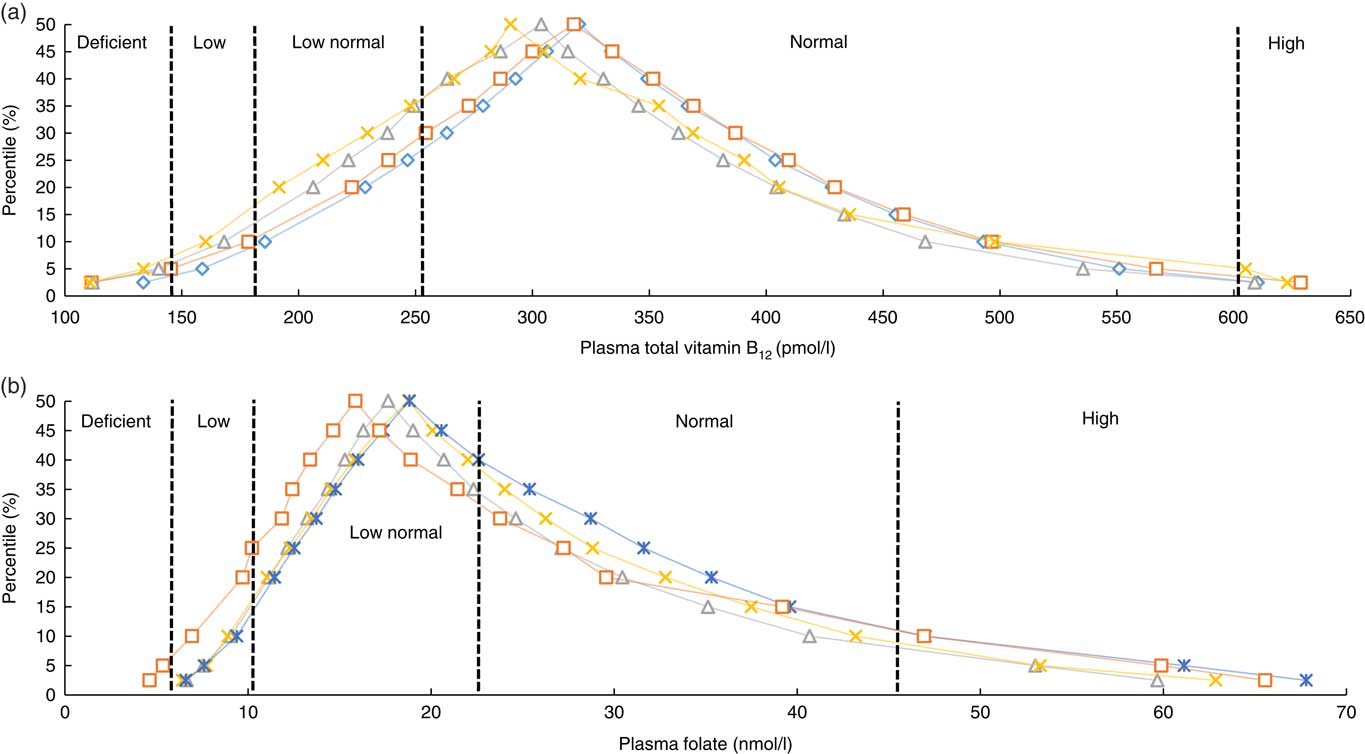
Fig. 1 Frequency distribution of plasma total vitamin B12 (a) and folate (b) of older Irish adults from the Irish Longitudinal Study on Ageing study by age group. a: ![]() , 50–59;
, 50–59; ![]() , 60–69;
, 60–69; ![]() , 70–79;
, 70–79; ![]() , >80; b:
, >80; b: ![]() , 50–59;
, 50–59; ![]() , 60–69;
, 60–69; ![]() , 70–79;
, 70–79; ![]() , >80.
, >80.
Table 1 Mean plasma total vitamin B12 with weighted prevalence of status by demographic and lifestyle characteristics† (Weighted means and prevalence estimates and 95 % confidence intervals)
* Statistically significant after adjustment for multiple comparisons (P<0·041).
† P values indicate statistically significant pairwise comparisons of the difference in proportion of column criteria across row variables. For variables with more than two levels linear regression was used.
Table 2 Mean plasma folate with weighted prevalence of status by demographic and lifestyle characteristics† (Weighted means and prevalence estimates and 95 % confidence intervals)
* Statistically significant after adjustment for multiple comparisons (P<0·041).
† P values indicate statistically significant pairwise comparisons of the difference in proportion of column criteria across row variables. For variables with more than two levels linear regression was used.
Regression analyses
In a multiple linear regression analysis (Table 3), the largest positive predictor of total B12 concentration was self-reported B12 injection and/or supplement use (coefficient 51·5 pmol; 95 % CI 9·4, 93·6; P=0·016). This was closely followed by being female and geographic location (North and West v. East and South East). The largest negative predictor was metformin medication use (−33·6; 95 % CI −51·9, −15·4; P<0·001). Other smaller negative predictors included smoking and obesity. FA supplement use was not a significant predictor of total B12 concentrations. The largest positive predictor of plasma folate concentration was FA supplement use (6·0 nmol/l; 95 % CI 3·0, 9·0); P<0·001) followed by being female and statin medication use (Table 4). The largest negative predictor was geographic location (North, West and South v. East and South East; P<0·001) followed by data being sampled in the autumn, smoking and obesity.
Table 3 Determinants of plasma total vitamin B12 concentrations (pmol/l) in older Irish adults (Regression coefficients and 95 % confidence intervals)
PPI, proton pump inhibitors.
* Obesity=BMI >30 kg/m2.
† Physical activity levels were defined by IPAQ categories.
‡ Vitamin B12 injections or vitamin B12-containing supplements (including multi-vitamins) were defined by the use of the World Health Organization’s Anatomical Therapeutic Chemical codes.
Table 4 Determinants of plasma folate concentrations (nmol/l) in older Irish adults (Regression coefficients and 95 % confidence intervals)
PPI, proton pump inhibitors.
* Obesity=BMI >30 kg/m2.
† Physical activity levels were defined by IPAQ categories.
‡ Folate-containing supplements (including multi-vitamins) were defined by the use of the World Health Organization’s Anatomical Therapeutic Chemical codes.
Discussion
To our knowledge, we are the first to present prevalence data for B12 and folate status and their determinants in a large representative sample of the older Irish population. In a country with a voluntary fortification policy, the estimated prevalence of folate deficiency/low folate status is 15 % or one in seven people aged >50 years. These data are in stark contrast to countries with mandatory fortification (of enriched cereal grains or flour) such as the US where rates of low folate status (<10 nmol/l) have been reported in only 1·2 % of those aged ≥60 years (post-fortification)( Reference Pfeiffer, Sternberg and Hamner 25 ). Such a high rate of low folate status is important given the implications of sub-optimal concentrations, particularly for older adults. Deficiencies in folate can result in impaired biosynthesis of DNA with clinical symptoms including the development of megaloblastic anaemia, alopecia, achromotrichia and neuropathy( Reference Herbert 26 , Reference Koike, Takahashi and Ohyama 27 ). Longer-term, low folate status has been associated with higher rates of cognitive impairment, CVD and cancer mortality( Reference Vogel, Dali‐Youcef and Kaltenbach 28 , Reference Peng, Dong and Wang 29 ). For instance, in the US National Health and Nutritional Examination Survey (NHANES) (1999–2010), women with folate concentrations of approximately 20 nmol/l had a 1·5-fold increased all-cause mortality risk in comparison with those >20 nmol/l folate concentrations( Reference Peng, Dong and Wang 29 ). In terms of B12, the estimated prevalence of B12 deficiency and low B12 status (<185 pmol/l) in older Irish adults is 12 % or one in eight. Our data are similar to observations across other older adult surveys (aged >60 years). In NHANES (1999–2002), the prevalence of B12 deficiency (<148 pmol/l) was about 3 %, whereas 7 % had a low B12 status (<185 pmol/l)( Reference Pfeiffer, Caudill and Gunter 30 ). In three combined UK surveys (n 3511), one in twenty people (aged 65–74 years) and one in ten people (aged >75 years) had B12 deficiency (defined as <150 pmol/l)( Reference Clarke, Grimley Evans and Schneede 31 , Reference Clarke, Sherliker and Hin 32 ). These observed high rates of B12 deficiency in older adults are of concern given that early diagnosis is important to avoid irreversible neurologic damage.
Both vitamin B12 and folate status have been examined previously in a much smaller, representative study of older Irish adults (n 358)( Reference Hopkins, Gibney and Nugent 15 ). In the National Adult Nutrition Study (NANS), the average B12 concentration for adults >50 years was 281 pmol/l, which is close to the value of 308 pmol/l observed in the current study. Our data for folate are somewhat lower than in NANS, which may be explained by using the matrix of plasma instead of serum( Reference Hannisdal, Ueland and Eussen 33 ). Interestingly, our plasma folate data were closely aligned with a study from Northern Ireland (n 662) where the folate concentrations of low-medium consumers of FA fortified foods were similar (16·2–22·6 nmol/l)( Reference Hoey, McNulty and Askin 34 ). However, unlike the NANS or Hoey et al. study, which were both limited to a small sample number and a narrow range of potential determinants, using the TILDA data allowed for the examination of a wide range of possible health and lifestyle determinants. We observed that the oldest old (>80 years) had the highest rates of both B12 deficiency and low folate status (6·6 and 23·1 %, respectively). Older adults can be at a particular risk of deficiency owing to increased malabsorption from atrophic gastritis, infection or medication interactions( Reference Stabler 8 ). Interestingly, we also observed that men and those with a lower asset wealth also had lower folate and B12 concentrations. It has been reported that men often display a lower B-vitamin status than women( Reference Hopkins, Gibney and Nugent 15 , Reference Pfeiffer, Sternberg and Schleicher 35 ), which in some studies has been attributed to a higher intake of supplements (which also appears to be a factor in the current study). In addition, it has been observed that older men tend to have a poorer awareness of healthy diet recommendations compared with women who were also more likely to have healthier dietary patterns( Reference Power, Jeffery and Ross 36 , Reference Baker and Wardle 37 ). Few studies have examined measures of economic wealth and B-vitamins. Pfeiffer et al.( Reference Pfeiffer, Sternberg and Schleicher 35 ) in NHANES (2003–2006) reported that those with a lower poverty income ratio had a significantly lower serum folate concentration. Similar dietary mechanisms may explain the decrease in B-vitamin status with age and lower asset wealth including compromised food quantity, quality and variety and lower fruit and vegetables intakes in those with lower incomes( Reference Power, Jeffery and Ross 36 – Reference Billson, Pryer and Nichols 38 ).
Obesity and smoking were also observed as risk factors for lower B-vitamin status in the current study. Obesity has been associated previously with higher erythrocyte folate and lower serum folate in 3767 adults from NHANES. The suggested mechanisms included volumetric dilution, lower folate intakes, lower folate intestinal absorption and higher folate uptake by red blood cells( Reference Bird, Ronnenberg and Choi 39 ). This is of concern for Ireland, as over half of the over 50s population are classified as centrally obese, with only 16 % of men and 26 % of women having a normal BMI( Reference Leahy, Nolan and O’ Connell 40 ). Smoking has also been associated with lower B-vitamin concentrations in both the British National Diet and Nutrition Survey and in the US NHANES (2003–2006)( Reference Pfeiffer, Sternberg and Schleicher 35 , Reference Walmsley, Bates and Prentice 41 ). It has been hypothesised that nitric oxide or hydrogen sulphide could oxidise or compete for the B12 cobalt atom, whereas tetrahydrofolates could react with cyanates to form biologically inactive derivatives( Reference Piyathilake, Macaluso and Hine 42 ).
Uniquely, we were also able to examine the associations with geographic location and with seasonality. We observed that concentrations of folate were lowest in autumn and concentrations of B12 were lowest in summer compared with winter. Some( Reference Shaheen, Abdel Fattah and El-Borhamy 43 – Reference Lucock, Beckett and Martin 46 ) but not all studies( Reference Rose, Batchelor and Turner 47 , Reference Cicarma, Mørk and Porojnicu 48 ) examining folate concentrations after exposure to UV light from sun-bed use or outdoor exposure have observed a lower status. For example, in a small study of forty-five Australian women (aged 18–47 years), UV exposure appeared to reduce the effectiveness of FA supplementation( Reference Borradale, Isenring and Hacker 45 ). Other studies have also observed that UV exposure may affect B12 status. In a cohort of 1013 elderly Chileans, solar radiation was associated with B12 deficiency( Reference Cabrera, Benavente and Alvo 49 ). Similar mechanisms for both B12 and folate have been proposed including direct and indirect photo-degradation by UV radiation and by the formation of free radicals( Reference Juzeniene and Nizauskaite 50 , Reference Borradale and Kimlin 51 ). These observations may not only be important for B-vitamin status but also for other micronutrients as UV exposure is the main determinant of vitamin D status.
It is important to note that FA supplement use was not a contributor to B12 concentrations or status in our population, as there have been some concerns that high folate status could exacerbate the clinical effects of B12 deficiency( Reference Paul and Selhub 52 ). Within TILDA, 8·9 % had a folate concentration >45 nmol/l. This is lower than the frequency observed either in NANS (19 %) or in post-fortification NHANES in the USA (38 %)( Reference Hopkins, Gibney and Nugent 15 , Reference Pfeiffer, Johnson and Jain 53 ). The same methodology was used in all three studies and the folate measurements for this study and for NANS were carried out in the same laboratory. It is unclear what the clinical implications are of high folate status. Previously, high folate concentrations have been correlated with unmetabolised FA in plasma( Reference Sweeney, Staines and Daly 54 ), which has been suggested to be a driver of some adverse health effects( Reference Sweeney, Staines and Daly 54 ). In a cross-sectional study of 219 older adults (>65 years), higher folate concentrations were associated with lower brain volumes( Reference van der Zwaluw, Brouwer-Brolsma and van de Rest 55 ), whereas a higher cancer incidence was reported in the folate and B12 intervention group of the B-PROOF study of older adults, with the effect on cancer incidence more pronounced in the oldest old (>80 years)( Reference van Wijngaarden, Swart and Enneman 56 ). FA has been suggested to be a preventive agent for cancer initiation but a promoter of established neoplastic cells( Reference Smith, Kim and Refsum 57 ). However, this effect is still not clear as higher levels of folate have been associated with a lower risk of lung cancer diagnosis in a case–control study of 366 adults( Reference Durda, Kąklewski and Gupta 58 ), whereas lower folate status in comparison with high status has been associated with a higher risk of all-cause mortality( Reference Peng, Dong and Wang 29 ).
The major strength of this study is that it is the largest nationally representative older population sample reported with detailed data on a wide range of potential determinants. A limitation is that no dietary intake data were available including the consumption of fortified food products or the dosage of B-vitamin supplements taken. However, previous studies have shown a weak relationship between intake and blood biomarker data for these micronutrients( Reference Hopkins, Gibney and Nugent 15 , Reference Hoey, McNulty and Askin 34 ). One recent study has indicated that dietary intake data and biomarkers reflect the same underlying folate status with a systematic underestimation bias in intake data( Reference Bailey, Fulgoni and Taylor 59 ). Furthermore, our study was limited to the use of plasma total B12 and folate as indicators of status with the corresponding benefits and drawbacks associated with each of these biomarkers (i.e. total B12 measurement in blood is known to have relatively low sensitivity for estimating B12 deficiency( Reference Valente, Scott and Ueland 60 ), whereas plasma folate is subject to variations from recent dietary intakes). It is also important to note that because of the recruitment sampling criteria these findings may not be applicable to non-Caucasians, older adults in institutional care or those with severe cognitive impairment.
In summary, we have observed high rates of low B12 and folate status coupled with a much smaller rate of high folate status in the older Irish population. Ideally, encouraging older persons to improve their normal eating practices and to follow the food pyramid has the potential to enhance the B12 and folate status of this population group. However, compliance to healthy eating recommendations, as well as practical issues such as cooking practices, bioavailability, medication intakes and age-related changes to the gastrointestinal tract, means that the holistic unfortified approach can be ineffectual. Our data (and others previously) indicate that the current policy of voluntary fortification is ineffective at preventing the occurrence of deficiency and low blood status. Serious consideration must now be given to the implementation of mandatory FA and B12 fortification. Such a policy would ensure that the requirements of the ‘at-risk’ older adult population are met while also helping to reduce the prevalence of folate-responsive neural tube defects in the unborn child. The continued delay in consideration of this implementation could put >180 000 and 145 000 older Irish adults at risk of the health consequences of low folate and B12 status, respectively.
Acknowledgements
This work was supported by the Irish Department of Agriculture, Food and the Marine through the grant 13F492: The Nutritional Biomarker Database Enhancement Initiative of (‘BIO-TILDA’ 2013–2015). Original funding for TILDA was provided by The Atlantic Philanthropies, the Irish Government and Irish Life plc. The funders played no role in designing or conducting the study or in the collection, management, analysis or interpretation of the data, nor did they have any input into the preparation, review or approval of the manuscript.
The authors contribution are as follows: A. M. M., R. A. K., A. M. O. H. and E. J. L. designed the research; E. J. L., A. M. M. and A. M. O. H. conducted the research; D. C., D. O. C. and E. J. L. analysed the data; and all authors contributed in the final preparation of the manuscript.
The authors declare that there are no conflicts of interest.


