Diets that are high in protein at the expense of carbohydrate have been shown to be beneficial in weight and body fat loss in human subjects(Reference Anderson and Li1, Reference Layman and Baum2). Human studies have shown that on an energy basis protein is more satiating than other macronutrients(Reference Skov, Toubro, Ronn, Holm and Astrup3). The nature of the protein source may also be relevant, although this has not been well studied. Research has shown in laboratory rats fed a high-protein diet (300 g/kg) that whey protein concentrate was significantly more effective than red meat in reducing body-weight gain and body fat content, when energy intakes were comparable(Reference Belobrajdic, McIntosh and Owens4). In human short-term studies whey protein has been shown to enhance satiety and decrease food intake relative to casein(Reference Hall, Millward, Long and Morgan5).
Glycomacropeptide (GMP), the glycosylated fraction of caseinomacropeptide is a C-terminal fragment of κ casein released by endopeptidase chymosin (rennin) and is present in whey from cheese manufacture(Reference Brody6) at concentrations in the order of 600 mg/l and this may have been responsible for the whey protein concentrate effect reported in rats by Belobrajdic et al. (Reference Belobrajdic, McIntosh and Owens7). GMP has been shown to stimulate cholecystokinin (CCK) release(Reference Yvon, Beucher, Guilloteau, Le Huerou-Luron and Corring8), thereby potentially having an influence on satiety and food intake(Reference Kissileff, Pi-Sunyer, Thornton and Smith9, Reference Lieverse, Jansen, Masclee, Rovati and Lamers10). GMP has been detected in the plasma of volunteers after milk or yoghurt ingestion(Reference Chabance, Marteau, Rambaud, Migliore-Samour, Boynard, Perrotin, Guillet, Jolles and Fiat11), suggesting that GMP may be produced in the gut before being absorbed into the circulation via intestinal cells.
The aim of the present study was to determine if a GMP-enriched whey protein isolate (WPI) has a significant effect on weight gain, growth rate and body composition, when compared with WPI without GMP, casein and barbequed (BBQ) beef. It was hypothesised that feeding NatraPep™, a commercial source of GMP-rich WPI, would decrease both food intake and gain of abdominal and subcutaneous fat.
Experimental methods adopted
Animals
Fifty male Wistar rats, age 12 weeks, were obtained from the Animal Resource Centre (Murdoch University, Western Australia, Australia).
Upon arrival the animals were housed in wire cages to minimse coprophagy and were maintained in an air-conditioned environment of 23 ± 2°C with a 12 h light–12 h dark cycle. Rats were given standard rat chow and water ad libitum for 48 h to acclimatise to their new environment. Once established, all animals were randomised and sorted into five (n 10) treatment groups of equal body weight. Each group was then placed onto one of the five American Institute of Nutrition (AIN)-93-based experimental diets (see Table 1) for the duration of the 7-week study. All animals were weighed weekly and food intakes measured twice weekly.
Detailed diet compositions of the five treatment groups

BBQ, barbecued; WPI, whey protein isolate; GMP, glycomacropeptide.
* Casein: 850 g protein/kg, 12 g fat/kg, 0·13 g Ca/kg, 67 g moisture/kg, 0·2 g K/kg, 0·005 g Na/kg and 30 g ash/kg.
† BBQ beef: 700 g protein/kg, 250 g fat/kg, 0·12 g Ca/kg, 30 g moisture/kg, 9·2 g K/kg, 1·4 g Na/kg, 0·7 g Mg/kg and 10·2 g ash/kg.
‡ NatraPro™ (WPI): 924 g protein/kg, 11 g fat/kg, 1·3 g Ca/kg, 32 g moisture/kg, 8·1 g K/kg, 5·4 g Na/kg, 0·12 g Mg/kg and 35 g ash/kg.
§ NatraPep™ (GMP-rich WPI): 765 g protein/kg, 676 g GMP/kg, 3 g fat/kg, 0·02 g Ca/kg, 43 g moisture/kg, 0·003 g K/kg, 41·2 g Na/kg, 0·0002 g Mg/kg and 100 g ash/kg.
At the conclusion of the study the rats were fasted overnight (16 h) and euthanased using 4 % fluothane in oxygen anaesthesia. Whole blood was removed by exsanguination from the abdominal aorta. At autopsy body weights and liver, perirenal (taken as the discrete fat mass surrounding kidneys), testicular (taken as the epididymal fat pad) and mesenteric fat (taken as the fat incorporated mesenteric structures) were weighed. Whole blood was collected and plasma separated for glucose, insulin and TAG determinations. Abdominal fat was regarded as the sum of perirenal+testicular+mesenteric fat weights derived at autopsy. During this process a measure of subcutaneous fat was made after its removal. The remaining internal organs, skin, feet, head and tail were removed leaving the carcass (muscle mass and skeleton) which was stored frozen for later analysis. All experimental procedures using animals were approved by the Animal Ethics Committee of the Commonwealth Scientific and Industrial Research Organisation, Division of Human Nutrition.
Protein sources
The three dairy proteins used were produced by Murray Goulburn Nutritionals (Brunswick, Victoria, Australia). WPI was prepared from skimmed milk by membrane separation and dialysis providing a caseinomacropeptide- and GMP-free protein source, NatroPro™ (WPI), that contained 924 g protein/kg, 0 g GMP/kg, 11 g fat/kg, 1·3 g Ca/kg, 8·1 g K/kg, 5·4 g Na/kg, 0·12 g Mg/kg and 35 g ash/kg. The GMP-rich WPI, NatraPep™ contained 765 g protein/kg (676 g GMP/kg), 3 g fat/kg, 0·02 g Ca/kg, 0·003 g K/kg, 41·2 g Na/kg, 0·0002 g Mg/kg and 100 g ash/kg. From the information supplied by the manufacturer the ratio between glycosylated and non-glycosylated is calculated to be 2:1. Casein used was acid (hydrochloric)-precipitated washed casein containing 850 g protein/kg, 12 g fat/kg, 0·13 g Ca/kg, 0·2 g K/kg, 0·005 g Na/kg and 30 g ash/kg.
Lean minced beef was supplied by Holco Meats (Cavan, South Australia, Australia).
The BBQ beef endproduct was derived by browning the meat on a barbeque hotplate before being dried at 40°C to a powdered consistency, containing 700 g protein/kg, 250 g fat/kg, 0·12 g Ca/kg, 9·2 g K/kg, 1·4 g Na/kg, 0·7 g Mg/kg and 10·2 g ash/kg.
Amino acid analyses
Briefly, the NatroPro™ (WPI), NatraPep™ (GMP-rich WPI) and casein powdered product samples were sub-sampled for the analyses. Amino acid analysis of the samples was undertaken by first hydrolysing the protein in the samples with 6 m-hydrochloric acid for 24 h to free the amino acids. After hydrolysis the solution was diluted and filtered and the hydrochloric acid was removed under reduced pressure. All amino acids except methionine, cystine and tryptophan, which are partially destroyed in 6 m-hydrochloric acid, were hydrolysed with the above procedure. The levels of the hydrolysed amino acids were then determined by first separating them using cation exchange chromatography followed by post-column derivatisation using ninhydrin before spectrophotometric quantification against known standards.
Sulfur amino acids (methionine and cystine)
Methionine and cystine plus cysteine were pre-oxidised to methionine sulfone and cysteic acid respectively with formic acid at 0°C for 16 h followed by 6 m-hydrochloric acid hydrolysis. The levels of the sulfur amino acids were then determined using cation exchange chromatography followed by post-column derivatisation using ninhydrin.
Tryptophan
Since tryptophan is destroyed during acid hydrolysis, alkaline hydrolysis is conducted using barium hydroxide with 5-methyl tryptophan as an internal standard. After hydrolysis, free tryptophan was analysed using a reverse-phase column with UV detection at 280 nm.
Diets
All diets were based on a balanced modification of the AIN-93 diet formulation(Reference Reeves, Nielsen and Fahey12). The experimental diets are described briefly as follows. All diets were balanced to contain 300 g protein/kg, provided by either NatraPro™ (WPI), NatraPep™ (GMP-rich WPI), casein or BBQ beef. The varied additions of GMP-rich WPI to WPI provided a dose response: 0, 100 and 200 g/kg levels of GMP. All other macronutrients remained identical between experimental groups. The protein density of all diets was adjusted using carbohydrate with a 3:2 ratio of maize starch:sugar. The fat content of all diets was adjusted to be 200 g/kg diet. The majority of the dietary fat was provided by sunflower-seed oil with the balance provided endogenously by the protein source. Minerals provided by the different protein sources were balanced across all diets to provide a constant level, as described in AIN-93(Reference Reeves, Nielsen and Fahey12). Each diet provided an equivalent amount of Ca (5 g/kg) as for the AIN-93 diet. Similarly, diets were designed to be isoenergetic. A detailed composition of the final diets can be seen in Table 1.
Carcass analysis
Each animal carcass was freeze-dried over 72 h to remove all moisture before being finely ground to obtain a consistent sample for fat and protein analysis on a DM basis. Carcass and liver fat values were determined gravimetrically, following extraction with chloroform–methanol–water (2:1:1, by vol.) as described by Folch et al. (Reference Folch, Lees and Sloane Stanley13). Carcass protein was quantified by the Dumas method of Kirsten & Hesselius(Reference Kirsten and Hesselius14) using a Carlo Erba NA1500 nitrogen analyser (Milan, Italy).
Blood chemistry and hormone analysis
Overnight fasted plasma was isolated from whole blood by centrifugation at 2000 g for 10 min at 5°C (Beckman GS-6R centrifuge; Backman Coulter, Inc., Fullerton, CA, USA) and frozen at − 20°C until analysis.
Plasma glucose and TAG concentrations were determined using enzymic kits (Roche Diagnostics, Basel, Switzerland) on a Hitachi 902 auto-analyser (Roche Diagnostics, Corp., Indianapolis, IN, USA).
Plasma insulin concentrations were determined using high-sensitivity rat-specific ELISA kits (ALPCO Diagnostics, Windham, NH, USA).
Statistical analysis
Statistical analysis was carried out with Statistical Package for the Social Sciences for Windows version 11.5.0 standard statistical software (SPSS, Inc., Chicago, IL, USA). Data are mean values and standard deviations, unless otherwise specified. Procedures used included one-way ANOVA with Tukey's post hoc testing and correlation analysis between the variables GMP and plasma insulin. Differences were considered to be significant at P < 0·05.
Results
Protein source: amino acid analysis
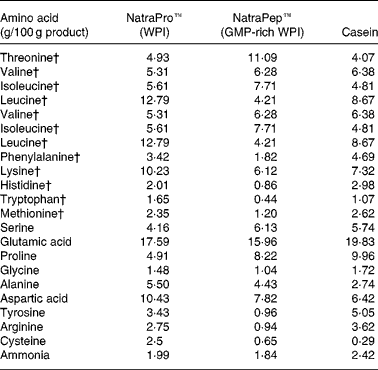
The two WPI products, NatroPro™ (WPI) and NatraPep™ (GMP-rich WPI) plus casein were analysed for their amino acid profile as shown in Table 2. The GMP-rich WPI product was found to have noticeably lower concentrations of amino acids relative to WPI: leucine (down 66 %), tyrosine (down 72 %), phenylalanine (down 47 %), histidine (down 57 %), lysine (down 40 %), arginine (down 66 %), tryptophan (down 73 %), cysteine (down 74 %) and methionine (down 49 %).

Growth, weight gain and food intake
In spite of differences in body-weight gain the final body weights were not different. Growth rates of the animals are shown in Fig. 1, with the final body weights and weight gains in Table 3. Analysis of the data showed no effect of either protein type or GMP level on final body weights.
Growth rate of animals over the 7-week feeding period. Values are means for ten animals per treatment group. (■), Control whey protein isolate (WPI); ( × ), WPI+glycomacropeptide (GMP) at 100 g/kg; (♦),WPI+GMP at 200 g/kg; (▲), casein; (○), barbequed beef.

Analytical and body compositional data from treatment groups after the 7-week feeding protocol* (Mean values and standard deviations for ten rats per treatment group)

BW, body weight; WPI, whey protein isolate; GMP, glycomacropeptide.
a,b Mean values within a column with unlike superscript letters were significantly different (P < 0·05).
* For details of diets, see Table 1.
There was no significant difference between groups in food intake and final body weight. There was a significant reduction in body-weight gain (P < 0·05) with GMP-fed animals compared with casein- and BBQ beef-fed animals. There was also a significant difference between the WPI-fed animals when compared with casein-fed animals (P < 0·01). There was no significant difference between WPI- and GMP-rich WPI.
Body composition
There were significant decreases in the perirenal fat deposition (Fig. 2) in the animals fed both levels of GMP compared with the casein-fed animals (P < 0·05). Similarly, there were significant decreases in the testicular and abdominal fat mass when the WPI+GMP (200 g/kg)-fed animals were compared with the casein-fed animals (P < 0·05). Perirenal fat weight and carcass fat was significantly lower (P < 0·05) in the WPI+GMP (200 g/kg)-fed animals relative to the control WPI rats.
Comparison of final body composition data between the five treatment groups. (![]() ), Sucutaneous fat; (□), mesenteric fat; (
), Sucutaneous fat; (□), mesenteric fat; (![]() ), testicular fat; (■), perirenal fat; BBQ, barbequed; WPI, whey protein isolate; GMP, glycomacropeptide. Values are means for ten animals per treatment group. For perirenal fat, the WPI+GMP (100 g/kg) and WPI+GMP (200 g/kg) treatment groups were significantly different from the casein-fed group (P < 0·05); the WPI+GMP (200 g/kg) group was significantly different from the control WPI-fed group (P < 0·05). For testicular fat, the WPI+GMP (200 g/kg) group was significantly different from the casein-fed group (P < 0·05). For abdominal fat, the WPI+GMP (200 g/kg) group was significantly different from the casein-fed group (P < 0·05).
), testicular fat; (■), perirenal fat; BBQ, barbequed; WPI, whey protein isolate; GMP, glycomacropeptide. Values are means for ten animals per treatment group. For perirenal fat, the WPI+GMP (100 g/kg) and WPI+GMP (200 g/kg) treatment groups were significantly different from the casein-fed group (P < 0·05); the WPI+GMP (200 g/kg) group was significantly different from the control WPI-fed group (P < 0·05). For testicular fat, the WPI+GMP (200 g/kg) group was significantly different from the casein-fed group (P < 0·05). For abdominal fat, the WPI+GMP (200 g/kg) group was significantly different from the casein-fed group (P < 0·05).

Plasma biochemistry
Biochemical and compositional data are shown in Table 3. Plasma TAG concentrations of the animals fed WPI+GMP at 200 g/kg were significantly lower (P < 0·05) than the casein- and BBQ beef-fed animals. Plasma insulin concentrations of the animals fed both levels of GMP were significantly lower (P < 0·01) than the control WPI-fed animals although WPI elevated plasma insulin compared with casein. A significant inverse relationship (P < 0·001) between plasma insulin and dietary levels of GMP with the WPI groups is shown in Fig. 3.
The inverse relationship between plasma insulin and glycomacropeptide (GMP) in the diet: y = − 9·39x+275·1; R 2 0·44; P < 0·001 (individual data from control whey protein isolate and both GMP treatment groups only).

Discussion
The overall body-weight gain of WPI plus GMP-fed animals was 30 % lower than the casein-fed animals, but WPI alone also showed a significant (P < 0·01) reduction in body-weight gain when compared with casein-fed animals. This finding supports the work of Belobrajdic et al. (Reference Belobrajdic, McIntosh and Owens4) where a diet high in whey protein decreased weight gain in comparison with meat. The present study showed nevertheless that GMP offers a small additional (non-significant) benefit in weight control when compared directly with WPI alone. GMP offered an advantage in terms of decreased abdominal fat, particularly renal fat, and carcass fat compared with WPI alone. It was hypothesised that feeding GMP-rich WPI would, through increased CCK production by the endocrine cells of the small intestine(Reference Mutt and Jorpes15), have an effect on satiety and reduce food intake(Reference Gibbs, Young and Smith16–Reference Kopin, Mathes, McBride, Nguyen, Al-Haider, Schmitz, Bonner-Weir, Kanarek and Beinborn18), thereby decreasing weight gain and reducing abdominal and subcutaneous fat deposition. This satiety hypothesis was not supported, however, as there was no difference between the food intakes of the rats between the dietary treatments. Plasma CCK was not measured in the course of the experiment but would possibly provide further information as to the efficacy of GMP to stimulate CCK production in this rat model.
The fact that casein, which is potentially a low level source of endogenously generated GMP(Reference Chabance, Marteau, Rambaud, Migliore-Samour, Boynard, Perrotin, Guillet, Jolles and Fiat11), provided the highest weight gain in the casein-fed animals suggests that GMP is probably not being released to any significant degree during casein digestion, or has no effect on food intake(Reference Beucher, Levenez, Yvon and Corring19). Any effect of high dietary Ca on body-weight gain or composition(Reference Metz, Karanja, Torok and McCarron20, Reference Papakonstantinou, Flatt, Huth and Harris21) can be excluded as all diets were balanced for Ca.
In the present study the addition of GMP led to a lowering of fasting plasma insulin concentrations relative to WPI alone. A significantly lower plasma insulin concentration (down 64 %; P < 0·01) was observed between the GMP (200 g/kg)- and the WPI alone-fed animals. The relationship of insulin to weight gain in the present study is not clear, as the insulin level in the casein-fed group was not significantly different from that of the GMP (200 g/kg) group, despite considerable differences in some fat depots in the animals. This result differs from previous studies(Reference Belobrajdic, McIntosh and Owens4), where lowered fasting plasma insulin concentrations were observed with whey protein concentrate relative to red meat at high protein intakes. This probably reflects the lower fat mass in the whey protein concentrate-fed animals although it cannot be excluded that a minor protein in the WPI fraction (but not in the GMP-enriched protein) elevated insulin levels, even in the fasting state. The elevated insulin with WPI may not necessarily reflect increased insulin resistance as although glucose is higher in all WPI groups than the casein group (non-significant) TAG levels are not elevated.
The amino acid values for the WPI (control), GMP-rich WPI products and casein used in the present study are provided in Table 2. These show low values for GMP-rich WPI in a number of amino acids compared with WPI and casein. As a consequence, dietary methionine could be considered marginal at 0·54 g/kg diet offered to the animals when the highest level (200 g/kg) of GMP was fed. This may have had some consequences for the rats on this diet, potentially diminishing methylating status and influencing liver fat accumulation(Reference Zaki, Bandt and Hoffbauer22), although there were no differences shown in the liver weights, the amount of fat in the liver or the final body weights of the animals between the control WPI- and both GMP-fed groups. The calculated level of methionine in the 200 g GMP/kg group was adequate for maintenance of laboratory rats (0·23 g/kg)(23). Fundamental research done by Archer et al. (Reference Archer, Rayner, Rozman, Klingenspor and Mercer24) has shown that large differences in the energy concentration of diets can alter weight-gain outcomes in male Sprague–Dawley rats. In the present study a small difference was seen in the energy concentrations of the study diets, particularly between the WPI+200 g GMP/kg and BBQ beef groups (18·3 and 16·0 kJ/g respectively). The difference in energy concentration on weight gain can been ruled out as the significant reduction seen in body-weight gain was between the GMP-fed animals (average 18·0 kJ/g) and the casein- (18·1 kJ/g) and BBQ beef-fed animals (16·0 kJ/g), suggesting no influence of energy concentration on weight-gain outcomes in the present study.
The ability of some dairy foods to impact beneficially on weight control in both animal and human studies has been noted in some but not all studies(Reference Bowen, Noakes and Clifton25, Reference DiRienzo, Spence, Huth and Fulgoni26). Similarly the effect of CCK on satiety and food intake has been confirmed in some but not all human studies(Reference Kissileff, Pi-Sunyer, Thornton and Smith9, Reference Lieverse, Jansen, Masclee, Rovati and Lamers10, Reference Ballinger, McLoughlin, Medbak and Clark27). Until recently the research focus has been on the relationship between dairy Ca(Reference Zemel28, Reference Zemel29) and satiety and weight loss and dairy fat(Reference Schneeman, Burton-Freeman and Davis30) and CCK levels. The nutritionally functional properties of dairy products are now being more closely examined and it has been reported that Ca associated with dairy foods has a greater effect on adiposity than Ca alone(Reference Zemel28, Reference Zemel29). There have been few well-designed studies examining the ability of dairy peptides to suppress appetite. A recent study by Gustafson et al. (Reference Gustafson, McMahon, Morrey and Nan31) failed to show any effect on satiety when the milk protein caseinomacropeptide was fed as a solution to human subjects. The highest level fed was ten-fold lower than the maximum offered in the present study and was not offered as part of a dairy- or whey-based meal. A number of other functions relating to health are attributable to caseinomacropeptide and have been reviewed by Thomä-Worringer et al. (Reference Thoma-Worringer, Sorensen and Lopez-Fandino32). These deserve more investigation with regard to their relevance in a dietary context.
It has been suggested that whey proteins and dairy Ca contribute to limiting body fat accumulation and offer advantages in maintaining optimal body composition(Reference Ha and Zemel33). Further work in human subjects is needed to elucidate the influence of GMP-rich WPI and WPI on body weight and body fat. In conclusion, GMP-rich WPI appears to have a significant additional influence on the effect of WPI alone on fat accumulation. However, in the present study WPI appears to be the predominant influence, accounting for 70 % of the effect on body-weight gain observed.
Acknowledgements
We would like to acknowledge the significant input of CSIRO Human Nutrition staff, in particular David Courage, Ben Scherer, Michael Adams and Julie Dallimore in conducting the study. Thanks also to Dr Frank Dunshea, Department of Primary Industries, Werribee, Victoria for the amino acid analyses. The authors' responsibilities were as follows: P. J. R. participated in the design, implementation and conduct of the experimental protocol, data analysis, interpretation of data and writing of the manuscript. G. H. M. contributed to the design of the experimental protocol, the data analysis and interpretation and draft manuscript editing. P. M. C. contributed to the data analysis and interpretation, draft manuscript editing and liaison with the commercial partner. This research was funded by CSIRO Human Nutrition and in part by Murray Goulburn Co-operative Co. Ltd. None of the authors had a personal or financial conflict of interest.