


Introduction
Motor neuron disease (MND) is a heterogenous group of diseases characterized by progressive upper motor neuron (UMN) and/or lower motor neuron (LMN) degeneration. It includes amyotrophic lateral sclerosis (ALS), a MND affecting both UMN and LMN, and primary lateral sclerosis (PLS), a MND marked by predominant UMN involvement, among others. While LMN involvement can be objectively assessed through electrophysiologic diagnostics, UMN degeneration currently lacks objective evaluation methods and largely relies on clinical assessment, which can delay diagnosis, treatment initiation, or enrollment into clinical trials. There are growing interests in using radiologic findings as objective markers of UMN involvement in MND. Reference Huynh, Simon, Grosskreutz, Turner, Vucic and Kiernan1
According to most guidelines, neuroimaging is not considered mandatory for the diagnosis of ALS Reference Brooks, Miller, Swash and Munsat2 ; its primary role is to rule out differential diagnoses. Several MRI strategies have been proposed to detect radiologic markers of neurodegeneration in ALS. For example, T2/FLAIR hyperintensities in the corticospinal tracts have been suggested as a marker of UMN degeneration. Reference Lee, Markus and Hughes3,Reference Gupta, Nguyen, Chakraborty and Bourque4 The diagnostic utility of this marker remains unclear, as its diagnostic sensitivity and specificity have been shown to be modest at best. Reference Chan, Kaufmann, Shungu and Mitsumoto5 Interestingly, a marker known as the ‘motor band sign’ (MBS) has been documented in small studies; a band-like hypointensity along the posterior cortical margin of the precentral gyri best appreciated on susceptibility-weighted imaging (SWI). Reference Chakraborty, Gupta, Nguyen and Bourque6,Reference Roeben, Wilke, Bender, Ziemann and Synofzik7 SWI is a three-dimensional high-resolution gradient echo sequence that employs both magnitude and phase data to improve the contrast from local susceptibility changes between tissues, which confers greater sensitivity in detecting iron content. Reference Haacke, Xu, Cheng and Reichenbach8 This SWI hypointensity is hypothesized to reflect UMN degeneration and subsequent iron accumulation within cortical microglia. Reference Roeben, Wilke, Bender, Ziemann and Synofzik7
Quantitative susceptibility mapping (QSM) is an MRI technique that quantifies magnetic susceptibility of tissues from phase images of gradient echo sequences. Reference Liu, Wei, Gong, Cronin, Dibb and Decker9 It was previously demonstrated that the dominant source of magnetic susceptibility in gray matter tissues is iron, Reference Langkammer, Schweser and Krebs10 and Acosta-Cabronero et al. recently showed higher susceptibility measurements in the motor cortices in ALS patients. Reference Acosta-Cabronero, Machts and Schreiber11 Together, these findings support QSM as a sensitive method of detecting UMN injury in ALS.
Because of the low prevalence of ALS compared to other neurological disorders, literature on radiologic markers is limited. Furthermore, it remains even less clear whether MBS can be seen in PLS. We evaluate the frequency of MBS by QSM in ALS and PLS patients, explore correlation between susceptibility measurements in motor cortices and clinical UMN features, and assess prognostic value of MBS in ALS.
Methods
Patient Selection
For our retrospective study, approval was obtained from our local institution’s research ethics board. We searched records from our institution’s ALS clinic for the period of January 2010 to March 2018. Patients were included consecutively if they eventually received a definite diagnosis of ALS as per the revised El Escorial criteria Reference Brooks, Miller, Swash and Munsat2 or PLS as per the recent consensus criteria, Reference Turner, Barohn and Corcia12 had retrievable brain MRI source images including SWI in our picture archiving and communication system (PACS), and had documented clinical neurologic examination contemporaneous with the relevant MRI study. PLS patients who developed LMN signs after at least 4 years from symptom onset were still considered PLS. Reference Statland, Barohn, Dimachkie, Floeter and Mitsumoto13 Ten age- and sex-matched controls were included randomly from PACS who had retrievable MRI with SWI sequence and did not have any diagnoses of neurodegenerative, demyelinating or movement disorders, or traumatic brain injuries.
Clinical Grading
Following clinical data were retrieved from patients’ charts by an experienced neurologist with a subspecialty interest in neuromuscular disease (PB, >30 years of experience): time of symptom onset/disease duration, laterality of involvement, UMN signs (e.g. spasticity, hyperreflexia, Babinski sign, pyramidal distribution of paresis), and LMN signs (e.g. fasciculations, atrophy, paresis). All patients additionally had undergone EMG testing, which was included in the determination of LMN involvement. We devised an UMN score as shown in Supplementary Table 1. The degree of spasticity and hyperreflexia was each graded on a scale of 0 to 2, and the global UMN score was calculated as the summation of the two scores, ranging from 0 to 4. Clinical outcomes were also extracted from patients’ charts, including the mRS score and mortality at the time of last follow-up, and the time from symptom onset to last follow-up.
MRI Protocol
MRI scans were performed at 3 Tesla (Siemens Healthineers, Erlangen, Germany) using a 32 Channel head coil. All patients were scanned with a routine MRI brain protocol including sagittal T1-weighted FLAIR, axial T2-weighted turbo spin echo with fat saturation, axial T2-weighted FLAIR, axial diffusion-weighted sequence (EPI-DWI), and an axial T2*-weighted gradient echo EPI. A flow-compensated 3D gradient echo sequence (FLASH) with the following parameters were obtained for SWI and QSM processing: TR = 28 ms, TE = 20 ms; FOV = 230 mm × 172 mm; matrix = 384 × 288; resolution = 0.6 mm × 0.6 mm; slice thickness = 1.5 mm; flip angle = 15°; bandwidth/pixel = 119 Hz, number of slices = 72–96 and scan time = 3–4 min). Patients were considered MBS positive when there were curvilinear bands of hypointensity in the posterior cortical region of precentral gyri on T2, DWI, GRE, or SWI MR sequences by an experienced neuroradiologist (SC, >15 years of experience), as shown in Figure 1. Patients were considered to have positive corticospinal hyperintensity if they had documented T2/FLAIR hyperintensity anywhere from the subcortical precentral gyrus, centrum semiovale, posterior limb of the internal capsule, cerebral peduncles, pons, medullary pyramids, and anterior and lateral corticospinal tracts of the spinal cord. Reference Chakraborty, Gupta, Nguyen and Bourque6
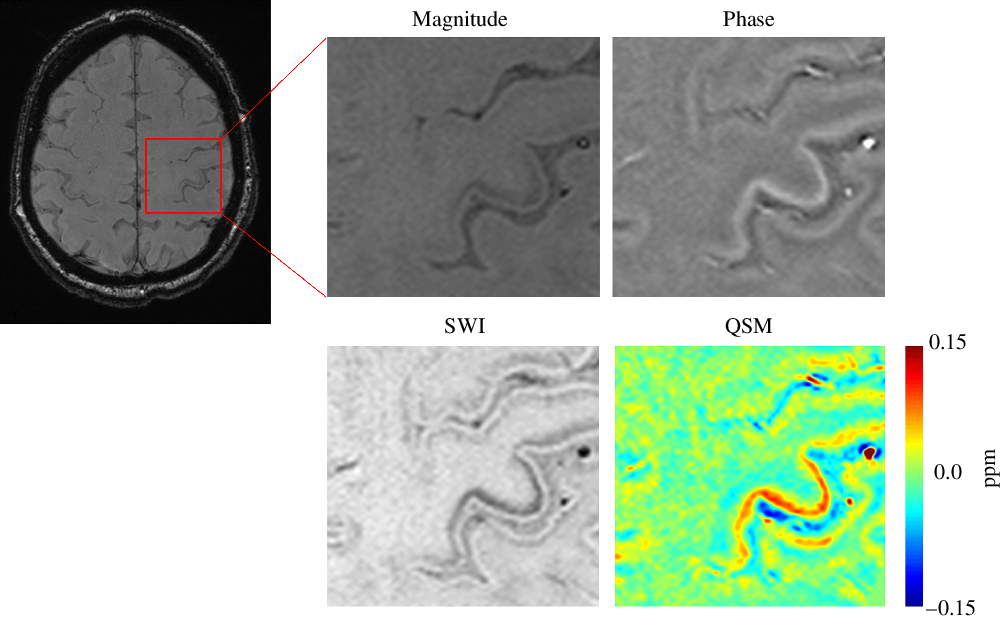
Figure 1: Motor Band Sign and Quantitative Susceptibility Mapping. SWI, susceptibility weighted imaging; QSM, quantitative susceptibility mapping; Ppm, parts per million.
QSM Data Processing
The QSM processing was performed with a software package developed in-house using Matlab (Matlab 2014a, The MathWorks). The phase images were unwrapped followed by high pass filtering to remove the background field to generate the filtered phase map. SWI datasets were generated as described by Haacke et al. Reference Haacke, Xu, Cheng and Reichenbach8 QSM images were calculated from the filtered phase maps and magnitude data using the iterative Susceptibility-Weighted Imaging and Mapping (iSWIM) algorithm. Reference Haacke, Tang, Neelavalli and Cheng14,Reference Wolf, Diehl, Gebhardt, Mallow and Speck15 QSM images are shown in Figure 1.
Susceptibility Quantification Measurements
To evaluate the susceptibility values, regions of interest were drawn on the SWI dataset using an in-house written graphical user interface written in MATLAB by an experienced neuroradiologist (SC, > 15 years of experience) in the right (RMC) and left primary motor cortices (LMC), in the hand knob region, as shown in Figure 2. The hand knob is a segment of the primary motor cortex responsible for motor hand function and is used as a reliable landmark for identifying the primary motor cortex. Reference Yousry16 Regions of interest were saved as masks and then applied on the QSM dataset to extract the susceptibility values as shown in Figure 3. For each subject, reference susceptibility values were measured from regions of interest in the ventricular CSF. The susceptibility values of the motor cortices were normalized by subtracting ventricular CSF susceptibility values. Reference Cronin, Wharton and Al-Radaideh17 Greater tissue susceptibility values have previously been shown to reflect higher degrees of iron deposition, Reference Liu, Li, Tong, Yeom and Kuzminski18 which also forms the basis for MBS in MND.
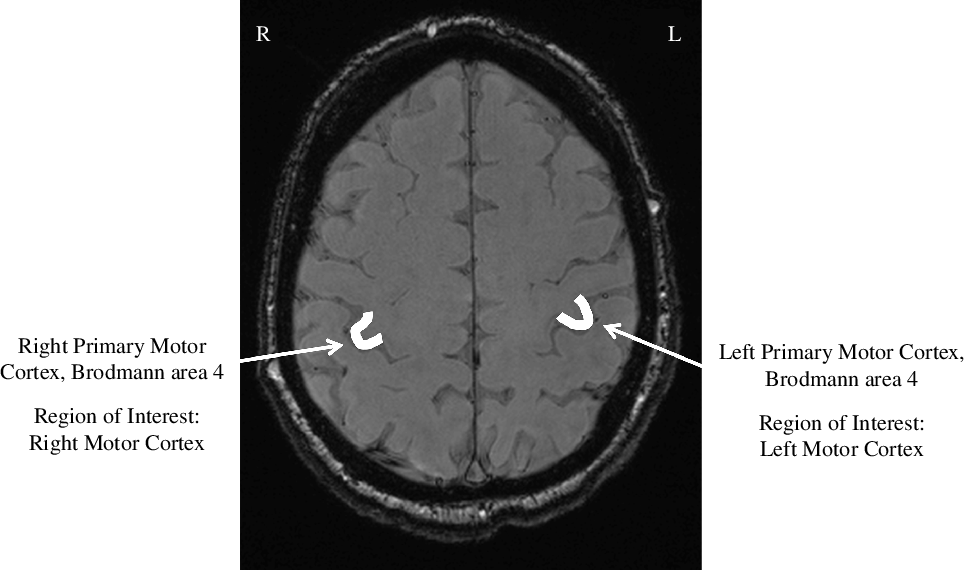
Figure 2: Regions of Interest. R, right; L, left.

Figure 3: Quantitative Susceptibility Mapping of Regions of Interest. ROI, regions of interest; RMC, right motor cortex; LMC, left motor cortex; Ppm, parts per million.
Data Analysis
For our primary outcome, we calculated the frequencies of MBS across ALS, PLS, and controls (HSC, GM). For our secondary outcomes, we compared susceptibility measurements across the three groups (HSC, GM). A sub-analysis was performed to compare susceptibility measurements between ALS patients with and without UMN features and to assess correlation between susceptibility measurements and the contralateral UMN scores in ALS. Lastly, we explored clinical outcomes between MBS positive and negative ALS patients. Fischer’s exact, Mann–Whitney or Kruskal–Wallis test was used, as appropriate. For correlations, Kendall’s tau correlation followed by nonparametric partial correlation test adjusting for age was employed. Statistical analyses were performed using SPSS v23 (IBM, Armonk, NY). Values are expressed as medians with interquartile ranges or as percentages with 95% CI, as appropriate. p-value < 0.05 was considered statistically significant.
Results
Out of 148 patients, 85 patients had MRI available in our PACS. Within this group, 18 patients had SWI and necessary magnitude and phase images for inclusion (Figure 4). Many patients did not have an SWI sequence as SWI only became part of our MRI protocols in the recent years, and only one of four MRI scanners had SWI available. Of the 18 patients, 13 and 5 were diagnosed with ALS and PLS, respectively. Ten non-MND controls with SWI data were also included (6 cavernomas, 2 brain tumors, 1 subarachnoid hemorrhage, and 1 normal). Demographics are displayed in Table 1. Median (IQR) ages were 59 (56–65), 49 (47–56), and 62 (60–70) for ALS, PLS, and controls, respectively, 38.5%, 80.0%, and 50.0% of ALS, PLS, and controls were males, respectively.

Figure 4: Flow Diagram of Patient Inclusion. ALS, amyotrophic lateral sclerosis; PLS, primary lateral sclerosis; MRI, magnetic resonance imaging.
Table 1: Demographics

Values are expressed as medians (25th percentile, 75th percentile) or n/N (percentages), as appropriate.
ALS = amyotrophic lateral sclerosis. PLS = primary lateral sclerosis. MRI = magnetic resonance imaging. EMG = electromyography.
Radiological markers data are displayed in Table 2. MBS was positive in 69.2% (95% CI, 38.9–89.6%) of ALS and 80.0% (95% CI, 29.9–99.0%) of PLS patients, respectively. Positive T2/FLAIR corticospinal tract hyperintensity was found in 53.9% (95% CI, 26.1–79.6%) of ALS and 40.0% (95% CI, 7.3–83.0%) of PLS patients. Interestingly, 60.0% (95% CI, 17.0–92.7%) of PLS patients were MBS positive without T2/FLAIR hyperintensities in the corticospinal tract, compared to 15.4% (95% CI, 2.7–46.3%) of ALS patients. There were no statistically significant differences in the frequencies of radiologic markers between ALS or PLS patients. No MBS or T2/FLAIR corticospinal tract hyperintensities were observed in the controls, and therefore did not enter our statistical analyses.
Table 2: Radiological markers in ALS and PLS patients

ALS = amyotrophic lateral sclerosis; DWI = diffusion-weighted imaging; EPI = echo-planar imaging; FLAIR = fluid-attenuated inversion recovery; GRE = gradient echo sequence; MRI = magnetic resonance imaging; PLS = primary lateral sclerosis; SWI = susceptibility-weighted imaging; T2 = T2-weighted imaging.
Values are expressed as medians (25th percentile, 75th percentile) or n (percentages, 95% CI), as appropriate.
Non-normalized and normalized susceptibility quantification values of the motor cortices across ALS, PLS, and control groups are demonstrated in Figure 5. There is a nonsignificant trend towards higher susceptibility values of motor cortices in PLS patients compared to ALS or controls. Kruskal–Wallis tests were negative, hence post hoc analyses were not performed (left motor cortex p = 0.41, normalized left motor cortex p = 0.50, right motor cortex p = 0.07, normalized right motor cortex p = 0.13).

Figure 5: Clustered Boxplot of Median Susceptibility Values Across ALS, PLS and Controls. Boxplot created with SPSS v 23 (IBM, Armonk, NY) of susceptibility quantification measurements expressed as medians with boxes representing 25th and 75th percentiles, and error bars representing minimum and maximum values. ALS, amyotrophic lateral sclerosis; PLS, primary lateral sclerosis; LMC, left motor cortex; RMC, right motor cortex; Normalized LMC, left motor cortex normalized to ventricle; Normalized RMC, right motor cortex normalized to ventricle; ppm, parts per million.
We compared median susceptibility values of motor cortices between ALS patients with a global UMN score of 0 and ≥ 1 on the contralateral side (shown in Table 3). Interestingly, normalized LMC susceptibility measurements were significantly higher in ALS with positive right UMN features versus patients without (p = 0.03), though non-normalized LMC susceptibility values did not reach statistical significance. No statistically significant difference was observed with non-normalized and normalized RMC susceptibility values, although they trended nonsignificantly higher in ALS patients with positive left UMN features.
Table 3: QSM metrics of motor cortices in ALS with and without contralateral UMN features

Values are expressed in ppm as medians (25th percentile, 75th percentile).
ALS = amyotrophic lateral sclerosis; LMC = left motor cortex; Normalized LMC = left motor cortex normalized to ventricle; Normalized RMC = right motor cortex normalized to ventricle; QSM = quantitative susceptibility mapping; RMC = right motor cortex; UMN = upper motor neuron.
* p = 0.03
a p = 0.11
b p = 0.08
c p = 0.08
To identify possible correlations between susceptibility values in motor cortices and the contralateral global UMN scores in ALS, we performed Kendall’s tau correlation. There was a modest positive correlation between normalized LMC susceptibility values and right-sided UMN scores that reached statistical significance (τ b = 0.628, p = 0.03). Non-normalized LMC susceptibility values also had a modest positive correlation, but did not reach statistical significance (τ b = 0.539, p = 0.07). Non-normalized and normalized RMC susceptibility values similarly shared a modestly positive correlation with left-sided UMN scores, but these were not statistically significant (RMC τ b = 0.517, p = 0.07, normalized RMC τ b = 0.516, p = 0.07). Partial nonparametric correlations adjusting for age were not statistically significant for any of the correlations (data not shown).
Finally, we present clinical outcomes in MBS positive and negative ALS patients in Table 4. Overall, there was no significant difference between the two groups.
Table 4: Clinical outcomes in motor band sign positive and negative ALS patients

Values are expressed as medians (25th percentile, 75th percentile) or n (percentages, 95% CI), as appropriate.
ALS = amyotrophic lateral sclerosis; mRS = modified Rankin score.
Discussion
Radiologic markers are garnering interest for diagnostic and prognostic values in MND. However, evidence remains limited due to the rarity of MND. This explorative retrospective study demonstrates significant proportions of ALS (69.2%, 95% CI 38.9–89.6%) and PLS patients (80.0%, 95% CI 29.9–99.0%) are MBS positive and are best detected with the SWI sequence. This is consistent with a recent study by Roeben et al. that demonstrate the MBS in 78% of ALS patients who had SWI sequence available. Reference Roeben, Wilke, Bender, Ziemann and Synofzik7 Indeed, studies suggest that SWI confers the highest sensitivity for iron content among MRI sequences. Reference Adachi, Sato and Saito19 To prove the correlation between MBS and iron accumulation, the same study demonstrated a high correlation between MBS hypointensity and microglial antiferritin staining postmortem in an ALS patient. Reference Adachi, Sato and Saito19 Notably, there was no clinical evidence of UMN degeneration in this particular ALS patient due to severe muscular atrophy from LMN involvement. Reference Adachi, Sato and Saito19 Furthermore, MBS was most frequently observed in PLS in our study, a MND primarily characterized by UMN degeneration. These findings support that 1) MBS is a radiologic marker of UMN degeneration and 2) MBS is best detected with the SWI sequence. Thus, MRI with SWI may have an important implication in the diagnosis of ALS, where UMN signs may be difficult to elicit due to severe muscular atrophy from LMN degeneration.
T2/FLAIR corticospinal tract hyperintensity has been studied as a marker of corticospinal degeneration. However, this marker is felt to be nonsensitive and nonspecific, as it can be associated with normal aging. Our data show that with SWI, MBS is more commonly observed than T2/FLAIR corticospinal tract hyperintensities in MND and can be detected in 60.0% (95% CI, 17.0–92.7%) of PLS and 15.4% (95% CI, 2.7–46.3%) of ALS patients without T2/FLAR corticospinal tract hyperintensities. This raises a speculation that MBS may be a useful adjunctive radiologic marker of UMN degeneration in ALS.
Susceptibility quantification measurements generally trended higher in PLS patients compared to ALS or controls. This trend may reflect the fact that PLS is predominantly defined by clinical evidence of UMN degeneration. This data supports our hypothesis that higher susceptibility measurements reflect greater degrees of UMN degeneration. The non-significance is most likely attributed to our small sample size.
We then explored the relationship between susceptibility measurements and clinical UMN features in ALS. Notably, normalized LMC susceptibility measurements consistently showed a significant positive correlation with the degree of contralateral UMN clinical features in ALS. This trend provides support that the degree of hypointensity (i.e. susceptibility quantification measurements) in primary motor cortex may be a surrogate marker of the severity of UMN involvement in ALS. The nonsignificant relationships between RMC values and contralateral UMN features were likely due to our small sample size. Alternatively, the greater correlation between LMC and right-sided UMN features may be consistent with a previous study by Devine et al. demonstrating disproportionally greater degrees of LMC gray matter atrophy on structural MRI in right-handed ALS patients. Reference Devine, Pannek, Coulthard, McCombe, Rose and Henderson20 These findings may suggest a hypothesis that the neurodegenerative pathology in ALS may have a predisposition for the dominant hemisphere. Reference Devine, Pannek, Coulthard, McCombe, Rose and Henderson20 The cause for this laterality remains unknown, though some possibilities include the higher complexity of the motor circuitry in the dominant hemisphere, cellular density, excitability, and hormonal influences. Reference Devine, Pannek, Coulthard, McCombe, Rose and Henderson20
Lastly, we explored the prognostic role of MBS. PLS often carries a significantly better prognosis than ALS. Since PLS is characterized by UMN degeneration which forms the basis for MBS, we hypothesized whether the presence of MBS in ALS patients is also associated with a better prognosis. However, our data did not demonstrate any significant prognostic advantage.
Our study has several important limitations. Our sample size was small to detect significant results. There is also a relative over-representation of PLS (5/18) compared to its lower prevalence in MND as a whole. This was likely due to a local institutional referral bias arising from the fact that neuromuscular clinicians were aware that MRI-SWI had been flagged as potentially useful in diagnosing patients with PLS. Given these limitations, the generalizability of our study is limited; rather, we focus on providing descriptive data for hypothesis generation and warranting larger studies to elucidate the significance of MBS in ALS. It is arguable whether PLS and ALS should have been analyzed as separate disease entities, as there is much debate whether these are indeed two separate disorders or rather diseases within the same spectrum. However, for the purpose of exploring the association of MBS with the degree of UMN involvement, we analyzed the data with stratification of our cohort into ALS and PLS, given the latter is a predominantly UMN disease.
Due to the retrospective nature of this study, it remains unclear whether the MBS can be found prior to the onset of clinical UMN degeneration. Prospective studies of serial MRI imaging in ALS and/or PLS patients may better delineate the onset of MBS in relation to the onset of clinical UMN signs and provide insight on the application of the MBS as a potential diagnostic and prognostic marker of MND. Furthermore, our outcome measures, an in-house clinical UMN score and mRS, are not ones commonly encountered in ALS research. We were not able to employ more pertinent measures, including the revised ALS functional rating scale and Ashworth spasticity scale, due to the retrospective data collection. This remains an important limitation to note and should be addressed in future prospective studies with more relevant outcome measures.
Lastly, it should be noted that our study does not explore the frequency of MBS in other neurodegenerative diseases. Postmortem studies have shown increased iron content at sites of neurodegeneration in diseases such as Parkinson’s and Alzheimer’s disease. Reference Kwan, Jeong and Van Gelderen21,Reference Zecca, Youdim, Riederer, Connor and Crichton22 To our knowledge, there is no study examining the frequency of MBS in neurodegenerative disease other than ALS. Thus, the specificity of MBS remains unclear. This can be addressed in future studies comparing the frequency of MBS in MND, and other neurodegenerative diseases that are known to have associations with iron accumulation in the brain.
This exploratory study does provide limited evidence for the potential usefulness of MBS in detecting UMN involvement in ALS – with the hope of eventually providing direct pathophysiologic confirmation, offering surrogate markers of disease progression, and helping delineate MND subtypes for prognosis and therapy. The evidence from our study and previous studies support SWI sequence to be routinely included in patients suspected to have MND to detect MBS as a surrogate marker of UMN involvement, which may be particularly useful when patients do not demonstrate obvious clinical evidence of UMN degeneration. However, the precise diagnostic accuracy of the MBS, and its role in prognostication in patients with an established diagnosis of MND, need to be better elucidated in larger, prospective studies.
Supplementary Material
To view supplementary material for this article, please visit https://doi.org/10.1017/cjn.2022.52
Conflict of Interest
All authors have completed the International Committee of Medical Journal Editors (ICMJE) Conflict of Interest form. Authors HSC, GM, PB, and SC declare no conflict of interest.
Statement of Authorship
HSC participated in data analysis, drafting and revising the manuscript. GM participated in conceptualization, data collection, data analysis, and revising the manuscript. PB participated in conceptualization, data collection, data analysis, drafting, and revising the manuscript. SC participated in conceptualization, data collection, data analysis, drafting, and revising the manuscript. All authors certify that they have participated sufficiently in the work to take public responsibility for the manuscript's content and have provided approval for the current version of the manuscript to be published.


 Open access