


People express considerable, if not overwhelming, support for women in politics. A supermajority (60+ per cent) of Canadians consistently agree that the best way to protect women is to elect more to Parliament (Fournier et al., Reference Fournier, Cutler, Soroka and Stolle2011; Stephenson et al., Reference Stephenson, Harell, Rubenson and Loewen2020). Indeed, when asked directly and explicitly about their attitudes toward women in politics, less than 15 per cent of Canadians express (to interviewers) any reluctance about electing more women to Parliament. Yet women remain dramatically underrepresented in electoral politics, both as legislative representatives and as democratically selected heads of government. Furthermore, when women lead parties that can form government, they are often forced to resign after a short period of time (O'Neill et al., Reference O'Neill, Pruysers and Stewart2019), even though they may sometimes receive more positive news media coverage than their male peers (Thomas et al., Reference Thomas, Harell, Rijkhoff and Gosselin2020).
Building on stereotype scholarship based on social roles, we argue that while voters express generalized support for women candidates, the direct measures used in many surveys systemically underestimate the prevalence of stereotypes about women's capacity for politics in Canada, particularly among some groups. Our evidence is drawn from two original studies, embedded in two separate surveys. The first study directly asks participants to (dis)agree with stereotypical statements about women's capacity for politics; the second uses a list experiment to mitigate social desirability bias that may arise when participants react to these statements. Each is designed to gauge stereotypes about women's capacity for politics and political work in Canada, rather than stereotypes about women or women politicians.
While similar work shows varying levels of stereotype endorsement in the United States (Streb et al., Reference Streb, Burrell, Frederick and Genovese2008; Burden et al., Reference Burden, Ono and Yamada2017), little work explores the nature of gendered political beliefs in Canada. We argue that replicating these stereotype studies in contexts such as Canada can offer important insights. While Canada and the United States share some media and cultural cues that likely inform some gender stereotypes, Canada's multiparty, parliamentary system can offer political opportunities for women not yet seen in the United States. These opportunities include recent gender parity cabinets at the federal level and in some provinces, prominent female provincial heads of state, and openly feminist rhetoric from several major parties. Given this, it would not be surprising if Canadians were systematically positive about women's capacity for politics.
Results show that approximately one in five Canadians think that men are “naturally better” leaders than are women and that women are “too emotional” and “too nice” for politics. We take this to mean that sexist stereotypes about women and politics remain robust in Canadian politics. These findings provide population-level estimates of explicit sexism in the Canadian political system and suggest that explicit stereotypes about women, in general, and their capacity for politics and political work, in particular, are common enough that women who engage in politics—as candidates, representatives, local organizers, or in other capacities—are likely to face socially imposed barriers. While social pressure and norms drive down agreement with these stereotypes on most surveys, more subtle measures show that these stereotypes are still widespread. This discrepancy illuminates the incongruence between the strong, clear stated preference for integrating more women into politics and the continued underrepresentation of women in political work and electoral institutions in Canada.
Gender Stereotypes, Women and Politics
Stereotypes are shared beliefs about someone's attributes and behaviour based on their group memberships (Allport, Reference Allport1954; Devine, Reference Devine1989). Often rigid and blunt, stereotypes can be positive, negative or neutral, and they can address ideas about character, appearance and skills. For example, women are stereotyped as kind, supportive and warm; pretty and petite; imaginative and creative; and gullible, subordinate and nagging. In contrast, men are stereotyped as competitive and courageous; strong and muscular; analytical and good with numbers; and arrogant and egotistical. Many of the stereotypes associated with men are also linked to leadership (Eagly and Karau, Reference Eagly and Karau2002). Men in politics are more likely to be described as driven and leaders (Schneider and Bos, Reference Schneider and Bos2014: 255), as the stereotypes used to evaluate men and politicians overlap substantially.
Social role theory argues that gender stereotypes are based on different family, social and occupational roles filled predominantly by women and men (Schneider and Bos, Reference Schneider and Bos2019: 175; Kerevel and Atkeson, Reference Kerevel and Atkeson2015: 733). Women are stereotyped as caring and mothering, even if they are not themselves mothers or particularly caring, because women are far more likely than men to occupy caring roles (Carpinella and Bauer, Reference Carpinella and Bauer2021). Stereotypes generated from these social roles are often abstractions, and when an individual from a stereotyped group appears to be incongruent with that ideal, they may be sanctioned. Thus, women politicians are seen as deviant women who do not possess typically feminine traits yet who cannot quite conform to the positive traits desired of politicians (Schneider and Bos, Reference Schneider and Bos2014, 2019).
Capturing the ways in which people deal with the disconnect between gendered stereotypes about women, in general, and women in politics, more specifically, requires us to think about how we can understand the widespread nature of such stereotypes, while also addressing social desirability concerns. We step back from studies that examine explicit, but generalized, sexist attitudes such as hostile and benevolent sexism (Glick and Fiske, Reference Glick and Fiske1996, Reference Glick and Fiske1997, Reference Glick and Fiske2001) and examine specific stereotypes about women's capacity to succeed in politics. While the stereotypes we address could be broadly categorized as hostile or benevolent, our focus is both on the connections to politics and on how many agree with these stereotypes about women's capacity for politics.
The challenge with both sexist attitudes and stereotypes in general is that measures based on asking about them directly in a survey are likely to suffer from social desirability bias. People may think that women's general capacity for politics is lower than men's but also think that it is not acceptable to publicly state such a belief. For example, Streb et al. (Reference Streb, Burrell, Frederick and Genovese2008) estimate with a list experiment that 26 per cent of Americans would be angry if a woman served as president of the United States. Burden et al. (Reference Burden, Ono and Yamada2017) replicated Streb et al.'s study and found significant but lower levels of stereotype agreement, especially among certain subpopulations (that is, men, Republicans, respondents with lower levels of education; see also Benson et al., Reference Benson, Merolla and Geer2011). Experimental studies about support for women and Black candidates are plagued by social desirability problems, though scholars have sometimes found novel approaches to mitigate these effects (Krupnikov et al., Reference Krupnikov, Piston and Bauer2016). Therefore, it bears exploring whether the patterns we often observe with direct measures are more a function of social desirability bias effects than true underlying patterns of stereotypical beliefs.
Even a cursory look highlights how negative stereotyping about women's general capacity for politics, grounded in social role theory, likely affect Canadian politics. Women are still far less likely to be selected as federal candidates than are men, especially in ridings their parties are likely to win (Thomas and Bodet, Reference Thomas and Bodet2013; Johnson et al., Reference Johnson, Tolley, Thomas and Bodet2021). When local party associations fail to integrate women into their structures, they are more likely to fail to nominate women as candidates too (Cheng and Tavits, Reference Cheng and Tavits2011; Cross and Pruysers, Reference Cross and Pruysers2019). This suggests that gendered ideas about who is best suited for politics strongly structure the candidate nomination process in Canada. Similarly, media coverage about women in politics is also highly gendered, as women politicians receive less coverage, even as provincial premiers. That coverage is still more likely to focus on women's appearance and typically uses more gendered language than does coverage of politicians who are men (Thomas et al., Reference Thomas, Harell, Rijkhoff and Gosselin2020; Trimble, Reference Trimble2017). At its worst, these gendered expectations about women's appropriate place in politics inform worrying patterns of sexual harassment (Collier and Raney, Reference Collier and Raney2018) and gendered violence (Krook, Reference Krook2020) in Canadian politics. Understanding how widespread and common negative stereotypes about women's general capacity for politics are among Canadians may go some way in helping to explain these enduring gendered patterns across Canadian politics.
Empirical expectations
In the following analysis, we provide evidence of negative stereotyping of women's general capacity for politics while also showing that social desirability bias affects the patterns we observe. These studies show the pernicious and subtle ways in which people evaluate women's capacity and fit with politics.
The previous literature generates several empirical expectations. First, following social role theory, we expect that some respondents will agree with explicit stereotypes about women's capacity for politics. Without accounting for social desirability bias, we expect that several demographic factors (gender, ideology, partisanship) will predict explicit stereotype agreement (H1). However, work on social desirability bias suggests that these direct measures may be insufficient for uncovering true levels of agreement with these stereotypes. As such, we expect that after removing the effects of social desirability, explicit stereotypes about women's capacity for politics will be more ubiquitous; as such, few demographic or political variables should predict explicit stereotype agreement (H2).
Study 1: Direct Measurement of Stereotypical Beliefs
In Study 1, we begin by testing for patterns in agreement with gendered stereotypes about women's capacity for politics with a direct measure of gender stereotypes that does not account for social desirability bias. We created three stereotypical statements about women's general capacity for politics, derived from work on hostile and benevolent sexism (Glick and Fiske, Reference Glick and Fiske1996: 491–92). First, because hostile sexism is derogatory and being a leader is broadly associated with men both inside and outside of politics (Mo, Reference Mo2015; Schneider and Bos, Reference Schneider and Bos2014), our first stereotypical statement is that men are naturally better leaders than women. Our second and third stereotypical statements are associated with women in general and how women's reactions to politics might be stereotyped: women are too emotional for politics and women are too nice for politics. Both specifically cue the difference between stereotypes about women in general and women politicians.
Sample construction and characteristics
Data collection for the first study was conducted by Qualtrics (n = 1,016). The survey took approximately 20 minutes to complete. The data were collected in Canada over five weeks in February and March of 2018. Participants could take the survey in either English or French and were selected based on a quota system using age, gender, education and language to produce a sample that reflects Canadian population parameters. This produced a sample that is 88 per cent white and 53 per cent women, with a median age of 47. The median education level is some postsecondary education, and the median income range is between 30,000 and 59,999 CAD. In addition, 23 per cent of the sample elected to take the survey in French, while 77 per cent chose to take it in English.
While we recognize the issues with online samples, we use the Qualtrics system with quota matching to best approximate a nationally representative sample. While not a true random probability sample, research from Boas et al. (Reference Boas, Christenson and Glick2018) shows that Qualtrics samples are the closest approximation to nationally representative samples available in the online convenience sample world. Given these findings and the close matches between our sample demographics (discussed in text and displayed graphically in the appendix), we believe our results are not dependent on the Qualtrics sampling procedures or panel composition. Furthermore, we also use iterative proportional fitting to construct weights for our data based on 2016 Canadian census data, using gender, age and (in Quebec) language.
Direct stereotyping measures
Respondents were presented with the three statements detailed earlier (men are naturally better leaders, women are too emotional for politics, women are too nice for politics) and asked to indicate how strongly they agreed or disagreed with the statements. Responses were on a five-point scale, from strongly agree to strongly disagree, and were rescaled to run from 0 to 1, with 1 representing strong agreement with the statement and 0 indicating strong disagreement with the statement.
Results
To begin, we note that significant percentages of respondents expressed some explicit agreement with these statements. After weighting, approximately 15.5 per cent of respondents agreed with the “naturally better” stereotype, while 12.1 per cent agreed with the “too emotional” stereotype and 8.2 per cent agreed with the “too nice” stereotype. In addition to the aggregate proportions, we regress stereotype endorsement on respondent gender, education, age, ideology, partisanship and religious importance.Footnote 1
To ease interpretation, we present our results graphically. Regression tables are available in the appendix. Figure 1 shows that women are significantly less likely to agree with these stereotypes, ranging from 6 points less supportive with the “too nice” stereotype to 14 points less supportive of the “naturally better” stereotype. Similarly, ideology exerts a strong influence, with people who identify with the political right (coded as 1) being significantly more likely to agree with all three stereotypes than those who identify with the political left (coded as 0). Religiosity also conforms to expectations, with higher levels of religious importance corresponding to more traditional gender views.
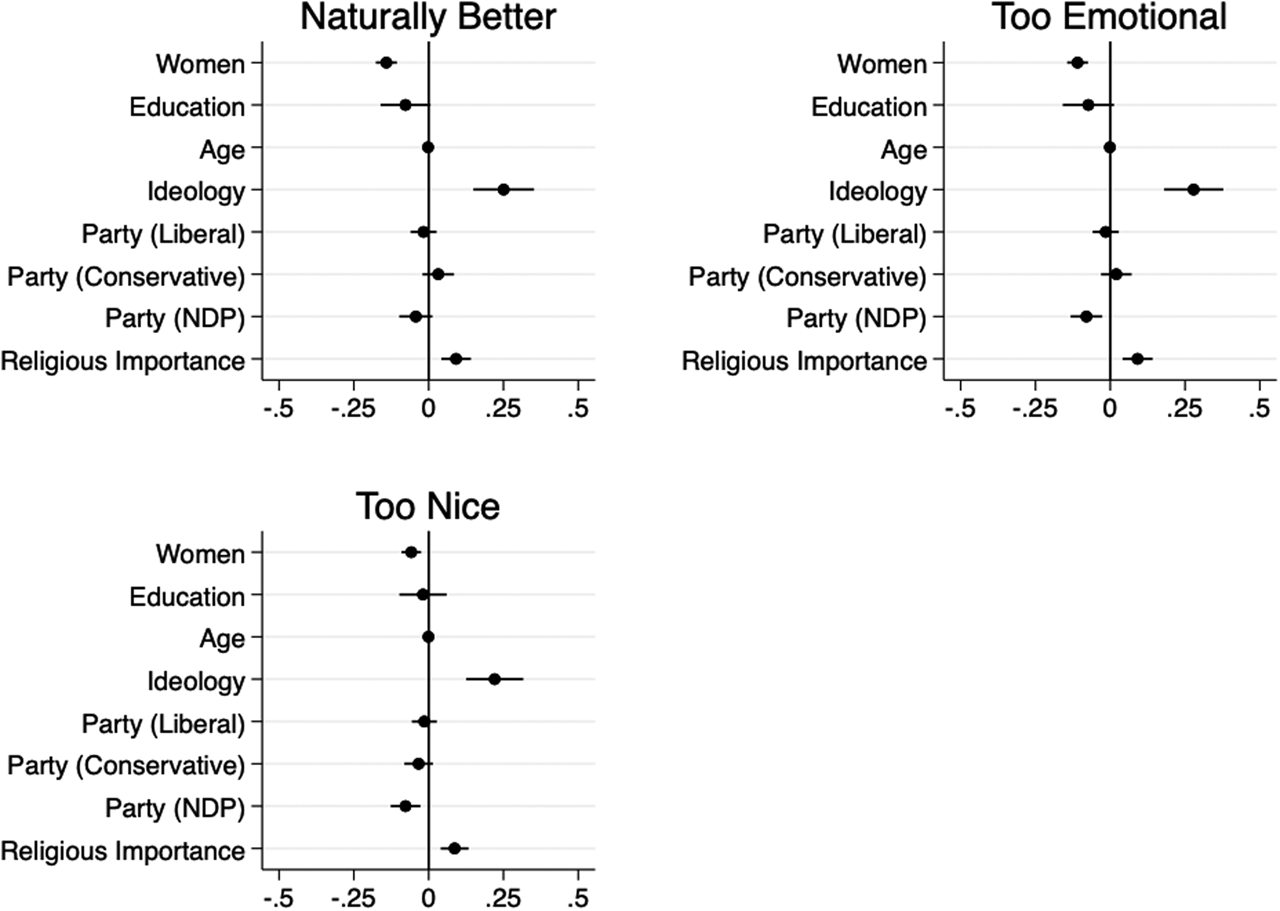
Figure 1 Demographic and political predictors of stereotype agreement, direct questioning
Note: Figure 1 displays OLS regression point estimates and 95 per cent confidence intervals. Regression table available in the appendix (Table A4). Women, Party (Liberal), Party (Conservative), and Party (NDP) are indicator variables. Education is a 10-category variable coded 0 to 1, with higher values corresponding to more education. Age is naturally coded. Ideology is coded 0 (Left) to 1 (Right). Religious importance is a 4-category variable coded 0 (not important at all) to 1 (very important).
Interestingly, the party results are more mixed. We include dummy variables for the three major Canadian federal parties (Liberals, Conservatives and the New Democratic Party [NDP]). The base category is a reference category of those who hold no partisan identification or who identify with a smaller party such as the Greens or Bloc Québécois.Footnote 2 Partisans affiliated with the NDP are less likely to agree with the “too emotional” and “too nice” stereotypes, although they show no difference from the reference category for the “naturally better” stereotype. However, neither Liberals nor Conservatives show any difference from the reference category in stereotypical beliefs. This suggests that it may take more than symbolic gestures toward gender equity—such as prominently appointing a gender parity cabinet—to drive party supporters to follow party elites (see, for example, Lenz, Reference Lenz2012). Instead, leader-driven attitudinal change may take decades of work of elevating women into leadership positions within the party (Byrne, Reference Byrne2005) before supporters take the cue. Stated differently, while we fully acknowledge the power of symbolic representation through mechanisms such as parity cabinets, we argue that it is both prudent and effective to pair them with other actions designed to promote gender equality.
Taken together, these results show the continued prevalence of stereotypes about women's capacity for political work. As expected, when asked about these stereotypes directly, we find that typical socio-political factors, such as gender, religiosity, ideology and partisanship are strong predictors of stereotype agreement. This could suggest that certain demographic groups are simply more likely to stereotype women.
We expect, however, that this is not the complete story. Our expectation, as outlined in H2, is that social desirability pressures operate differently for some groups. We suspect that conservatives and highly religious individuals, for example, face less social pressure to reject gender stereotypes, while groups such as NDP partisans are subject to strong pressure to (publicly) reject those same stereotypes. To assess whether these patterns result from genuine differences in stereotypical beliefs or simply differences in susceptibility to social desirability, we turn to our second study.
Study 2: Social Desirability and Indirect Stereotypes Study
In an ideal world, when we directly ask respondents whether they agree or disagree with a stereotypical statement, we would get a truthful answer; obviously, this approach can fail when presenting statements where agreement involves violating a social norm. To address this problem, we use a list experiment designed to measure aggregate values of belief in a socially undesirable statement. The list experiment has been used extensively in political science research on gender (Benson et al., Reference Benson, Merolla and Geer2011; Streb et al., Reference Streb, Burrell, Frederick and Genovese2008), race (Kuklinski et al., Reference Kuklinski, Cobb and Gilens1997; Martinez and Craig, Reference Martinez and Craig2010) and religion (Kane et al., Reference Kane, Craig and Wald2004).
The execution of the list experiment is simple: we randomly assign respondents to one of four groups. The control group is asked how many of the following four statements they agree with (and they are specifically asked for the number of statements they agree with, not which statements they agree with):
• Cooperation between politicians and parties produces better public policy.
• Recreational marijuana consumption should be legalized.
• When necessary for public safety, police should have access to cell phone records without a warrant.
• All politicians can be trusted to spend the public's money wisely.
The four statements were constructed following Glynn's (Reference Glynn2013) advice, which address concerns raised by Kuklinski et al. (Reference Kuklinski, Sniderman, Knight, Piazza, Tetlock, Lawrence and Mellers1997) about potential ceiling effects. One-quarter of our participants were assigned to the baseline group, while the remaining three-quarters were randomly assigned to view a list with one of the three sexist stereotypes about women and politics outlined above as a fifth list item. Since participants are not asked to tell us which statements they agree with, just the total number of statements, we eliminate pressure for respondents to avoid admitting they hold a socially undesirable belief. And because respondents’ assignment to the control and experimental groups is random, the baseline level of agreement with the four statements should be the same in each group, allowing us to capture the percentage of the population that agrees with these gender stereotypes based on hostile and benevolent sexism.Footnote 3
Sample construction and characteristics
Data for this study were collected with an online survey experiment conducted in Canada (N = 1,650). The data were collected over four weeks in January and February of 2017. The questionnaire was available in both English and French. Data collection was conducted by Qualtrics. The full survey took approximately 22 minutes to complete.
Respondents were selected based on a quota system, using age, gender and education to screen participants and produced a sample that reflected the Canadian population. Our sample was 51 per cent women, 81 per cent white, had a median age range of 30–39, and attained a median educational level of some postsecondary education. Additionally, 65 per cent of the sample chose English as their primary language, 30 per cent chose French, and 5 per cent chose another language. We again use iterative proportional fitting to construct weights for our data based on 2016 Canadian Census data, using gender, age and (in Quebec) language and use these weights when methodologically appropriate and possible.
Results
Looking at the full sample results, we find that Canadians are more likely to agree with each statement in Study 2 when asked in such a way as to avoid social desirability bias compared to Study 1 when the statements asked directly. Using an adjusted Wald test with weighting, 20.1 per cent agree that men are “naturally better” leaders compared to 15.5 per cent without accounting for social desirability bias; 23.1 per cent agree that women are “too emotional” for politics (compared to 12.1 per cent); and 19.2 per cent agree that women are “too nice” for politics (compared to 8.2 per cent).Footnote 4 All three of these results are statistically significant differences between the treatment and control conditions (p = .006, p = .002 and p = .007, respectively).Footnote 5
While the standard, aggregate-level analysis of the list experiment shows that the Canadian population, in general, exhibits greater levels of stereotype endorsement, it cannot speak to the socio-demographic predictors of stereotype endorsement. In particular, we are interested in whether individual-level predictors of direct stereotype endorsement hold when social desirability pressures are alleviated.
To adjudicate between the two stereotype agreement possibilities—that is, whether stereotype differences are the result of differential social pressures or differential beliefs—we conduct a multivariate analysis using Blair and Imai's (Reference Blair and Imai2012) item count technique maximum likelihood estimator.Footnote 6 Results are presented in Figure 2, with the full regression table in the appendix. It is important to note, at this point, that insignificant coefficients in this analysis do not indicate that individuals with these characteristics do not believe in the stereotypes; they instead indicate that, at least in these data, this socio-political group does not appear to differ in their stereotype beliefs from the base (reference) category.
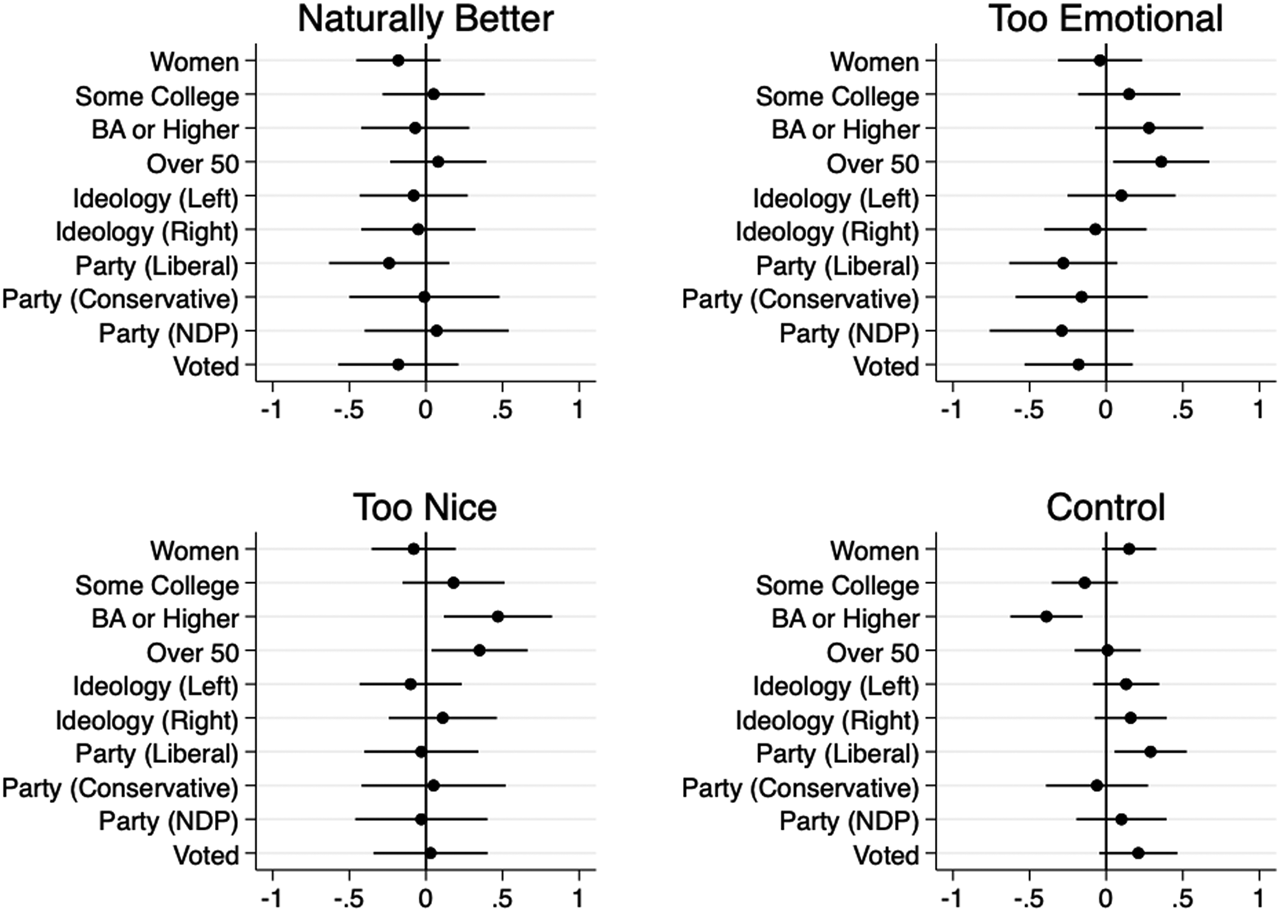
Figure 2 Demographic and political predictors of stereotype agreement, list experiment
Note: Figure 2 displays point estimates and 95 per cent confidence intervals from Blair and Imai's (Reference Blair and Imai2012) multiple sensitive item, item count technique (list experiment) regression, using maximum likelihood estimation. Regression table available in the appendix (Table A5). All variables are 0/1 indicator variables. The excluded categories are “high school or less” (education); “under 50” (age); “ideology (moderate)” (ideology); “party (none)” (partisanship); and “did not vote” (vote history).
The results are clear: at least in this sample, very few demographic factors systematically influence whether someone agrees with gender stereotypes about women's political capabilities. Compared to younger participants, participants over the age of 50 are significantly more likely to agree that women are both “too emotional” and “too nice” for politics. While our data do not allow us to test whether this is driven primarily by older men, it does accord well with results from New Zealand showing increases in certain types of sexist beliefs with age among men (Hammond et al., Reference Hammond, Milojev, Huang and Sibley2017). Interestingly, participants with a university degree agree that women are “too nice” for politics at significantly higher rates than do participants with lower levels of education in Study 2. Thus, while higher levels of education are commonly believed to correlate with more left-leaning social views, this correlation does not appear to extend to sexist tropes that may be seen as positive or neutral in valence by some individuals when accounting for social desirability pressure. Aside from these few significant correlations, we find no evidence that gender, ideology, religiosity or partisanship predict stereotype agreement in the list experiment.Footnote 7
Overall, we find that stereotypes informed by sexism about women and politics exist and that they are reasonably ubiquitous once social desirability concerns are addressed and attenuated. These results show stereotypes about women's capacity for politics are broadly distributed across socio-demographic groups and the political spectrum. This also helps explain how stereotypes about women politicians are different from stereotypes about women in general.Footnote 8
Discussion
The results presented here generate important insights about how Canadians’ stated positivity about women in politics coexists with negative stereotype about women and politics. We probe the incongruence between stated support for women in politics and stereotypes about women in politics. Our first study tests for explicit stereotype agreement and finds that the expected socio-political variables—such as gender, age, ideology, partisanship and religiosity—are strong and significant predictors of expressing stereotypical beliefs. These results, however, raise questions about whether responses reflect true underlying differences or simply differential effects of social pressure. Our second study showed that a small but significant number of Canadians agree with the idea that men are “naturally better” leaders than women and that women are “too emotional” and “too nice” for politics, and once we account for social desirability, these responses are not conditioned by socio-political variables. These results demonstrate that stereotypical ideas about women and politics are not unevenly distributed across social and political identities, such as gender, ideology or partisanship. Though this is certainly confirmed when we ask people to directly agree with these stereotypical statements, when we take care to address social desirability, we find that these ideas are more ubiquitous. Instead of simply concluding that men, older people, and those who hold more socially conservative or traditional views are most likely to stereotype women with respect to politics, we must also take into account that certain groups—younger people, women, those on the political left—are more aware that these views are problematic and are, therefore, less likely to publicly express their beliefs and women's capacity for politics. When provided with the deniability provided by the list experiment, these groups express similar levels of agreement with stereotypical statements. When taken together with Canadian Election Study data, our findings suggest that while supermajorities of Canadians think the best way to protect women's interests is to elect more of them, significant proportions of Canadians also think that women are too emotional, too nice, or otherwise not cut out for that job compared to men. This grim conclusion helps explain why women's progress and presence through Canadian politics is, at best, incremental and episodic.
Across Canada, electoral politics remain strongly structured by gender and race. Our results help explain why parties with such different views of gender equality and diversity all continue to overrepresent men, at least as candidates and leaders. Indeed, the issue of how best to address and mitigate these stereotypes may be particularly problematic for parties that express a stated goal of gender equality, as some of their members may not actually be as open to it as they claim to be. It seems plausible that this unstated reticence extends to race, Indigeneity, sexual orientation, and interactions with gender (Tolley, Reference Tolley2019). Future research should certainly explore these relationships. While our work extends the findings outside the US context, future research should also extend it to other countries, as these gendered and racialized patterns may be ubiquitous.
We also note that our results raise serious questions about the ability of survey researchers to rely on individuals to self-report attitudes that violate social norms. If we only relied on direct survey questions, we would conclude that stereotypes about women's general capacity for politics are confined to specific elements of Canadian society (for example: conservatives, religious people, men). This conclusion is, in our view, incorrect: these views are more commonly found across the political and demographic groups we study here. Research that relies solely on self-reports of stereotyping may produce biased measurements and thus generate biased results if social desirability is not accounted for in some manner.
Taken together, these findings shed light on the disconnect between people's stated positivity about women and politics and women's continued political underrepresentation. Explicit, negative, socially undesirable stereotypes play a key role in this process and, in our view, the remedy for this must be addressed explicitly too. These stereotypes about women and their capacity for political work remain a serious barrier to women in politics, and until they are addressed and minimized rather than simply hidden by social desirability, women are likely to face continued barriers across Canadian politics.
Supplementary Material
To view supplementary material for this article, please visit https://doi.org/10.1017/S0008423922000890
Competing interests
The authors declare none.


 Open access