


1. Introduction
One of the most persistent and all-pervading influences on levels of mortality is social class, with differences between the classes being used to illustrate the extent of health inequalities within a population. While, in theory, it should be possible to eliminate such inequalities, data for England and Wales show that they still persist even in the present century, with infant mortality rates (deaths at under one year old per 1,000 live births, hereafter IMR) for singletons in 2020 increasing uniformly from 2.3 in the highest social class to 5.4 in the lowest.Footnote 1 The powerful effect of social class on the mortality of all age groups has been demonstrated with relative ease from the early part of the twentieth century onwards.Footnote 2 Even though many researchers have assumed that the same relationship prevailed in previous centuries, this has never been demonstrated with any degree of certainty. When Woods and Williams examined social class variations in mortality over six centuries, they found that the health benefits obtained through wealth and education were frequently outweighed by environmental factors. Much of their pre-nineteenth-century evidence related only to elite groups, however, making it difficult to establish the exact effects of class on mortality.Footnote 3 When, in contrast, the authors used nineteenth-century data, published by the Registrar General for England and Wales, to calculate male adult mortality rates for 71 occupational groups for the years 1860–1861, 1871, 1900–1902 and 1910–1912, the figures showed that, even though mortality declined from the 1860s, class differentials were continually present across the years studied.Footnote 4
The ways in which social class affected and is still affecting mortality is a recurrent theme in the demographic literature. More than 30 years ago, Preston and Haines’ analysis of American census material in their pioneering book Fatal Years demonstrated that while social class did influence early age mortality, its effects were much smaller than in England and Wales, with factors such as race and settlement size being much more important.Footnote 5 By contrast, Dribe and Karlsson declared that the church records from six settlements in southern Sweden showed ‘no clear pattern of class differentials in childhood mortality in the first half of the nineteenth century’,Footnote 6 although differences did emerge later in the century. The extent and the causes of any social class differentials varied considerably from place to place. For example, in mid-nineteenth-century Amsterdam, Ekamper and van Poppel found a class gradient in infant mortality, but this was dwarfed by the effects of religious affiliation and place of residence.Footnote 7 Religion was also an important determinant of child mortality in Scalone and colleagues’ examination of the 1911 Belfast census. They argued, however, that while religion mattered, the ‘differences were related, in the main, to the varying socioeconomic composition of the three major religious denominations’.Footnote 8 Two German studies have also shown strong social gradients in infant mortality. In four parishes in the city of Rostock in the early nineteenth century, infant mortality was strongly associated with father’s occupation, while in Munich a similar association was discovered, and the occupational gap in mortality was shown to widen after 1875 owing mainly to ‘fertility behaviour, infant care practices, and economic circumstances’.Footnote 9 All these studies, using different source materials and methods of defining social class, identified an association between social class and infant mortality, even though this may have been mitigated by a range of local factors. Here we wish to add to the debate concerning the extent and cause of social class gradients in infant mortality by examining births and infant deaths in the English port town of Ipswich.
The first extensive examination of social class variations in early age mortality in England and Wales became possible as a consequence of answers given to questions posed in the 1911 census. Each cohabiting married woman was required to state the number of children to which she had given birth and the number of these children still alive on census night, that is, they were asked to report retrospectively on their fertility and experience of child mortality. These data were published according to the husband’s social class as determined by his occupation. The main driving force behind this analysis was T. H. C. Stevenson, the superintendent of statistics at the General Register Office in London, who wished to address eugenic concerns about fertility decline and the physical deterioration of the British population. As shown in Table 2, Stevenson employed a three-part classification system comprising: Class I, ‘the upper- and middle-classes’, which included occupations such as army officers, clergymen, bankers, mine owners, physicians and merchants as well as government ministers and members of the nobility; Class III, ‘occupations of which it can be assumed that the majority of men [were] skilled workmen’, such as millwrights, blacksmiths, gamekeepers, railway engine drivers, masons and tailors; and Class V, ‘occupations of mainly unskilled men’, amongst whom were included dock labourers, navvies, brush makers, hawkers and general labourers.Footnote 10 A further two un-named, intermediate classes, II and IV, were inserted between Classes I and III and III and V respectively so that occupations that did not fit easily into the three principal classes could be included. Farmers, grocers, teachers of music, veterinary surgeons, photographers and dealers were placed in Class II, while fishermen, police constables, warehousemen, shepherds, coopers, tanners, brewers, millers and gardeners found themselves in Class IV.Footnote 11 It was, of course, a subjective decision as to how occupations were placed into a class. In addition, Stevenson separated out a further three special classes: VI textile workers, VII miners and VIII agricultural labourers. Agricultural labourers were largely unskilled, but they had a mortality advantage since they mainly lived in relatively healthy rural areas, while it was difficult to differentiate between skilled and unskilled textile and mining occupations. However, Szreter has argued that textile workers and miners were excluded from the five main classes because of their exceptional nature – the low fertility of textile workers and the high fertility of miners meant that their inclusion in Classes III–V would have blurred the gradient that saw fertility increase as social class fell.Footnote 12
Table 2. Births by social class, Ipswich, 1871–1909 and England and Wales, 1911

Note: Classes I–V shown here and in the other tables and figures are based on father’s occupation, as reported in the Ipswich vaccination birth and death registers. The occupations were assigned to social classes using a system laid out by T. H. C. Stevenson, the superintendent of statistics at the General Register Office for England and Wales between 1909 and 1919, who used them to produce mortality statistics for the annual reports of the Registrar General. The classes were used by the Registrar General of England and Wales in his annual reports for 1911 and 1912 to report infant mortality, as well as to produce a report on the ‘Fertility of marriage’ from the special questions on that subject included in the 1911 census. See Census of England and Wales, 1911, Vol. XIII – Fertility of marriage: Part I. BPP 1917–1918 XXXV and Census of England and Wales, 1911, Vol. XII – Fertility of marriage: Part II (London: HMSO, 1923). Details of the composition of the classes can be found in table 28A of the Seventy-fourth annual report of the Register-General for England and Wales (1911) BPP 1912–1913 XIII [Cd 6578], 73–87. Births were assigned to the ‘single mother’ category if no details of the father were given in the vaccination birth register. Such births were assumed to have taken place outside marriage. Only five months of births in 1871 are included in the Ipswich vaccination registers.
Source: Ipswich, 1871–1909: Ipswich vaccination registers; England and Wales, 1911: Registrar General, Seventy-fourth annual report, 73–87.
The first application of Stevenson’s occupational classification system appeared in the Annual Report of the Registrar General for 1911 when a discussion of infant mortality by social class was presented.Footnote 13 Stevenson acknowledged that the assignment of groups of occupations into social classes
...is by no means precise, for in many cases, especially in commerce and industry, the census occupational description gives no certain indication of social position. The farmer for instance may farm 10 acres or 1,000, and the draper or brewer may be the head of a large establishment or his lowest paid assistant or labourer. As a result, many men, especially business men, belonging to the middle-classes have necessarily been included with the working-classes and this meant that when mortality rates were tabulated the contrasts were therefore somewhat understated.Footnote 14
In spite of these problems, Stevenson established a mortality gradient within the classes showing that in 1911 IMRs steadily increased from 76.4 per 1,000 live births in Class I to 152.5 in Class V.Footnote 15 Stevenson also discussed class-specific differences in infant mortality by age and cause, together with mortality amongst illegitimate children by mother’s occupation. He highlighted how infant mortality could differ between occupations comparing artists, merchants and medical practitioners from Class I, who recorded the lowest rates of 27, 30 and 39 respectively, with provision curers, costers/hawkers and patent fuel manufactures in Class V who recorded rates of 192, 196 and 199 respectively.Footnote 16 The extent of these differentials was such that ‘at least 40 per cent of the present infant mortality of this country could be avoided if the health conditions of infant life in general could be approximated to those met with in class 1’.Footnote 17 Class differences in infant mortality have, however, proven difficult to eliminate; continuing throughout the twentieth century, despite falling IMRs, and, as we have seen, they still persist in the third decade of the twenty-first century.
A number of authors have used the retrospective data from the 1911 fertility census on the number of babies each married woman had borne to her current husband and the number of those children who had died before census night to provide indirect estimates of infant mortality during the late nineteenth century, with assumptions being made about the distribution of these deaths over time.Footnote 18 Such studies have shown that class differentials in infant mortality stretched back until at least the mid-1890s and were largely consistent within different environments. Moreover, the highest classes appeared to benefit most from the post-1900 decline in infant mortality.Footnote 19 Garrett et al. show, for instance, that in 1894 the IMR in Class I was 106 while in Class V it was 171 (61 per cent higher), which compares with rates of 76 and 153 (101 per cent higher) in 1911.Footnote 20 A further study to address infant mortality differentials in late-nineteenth-century Britain was Naomi Williams’ examination of Sheffield in 1870–1871.Footnote 21 Using a copy of the death register compiled for the Health Committee, along with burial and cemetery records and the 1871 census, Williams was able to ascertain the father’s occupation for 53 per cent of all the infants who died in the town during these years.Footnote 22 From this sample she identified significant seasonal differences in infant mortality between the ‘skilled’ and the ‘unskilled’ parts of the population, although she also noted that the environment where these individuals lived exerted a powerful influence on overall IMRs.
While it seems likely that the class gradient in infant mortality, and perhaps at other ages, existed from at least 1870, this conclusion has necessarily been based largely on modelling the mortality of children whose parents survived to be recorded in the 1911 census.Footnote 23 Prior to 1911 it has not been possible to calculate class-specific IMRs in England and Wales directly from births and infant deaths. In order to undertake such an analysis, large numbers of birth and death certificates are needed, and while such data exist, access to them is at present prohibitively expensive.Footnote 24 An alternative source, exists, however, for one town: Ipswich in Suffolk. The Suffolk archive holds not only smallpox vaccination birth registers for the town for several decades from 1871 onwards, but also an almost full transcription of the death registers compiled by the town’s registrars for the same period. The vaccination birth registers contain details of all births, including the father’s occupation, and the death registers record all deaths in the town, including those of infants under one year old. By linking the two sets of data together and replicating Stevenson’s assignment of the fathers’ occupations to their social classes it is possible to follow class differences in IMRs as they unfolded during the late nineteenth and early twentieth centuries. As far as we are aware, this is the first time that such an exercise has been undertaken for a relatively large urban area in England or Wales.
Figure 1. Infant mortality rates in Ipswich: cohort rates from vaccination registers and period rates from Medical Officer of Health (MOH) reports, compared to period rates for England and Wales, 1871–1909.
2. The Ipswich vaccination registers
Smallpox vaccination was made compulsory for infants under three months old in 1853 and from 1871 local registrars were required to send monthly lists of births and deaths of infants aged under one year to the vaccination officers who were charged with administering the system.Footnote 25 These lists were compiled into the so-called vaccination registers and for Ipswich the Suffolk Record Office holds vaccination birth records for 1871–1930 and 1940–1958. Uniquely, rather than a vaccination death register, which should have contained a list of infant deaths only, Ipswich’s comprises a complete copy of the civil death registers from 1851 to 1945. The Ipswich vaccination registers were transcribed for the 1871–1910 period as part of an Open University project and by linking infant deaths to corresponding births within this dataset it is possible to create a series of IMRs for annual birth cohorts.Footnote 26 These represent the proportion of infants born in each year who did not survive to their first birthday; rather than the more usual period rates, which are calculated using both the births and the infant deaths that occurred in a particular year.Footnote 27 Since the transcribed death registers run from April 1871 until December 1910, it is possible to create IMRs only for the cohorts born from 1871 until 1909 since some infants born in 1910 will have died in 1911 and consequently the 1910 birth cohort must be excluded from the analysis. Births appear in the register only from late July of 1871 so the IMR for births from that year are based on the five months of births that could be followed into 1872 and consequently it may be affected by the seasonality of infant deaths; there was no discernible seasonality to births.
Figure 1 shows IMRs in Ipswich calculated from the vaccination registers (cohort rates) and those reported in the 1909 Medical Officer of Health (hereafter MOH) report (period rates) together with national period rates for England and Wales. We also calculated period rates from the vaccination registers. In general, these closely followed those of the MOH, so were not included in Figure 1 in the interests of clarity. The two Ipswich series shown follow similar trends even though they are not identical. In general, the vaccination register rates tend to be lower than those reported by the MOH and this is related to the methods of calculation adopted. In order for an infant death to be included in the vaccination register calculations, a link between a death and a birth in their respective registers had to be established and any infant death that could not be linked to a birth was necessarily excluded from the analysis. Most of these excluded deaths related to infants who had been born elsewhere and had moved into the town and then died there. Likewise, any infant born in Ipswich who moved out of the town and then died will appear amongst the births but not amongst the deaths in the mortality calculation, thus lowering the rates.Footnote 28 In each of the quinquennia from 1876 to 1910, between 5 and 7 per cent of infant deaths could not be linked to a birth.Footnote 29 Given that there were approximately 1,900 births per year in Ipswich during this period, the shortfall in the IMR is therefore about 5 per 1,000 births. Some of these unlinked infant deaths are easily accounted for; if we consider the 87 deaths that went unlinked in 1901–1909, for example, 9 (10 per cent) occurred in the East Suffolk hospital and were clearly identified as those of children whose origins lay outside the town.Footnote 30 Of the remaining 78 unlinked deaths, 17 (20 per cent) were recorded without a father. These, presumably illegitimate, infants give testament to the greater mobility of their mothers, but also to the possibility that the children were given a different surname at death from the one on their birth certificate, making linking extremely difficult. Seven unlinked infants died within five days of their birth, which suggests that there may have been a very small amount of birth under-registration since it is highly unlikely that many families migrated immediately after a birth had occurred. While the remaining unlinked deaths may well have been in-migrants, we must bear in mind that recording or transcription errors could have meant that a link was missed. All these problems are relatively minor, however, and the IMRs calculated from the vaccination registers are clearly representative of those that occurred within the town; consequently, these registers should be a suitable source for examining social class differentials in infant mortality.
Figure 1 shows that the two IMR series for Ipswich mirror each other in most years. Annual rates were variable, but the trend was relatively stable during the 1870s; a slight decline occurred during the 1880s followed by a noticeable increase in the 1890s; and then came a much more dramatic decline from 1900. This pattern was also evident throughout much of England and Wales and while rates in Ipswich were well below those in Northern industrial towns – indeed they were close to the overall rate for England and Wales – they were typical of many towns and cities in this period.Footnote 31 This pattern becomes clearer if quinquennial (five-year) rates are considered (see Table 1). The lowest IMRs are clearly shown to have occurred in the 1880s and post-1900, while the highest rate occurred in 1896–1900. Table 1 also shows that most of the discrepancy in IMRs between the vaccination registers and the MOH reports was owing to 990 infant deaths not being able to be linked to the vaccination birth registers. Excluding 1871–1875 because the vaccination registers include only part of 1871, the numbers of births from the two sources closely match.Footnote 32 As indicated earlier, the 1909 MOH report also appears to be inconsistent with some of the earlier annual reports and this may account for some of the small discrepancies between the births. Overall, the MOH reports include about an extra 20 infant deaths per year compared to the vaccination registers, with most of these being a consequence of migration.
Table 1. Quinquennial infant mortality rates from vaccination registers, MOH reports and differences between the two, Ipswich, 1871–1909

* Note: * 1871-75 includes only 5 months of births from 1871 and the associated infant deaths; ** 1906-1909 includes births from only 4 years and the associated infant deaths.
Sources: Ipswich vaccination registers; A. M. N. Pringle, County of Ipswich. Annual report of the Medical Officer of Health and the School Medical Officer for the year 1909 (Ipswich, 1910), 37.
The evidence presented in Figure 1 and Table 1 suggests that an analysis of the Ipswich vaccination registers should yield accurate information about infant mortality in the cohorts born in the town between 1871 and 1909. Given that the trends in infant mortality in Ipswich closely followed the national trends in England and Wales, it is useful to examine what is known about the national trends in this period. The rise in infant mortality in the 1890s is generally associated with a series of hot, dry summers that exacerbated the poor sanitary conditions in many urban centres and resulted in an increase in mortality from a range of diseases, especially ones that caused diarrhoea.Footnote 33 Less consideration has been given to the decrease in the 1880s, but it is generally considered to be related to the decline of childhood mortality that also occurred at this time. This secular decline was interrupted in the 1890s but resumed and accelerated post-1900. Garrett and Reid have shown that in Ipswich neonatal mortality rates remained relatively stable throughout the period and that the variation and post-1900 decline occurred within post-neonatal mortality and this again was typical of the country as a whole.Footnote 34 Table 1 also shows a steady increase in births during this period, reflecting population increase in the town, which grew from just under 43,000 residents in 1871 to reach 74,000 by 1911.Footnote 35 Ipswich was the administrative centre for the mainly agricultural county of Suffolk and a long-established port, especially for coastal trade, but it was its role as an important manufacturing centre that enabled the town to grow. Iron foundries made farm machinery and parts for the expanding railway network. Fertilizer was manufactured and a wide range of farm produce was processed; printing and the production of tobacco and clothing were further important industries. There was also a substantial military presence in the town. Given its mixed economy, Ipswich offers an excellent opportunity to carry out an investigation of social differentials in infant mortality.Footnote 36
After linking of infant deaths to the birth register had been carried out, a social class was then assigned to the father of each child in the birth register. The Integrated Census Microdata (hereafter I-CeM) project coded occupations in England and Wales and we were able to match the male occupational strings in the 1911 I-CeM census file to those in the Ipswich vaccination birth registers, attaching a code for ‘father’s occupation’ to each record where the occupational string matched one found in the I-CeM database.Footnote 37 The records were then alphabetically ordered by the occupation string; where a string had not been in the I-CeM file, a father’s occupation code was assigned by hand. Thus, ‘baker journeyman’, ‘baker (journeyman)’ and ‘baker (jman)’ all received the code representing ‘journeyman baker’. It should be noted that codes were assigned to the father’s occupation as it was recorded in the birth register; if a man gave his occupation in different ways when registering different births, this might result in different codes being assigned. For example, ‘engine driver’ would receive a different code from ‘railway engine driver’. Once all the occupational codes had been assigned, they were then translated into social class codes using those adopted by the I-CeM project to represent Stevenson’s five social classes (I–V) and three special classes (VI textile workers, VII miners, and VIII agricultural labourers).Footnote 38
Births where only the mother’s name was recorded were placed in a separate ‘class’ that we have called ‘single mothers’, even if an occupation for the mother was given. If a father’s occupation was given but was unclear, it was assigned to Class 999.Footnote 39
Table 2 shows the results of this analysis and identifies the number and the proportion of births in Ipswich by social class, comparing them to those in England and Wales in 1911. The textile and mining classes in Ipswich were insignificant with only 112 and 2 instances of births being recorded to fathers with these occupations, out of a total of almost 65,000 births in the study period. Given the town’s location and economic profile, this is not surprising. With the town’s extensive rural hinterland, we might have expected the number of births to agricultural labourers to be rather larger than those actually observed. Furthermore, there was only half the number of such births in the town in 1911 than there had been in 1871. In keeping with the national pattern, this could be ascribed to the fact that men living in the town were more likely to take advantage of the greater availability of better paid jobs in Ipswich’s expanding industries, or it is possible that as the town expanded agricultural labourers found themselves walking farther and farther to their employment, so they either changed employment or left town. Falling fertility amongst this class may also have played a part in reducing the number of their births in this period. Comparison with the social class breakdown of births by father’s social class, published in the 1911 Registrar General’s annual report, is also instructive. It should be noted that the two sets of figures are not strictly comparable since in the tables from 1911 nearly all the births, apart from multiple births, were to different families; although of course it is possible for parents to have more than one birth event in a single year. By comparison, the Ipswich figures, taken from the vaccination registers, were affected by fertility since resident families with high fertility have a disproportionate effect on the table. The main difference between the two sets of figures is that in Ipswich only 1.3 per cent of births occurred within Classes VI–VIII compared with 17.6 per cent nationally. The percentages in Classes I and II are similar; births outside marriage are only slightly different and, consequently, most of the differences are amongst the working classes, with a much higher proportion of Class III births (the skilled working classes) in Ipswich than in England and Wales.
Figure 2. (a) The number of births to fathers in social classes I–V and VIII and to single mothers; Ipswich, quinquennia 1871–1909. (b) The number of births to fathers in social classes I–V and VIII and to single mothers; Ipswich, quinquennia 1871–1909, indexed against 1871–1875.
Figure 2 shows the distribution of births registered in Ipswich by social class over time. There were approximately six times more births in Class III than in Class I, while the numbers in Classes II and IV were broadly similar. The number of births in Class V increased over time and, while there were slight increases amongst the other classes, these are harder to discern. These trends are easier to see when births are indexed against those in 1871–1875 in Figure 2b. Overall, there was an 80 per cent increase in the number of Class V births, a considerable decrease in births to agricultural labourers and only slight increases in the other classes. When considering fertility trends, these births must, of course, be related to the number of fathers in each class. While the population of Ipswich grew by 73 per cent between 1871 and 1911, the same period saw the average number of children born per couple decline in all classes, following national trends. The fact that the growth in Social Class V births outstripped the rate of population growth in the town suggests either that there was a disproportionate influx of unskilled workers or that the fertility of Social Class V men was decreasing more slowly than that of men in other classes. The latter appears to have been the case since the number of Class V males aged 20–54 stated as being married (the closest approximation we can get to the number of married women who were capable of giving birth) was 1,279 in the 1881 census and 1,896 in the 1911 census, an increase of only 48 per cent.Footnote 40 By comparison, the total number of married males aged 20–54 increased by 53 per cent from 6,699 to 10,269 in the same period, while Class I males increased by 105 per cent (from 549 to 1,126). This suggests that fertility was indeed falling more slowly amongst men in the lowest status jobs.
Examination of the Ipswich vaccination registers has shown that it is possible to calculate IMRs by social class for the period 1871–1909. These rates should be treated as ‘suggestive’ rather than showing absolute, true differences, given the difficulties of assigning social class based on father’s occupation alone and some of the other problems discussed already. Nonetheless, by inference, the rates observed in Ipswich should also be suggestive of potential variations in the rest of the country.
3. Social class variations in infant mortality in Ipswich, 1871–1909
Table 3 shows IMRs in Ipswich for single mothers and by father’s social class for quinquennia between 1871 and 1909. Four main patterns are apparent in this table. The infants of single mothers experienced a significant excess of mortality, which approached nearly double that of other babies. Such levels were typical of illegitimate IMRs in this period and were related to the lack of resources that single mothers were able to provide for their offspring.Footnote 41 We include this group here as they formed between 5 and 6 per cent of all births, and had very distinctive levels of infant mortality, but, as they cannot contribute to discussions of social class, we do not consider them further in our analysis.
Table 3. Quinquennial infant mortality rates by father’s social class, Ipswich, 1871–1909
There is a clear and significant difference between IMRs in Classes I and V from the first half of the 1880s onwards. This pattern also occurred for individual years, although it is less easily distinguished owing to the greater volatility of the two series. This difference persisted and increased over time with the infants of Class I fathers experiencing 87 per cent of the mortality of the infants of Class V fathers in 1871–1875, 58 per cent in 1891–1895 and only 36 per cent in 1905–1909. Third, with respect to Classes II, III and IV, any differentials are harder to determine. Rates within these classes remained close to each other throughout the period. Fourth, the pattern of declining IMRs in the 1880s, followed by an upturn in the 1890s and further decline thereafter, is seen in all classes, with the exception of infants of agricultural workers, showing that powerful non-class-specific forces must have influenced infant mortality to some degree. Infant mortality rates (IMR) amongst the agricultural workers in Class VIII were generally lower than those within the other classes, but their increasingly small numbers make any trends in the figures difficult to interpret.Footnote 42 When overall levels of decline between 1871 and 1909 are viewed as percentages, in the final line of Table 3 it is clear that Class I experienced by far the greatest decline, 63.8 per cent, compared with only 13.1 per cent in Class V, with the other classes and single mothers being between these extremes.
The trends shown in Figure 3 further emphasize the growing differential between Classes I and V, which was statistically significant from at least the first half of the 1880s and was particularly marked by 1906–1909. With respect to Classes II–IV, rates were similar and no clear class gradient can be identified. Indeed, it would appear that Class II IMRs were generally slightly higher than those of Class IV: IMRs for the whole period 1871–1909 were 113.9 in Class IV, 123.5 in Class II and 127.4 in Class III. The explanation for this is not obvious, but in part it was likely owing to how the different social classes were defined, with Classes II and IV comprising those occupations that could not easily be put into Classes I and III or III and V respectively. It may also be related to Ipswich’s particular occupational structure. One way of investigating this hypothesis is to examine the IMRs of specific occupations that might be considered not to fit easily into the given class structure. For example, ‘merchant seamen’ were assigned to Class II.Footnote 43 This group included pilots of ships plus those that owned a ship or boat. It also included seamen in the merchant service, general seamen, bargemen and others working on the canals or inland waterways, many of whom might be thought to share the characteristics of a lower class. Overall, ‘merchant seamen’ were responsible for 20.3 per cent of all Class II births in Ipswich between 1871 and 1909. Surprisingly perhaps, their IMR in that period was 123.9, very similar to the 123.2 of the rest of that class. Likewise, the classification system assigned iron foundry labourers to Class III, rather than to Class V where all other labourers were to be found. However, iron foundry labourers had an IMR of 129.2, again not far removed from the 127.1 of the other men in Class III.Footnote 44

Ipswich also had a considerable military presence in our study period, and soldiers from the ranks were responsible for 10.5 per cent of Class IV births between 1871 and 1909.Footnote 45 Their IMR of 134.5 compared rather unfavourably with the 111.4 experienced by the rest of Class IV in the same period. The vaccination registers also give information on residence, and it is possible to differentiate between those soldiers living in barracks and those living in the rest of the town. Although numbers are relatively small, it is interesting that the IMR of soldiers living in barracks was only 62.0, less than half of the 146.3 deaths per 1,000 births experienced by those living elsewhere in the town, suggesting perhaps that conditions in the barracks may have been cleaner, with more medical personnel to hand.Footnote 46 It is notable also that only 2 of the 64 infants born to army officers in the study period were observed to die before their first birthday, giving an IMR of 31.3, around one-third of the 95.3 of other Class I births, and only 21 per cent of the ‘rank and file’ rate.Footnote 47 These figures might suggest that the experience of infant loss amongst the military in the town should be treated with caution; the officers and men would have been highly mobile, and they and their families may have left the town before their children reached their first birthday. Only nine of the officers’ children observed were born in barracks or the ‘militia depot’. The experience of infant death amongst soldiers shows that, while class may have been an important factor in infant survival, the environment into which the children were born had a greater influence.
Sadly, we cannot offer a satisfactory explanation for the lack of gradient between Classes II and IV in Ipswich, 1871–1909. It may be that as the town did not have large numbers of men in Classes VI and VII with high IMRs, or class VIII with low IMRs, the IMRs observed are unaffected by the subtraction of these groups, suggesting that the national social gradient in infant mortality may have been a ‘statistical artefact’ created by the classification system used.Footnote 48 The expected class gradient in infant mortality does become readily apparent if Classes II–IV are grouped together (see Figure 3). It should, however, be remembered that only 7.4 per cent of births were in Class I, 19 per cent in Class V and 66.5 per cent in Classes II–IV, meaning that what was happening within this last group had by far the greatest impact on the overall rate. Moreover, with respect to infant deaths, only 5.3 per cent occurred in Class I, 62.5 per cent in Classes II–IV and 21.5 per cent in Class V. These proportional differences reflect the mortality gradient; this was especially apparent amongst illegitimate infants, with single mothers accounting for only 5.6 per cent of births but 9.4 per cent of all infant deaths. Table 3 and Figure 3 clearly show that there was a class gradient in mortality in late-nineteenth- and early-twentieth-century Ipswich, albeit not a completely clear-cut one. Other factors were, however, more important in explaining the overall pattern of change in the town.
4. Exploring the social class gradient
The influence of class on infant mortality can be explored further if neonatal mortality rates (deaths within the first 28 days) in Ipswich are compared with post-neonatal mortality rates (deaths after the first 28 days) (see Figure 4). While a slight rise in neonatal mortality is evident, for much of the period 1871–1909 the rate fluctuated at around 40 deaths per 1,000 live births, which was almost identical to the national neonatal rate in the first decade of the twentieth century.Footnote 49 This general stability is apparent if quinquennial rates from 1871 to 1909 are examined: 34.5, 38.1, 37.1, 38.1, 40.9, 40.1, 48.7 and 40.0.Footnote 50 When the data are viewed in this way, the low rate in 1871–1875 and the high rate in 1901–1905 appear to be anomalies, although it is not clear why this was the case. Figure 4 also shows that post-neonatal mortality varied considerably and it was this component that accounted for most of the changes to the IMR.Footnote 51 Thus, while the post-neonatal rate in Ipswich fluctuated annually, it declined during the 1880s, increased during the 1890s and then declined sharply from 1900, a pattern that was repeated throughout much of Britain.Footnote 52 Figure 5 shows neonatal and post-neonatal mortality in Ipswich for Classes I, II–IV and V. The two sets of lines behave in very different ways.Footnote 53 Until 1890, class-specific neonatal rates were almost identical, but from this date a gradient appears to emerge as Class V neonatal mortality rates increased. The graph suggests that the neonatal mortality rates within the other classes were more stable and may even have decreased slightly. However, the rates for Classes I and V were only statistically different in 1891–1895 and 1906–1909; in the latter quinquennium Class I infants experienced only 47.5 per cent of the neonatal mortality of those in Class V. By contrast, class-specific differentials are evident in post-neonatal mortality from 1881–1885 onwards.Footnote 54 Class I post-neonatal mortality declined considerably during the 1880s, rose during the 1890s and then decreased sharply thereafter. Post-neonatal mortality within Class V was higher at all times; it failed to decrease in the 1880s, increased substantially during the late 1890s and, while it also declined from 1900, by the end of the decade it was more than three times higher than in Class I. Both neonatal and post-neonatal mortality within Classes II–IV lay, not surprisingly, between the extremes of Classes I and V.Footnote 55 It would appear therefore that, at least in Ipswich, Class I infants escaped many of the threats that were prevalent throughout Victorian towns and cities and, with respect to post-neonatal mortality, their survival chances improved considerably both in absolute and in relative terms in our study period. By 1906–1909, the Class I post-neonatal rate had declined by 77 per cent from that in 1871–1875, which compares with a decline of 45 per cent in Classes II–IV and only 36 per cent in Class V.Footnote 56 Figure 5 thus highlights three features of class-specific neonatal and post-neonatal rates worthy of special note: the increase in Class V neonatal mortality from 1890; the relatively muted increase in Class I post-neonatal mortality during the 1890s and the substantial decrease in post-neonatal mortality that occurred within all classes from 1900.
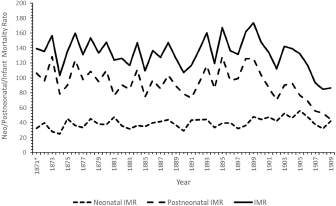
Figure 4. Annual neonatal, post-neonatal and infant mortality rates, Ipswich, 1871–1909.
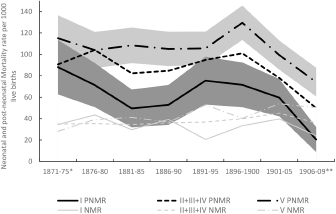
Figure 5. Quinquennial neonatal (NMR) and post-neonatal (PNMR) infant mortality rates by father’s social class, I, II–IV and V, Ipswich, 1871–1909.
It is possible to shed further light on these phenomena by examining class differences in causes of death. The interpretation and classification of causes of deaths for infants is not, however, a straightforward process, in part because it is uncertain how non-specific or symptomatic ‘causes’ such as convulsions, diarrhoea, debility and premature birth should be interpreted.Footnote 57 There were also changes in how some of these causes were used over time, with the Registrar General encouraging doctors to stop using ‘debility’ as a cause without providing additional details.Footnote 58 Furthermore, in many instances death certificates recorded secondary and sometimes tertiary causes of death. In Ipswich most of these additional causes were symptomatic; consequently, when causes of death were coded they were classified according to the first one listed, which was supposed to be the cause the doctor considered to be the ‘primary’ or underlying cause of death.Footnote 59 In spite of these problems, if causes of death are classified together in well-defined and meaningful categories, then useful conclusions can still be forthcoming, especially given that most neonatal deaths were a consequence of problems that developed in utero or were associated with the birth process, while many post-neonatal ones were associated with infections.
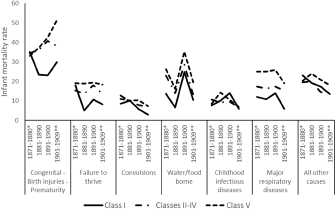
Figure 6. Infant mortality rate from specific causes, by decade and class, Ipswich, 1871–1909.
Figure 6 shows the result of this exercise with the various disease groupings being largely self-explanatory and chosen to represent the main threats to infant health. The only exception is ‘convulsions’, which was classified separately as this was a prominent cause of death in the period and, while often associated with the final stages of a range of other diseases, its use may have changed over time owing to changes in certification practices. It is apparent that the class mortality gradient occurred across all groups of causes, although it was more marked in some.Footnote 60 It should be noted that the numbers in each cause and class grouping are relatively small, even when decades are used. The graphs in Figure 6 can therefore only be suggestive. The first two disease groupings reveal some of the widest differentials. Of the 2,257 deaths owing to congenital disorders, birth injuries and prematurity in Ipswich in 1871–1909, 1,692 (75 per cent) happened before the child was a month old; all the deaths from prematurity occurred very shortly after birth. The large increase, especially in Class V, in deaths from this group of causes explains most of the general rise in neonatal mortality seen in Figure 5. Exactly why this increase occurred is hard to determine, especially as it appears to have affected the classes so differently. As this was a period of declining fertility, particularly amongst the higher classes, an increasing proportion of births would have been first ones. First births are at greater risk of dying than higher order ones, especially in the neonatal period.Footnote 61 Deaths in the first four weeks of life are also often associated with poor maternal health or deteriorating delivery practices, although, given the improvements in adult health and the slightly decreasing maternal mortality rates occurring between 1880 and 1910, these seem unlikely to have contributed directly to the rise in neonatal deaths.Footnote 62 It is possible, however, that improving maternal health may have led to decreasing miscarriage and stillbirth rates, which resulted in more women carrying infants to full term, only to lose them in the first few days or weeks of life.Footnote 63 It is also possible that, as a port city, Ipswich saw an increase in congenital syphilis over this period, which might have contributed to the rise in neonatal mortality, but it is difficult to confirm this hypothesis as the stigma attached to the disease meant that doctors were often persuaded not to record this as a cause of death.Footnote 64 Deteriorating care of newborns may also have driven up rates of death in the first few weeks of life. Some, mainly lower-class, mothers were thought to be substituting artificial food for the breast increasingly earlier in their infants’ lives, which, given the unsanitary conditions in many Victorian towns, may have resulted in more babies dying.Footnote 65 There is some circumstantial evidence to support this at the end of our period, with Ipswich’s MOH arguing that the Notification of Births Act of 1908 had enabled health visitors to see mothers within 48 hours of a birth, in order to encourage them to breastfeed, since ‘[a]rtificial feeding of infants is inevitably associated, especially in the homes of the poorer classes, with the difficulty that [it] is impossible to ensure the absolute cleanliness of the food’.Footnote 66 The issue of infant feeding is crucial to a fuller understanding of infant mortality change in this period, but it is one about which we know very little.Footnote 67 Health visitors targeted the working classes and their visits, if successful, would have reduced infections from birth with most benefits not being seen until a later period than that of the current study. It was, however, the higher classes, who were seldom seen by a health visitor, that benefited most from the decline in infant mortality in our study period.
The ‘failure to thrive’ category includes deaths from atrophy, debility, marasmus and weakness, all imprecise causes that are difficult to interpret, and out of 1,065 deaths attributed to these causes only 203 (19 per cent) occurred within the neonatal period. Class I infants experienced some decline in deaths from ‘failure to thrive’ during the period, while the other classes saw little change. It is possible that a greater reluctance by doctors to report such causes may have disproportionately affected Class I infants if a greater proportion of their deaths were medically certified; however, the considerable differences between classes seen in this category in Figure 6 suggest that Class I parents were in a much more favourable position to ensure the survival of their infants into the post-neonatal period.
Deaths from ‘convulsions’ also appear to demonstrate a class-specific gradient, although rates were relatively low compared with the other cause of death groups shown in Figure 6. ‘Convulsions’ deaths declined over the period, which is not unexpected, given that these deaths were usually also associated with other diseases and doctors were repeatedly cautioned against the use of ‘vague’ or ‘symptomatic’ terms by the Registrar General.Footnote 68
The three categories ‘water/food borne’, ‘major respiratory diseases’ and ‘childhood infectious diseases’ contain causes that had infectious origins and were relatively easy to identify. Some degree of decline is also evident amongst all classes in these categories. ‘Water/food borne’ includes deaths attributed to diarrhoea, infantile cholera, dysentery, enteritis and gastro-enteritis and, while diarrhoea is a symptom rather than a true cause of death, the distribution of these causes is similar, suggesting that they were all related to the consumption of infected water or food as the mortality rates increased substantially during periods of hot, dry weather. Deaths from these causes followed a similar pattern for all classes, although Class V infants suffered a considerable penalty (up to 100 per cent higher) compared with Class I infants. The extreme summers of the late 1890s caused mortality to increase precipitously and, perhaps surprisingly, this affected all classes, with Class I mortality increasing to almost match that in Classes II–IV. The advantage experienced by Class I infants with respect to ‘filth’ diseases suggests that they had greater means to prevent contact with the various infective organisms – by living in a cleaner environment or less crowded houses perhaps – and/or were better able to prevent their infants from dying after they had been infected. Whatever these advantages were, they were insufficient to prevent a substantial increase in deaths during the late 1890s. Figure 6 also seems to suggest that any improvements in sanitation that occurred in the Victorian period had little effect on ‘water/food borne’ deaths. Thus, while class was important, it is clear that climate was the most influential factor in bringing about such deaths and it was only after 1910 that the lowest classes saw a significant decrease in deaths from water- or food-related causes.Footnote 69
The other two infectious disease categories, ‘childhood infectious diseases’ and ‘major respiratory diseases’, show distinctly different patterns – there were few class differences or changes over time within the major childhood diseases while there was a large class gradient and decline post-1900 in respiratory diseases. These differences probably relate to differential exposure rates. The common diseases of childhood such as measles, whooping cough and scarlet fever were very infectious and circulated throughout the whole population well into the twentieth century and it was likely that few would have escaped exposure at some point in their childhood. Breast-fed infants would have inherited some immunity from their mothers and, while epidemics caused annual rates to fluctuate, overall death rates from these diseases remained low, but constant. There is little to suggest that medical advances improved survival chances in this period, although the employment of servants may have allowed Class I infants to benefit from more-attentive nursing. While this may have given Class I infants an advantage, the wide class differentials in respiratory deaths suggest that it was exposure rates that were of key importance, with differences likely to be related to housing conditions. In the small, overcrowded, smoky, damp, densely packed homes occupied by many lower-class families, it would be harder to avoid respiratory diseases than in larger Class I homes located in the more salubrious districts. This is an issue to which we will return.
The final ‘other’ category is a residual grouping that consists of those causes that contained too few deaths to make this type of analysis feasible or those that could not be easily grouped together. While large, this category shows only a small class gradient and some decline, reflecting the general pattern of change revealed in Figure 1 and suggesting that we have managed to capture the main changes in class-specific IMRs via the other cause-of-death categories.
Figures 5 and 6 have shown that the principal changes to the overall IMR between 1871 and 1909 occurred mainly to post-neonatal infants from infections of one form or another. Thus, deaths from a wide range of infectious diseases declined from the 1870s, before being interrupted by an increase in diarrhoeal deaths in the 1890s and then resuming post-1900. This ties in well with what was happening amongst young children as childhood mortality, which was dominated by infectious diseases, declined steadily from the 1870s.Footnote 70 While the decline affected all classes, class differentials were maintained and, indeed, increased over time. The most likely explanation for this was that the higher classes were increasingly able to isolate their infants from the hazards in Ipswich’s environment. Such conclusions support Link and Phelan’s theory that ‘the better-off in society will always be able to use their resources or knowledge to avoid hazards or exposure, to improve resistance to disease by purchasing higher quality and quantity of food, or to better aid recovery from illness through superior access to curative healthcare’.Footnote 71

Figure 7. The location of ‘good’ (excess Class I) and ‘poor’ (excess Class V) streets in Ipswich, 1871–1909.
Further insights into the health advantage that Class I infants enjoyed can be gained by examining where the different classes lived within Ipswich. Addresses were given in both the birth and the death registers and, while these were not always precise, they were sufficient to identify 582 ‘streets’ in Ipswich where events took place.Footnote 72 In order to discover where there were concentrations of Class I and Class V births, we first calculated the distribution of births in Ipswich between 1871 and 1909 across all eight of the Registrar General’s social classes where the father’s occupation was known: there were 4,911 births to Class 1 fathers in this period (7.4 per cent of the total) and 12,710 Class V births (19.0 per cent of the total). Then for each ‘street’ we calculated the number of births to Class I and Class V fathers we would expect to see were the distribution of births across the classes in that street the same as it was for the whole town. Small numbers meant that this exercise had to be carried out using births for the whole 1871–1909 period, so it is not possible to see in detail how the social class profile of an individual ‘street’ changed over time. Having calculated the expected number of births within the two groups, we then compared these figures with the number of births observed occurring in each street. If the ratio of observed to expected births in a particular ‘street’ was greater than 1.5, we identified this as a concentration of births to that group. While 158 ‘streets’ had ‘an excess’ of Class I births (which we labelled ‘good’), 68 ‘streets’ had an excess of Class V births (labelled ‘poor’); these are shown on the map in Figure 7.
A further 352 ‘streets’ did not have any excess Class I or Class V births, and we placed these in an ‘other’ category. There were also four ‘streets’ that had an excess of both Class I and Class V births, but the number of births in these ‘streets’ was very small, ranging from 43 in the 1870s to just 11 in the 1900s. These four ‘streets’ were also put in the ‘other’ category.
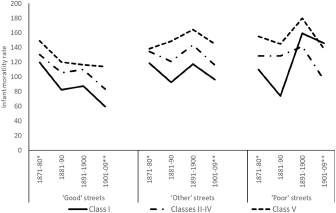
Figure 8. Infant mortality rates in selected types of street by class of father and decade, Ipswich, 1871–1909.
Figure 8 shows the class mortality rates amongst infants living in the different types of ‘street’. As the categorization of ‘streets’ into ‘good’ or ‘poor’ is a rather crude means of identifying social separation because different parts of a single ‘street’ could have very different characteristics, the graphs should be interpreted as ‘suggestive’ of patterns, rather than as statistically robust findings. The most obvious point to note is that all the classes on ‘good streets’ experienced lower IMRs than their counterparts who lived elsewhere in the town. It is also noticeable that in ‘good streets’ the improvements in mortality experienced by Class I infants were also experienced to a lesser extent by Classes II–IV and much less so by Class V; mortality improved after the 1870s and all residents avoided the high mortality of the 1890s, unlike those living elsewhere. The lack of improvement in the 1900s amongst Class V infants might be owing to their living in larger families, the inability of their parents to change their childcare practices or a lack of access to the amenities enjoyed by their neighbours. Despite this, Class V families living in ‘good streets’ still enjoyed a significant mortality advantage compared with those living elsewhere in the town. A clear mortality gradient is also evident in ‘other’ streets. Class I families living in such streets experienced higher mortality rates than those living in ‘good streets’, but they still experienced much lower rates than Class V families. The same trend is apparent in ‘poor streets’, although, not surprisingly, few Class I families lived on this type of ‘street’ (see Figure 9). Consequently, the increase in Class I mortality during the 1890s in ‘poor streets’ may largely be the result of small numbers. Figure 9 suggests that, while the different classes often lived on the same ‘street’, there were clearly parts of Ipswich that were favoured by the higher classes. It also indicates that ‘poor streets’ were to be found on the fringes of the town, as well as in the centre. Figures 8 and 9 give credence to the view that the immediate environment in which one lived was an important influence on infant health. Of equal importance were the childcare practices adopted by the different classes and it is the combination of these two factors, mitigated to some degree by individual family circumstances, that explains the trends in class-specific and overall IMRs in Ipswich during our period.
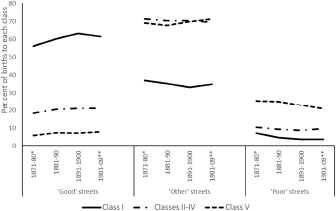
Figure 9. The percentage of births to fathers in Classes 1, II—IV and V, by quality of address and decade; Ipswich, 1871–1909.
5. Conclusion
The analysis of Ipswich’s smallpox vaccination registers has, for the first time, enabled class-specific IMRs to be calculated directly for an entire English town between 1871 and 1909. Employing Stevenson’s classification system, a class-specific mortality gradient was evident from at least the early 1880s and, while mortality declined within all classes, differentials widened over the following three decades. Class I infants experienced the lowest rates (94.3 per 1,000 live births in the entire period 1871–1909), while the rate for Class V infants was more than 50 per cent higher (149.2) and the infants of single mothers suffered the highest rates of all (220.4). Classes II–IV experienced mortality rates midway between those of Classes I and V, although the expected gradient within these three classes did not occur. Stevenson’s social classification does not, therefore, appear to produce as nuanced a class gradient in mortality at the local level as it does at the national level, at least in the case of Ipswich. It is likely that the absence of the expected differentials between Classes II and IV was a consequence of Ipswich’s occupational structure coupled with the fact that the creation of the three special classes, VI textile workers, VII miners and VIII agricultural workers, with their distinctive patterns of mortality and fertility, was responsible for some of the gradient observed in the working classes at the national level. These three special classes of occupations were largely absent in Ipswich and, consequently, it would be interesting to discover whether the patterns seen in the town are also observed in other parts of the country with few miners, textile workers or agricultural labourers.Footnote 73
A social class gradient was observed in most causes of death but was especially evident in food/water-borne and respiratory diseases. The reasons for this are hard to discern, but there was a link between the street where infants’ families lived and the mortality rates they experienced, and this suggests that their immediate environment had a profound effect on the health of infants. Living in better housing in a more salubrious district would have meant that exposure to a range of infections was less likely. As the population of Ipswich increased, the town expanded and, while this enabled many higher-class families to move into more spacious houses in the suburbs, the outskirts of the town were far from being the exclusive domicile of the rich, as pockets of deprivation existed there, too. Location was therefore a key determinant of infant mortality, and the availability of addresses, although not always in an easily identifiable form, in Ipswich’s vaccination registers means that future research should provide a more nuanced examination of socio-spatial variations in mortality than we have been able to here.
The fact that, by the beginning of the twentieth century, Class I infants had a better chance of surviving the neonatal period than the other classes suggests that, as well as the care offered to expectant mothers, the childcare practices adopted by parents immediately following birth were also having an important effect on mortality rates. While an improving environment probably helped all classes to reduce rates, it was the gradual adoption of more hygienic childcare practices that appears to have been responsible for most of the decline, although additional research is required to determine exactly what these practices were. The widening class differentials were therefore likely to be the result of the earlier adoption of a range of measures within the home, and these may also have been linked to the beginnings of fertility decline.Footnote 74 The mortality advantage experienced by Class I, at least in Ipswich, was therefore a consequence of their access to better housing coupled with their greater ability to learn about and successfully implement improvements in child-rearing methods. The succession of hot, dry summers in the late 1890s, which resulted in an increase in food/water-borne deaths and thereby interrupted the downward trend in IMRs, shows that whatever practices had been adopted proved insufficient to mitigate this severe climatic threat. This period of high infant mortality did, however, result in greater efforts by public health officials to promote better childcare practices and, while once again it was the highest classes that at first benefited the most, this eventually led to the secular decline in infant mortality experienced by all classes across the twentieth century.
The research reported here offers three main contributions to the wider demographic literature. First, with specific reference to England and Wales, it has largely confirmed Reid and her colleagues’ analysis of the entire 1911 census, which concluded that ‘part of the infant mortality advantage for the higher social classes in this period could be attributed not to superior knowledge, attitudes, or the ability to purchase better health care or food, but to the opportunity to live in a more salubrious environment with fewer environmental hazards and better local amenities’.Footnote 75 It further agrees with Reid et al. that by separating out the three special classes VI, VII and VIII in his class schema, Stevenson increased the mortality gradient seen amongst the other five classes, although in Ipswich, while significant differentials existed between Classes I and V, this was not the case in Classes II–IV, where nearly 71 per cent of births occurred, and it was what happened to children in these classes that had by far the greatest impact on overall levels of infant mortality in the town. Clearly, the precise way in which a social classification system is defined can have a profound impact on the results that are produced and this needs to be taken into account in any future studies of this kind: the absence of one group can be as important as the presence of another.
Second, the trend in Ipswich followed closely that of other British towns and cities, which suggests that many of the changes to living conditions and childcare practices must also have occurred more or less simultaneously in many other places, as they did throughout much of Europe: similar class differentials in infant mortality have been observed in southern Sweden, Stockholm, Amsterdam, Belfast, Rostock and Bavaria.Footnote 76 As with Ipswich, these differentials were not necessarily the most important determinants of levels or patterns of change; however, their existence, which has been derived from a range of sources and classification systems, suggests that what happened in Ipswich was part of a pan-European phenomenon.Footnote 77 Consequently, we might also expect to find the higher classes in many other places mitigating the threat to their infants by living in superior housing and a better environment. Likewise, and of increasing importance, especially during the twentieth century, they were able to control the impact of infectious diseases. Both these issues would repay further investigation, especially with respect to the timing, spread and extent of the relevant changes in society both nationally and internationally.
Finally, while it has been possible to examine only infant mortality in this article, it should not be forgotten that similar changes were also affecting young children and adults. Bengtsson and van Poppel argue that social differentials in mortality emerged over a long period of time and were not directly related to industrialization, while ‘the association between income and mortality observed today most likely is a recent phenomenon’.Footnote 78 The Ipswich data also contain child and adult deaths and, with further research, it may be possible to use these to gain further insight into the extent of social class differentials within the wider population. It does, however, seem likely that many of the influences that affected infants, those most vulnerable of individuals, also affected, albeit to a lesser extent, their older siblings and parents. Such speculations will be confirmed only by further research, but, in Ipswich at least, we have demonstrated, using direct evidence, the existence of a class gradient in infant mortality from at least 1881, albeit a less clearly defined one than Stevenson might have had us believe.
Acknowledgements
We are very grateful to Professor Kevin Schürer, University of Cambridge, for allowing us to use the I-CeM Occupational Matrix and I-CeM Social_Class_Hisclass table to allocate codes for occupation and social class to the Ipswich data.
Competing interests
The authors declare none.


 Open access