


Policy Significance Statement
Policy practice, whether public or pertaining to private organizations, needs to exploit a wide range of information sources and analytical methods for providing trustworthy, efficient, and effective solutions to various policy problems. The PolicyCLOUD platform seeks to help policymakers generate such solutions, by proposing a first-of-its kind, cloud-based and scalable toolkit. This toolkit provides a flexible, evidence-based and analytical framework supporting an extensible variety of dataset transformations, analytical and visualization methods, as well as policy elaboration and modeling functions. PolicyCLOUD is developed around a comprehensive legal and ethical framework, incorporating technical and organizational requirements to address transparency, privacy, security, bias management and other concerns which unavoidably arise in the context of evidence-based policymaking.
1. Introduction
Policy practice is essentially eclectic, since policymakers can choose freely among a range of scientific methods, information sources, and application methodologies to solve practical problems (Dunn, Reference Dunn2017). In fact, policymakers generate and/or rely on an ecosystem of different types of data sources and analytic methods. Each of these data sources needs to be properly registered, filtered, analyzed, validated and searched, so that value can be extracted from those data and methods.
PolicyCLOUD, an ongoing EU Horizon 2020 project, delivers an innovative, cloud-based and data-centric approach to policymaking (Kyriazis et al., Reference Kyriazis, Biran, Bouras, Brisch, Duzha, del Hoyo, Kiourtis, Kranas, Maglogiannis, Manias, Meerkamp, Moutselos, Mavrogiorgou, Michael, Munné, La Rocca, Nasias, Lobo, Rodrigálvarez, Sgouros, Theodosiou and Tsanakas2020): it provides an integrated platform that targets the full lifecycle of policymaking: from creation through monitoring, analysis and compliance. To our best knowledge, as of today, PolicyCLOUD is unique in terms of efficiency and effectiveness in supporting the policymaking process in all its aspects. Concretely, PolicyCLOUD offers a pluggable architecture to build data processing pipelines, which can both action built-in analytic functions, as well as specific ones that were registered and thus added to the palette of available tools. Consequently, PolicyCLOUD, by offering an extensible hub for general and specialized tools and data, along with the dynamic composition of appropriate toolchains, increases the efficiency of policymaking, as these two features relieve the policymaker from the burden and cost of assembling and managing a large set of tools and resources in-house. In addition, the ability to form specialized toolchains that focus on specific aspects of a given policy problem increases the effectiveness of policymaking, by yielding more accurate outcomes. Furthermore, PolicyCLOUD offers users the ability to register datasets, as well as functions to be applied to those datasets, for their own benefit and that of others. Users seeking to register such assets (i.e., registrants) are met with registration input parameters, requiring them to provide clear and structured details on measures taken to address specific legal and/or ethical constraints which may apply to such assets (including measures taken to address the risk of inherent bias or to ensure compliance with applicable privacy/data protection legislation). Once registration is complete, the information provided during the registration process is made available to other PolicyCLOUD users, so that it may be considered when assessing the viability of the use of a given dataset and/or function in a specific context. Because of this, registrants are required to warrant that the information they provide is, to the best of their knowledge, accurate, complete and up-to-date, and may be held accountable (under the terms and conditions applicable to PolicyCLOUD, which must be accepted by registrants) for damages caused as a result of the submission of knowingly false or incomplete information.
This article, which targets “digitally informed policy practitioners”, focuses on the PolicyCLOUD infrastructure and how we applied it to four families of pilot use cases: (a) RAD studies how policies can tackle the danger of radicalization; (b) WINE is related to (private) policies for marketing Aragon wine; (c) SOF deals with the analysis and elaboration of various policies for the Sofia municipality, ranging from air pollution to traffic-related policies; and (d) CAM relates to policy-making for the London Borough of Camden with regards to unemployment in this area. Less digitally proficient readers will still be able to appreciate how the PolicyCLOUD framework can facilitate policy-making by examining the types of services offered by the PolicyCLOUD infrastructure for policy analysis and design.
This article describes the types of information sources and analytic capabilities supported by PolicyCLOUD, as well as their integration in a novel and extensible cloud-based framework. We refer to this cloud framework as the data acquisition and analytics layer (DAA). The DAA controls the full data flow from data sources to the repository of the platform. It permits the registration and application of functions during, and after, the ingestion of a dataset. We refer to the functions in the first case as “ingest functions”, and to the rest as “analytic functions.” Once a dataset is registered, PolicyCLOUD enables the application of functions which are stored in a library that is maintained and constantly updated using the DAA. New functions can be added to the library for use with a broad scope of datasets, or for use with a particular dataset. Thus, the DAA can be used to build a rich and flexible ecosystem of data and analytic methods, which can, in turn, be used to guide important aspects of policy-making, such as policy design, analysis, monitoring and compliance with ethical and legal requirements.
One advanced feature of PolicyCLOUD is its ability to exploit the power of simulations to model and reason about the outcomes of various alternatives during policy design. The framework includes a novel meta-simulation methodology that makes it easy to simulate and examine proposed policies, as well as compare the analysis and evaluation of their assumptions, mechanics, and outcomes. In Section 6, we explain how this methodology provides insight and transparency to policy design, as well as enhances the quality of debate and critique over policy creation.
One of the primary goals of this article is to share our experience and the knowledge acquired while developing this integrated framework and its individual components; it is also our aim to disseminate the best practices and lessons learned from our development efforts.
The structure of this article is as follows: Section 2 discusses related work. In Section 3, we detail the architecture of the DAA and the cloud gateway. Section 4 presents the legal and ethical concerns relevant to a platform like PolicyCLOUD. Section 5 details the initial generic ingest analytic technologies developed in PolicyCLOUD: data cleaning, enhanced interoperability and sentiment analysis. Section 6 details the social dynamics framework analytics, which add policy modeling and simulation capabilities to PolicyCLOUD. Section 7 details how PolicyCLOUD was applied to the WINE use case. In Section 8, we share our evaluation results and lessons learned in terms of efficiency, adequacy and ease-of-use for integrated cloud-based data acquisition and analytics frameworks in policy-making contexts. We then conclude and point to what we believe should be the most important extensions of our work in Section 9.
2. Related Work
A number of approaches have been proposed in the context of evidence-based policymaking to provide tailored information and guidance for policy practitioners. Artificial intelligence (AI) can contribute toward more efficient policies. For example, the analysis of self-driving datasets (Jiang et al., Reference Jiang, Ayyer, Tolani and Husain2015) should be the basis of new driving policies that will be needed for this phenomenon. Representative examples include Society 5.0, a project in Japan that aims to analyze data from heterogeneous sources to create evidenced-based policies and provide a human-centric sustainable society (Shiroishi et al., Reference Shiroishi, Uchiyama and Suzuki2018). Another example is the Foundations for Evidence-Based Policymaking Act, introduced in the U.S. to provide better access to high-quality data, driving evidence-based policies for federal agencies, government officials, and constituents (Informatica, 2019). Another relevant body that exploits evidence-based policy-making techniques is the ACT-IAC (2022): It facilitates the requirements of evidence-based policies through a mature data management framework, complemented with assessment techniques for managing specific key performance indicators relevant to policies.
The use of big data and AI techniques on massive governmental datasets holds great promise for unleashing innovation and improving public management (Hochtl et al., Reference Hochtl, Peter Parycek and Schöllhammer2016), to extend government services, solicit new ideas, and improve decision-making (Bertot et al., Reference Bertot, Jaeger and Hansen2012).
This has triggered attention for NLP and other AI tools that serve as a means for public administration to automatically collect and evaluate citizens’ opinions about policies (Chiraratanasopha et al., Reference Chiraratanasopha, Theeramunkong and Boonbrahm2019). Another popular AI technique used in evidence-based policy-making is data mining, or “knowledge discovery in databases”, which open-endedly looks for patterns in existing data to help policymakers better understand and extract patterns and knowledge (Androutsopoulou and Charalabidis, Reference Androutsopoulou and Charalabidis2018).
Several projects propose solutions to deliver end-to-end solutions across the full data path for policy management. The DUET (2022) project proposes the use of digital twins (related to city systems) through a 3D interface for policy impact exploration and experimentation, such as, for instance, simulating the impact on noise levels and air quality if the car speed limit was to be lowered or increased on a given street. A similar approach is proposed by the IntelComp (2022) project, which tackles the full policy lifecycle - that is, agenda setting, modeling design, implementation, monitoring and evaluation - through a living-labs approach to involve all relevant stakeholders. The outcomes of the project target different domains with an emphasis on climate change and health.
Looking more toward the actual transition of public authorities in the direction of evidence-based and co-creation policy-making, the DECIDO (2022) project focuses on the identification of a set of pathways, recommendations, and a sound business plan for public authorities.
AI4PublicPolicy (2022) offers an open, virtualized policy management environment, that provides policy development and management functionalities based on AI technologies while leveraging citizens’ participation and feedback toward reusability of policies.
While the aforementioned projects also target evidence-based policy-making, PolicyCLOUD distinguishes itself by (a) focusing on the provision of tools to support policymakers in the collection, aggregation and specialized analysis of heterogeneous datasets, which themselves may be retrieved from heterogeneous sources (the evidence around which policies are to be developed); (b) allowing for visualization of insight extracted from data analysis and simulation of policies developed around such insight; and (c) having designed and developed these functionalities around legal and ethical constraints applicable to datasets and analytical tools, to provide greater assurances of lawfulness and trustworthiness of the PolicyCLOUD platform and its output to users and society at large.
3. Architecture
3.1. Overview of relevant open-source technological infrastructure
Before describing the technological infrastructure of the DAA environment, let us give a succinct description of the main DAA functionalities in order to appreciate the choices made to implement the DAA environment: the DAA is mainly meant to register datasets as well as functions that can then be invoked on these datasets either during or after their ingestion.
We chose to implement the DAA as a cloud-based serverless platform. This choice was natural since the cloud-native development model has two critical advantages: first, it is fully and automatically scalable, allowing developers to build and run applications without having to manage scalability; secondly, this option allows for the platform to leverage a pay-as-you-use financial model which will be very advantageous considering the substantial fluctuation in the load of analytics activities that may be required by different platform users.
3.1.1. Kubernetes cluster
The first design question raised by the DAA environment relates to the underlying virtualization platform: should it be based on virtual machines or on containers? We chose the container-based solution for a number of reasons. First, its efficient application deployment and overall support for a continuous integration and delivery cycle. Second, containers are the most appropriate for serverless platforms and would be fully aligned with the extensibility and reusability requirements of the DAA. Third, containers are also the best fit for a microservices architecture, which enables easy deployment and separation of the DAA components. Fourth, using containers would offer the framework portability between cloud providers. Fifth, the growing popularity of containers and their strong ecosystem would be especially beneficial in open-source communities.
Once we decided to use a container-based solution, the Kubernetes (2022) container management platform was a clear choice, being the leading open-source container management platform. Kubernetes is used in production as the base for private on-premises cloud systems for a growing number of enterprises and is being offered by almost all cloud providers as a managed dedicated cluster. Kubernetes runs distributed applications resiliently, by handling scaling, load balancing, and failover (e.g., automatically replacing containers that go down) Kubernetes also provides deployment patterns that drastically simplify application deployment and management.
3.1.2. OpenWhisk cluster
Apache OpenWhisk (2022) is an open-source, lightweight, serverless platform capable of deploying functions written in any language. OpenWhisk offers a simple programming model that allows function developers to concentrate on the function’s logic because the deployment and activation details are taken care of transparently by the platform. OpenWhisk uses containers to wrap functions and can be deployed and integrated perfectly in a Kubernetes environment. Another important capability is that OpenWhisk allows functions to be activated by specified trigger events and execution rules, which is perfect for a sequence of ingest functions.
3.1.3. Apache Kafka
Data streaming is the practice of (a) capturing data in real-time as events streams from sources, such as databases, cloud services, or software applications; (b) storing these event streams durably for later retrieval; (c) manipulating, processing, and reacting to event streams in real-time, as well as retrospectively; and (d) routing event streams to different destinations. The Apache Kafka (2022) data streaming platform is used for reliable data connectivity between components. The following are its key capabilities:
1. Publication (write) and subscription (read) to event streams, including the continuous importing/exporting of data from/to other systems.
2. Durable and reliable storage of event streams
3. Processing of event streams in real-time or retrospective.
kSQL (2022) is an interesting extension that provides a streaming SQL engine running on top of Kafka. This allows us to continuously apply SQL queries to data channels and to route their output as subchannels.
3.2. Data acquisition and analytics layer
The DAA is the central layer of PolicyCLOUD as it exploits the cloud infrastructure layer and provides the analytic API to the Policy layer which directly interfaces with the PolicyCLOUD users. It offers simple and efficient ways to (a) register datasets and functions, (b) apply ingest functions to preprocess and/or analyze data after it is ingested (streaming and nonstreaming), such as transforming data or performing sentiment analysis on tweets, and (c) apply analytic functions to stored data. Both the datasets and functions can be reused.
The DAA can also be used to manage legal and ethical concerns by requiring the data/analytic provider to enter relevant information explaining how such concerns have been dealt with. For example, this may include legal or contractual limitations on the use of datasets, algorithmic bias, and trade-offs. Any information submitted can be subsequently retrieved when the relevant artifact is listed; this enables potential users to decide on the legal or ethical adequacy of the dataset/function in an informed manner.
The DAA will typically be used by:
1. Data providers that manage the lifecycle of PolicyCLOUD’s datasets through registration, deletion, and update. Upon registration, the raw data may be modified by a sequence of selected relevant ingest functions.
Two primary categories of data sources are supported: (a) streaming sources—datasets continuously ingested by the platform and (b) sources at rest—static datasets that are ingested at once.
2. Analytic providers that similarly manage the lifecycle of general-purpose or specialized functions:
• Ingest functions to transform datasets. Such as (a) removing unnecessary fields, (b) extracting knowledge (e.g., sentiment from text), and (c) complying with legal/ethical requirements (e.g., by removing unnecessary personal information);
• Analytic functions, to be applied to ingested data.
3. Policy practitioners/policymakers who use PolicyCLOUD to apply analytic functions on datasets as appropriate to support their policymaking goals and decisions.
The DAA API gateway exposes the DAA functionality using a web interface implemented as a set of serverless functions running in an OpenWhisk cluster. Data flows from the gateway over Apache Kafka where each ingest function is registered both as a Kafka client of the incoming data flow and a Kafka producer of the modified data flow until it ultimately gets stored in the platform data repository. Each function is executed in its own isolated environment (container), which is key for scalability and parallelism. The DAA includes a common Gitlab (2022) structure storing the code registry of functions, as well as a common container registry for functions’ Docker (2022) images which package all the required dependencies. During function registration, files and images are automatically pulled from this Gitlab structure to create serverless functions.
The current list of reusable ingest functions includes tools for: data cleaning, enhanced interoperability, and sentiment analysis. Additional functions such as Trend Analysis are currently being added to the built-in functions of PolicyCLOUD. In Section 5, we detail these components and show how policymakers can benefit from the DAA ecosystem and the implemented analytics technologies.
Figure 1 depicts the DAA architecture and APIs. The analytic provider uses the DAA API (arrows 1 + 2) to register ingest functions and analytic functions. Administration privileges are required for both. Each function reads incoming data as a JSON string from a request message parameter and returns the transformed message as a JSON string. This output string may itself serve as input for a subsequent function, otherwise, it will be stored in the PolicyCLOUD data store. A data provider uses the DAA API (arrow 3) to register a dataset by providing dataset information (metadata), the final schema, and optionally, the sequence of transformations to be applied to the dataset. Once the registration is invoked, the ingestion process of the dataset is automatically triggered and the possibly transformed dataset is stored in the DAA backend. This may occur after a sequence of ingest functions (e.g., data filtering/cleaning) is applied (arrow 4). At a later phase, a PolicyCLOUD user can apply registered analytic functions on the registered dataset (arrows 5 + 6).

Figure 1. Architecture for data acquisition and analytics layer.
Figure 2 provides an example of the workflow in which initial analytics are applied on streaming data. In this example, a social network (Twitter) has been registered as an information source, and a cloud gateway connector with specified filtering parameters (e.g., keywords) streams the data over Kafka, which has been integrated with OpenWhisk. The data cleaning, enhanced data interoperability, and sentiment analysis ingest functions that have been registered for this dataset are invoked whenever new data is streamed. The modular architecture of PolicyCLOUD permits to easy plugin additional ingest functions in the analytics pipeline that transforms data during its ingestion prior to being written to the DAA data repository. As an extensibility example, let us assume that we want to register a novel “fake news detector.” Then it can be incorporated within the analytics pipeline which processes the incoming data resulting in possible removal of detected fake news. Once stored, deeper analytics can be applied on the dataset as depicted by the “Analytic Function Sentiments Analysis.”
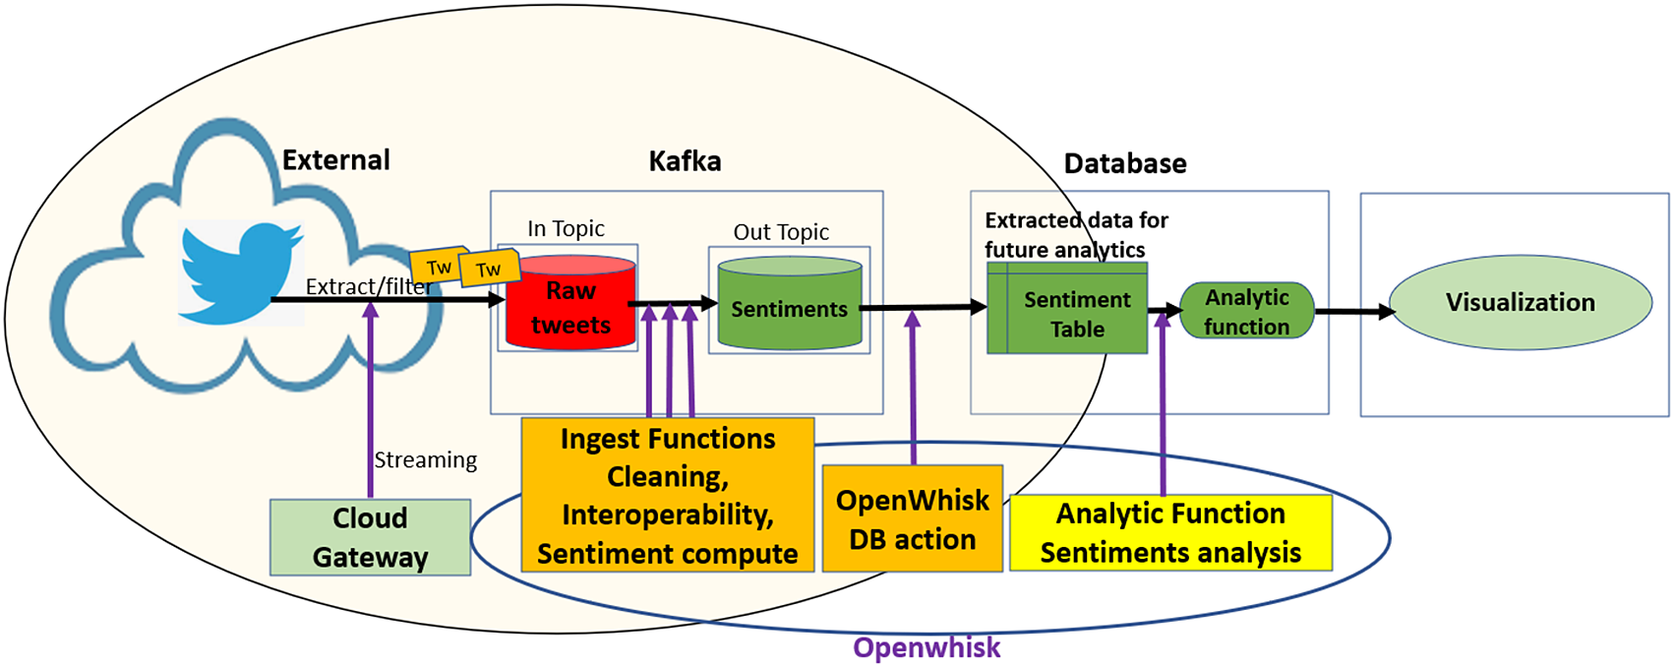
Figure 2. An example of streaming data path with sentiment ingest and analysis.
3.3. Cloud gateway
The DAA supports communication with the platform’s cloud-based infrastructure through a cloud gateway and API component. The cloud gateway offers unified gateway capabilities that allow the transfer of streaming and batch data to the DAA. As the only data entry point for the DAA, the cloud gateway allows microservices to act cohesively and provide a uniform experience for each platform user.
The main goal of this component is to raise the invocation level by providing asynchronous request processing for these multiple microservices. This enables the acquisition of multimodal data from various information sources and aggregation of the results.
In addition, the cloud gateway supports client-side load balancing, which allows the platform to leverage complex balancing strategies such as caching, batching, and service discovery while handling multiple protocols and implementing adapters for different technologies. On top of this, several mechanisms and microservices are used to check and evaluate that the provided raw data is in accordance with the data schema defined by the data provider.
Following the Gateway Pattern (Richardson, Reference Richardson2022), a high-level open API specification is offered to the users, where each high-level action (e.g., function registration) typically invokes many low-level microservices. The authentication mechanisms are applied at the gateway level. Since we are using the OAuth2.0 (2022) protocol, the authentication server can be a separate component or even a third-party service. OAuth2.0 has been selected as it is a secure, industry-standard protocol for authorization that allows us to achieve secure communication and single sign-on throughout the platform. In addition, it protects user data by providing access to the data without revealing the user’s identity or credentials and allows even third-party services to make requests on behalf of a user without accessing passwords and other sensitive information. Finally, its utilization relies on cryptography-based communication through secure sockets layer (SSL) to ensure data between the web server and browsers remain private and to keep data safe.
4. Legal and Ethical Framework
In order to ensure that PolicyCLOUD can be used by EU policymakers to extract valuable insight from varied and potentially extensive datasets, in a manner which is both lawful and fair toward individuals, communities, and society at large, the platform must be supported by a framework which regulates its development and use. Particular concerns to be addressed arise from the fact that PolicyCLOUD is built on a cloud computing infrastructure, and relies on functions with AI and machine learning components, all of which can be applied to datasets which may include sensitive information (such as personal data).
An extensive number of frameworks, toolkits, and sets of principles on the ethical development and use of AI-based systems, as well as on the regulation of data protection and privacy aspects of such systems, have been developed over the last years—see, for example, hhilligoss (2019), Hilligoss and Fjeld (Reference Hilligoss and Fjeld2019) and Yeung (Reference Yeung2019, p. 51), bearing in mind that other ethical AI frameworks and toolkits have been published since. One of the most notable frameworks in this respect, at the EU level, is arguably the framework developed by the High-Level Expert Group on AI (European Commission, 2019). Many of these have, however, been criticized, inter alia, for lack of specificity and difficulty of implementation (Hao, Reference Hao2019). Others focus primarily on legal aspects, and only secondarily addressing ethical concerns—see, for example, the guidance issued by the French data protection supervisory authority (CNIL, 2022) or comparable guidance issued by the UK data protection supervisory authority (ICO, 2022). There are, additionally, multiple standards and frameworks on the provision of cloud-based services in compliance with EU privacy and data protection laws (see, e.g., CSA, 2020 or EU Cloud COC, 2022) which, from PolicyCLOUD’s perspective, do not suffice to fully regulate the concerns raised by the platform, as they do not specifically address issues which might arise specifically from the use of AI-based systems, nor do they provide much focus on the ethical implications of cloud computing. In short, none of the previous frameworks were deemed sufficient to address all possible legal and ethical issues to be managed in and of themselves. To avoid criticisms leveraged at prior frameworks, while also arriving at a framework which might effectively assure PolicyCLOUD’s legal and ethical soundness (supported by authoritative standards, guidelines, and principles), it was important to draw requirements from multiple different prior frameworks and translate them into relevant, understandable and actionable controls which could guide the development of PolicyCLOUD.
As a result, after having identified the main legal and ethical issues derived from the goals intended for PolicyCLOUD, we have defined and applied a multidimensional set of legal and ethical controls to the platform. These controls, jointly referred to as PolicyCLOUD’s Legal and Ethical Framework, were derived from various EU standards, as mentioned above—including, inter alia, the Ethics Guidelines for Trustworthy AI developed by the High-Level Expert Group on AI, the EUCS—Cloud Services Scheme developed by the European Union Agency for Cybersecurity, and various opinions and guidelines issued by the European Data Protection Board (notably their Guidelines 4/2019 on Article 25 Data Protection by Design and by Default and their Guidelines 8/2020 on the targeting of social media users). In this section, we will highlight key technical and organizational measures taken to address these controls and ensure PolicyCLOUD’s legal and ethical soundness.
4.1. Analytics functions and data source registration
As described in the preceding section, PolicyCLOUD has also been designed to allow for registration of additional functions. Where these functions are not held to a high standard of legal/ethical compliance, various risks may arise for policymakers which decide to make use of them—most notably, reliance on ingest and/or analytic functions which have not been developed with bias and trade-off management considerations embedded into their design (e.g., a function based on an AI model which has been trained on a population dataset that, itself, suffers from relevant biases, or otherwise does not appropriately represent the population which is relevant in a given use case for that function, creates a relevant risk of biased or misleading output generated by the function) introduces a risk of deriving skewed, biased, inaccurate or otherwise misleading information from the datasets to which they are applied. This, in turn, creates a risk that policies based on such information become ultimately misguided and ineffective to address the issues for which they were planned.
PolicyCLOUD also allows the registration of datasets, on which ingest and analytic functions may be applied. Even where the applied functions can be said to meet a high standard of legal/ethical compliance, similar issues may arise where these datasets are themselves not properly scrutinized from a bias standpoint, considering the population targeted by a given policy (e.g., it may happen that a given dataset does not properly represent the target population for which a given policy is designed, by overrepresentation of one gender or one ethnicity over another). Additionally, EU privacy/data protection, intellectual property and contract laws may impose restrictions which prevent policymakers from lawfully using certain datasets without permission or an appropriate legal basis (e.g., if a dataset contains information about identifiable individuals, the policymaker will only be able to use this dataset lawfully if it can meet the requirements for an appropriate legal basis under the EU General Data Protection Regulation, such as the pursuit of a task in the public interest).
To address this, analytic and data owners (i.e., individuals or organizations who seek to register an ingest or analytic function or a dataset on PolicyCLOUD) are met by specific input parameters within PolicyCLOUD’s registration processes. These parameters require those owners to provide information on the specific measures which have been taken to address the risk of biases inherent to a function/dataset, or other relevant legal/ethical constraints that may exist (e.g., the existence of personal data in a dataset, the management of relevant trade-offs in function development, authorization from relevant rights holders). To guide owners in providing valid and useful information within these parameters, guidelines, including sets of questions to be addressed, are provided to them. This owner input is linked to the respective function/dataset on PolicyCLOUD, and can later be accessed by any user. Owners can, under the terms and conditions applicable to PolicyCLOUD (which they are required to accept), be held accountable for damages arising from their provision of knowingly false, inaccurate or incomplete information during the registration process. As a result, users can rely on this input to make informed and risk-based decisions on whether or not to leverage a given function/dataset, as well as to critically examine the output generated by the function/dataset in the context of their policymaking decisions. This mechanism represents a balance struck in PolicyCLOUD between maximizing legal/ethical compliance, on the one hand (which could compromise PolicyCLOUD’s effectiveness), and avoiding overly restrictive registration processes for functions/datasets on the other (which could trigger the aforementioned risks related to failure in meeting a high standard of legal/ethical compliance).
For a practical example of the implementation of these legal/ethical registration controls, please see Section 7.2 of this article.
4.2. Access control
One of the key requirements of PolicyCLOUD’s Legal and Ethical Framework related to the security of information is to ensure an access control mechanism is in place. Such a mechanism should provide a procedure for identification and authentication of authorized PolicyCLOUD users (ranging from administrators to normal users, such as policymakers), as well as a procedure to assign, monitor and revoke access rights to those users regarding functions, datasets, generated policies and other assets available on PolicyCLOUD. In so doing, concerns related to data minimization—that is, ensuring that both personnel with administrative access to PolicyCLOUD’s backend and the actual PolicyCLOUD users can only access data (notably, personal data) which is adequate, relevant, and not excessive to the activities which they are to perform on PolicyCLOUD - are addressed.
To ensure that this access is appropriately controlled, we have developed and implemented a data governance and privacy enforcement mechanism, based on the attribute-based access control (ABAC) scheme. This includes a model and model editor used to define access policies and enforce them, and an ABAC authorization engine used to evaluate policies and attributes, thus enforcing protection and privacy-preserving policies. ABAC is an authentication and authorization model that uses attributes (characteristics) related to the user requesting access or the subject. This enables enhanced flexibility, as compared with other schemes such as RBAC (Role Based Access Control) and ACL (Access Control Lists), to allow/deny access to critical resources by keeping user attributes up-to-date and propagating changes in real-time to the authorization mechanism. Through ABAC, PolicyCLOUD users can be restricted from, for example, accessing policies generated by other users, or accessing specific functions/datasets.
To complement these technical controls from a legal perspective, contractual limitations on users’ abilities to leverage data, functions, and other assets available on PolicyCLOUD have been put in place. This includes enforceable contractual obligations imposed on personnel with administrative access to PolicyCLOUD’s backend, and on users via PolicyCLOUD’s Terms and Conditions (such as restrictions on seeking to access PolicyCLOUD’s source code and on making PolicyCLOUD directly available to third parties).
4.3. Data subject rights management
Datasets which are registered on PolicyCLOUD may include information on identifiable individuals (i.e., personal data—this may include, for example, names, addresses, phone numbers, and opinions expressed, in the case of a dataset made up of complaints filed by citizens at their municipality’s contact center). Furthermore, PolicyCLOUD’s very functioning requires the use of such information on PolicyCLOUD users (e.g., personal data related to registered account on PolicyCLOUD, such as name and e-mail address, and additional personal data may be collected through PolicyCLOUD’s internal logging processes, such as IP addresses and actions performed on the platform). As such, to ensure that PolicyCLOUD remains compliant with EU privacy/data protection legal requirements, PolicyCLOUD must allow those individuals—whether individuals whose data is captured in a registered dataset or individual PolicyCLOUD users—to exercise their rights as data subjects (e.g., under the EU General Data Protection Regulation/GDPR). This includes the right of access (which entitles individuals to information about how their information is handled, as well as access to their information), the right to rectification (which entitles individuals to correct information held on them which may be inaccurate or incomplete), and the right to erasure (which entitles individuals, under certain circumstances, to have their information deleted), among others. PolicyCLOUD cannot, at the very least, create any relevant technical obstacles to the exercise of these rights.
To address these rights, PolicyCLOUD has been designed to ensure that adequate data manipulation abilities are in place. In particular, PolicyCLOUD’s data repository has been designed to allow system administrators to perform all needed data operations. The actual platform further includes an End-User Data Protection Notice which explains to those individuals how they can submit requests for the exercise of these rights.
4.4. Data configuration management
The process and storage of personal data included in a dataset must be adequate, relevant, and limited to what is necessary in relation to the specific purpose(s). Thus, policymakers must be afforded tools to minimize the amount of personal data collected from datasets. It should be possible for users to prevent (or, at least, mitigate) privacy/data protection compliance risks by filtering out personal information from such datasets, where the intended analyses do not require individuals to be identified. One simple example is sentiment analysis over a given issue on a dataset made up of posts uploaded to a social media platform, where that user is not interested in individual opinions, but in the aggregated opinion of a community: that user has no need to access or further process names, or online identifiers, present on the social media platform, and should be able to extract value from the dataset without accessing such data points. For similar reasons, personal data should not be stored on PolicyCLOUD as a rule (it being assumed, in any case, that most policymaking activities benefit sufficiently from analysis of aggregated datasets, without the need for the identification of individuals).
If a dataset containing personal data is uploaded to the platform, the data owner is required to provide assurances of its compliance with applicable legal requirements (including the EU General Data Protection Regulation), as seen above. Furthermore, data owners (as well as other subsequent users of the dataset) can define data constraints on PolicyCLOUD, which allow those users to configure the parameters under which data validation, cleaning and verification activities are carried out by ingest functions applied to the dataset. This gives data owners and PolicyCLOUD users control over the specific data points of a dataset that are to be registered and leveraged via PolicyCLOUD. In particular, a dataset can be configured, as part of the platform’s data cleaning processes (further explored in the next section) so that personal data is not collected or processed unnecessarily by the platform (e.g., configuring the platform so that, when ingesting a dataset, identifiers such as names, usernames, national ID numbers, IP addresses, dates of birth—are not collected or further processed). This enables unnecessary personal data to be removed from datasets prior to further processing via the platform, which provides greater assurances of privacy and data protection compliance, as well as of data quality (i.e., that only relevant and necessary data will be further processed on the platform).
5. PolicyCLOUD Ingest Analytics
This section details the ingest analytics technologies developed in PolicyCLOUD that have been extensively used in pilot use cases: data cleaning, enhanced interoperability, and sentiment analysis. As mentioned in the introduction, additional functions such as Trend Analysis are in development and will be added to the built-in functions of the platform.
Data cleaning and enhanced interoperability are highly linked. The data cleaning process detects, corrects (or removes) inaccurate data. It provides its output to the enhanced interoperability process for the extraction of semantic knowledge and the interlinking/correlation of the ingested data.
5.1. Data cleaning
The goal of the data cleaning component is to ensure that all the data collected from possibly heterogeneous information sources will be as clean and complete as possible. Over the past decade, devices, organizations, and humans have begun to continuously produce and deal with data. Faster innovation cycles, improved business efficiencies, more effective research and development, and now policymaking, are just a few of the benefits of efficiently using and understanding data (Gutierrez, Reference Gutierrez2020). All these create numerous challenges, including the challenge of volume, as well as the problem of generating insights in a timely fashion. Data cleaning is critical into facilitating the analysis of large datasets by reducing complexity and improving data quality.
Many authors have proposed data-cleaning algorithms to remove noise and data inconsistencies. Worth noting is the research of Krishnan (Reference Krishnan2016) where a data-cleaning methodology called ActiveClean is presented. It can configure its operation to maximize the accuracy of predictive models to predict and complete missing values and noisy data. Moreover, Dagade et al. (Reference Dagade, Mali and Dagade2016) proposes a method for managing data duplications, by detecting duplicate records in a single or multiple databases. The solution proposed for detecting and repairing dirty data in Gohel et al. (Reference Gohel, Patil, Vadhwana and Patel2017) resolves errors like inconsistency, lack of accuracy, and redundancy, by treating multiple types of quality rules holistically. In Tian et al. (Reference Tian, Michiardi and Vukolić2017), a rule-based data-cleaning technique is proposed where a set of rules defines how data should be cleaned. Moreover, the research of Zhang et al. (Reference Zhang, Song, Wang and Yu2017) shows an innovative method for correcting values in time series that are considered abnormal, through anomaly detection, where the authors are using the method of iterative minimum repairing (IMR). In addition, Mahdavi et al. (Reference Mahdavi, Neutatz, Visengeriyeva and Abedjan2019) make use of techniques such as Meta Learning, Classification, and Ensemble Learning to automatically generate streams and manage missing values, through computation of similarities between a dataset and past datasets to identify the most effective data cleaning algorithms. Finally, Krishnan (Reference Krishnan2016) implements the BoostClean model that selects debugging and repair management methods using “statistical boosting” methods for erroneous and missing attributes.
The cleaning component of PolicyCLOUD adds as a novelty to the current state-of-the-art an overall data cleaning approach that can be adapted and automatically adjusted to the severity of the domain and the context of the ingested data. The domain is semantically identified following the semantic meaning and interpretability of the ingested data’s content following the bag of words paradigm: a representation of text that describes the occurrence of words within a document. The cleaning process is then devised accordingly by implementing cleaning actions to answer the relevant needs and requirements: the data cleaning component of PolicyCLOUD detects and then corrects or removes incomplete, incorrect, inaccurate, or irrelevant data. More specifically, the main goals of this component are to (a) ensure a substantial level of trustworthiness of incoming data, (b) investigate and develop mechanisms to ensure that ingested data is not duplicated/repeated, and (c) investigate and develop mechanisms that ensure the information can be provided as needed, based on stakeholders cleaning requirements and formatting needs. To achieve these goals, the data cleaning component supports various data cleaning actions through three discrete steps, which can be provided as independent services that adapt their functionality based on the specificities and severity of the domain on which the cleaning actions must be performed. All this is done according to the prespecified requirements. Figure 3 depicts the data cleaning workflow.
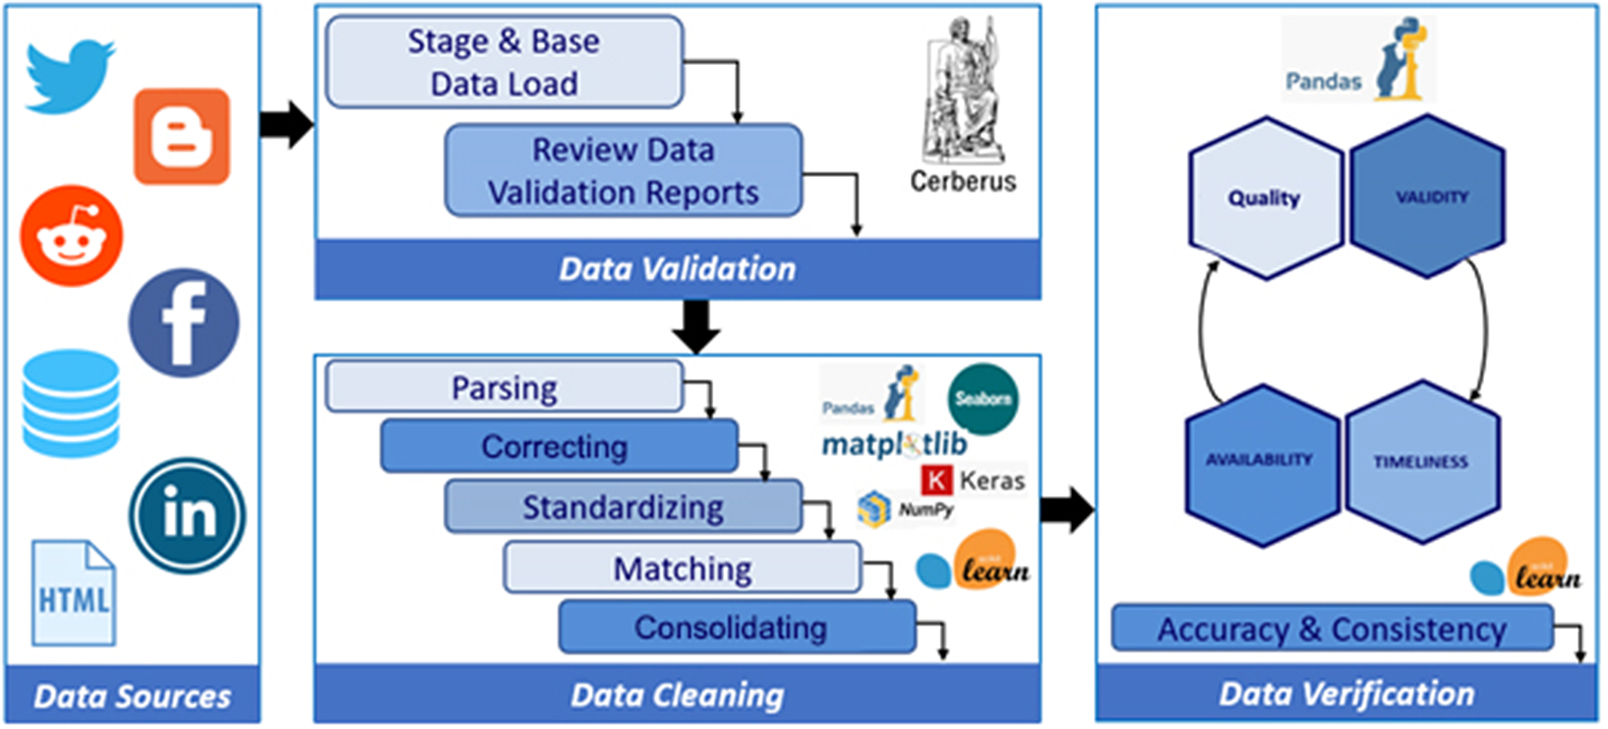
Figure 3. Data cleaning workflow.
During the full data cleaning workflow, the data being ingested may be streaming (e.g., Twitter and Facebook) or coming from an originally stored dataset (e.g., webpages, blogs, and local datastores). Through the ingestion process, the dataset’s domain is identified following the approach of Kiourtis et al. (Reference Kiourtis, Nifakos, Mavrogiorgou and Kyriazis2019) by discovering and analyzing the semantics of the ingested data. As a result, following the process indicated in Mavrogiorgou et al. (Reference Mavrogiorgou, Kiourtis, Manias and Kyriazis2021), where the domain of the dataset is identified, the required set of data cleaning actions is computed. In PolicyCLOUD, we can differentiate between the various pilot domains, including radicalization (for RAD), winery (for WINE), smart cities (for SOF), and labor domains (for CAM). More generally, the overall process is already trained to consider the domains of healthcare, finance, industry, security, and education, considering sector-specific requirements and time-related constraints. It should be noted that the data cleaning workflow cannot be considered as a one-size-fits-all solution, since the aforementioned sector-specific requirements may depend on criteria related with the device that produced the data to be cleaned, the timeframe that the data were generated or collected, or the time period that the data were examined, used, or reused for performing data cleaning actions. For that reason, to avoid such inconsistencies, the data cleaning actions to be performed are evaluated also considering external criteria which are tailored and customized for the domain to be applied (e.g., to predict missing values regarding the energy consumption of smart meters during the period of winter, the mechanism must not rely on data from the summer period, thus it is built to calculate both sector-specific and time-related constraints). The overall handling of each of the various domains follows a similar approach for each of the use cases, as indicated below. Consequently, we did not face any use case-specific difficulties and challenges. Furthermore, to reduce any domain-generated challenges and blocking issues, the data cleaning process is continuously trained and improved to improve the identification of the semantic nature of each domain. This is done by feeding the overall process with additional training material, in order to include supplementary domain identification.
At this point the pipeline continues as follows:
1. Data Validation: a set of validation rules specified by the data sources registrants where each rule pertains to one of the attributes of the possibly many entities of the dataset. Each rule is translated into one or many constraints that may be mandatory (e.g., specific value length or data type) or optional (e.g., value uniformity, cross-field validity). A final list is built, including the cleaning (corrective) actions to be applied (e.g., deletion, replacement, or prediction of a value). The Data Validation service can validate all the different kinds of incoming data, identifying errors associated with a lack of conformity with a specified set of rules.
2. Data Cleaning: This service performs the necessary corrections or removals of errors identified by the Data Validation service and performs automated data cleaning action based on the predefined rules. Hence, this service ensures a dataset’s conformity to mandatory fields and required attributes. Multiple open-source libraries (i.e., Pandas, Scikit-learn) are used to implement all the required cleaning functionalities.
3. Data Verification: This process checks the data elements of the dataset for accuracy and inconsistencies. It ensures that all the corrective actions performed by the data cleaning service have been executed in compliance with the design of the data model and ensures that an ingested dataset will be error-free to the greatest extent possible.
5.2. Enhanced interoperability
Policymaking deals with very different formats, models, and semantics of data. Data interoperability addresses the ability of modern systems and mechanisms that create, exchange, and consume data to have clear, shared expectations for the contents, context, information, and value of these divergent data (European Union, 2017).
Data interoperability relies on the system’s ability to identify structural, syntactical, and semantic similarities between data and datasets, and to render those data/datasets interoperable and domain-agnostic (DAMA, 2009). Another feature of enhanced interoperability is its ability to automatically annotate processed data with appropriate metadata and provide findable accessible interoperable and reusable (FAIR) data (Hasnain and Rebholz-Schuhmann, Reference Hasnain and Rebholz-Schuhmann2018).
In practice, data is said to be interoperable when it can be easily reused and processed by different applications; this allows different information systems to work together by sharing data and knowledge. Specifically, semantic interoperability is a key enabler for policymakers, as it enhances their ability to exploit big data and improves their understanding of such data (Motta et al., Reference Motta, Puccinelli, Reggiani and Saccone2016). Additionally, creating efficient and effective policies in terms of good governance requires modern policymakers to implement techniques, mechanisms, and applications focused on semantic interoperability to increase their performance and enhance their entire policymaking approach (Blagoev and Spassov, Reference Blagoev and Spassov2019). This is supported by extracting and considering parameters and information that may not initially be apparent in data/datasets.
Mapping and creating interoperable data depend on methods that provide semantic and syntactic interoperability across diverse systems, data sources, and datasets. The enhanced interoperability component, designed and implemented within the PolicyCLOUD project, relies on data-driven design by using linked data technologies, such as JSON-LD (2022), and standards-based ontologies and vocabularies. This is coupled with the use of powerful natural language processing (NLP) tasks to improve both semantic and syntactic interoperability of the data and datasets (Zheng et al., Reference Zheng, Lu, Ghasemzadeh, Hayek, Quyyumi and Wang2017).
In this context, PolicyCLOUD introduces the SemAI mechanism, a novel approach for achieving enhanced interoperability that integrates advanced Semantic Web and NLP techniques. SemAI was designed and implemented as a generalized and novel Enhanced Semantic Interoperability hybrid mechanism to ease the extraction of valuable knowledge and information (Manias et al., Reference Manias, Mavrogiorgou, Kiourtis and Kyriazis2021).
SemAI was designed to achieve high levels of semantic data interoperability to help organizations and businesses turn their data into valuable information, add extra value and knowledge, and achieve enhanced policy-making through the combination and correlation of several data, datasets, and policies. For this, SemAI introduces a multilayer mechanism that integrates two main subcomponents: the semantic and syntactic analysis and the ontology mapping, both depicted in Figure 4. To this end, the successful annotation, transformation, and mapping of data into corresponding ontologies in terms of semantic and syntactic interoperability is key. The Ontology Mapping subcomponent seeks to save correlated, annotated, and interoperable data in JSON-LD format and as linked ontologies rendering the retrieval of semantic facts for the support of the corresponding data schema models feasible. This subcomponent seeks to map concepts, classes, and semantics defined in different ontologies and datasets and to achieve transformation compatibility through extracted metadata. In addition, a data modeling subtask is defined in order to specify the metadata elements that should accompany a dataset within a domain. To this end, semantic models for physical entities/devices (i.e., sensors related to different policy sectors) and online platforms (e.g., social media) are identified. The integration of these two subcomponents provides semantic interoperability across diverse policy-related datasets, even pertaining to different domains.
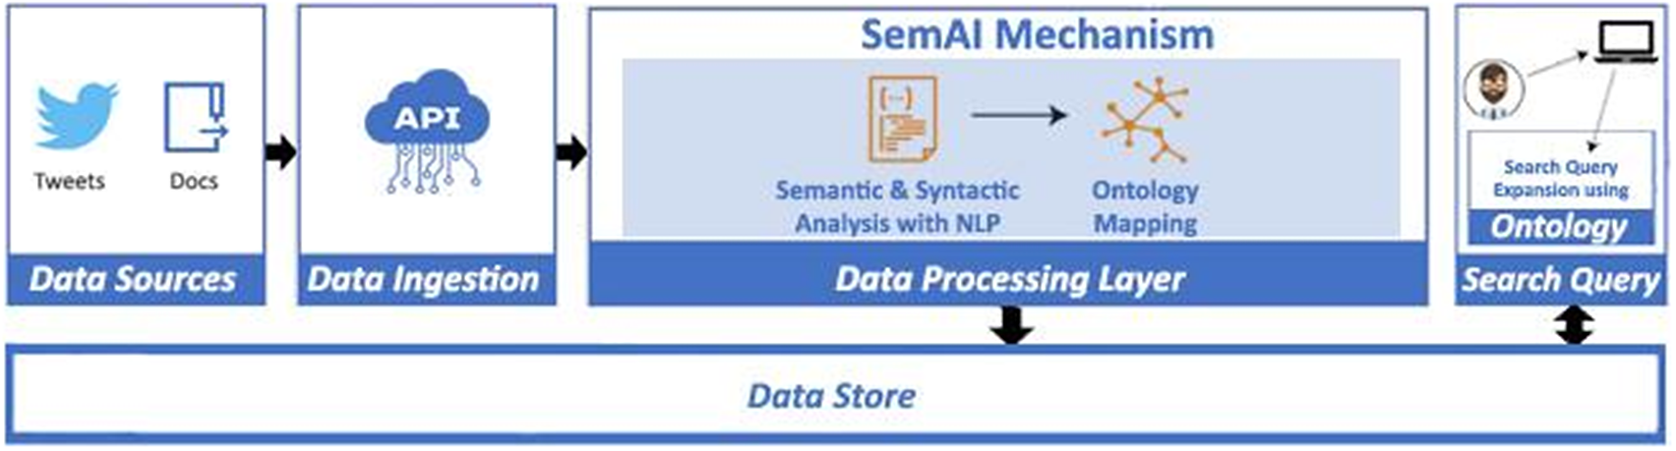
Figure 4. Enhanced interoperability workflow.
We applied SemAI to two families of pilots: RAD and WINE (see Introduction). Since the RAD policymaking and analysis typically uses many datasets, it is critical to interlink and correlate them with annotated interoperable metadata. This permits the discovery of new insights based on merged information that was made interoperable. For instance, when we analyzed various datasets we were able to extract the responsible radicalization group for most of the events. This enables a deeper understanding of radicalization trends, as this added information enhances the overall understanding and the policies related to a specific event or a series of radicalized events.
For the WINE pilot, we were able to extract and annotate raw tweets by using named-entity recognition (NER) (2021) a mechanism for information extraction to locate and classify named entities mentioned in unstructured text into predefined categories. The output of NER is named entities along with their role in the tweet, (e.g., Bodegas Viñedos—LOCATION, Campo Cariñena—LOCATION, and San Valero—PRODUCT). We also extracted and annotated topics by using several subtasks of the SemAI mechanism, such as topic modeling, topic categorization, part-of-speech (POS), tagging, and NER. By correlating tweets with records from other datasets (e.g., market information about San Valero wine) we were able to derive additional knowledge and insights.
Enhanced interoperability also plays an important role in one of the SOF scenarios, which deals with the analysis of air pollution in the Sofia municipality. This scenario is based on two datasets: the complaints lodged by the citizens with the municipality (the “tickets” dataset) and the IoT records that report pollution measurements as a function of time and location in Sofia. Using SemAI, we aimed to correlate these two datasets to generate a visual analysis of how the actual pollution varies in relation to the opening of air pollution-related tickets. This can provide insight, for example, about the level of pollution at which citizens start lodging tickets. As a next step, we envision linking this analysis with the (anonymized) medical records of Sofia citizens to discover correlations between improvements in air pollution and the changes in the percentage of Sofia residents who suffer from pulmonary disorders.
5.3. Sentiment analysis
Sentiment analysis is broadly defined as the field of study that examines people’s opinions, sentiments, evaluations, attitudes, and emotions based on their written language (Liu, Reference Liu2012). This field has experienced a tremendous uptake in interest over the last decade in both commercial and research applications due to its applicability in several different domains. Consequently, sentiment analysis was considered as very valuable for policymaking as it enables learning general opinions about a product, service, or policy. PolicyCLOUD offers sentiment analysis tools to help public administrators and private companies monitor, analyze, and improve their achievements.
Sentiment analysis has matured since its inception in the early 21st century when it classified long texts into categories according to their overall inclination (Pang and Lee, Reference Pang and Lee2005). Today, we are seeing remarkable results with the use of neural networks and deep learning techniques, such as convolutional neural networks or recurrent neural networks (Sun et al., Reference Sun, Huang and Qiu2019; Manias et al., Reference Manias, Mavrogiorgou, Kiourtis and Kyriazis2020; Zhao et al., Reference Zhao, Li and Zheng2021). Statistical techniques, such as discriminative and generative models (Mesnil et al., Reference Mesnil, Mesnil, Mikolov, Ranzato and Bengio2014), or supervised machine learning algorithms, such as Naive Bayes, Maximum Entropy Classification, and SVMs (Pang and Lee, Reference Pang and Lee2002) have also been used to classify the different sentiments expressed in written text.
The PolicyCLOUD sentiment analysis component has also evolved, from a document-level approach (Medhat et al., Reference Medhat, Hassan and Korashy2014; Rachid et al., Reference Rachid, Azza and Henda2018) to an entity-level sentiment analysis (ELSA) approach (Sweeney and Padmanabhan, Reference Sweeney and Padmanabhan2017). The difference between the two approaches lies in the goal of the analysis. In the first version of PolicyCLOUD, our main goal was to understand the general opinion expressed by an author about one main topic (Feldman, Reference Feldman2013). In its second version, the goal is to understand the author’s opinion regarding various entities at the basic information unit (Karo Moilanen, Reference Karo Moilanen2009). This second opinion/sentiment approach can be considered as having an intermediate granularity level between sentence-level sentiment—where the identity of the entity discussed in a sentence is known and there is a single opinion in that sentence—and aspect-level sentiment—where the aim is to extract the sentiment with respect to specific aspects pertaining to the relevant entities (Zhao et al., Reference Zhao, Li and Zheng2021).
In the document-level approach, we used machine-learning models, such as Vader (Hutto, Reference Hutto2014). In the entity-level approach, we used a pretrained bidirectional encoder representations from transformers model (BERT model) (Devlin et al., Reference Devlin, Chang, Lee and Toutanova2018). An initial pipeline depicted in Figure 5 was identified for these activities. It can be described as follows: (a) the cloud gateway starts the process by providing access to data from a given source (e.g., Twitter), (b) the data cleaning subcomponent performs the initial and necessary preprocessing and cleaning activities on the collected data, (c) two specific NLP subtasks are executed on the preprocessed/cleaned data: a BERT-based contextual component for word embedding, and a NER component to extract and classify named entities found in the data, (d) the enhanced interoperability subcomponent annotates the data with information on already identified relevant entities, and on the appropriate topics in which the data have been sorted by topic identification activities, and (e) finally, the BERT-based sentiment analysis task is performed, leveraging a ready-to-use Python library (PyPI, 2021). Its functionality is directly tied to BERT’s next-sentence prediction, allowing this task to be formulated as a sequence-pair classification.
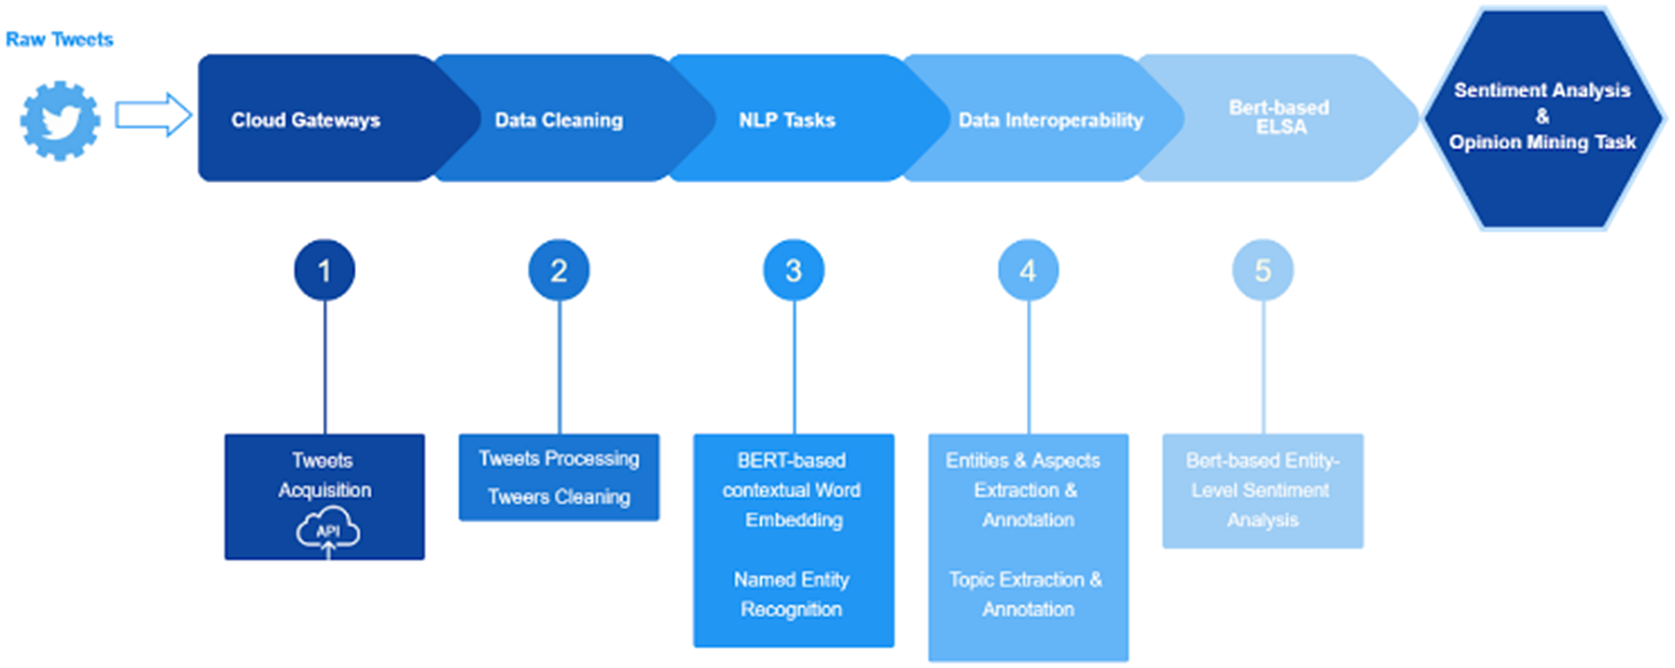
Figure 5. ELSA workflow.
The ELSA mechanism enhances the Sentiment Analysis within PolicyCLOUD by filtering and providing the corresponding sentiments for identified and extracted entities, therefore the entity-level approach can be applied to the same pilot cases as it was done with the document-level approach, specifically for the pilot scenario related to Aragon wine marketing policies (WINE). The latter can also be used in other use cases such as in the analysis and elaboration of various policies for the Sofia municipality where specific signals from the citizens of Sofia can be processed. In this context, specific sentiments dedicated to a specific topic can be recognized and extracted. For example, a unique signal/post of a citizen can be recognized to have different sentiments: such as a negative sentiment for the transportation issue and a positive sentiment for the road infrastructure. Such detailed analysis can be obtained by enhancing the overall sentiment analysis with the ELSA mechanism.
In practical terms, the sentiment analysis provided by PolicyCLOUD is used for detecting and then providing aggregation statistics concerning the overall sentiment of the text as well as the sentiment regarding certain terms related to the use case. These statistics reflect the number of positive/negative/neutral reactions and other information pertaining to specific user-defined time periods. Gauge, timelines charts, and maps are some of the visualization techniques used to support the policymaker through PolicyCLOUD. With the help of these charts, the policymaker can quickly estimate the sentiment toward general topics and/or particular use case-centered entities. See the description of the WINE use case in Section 7 for additional details.
In Section 7, we report our experience at applying the sentiment analysis to various pilots of PolicyCLOUD: In RAD, sentiment analysis is used to extract the sentiment of online activities. This extracted sentiment (e.g., degree of support for violent attacks) is added as metadata which annotates the input records (e.g., tweet). In WINE, SemAI is used to extract from various online sources sentiments related to various wine-related entities. This knowledge can be used in conjunction with the social analytics component to develop and validate marketing policy models and simulations. Moreover, this sentiment analysis annotation can help to understand trends and thus correlate observed changes in sentiment with various marketing strategies and react more promptly to consumer feedback.
Despite the need for sentiment analysis for the SOF ticket dataset, we were not able to apply our technology since it cannot currently handle non-English texts. This ability has been targeted as one of the future enhancements.
6. Social Dynamics Analytics
Social dynamics is the only-non ingest analytics technology developed in PolicyCLOUD and is used to estimate the social impact of various policies via social simulation. Its goal is to note the possible social implications of various policies with respect to different agent-based models (ABM) for the populations of interest. Agent-based models and their associated simulation tools have become quite valuable in the analysis of interactions between individuals or groups in social dynamics, as they can capture feedback between the behavior of heterogeneous agents and their surroundings (Will et al., Reference Will, Groeneveld, Frank and Müller2020). In this paradigm, agents act independently, according to prescribed rules, and adjust their behavior based on their current state, on that of other agents, and the environment. Consequently, emergent patterns and dynamics can be observed, arising from local interactions between the agents.
In general, the fidelity of the ABM models to real-world phenomena and the difficulty of obtaining empirical datasets of populations in which to apply these models are under discussion (Onggo et al., Reference Onggo, Yilmaz, Klügl, Terano and Macal2019). However, these models are mostly driven by processes and mechanisms inspired by a social or behavioral sciences theory, so they have theoretical underpinnings. Furthermore, it emerges that their outcomes can be consistent with empirical data (Taghikhah et al., Reference Taghikhah, Filatovab and Voinov2021).
Social dynamics can be used as an integrated component with the PolicyCLOUD platform. In this case, the policymaker can invoke Social dynamics via various analytical functions that include it as a link in user-defined toolchains processing policy-related information. Such an arrangement increases the impact of this technology in policy design and analysis by allowing, for example, the linking of its output with advanced visualization tools available in PolicyCLOUD for displaying Social dynamics results or accepting as input “cleaned” real-world graph datasets of social networks (e.g., by allowing at most one edge between any two nodes) coming from the Data cleaning process.
6.1. Architecture
The simulation environment includes a user-side and a server-side system. The user-side system allows multiple users to concurrently interact with the social dynamics component through a JavaScript web client interface. Using this interface, they can: specify, edit, or delete a simulation, browse the specifications of simulations stored in the system, execute simulations, upload/download data to a simulation, examine raw simulation results, and compute and visualize simulation analytics. On the server side, all user requests are processed by a web server based on the Phoenix web framework (Phoenix Framework, 2022). The Phoenix system interacts with three independent components: (a) the simulator built in Elixir (elixir-lang.org), which in turn is built on Erlang (2022), (b) the analytics component, which includes the meta-simulator environment also built in Elixir, and (c) the storage system. Given that the environment operates as an analytic tool external to PolicyCLOUD, it exposes a REST API through which the PolicyCLOUD environment can receive simulation results in JSON format.
6.2. Methodology
The social dynamics component uses agent-based social simulation as its primary analysis tool to evaluate policy alternatives. The policy simulator provides a concurrent environment to manage the state of each individual agent. During each simulation cycle, the simulator spawns a set of concurrent processes—one for each individual agent—and each agent runs its individual and connection dynamics rules and updates its state. Individual rules describe how the attributes of each individual change as a result of the individual’s interaction with a set of other individuals. Each such interaction takes place using a connection between the two that has its own attributes. The rules for connection dynamics describe how these connection attributes change over time.
Social dynamics decomposes each policy into a tree hierarchy of goals, objectives, and simulation steps, following the methodology and terminology used in policy analysis. Each goal contains an abstract description of the desired outcomes of a policy. Under each goal hangs a set of alternative objectives that are used to achieve this goal. An objective corresponds to a specific methodology for achieving a goal. Each objective can be decomposed into a sequence of steps, each of which represents a policy execution step in the methodology of the parent objective. We assume that the execution of each step can be simulated, thus providing a value range for its possible outcomes. The social dynamics component simulates each of these steps and embeds a series of analytic tools in the tree hierarchy for a policy; this allows the component to investigate the relationship between simulation outcomes to goals, and operationalize the criteria selected by policymakers. This, in turn, should allow policymakers to better understand what policy decisions may be recommended in light of their purported goals. Furthermore, by offering a common modeling and execution environment for simulation-based analytics, this component provides a standard basis that facilitates the inspection and comparison of different models for social dynamics.
6.3. Social dynamics applied to pilots
We describe the contribution of social dynamics to two pilot cases in policy design. Both contributions provide ways to analyze and design policies in cases where scant evidence is available for their possible effects on a population. This can happen when it is difficult to obtain datasets from previous relevant policy applications either because such policies have never been applied or because they have been applied in populations significantly different from their current target.
The first pilot is RAD (see Introduction as well as how other technologies from PolicyCLOUD addressed this use case in Sections 6.2 and 6.3) in the context of which we provide a qualitative description of the design of a hypothetical and naive policy for containing radicalization. A more detailed description can be found in epinoetic (2022), Sgouros (Reference Sgouros2022), and Sgouros and Kyriazis (Reference Sgouros and Kyriazis2021). We first describe the simulation models we use for modeling policy alternatives and then show how these models are integrated in a meta-simulation framework that allows their assessment and comparison.
The contribution of the Social Dynamics component to the second pilot, WINE (see Introduction), is concerned with designing a policy to improve consumers’ motivation to purchase certain types of wine as compared to their competitors in a specific region. The WINE pilot is being applied to the Aragon region in Spain and supports the development of intelligent policies for the agri-food sector, which plays an important role in the Aragonese economy. Given that knowledge of the effects of different pricing of particular wines in specific markets comes from empirical data only for the pricing policies that have been applied to these products previously, in WINE we provide a novel solution to the analysis of such untried alternatives by estimating the effects of promising combinations for price and ad effort that can increase the penetration of specific Aragon wines against their competitors. Such an estimate is based on real-world data for wine prices and ratings from wine specialist sites that describe the current market status and are used for confirming the validity of the model for the current market situation (the base case with no policy applied).
6.4. A simulation model for radicalization
6.4.1. Background and problem description
We assume that the radicalization process features the progressive adoption of extreme political, social, or religious ideals in the population through social influence. Social influence is defined as a change in an individual’s thoughts, feelings, attitudes, or behaviors that results from interaction with another individual or a group (Walker, Reference Walker2015). Social dynamics models a policy’s target group as a graph representing a population of autonomous and interconnected agents. We refer to graph nodes as individuals, and to graph edges as their connections. In the RAD model, each individual has an initial radicalization_status represented as a real number between −1 (nonradicalized) and + 1 (fully radicalized). Each individual can influence other individuals through a number of outgoing, directed connections. Each such connection has:
1. A contact_strength which indicates whether the individual regards this connection as friendly or not. Contact strength is modeled as a real number between −1 (enemy) and + 1 (friend).
2. An influence representing the level of social influence that a person exerts on other individuals they connect with in terms of radicalization. At each simulation cycle, the influence is computed as the product of the radicalization_status of the individual and the contact_strength of the connection. Therefore, radicalized individuals are expected to influence their friends toward more radicalization, while influencing their enemies toward less radicalization.
During each simulation cycle, individual agents update their current radicalization_status by adding to it the sum of the influences they receive through all their incoming edges. At the end of each simulation cycle, the model computes a set of policy-related attributes for the population. Individuals with a radicalization_status:
1. greater than a defined threshold are considered radicals,
2. less than a conformism-related threshold are considered conformists (nonradicals),
3. the rest are considered radical sympathizers.
Through this example, we compare the social outcomes of applying a policy that restricts the interactions of radicals with the rest of the population, with a base case of applying no such policy. Restricting the interaction of radicals is modeled as a reduction of the contact_strength of their connections with their friends. These friends are those who are the targets of a radical’s connections with a contact_strength greater than a defined threshold for friendship. Such a reduction is achieved by multiplying the current contact_strength with a random coefficient between 0 and 1 during each simulation cycle. Individuals for whom the absolute value of the contact_strength of all of their connections is lower than a defined restriction-related threshold are considered to be isolated (e.g., they may be under some form of incarceration or surveillance). At the policy level, the restricted attribute measures the proportion of isolated individuals in the population.
6.4.2. Meta-simulation-based policy design for radicalization
A hypothetical policy to control the spread of radicalization in a population can consist of a tree hierarchy (see Figure 6), that includes, at its root, one goal (0) to reduce the influence of radicals over the population. Two objectives are analyzed with regards to this goal. The first one (0–0) is the base case of maintaining the status quo. Essentially, the objective models the problem that the policy is seeking to address and provides a base of comparison for the rest of the analysis. The other objective (0–1) seeks to restrict the influence of radicals to the public. Each one of these objectives has a simulation step below it. The 0–0–0 step, under objective 0–0, provides a simulation model of the evolution of radicalization in the population of interest with no policy applied. The other step (0–1–0), under objective 0–1, provides a simulation model of the social dynamics that ensue when a policy seeks to restrict radicals’ interaction with the rest of the population.
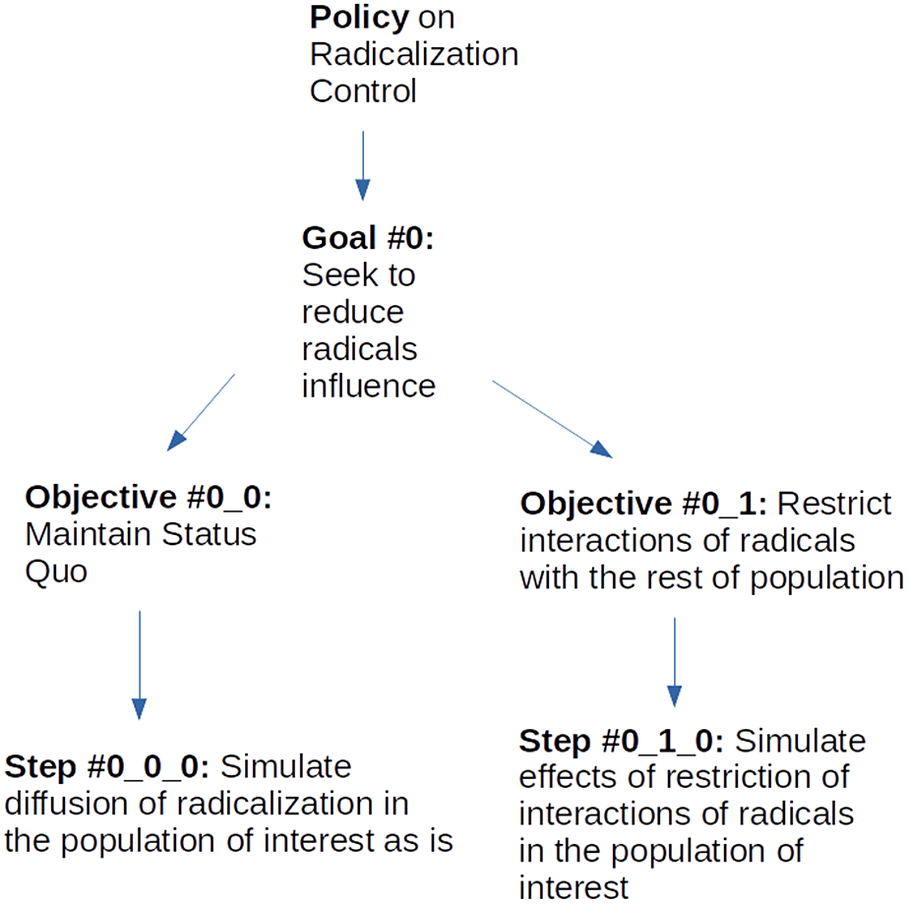
Figure 6. Tree hierarchy for radicalization policy.
Each policy has a set of design-specific parameters that can be defined at various levels in the policy hierarchy and follow a top-down propagation in the hierarchy. These include:
1. The population model relevant to the policy, that is, a graph model that represents the target population in terms of number of nodes and its connectivity patterns (e.g., min/max number of connections per node, use of a random or power-law method for generating the graph).
2. The set of policy-relevant attributes (e.g., the maximum percentage of isolated individuals that can be monitored effectively).
3. The number of rounds and sizes of populations on which each alternative will be tested.
The environment supports a top-down propagation of design parameters in the policy hierarchy. In our example, the values for the population model and policy attributes defined at the policy level are used in the simulation models for both steps 0–0–0 and 0–1–0, while the values for population size and simulation rounds at goal 0 are similarly propagated to both steps 0–0–0 and 0–1–0. The meta-simulation environment automatically generates a bottom-up processing pipeline to transform simulation outcomes of the various alternatives into policy recommendations.
When a user chooses to execute the policy design process hierarchy, then every step in the leaves of this tree runs the simulation model it has been associated with, using the design parameters defined for it. Each step maintains the results of all rounds of simulations it has executed, along with the population size in each one, both indexed under the round number for each. The results of each step are then fed to the objective above it to compute a set of analytics for each of the policy-relevant attributes defined in the design, at this higher level. This set includes the average value of each policy attribute, along with its minimum and maximum values, after all the simulation rounds. Sets of analytics from each objective are then fed to a set of criteria defined by the policy designer at the goal above them. Each criterion evaluates a logical expression involving the policy-related parameters defined for the policy. For example, a criterion can check whether the average value for the radicals computed in the objectives below is lower than that of their sympathizers, and whether the same average value for their sympathizers is lower than that of the conformists. After evaluating each objective on the set of criteria defined for the specific goal, the meta-simulator assigns a criteria-ranking map for the objectives based on the proportion of criteria that each one has satisfied. The designer can now consult this map to find out which of the objectives may be preferable for implementing each goal in the policy hierarchy. Despite its simplicity and the lack of an empirical dataset of a radicalized population as input, RAD serves as an exploratory study that allows us to explain how PolicyCLOUD in general and Social Dynamics in particular can contribute to the dual goal of providing technical support and facilitating debate and criticism during policy design. For example, determining the target group of a policy is often a political decision (Helen Ingram, Reference Helen Ingram2015). In our case deciding on a particular threshold value for radicalization_status reflects a policymaker’s belief of when someone should be classified as a radical. It also leads to specific estimates for the current scale of the radicalization problem in a population, as the size of the radical subgroup is inversely proportional to the value of radicalization_status. Both features of the particular policy problem now become explicit and visible in the modeling assumptions and the outcomes of the simulation of each alternative, respectively, and, along with the explicit criteria defined for evaluating each policy alternative can be debated and criticized during policy formation. Consequently, while it is debatable whether RAD currently offers a convincing simulation model for radicalization in the real world, it can be argued that the Social Dynamics framework in which these simulations are embedded generate novel opportunities for the policy design process.
6.5. Simulation model for wine purchase motivation
6.5.1. Background and problem description
We assume that price and quality are the main factors influencing consumers when purchasing wine. That said, consumers can also be influenced by their exposure to wine-related advertising/marketing campaigns and the wine preferences of their social circle. Based on these assumptions we define the following set of parameters of interest for estimating the purchase motivation for a particular brand of wine (e.g., X) in a specific region:
1. Actual price for X.
2. Quality (in a scale of 0 to 1) of X as determined by its average rating in a series of online reviews.
3. Estimate of the average price of wines sold in the region of interest.
4. Estimate of the maximum price for wine that is acceptable for an average consumer.
5. Average quality of the wines sold in the region of interest (0 to 1).
6. Average income of the population in the region of interest.
7. Maximum income of the population in the region of interest (e.g., the maximum income two standard deviations away from the mean assuming a normal income distribution).
8. Average relative exposure of individuals to the advertising campaign for X (0 to 1). We assume that average exposure is proportional to the relative size of the advertising budget for X compared to its competitors.
We further assume that the population in the region of interest is represented as a social network, where each node corresponds to an individual. For each individual (e.g., A), each outgoing edge is labeled with a weight representing the influence that A exerts on the wine-purchasing decisions of one of its social connections. Each individual has a set of attributes that are relevant toward X. These include A’s:
1. Income ranking (in a scale of 0 to 1) as determined by the ratio of its income to the maximum income for the region.
2. Sensitivity to the price of X as determined by the product of the difference of 1 minus A’s income ranking times the ratio of the current price of X to the maximum wine price in the region. Therefore, price sensitivity provides an estimate of how much the price of X affects A’s willingness to buy it. According to this estimate, poor individuals are more sensitive to the price of wines compared to wealthier ones.
3. Sensitivity to the quality of X as determined by the ratio of the current quality of X to the average quality of wines in the region, times A’s income ranking. Therefore, quality sensitivity provides an estimate of how much the quality of X affects A’s willingness to buy it. According to this estimate, wealthier individuals are more sensitive to the quality of wines than poor ones.
4. Susceptibility to the advertising/marketing campaign for X (0 to 1). This estimates the extent to which an individual attends to and values ad messages as sources of information for guiding her consumptive behavior. This can depend on the exposure of A to the ad campaign with more exposure leading to less susceptibility.
5. Susceptibility to social influence toward X (0 to 1).
6. Perceived influence for X from A’s social circle. This is computed as the average purchase influence for X stemming from its social circle.
Based on these attributes, the model estimates A’s purchase motivation for X as a linear combination of:
1. A’s price sensitivity for X.
2. A’s quality sensitivity for X.
3. The product of A’s advertising susceptibility for X to the intensity of X’s ad campaign. We assume that the intensity of the ad campaign for X is a real number between 0 and 1 that is proportional to the relative size of the advertising budget for X compared to its competitors but also to the type of ad campaign (e.g., targeted or not) used.
4. The perceived influence for X for A’s social circle.
6.5.2. Meta-simulation-based policy design to improve the purchase motivation of a specific brand of wine
The purpose of this pilot is to identify changes in the parameters for X (price, quality, and intensity of advertisement campaign) that can increase consumers’ motivation to purchase it as opposed to its competitors in a specific region. We allow the policy maker to provide data for two competing wines, one from Aragon (e.g., X) and one from some other region (e.g., Y) that describe their current price, quality, and the intensity of their advertisement effort. The policy maker can then define interactively various alternatives for pricing and/or intensity of advertisement effort for X and explore via simulation whether any of these alternatives enable X to become more popular than Y in a specific population. Simulation results are visualized as charts that facilitate direct comparisons between the alternatives explored. These charts are generated by linking the Social Dynamics component with the Visualization tool in PolicyCLOUD via an analytic function. For example, Figure 7 displays:
1. in the x-axis, the ratio of price of X versus Y defined for each alternative.
2. in the y-axis, the ratio of the intensity of the advertisement effort for X versus Y for each alternative.
3. the ratio of purchase motivation for X versus Y computed via simulation for each alternative is shown as a sphere with an area and color proportional to the value of this ratio.
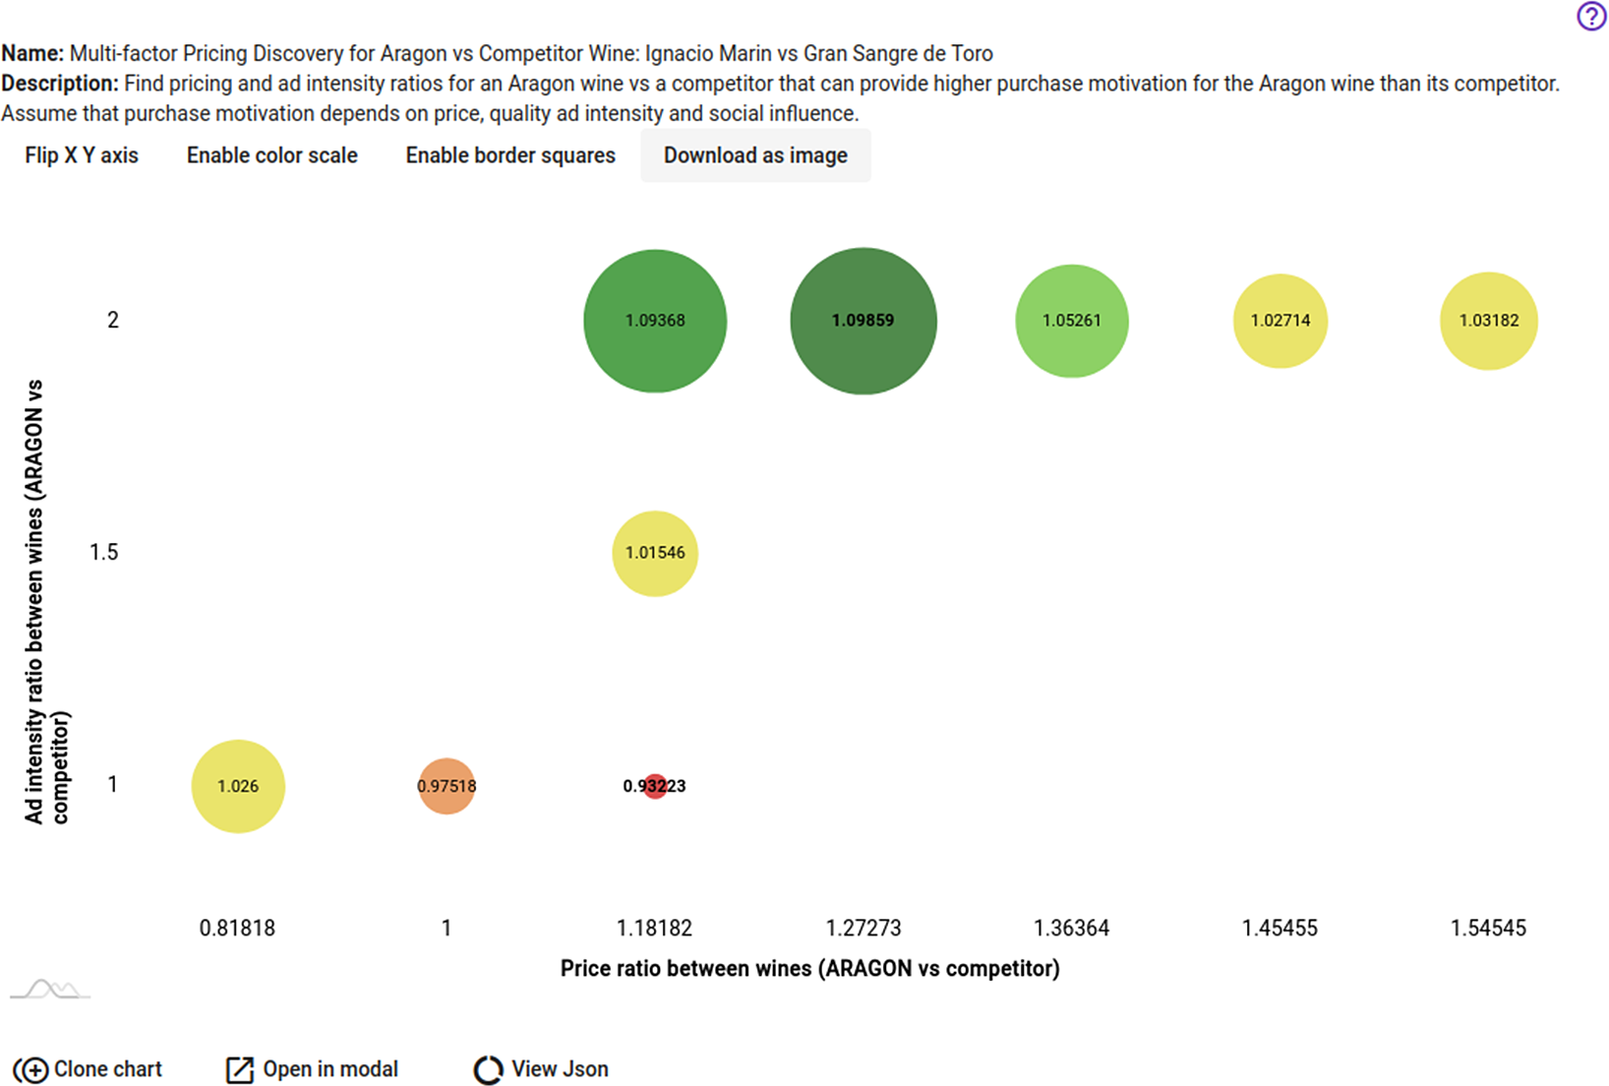
Figure 7. Example chart for the WINE use case in PolicyCLOUD.
As the chart in Figure 7 shows, the best policy alternative among those simulated occurs for a price ratio of 1.27273 between X versus its competitor Y and for a doubling of the intensity of the ad effort for X versus Y. At this point, we compute an almost 10% higher purchase motivation for X versus Y (a 1.09859 value for the ratio of the average purchase motivation of X vs. Y). This is much better than the base case that estimates the current status between these two wines with no policy applied. For this base case we compute an average purchase motivation for X lower than that of Y (a 0.93223 ratio of average purchase motivations) at a price ratio of 1.18182, assuming the same intensity of the ad effort between X and Y. Therefore, for the best policy alternative compared to the base case we were able to increase both the purchase motivation for X (almost 18%) and the price for X (almost 7%) but with a doubling of the intensity of the ad effort for X versus Y. The identification and estimation of such trade-offs between policy variables are one of the advantages of using the Social Dynamics component in PolicyCLOUD for policy design.
7. PolicyCLOUD in Practice
7.1. Introduction
As detailed in Section 1, PolicyCLOUD was already applied to four use cases, each with multiple scenarios. In this section, we zoom in on the WINE use case to provide a more concrete understanding of how PolicyCLOUD can be applied and what benefits it can bring.
The WINE use case has taken advantage of the PolicyCLOUD platform in multiple ways, notably by using the modeling and simulation capabilities of PolicyCLOUD, as detailed in Section 6.5. In this section, however, we detail how PolicyCLOUD was instrumental at fulfilling another critical requirement of the WINE use case: to be able to access historic, as well as real-time, understanding of the popularity of some chosen wines by analyzing relevant tweets. In a first stage, the PolicyCLOUD framework gateways component fetches relevant tweets. For this, the end-user specifies a set of filtering keywords. The stream of tweets goes through the pipeline of built-in analytic functions specified during the registration of the Twitter stream: first, cleaning actions are applied; then, enhanced data interoperability techniques are applied to further semantically and syntactically analyze the tweets and, finally, annotate them with appropriate entities and relevant topics. Finally, sentiment analysis is performed, and the text of the tweets is replaced by the computed sentiment analysis. At this stage, the modified tweets are stored, and will be retrieved when a visualization function is invoked for analysis of the overall sentiment.
It should be stressed that if the policy analyst requires analytics capabilities that are not part of the built-in functions of PolicyCLOUD (e.g., a “bot tweet detector” able to detect, with good precision, non-human-created tweets), then they have first to create or obtain the needed function, then register it with the DAA (see Section 3.2), and finally include it within the analytic pipeline associated to the targeted dataset.
7.2. Detailed description of the WINE use case
Twitter is considered by the WINE use case owner as an important and representative media to assess the customer sentiments as for wine popularity.
First, let us discuss what analytic functions should be applied to the stream of Twitter data:
Twitter data tends to be unstructured, noisy, cluttered and frequently using informal language. It may also contain extraneous items (e.g., characters, links) as well as data anomalies (e.g., slangs, typos, elongated characters, transposition, concatenated words, and complex spelling mistakes) that should be handled. Therefore, as a first step, Twitter data must be cleaned. We applied the PolicyCLOUD Data Cleaning analytic function, described in Section 5.1, to obtain clean and qualified data which is the basis for obtaining reliable analysis results.
Following cleaning operations, we apply Enhanced Interoperability to recognize appropriate entities which will be used by the aspect-based sentiment analysis. In addition, these extracted entities are mapped with appropriate ontologies and knowledge databases through corresponding URIs, to further enhance the knowledge derived from the processed tweets.
Finally, since our goal is to provide sentiment analysis as a function of parameters such as time interval, we obviously must apply the Sentiment Analysis function on the tweet data stream to compute the sentiment, which then replaces the text of the tweet (which is no longer of interest).
Secondly, we had to address legal and ethical aspects relevant to this use case: the Twitter dataset’s registration on the platform involved a legal/ethical assessment (see Section 4.1). The following recommendations were made to ensure the legally and ethically sound use of this dataset: first, in analyzing Twitter’s general and specific terms of service in view of our use case, no conflict with these terms of service was detected; secondly, measures were taken to provide greater assurances of the reliability of the dataset, to avoid false, inadequate, inaccurate or incomplete data—this was achieved, to an extent, through tweet-filtering and data cleaning actions carried out on the dataset, though additional assurances could be obtained by analytic functions which are not currently built-in to PolicyCLOUD (e.g., the “bot tweet detector” mentioned in Section 7.1); finally, as tweets may contain personal information, addressing GDPR was mandatory: this included completing a legitimate interests assessment (to ensure that a legal basis for use of these personal data exists), guaranteeing that channels exist to allow Twitter users to exercise their data subject rights (e.g., asking for access to or deletion of their content), and developing an information notice to allow those users to become aware that their personal data is being processed in this manner under the WINE use case. Given that reaching out to individual users to serve them with this notice would be disproportionately difficult, if not impossible, this notice was developed for publication on the WINE Use Case pilot’s website, to create the possibility for relevant users to become aware of this activity.
Since the WINE use case relies on most of the built-in analytic functions, we had to analyze them in terms of potential biases/trade-offs (see details in Section 4.1):
1. Data Cleaning allows the definition of adequacy constraints to filter out data. This definition is an ethically relevant choice, as any biases or prejudices inherent to constraint definition will potentially apply to the resulting “cleaned” dataset. Such definition should therefore be guided by objective and reasoned criteria seeking only to ensure the relevance of the content left within the dataset for the purposes of the WINE use case. See Section 7.3 for more details on the constraints set;
2. Concerning the Enhanced Interoperability component, while there is some research claiming to show evidence of inherent demographic bias in the named entity recognition (NER) functionalities (Mishra et al., Reference Mishra, He and Belli2020), this risk was deemed mitigated in PolicyCLOUD as this component was trained on widely applied models (e.g., the spaCy 2.0 open-source library and, more specifically, the “spacy_lg” model) which have been shown to present good levels of accuracy and low levels of bias;
3. The Sentiment Analysis component uses external libraries, notably, the VADER library (Hutto, Reference Hutto2014), which may involve some degree of bias depending on the used training methodology (e.g., the subjectivity of the analyzed attributes, the representativeness of the labeled datasets used for training, the infeasibility of providing expert validation of analyses carried out by the component), which cannot always be fully mitigated in an effective manner (Kiritchenko and Mohammad, Reference Kiritchenko and Mohammad2018). Reliance on this component thus requires an understanding of these potential biases to ensure that results generated by the component are assessed critically, rather than merely taken at face value. By documenting these considerations and making them available in a user-friendly manner, the conclusions reached in the WINE use case can be interpreted by the relevant user with these possible limitations in mind.
Finally, upon a user request to display statistics of the sentiment analysis, a Dashboard-opinion-impact was targeted for supporting the policymaker with the results obtained in the sentiment analysis.
7.3. Technical points of interest for the pipeline
The overall functionality of the PolicyCLOUD platform starts with the utilization of the Cloud Gateways component. The latter provides access to Twitter data without requiring the end-user to directly connect to the Twitter API. Under this scope, the end-user provides a set of keywords to filter and fetch all the relevant tweets (e.g., merlot and carinena), and possibly the maximum number of tweets in order to further limit the results returned by the Cloud Gateways. Figure 8 showcases a snapshot of some tweets when the keywords are {“merlot,” “carinena”}.
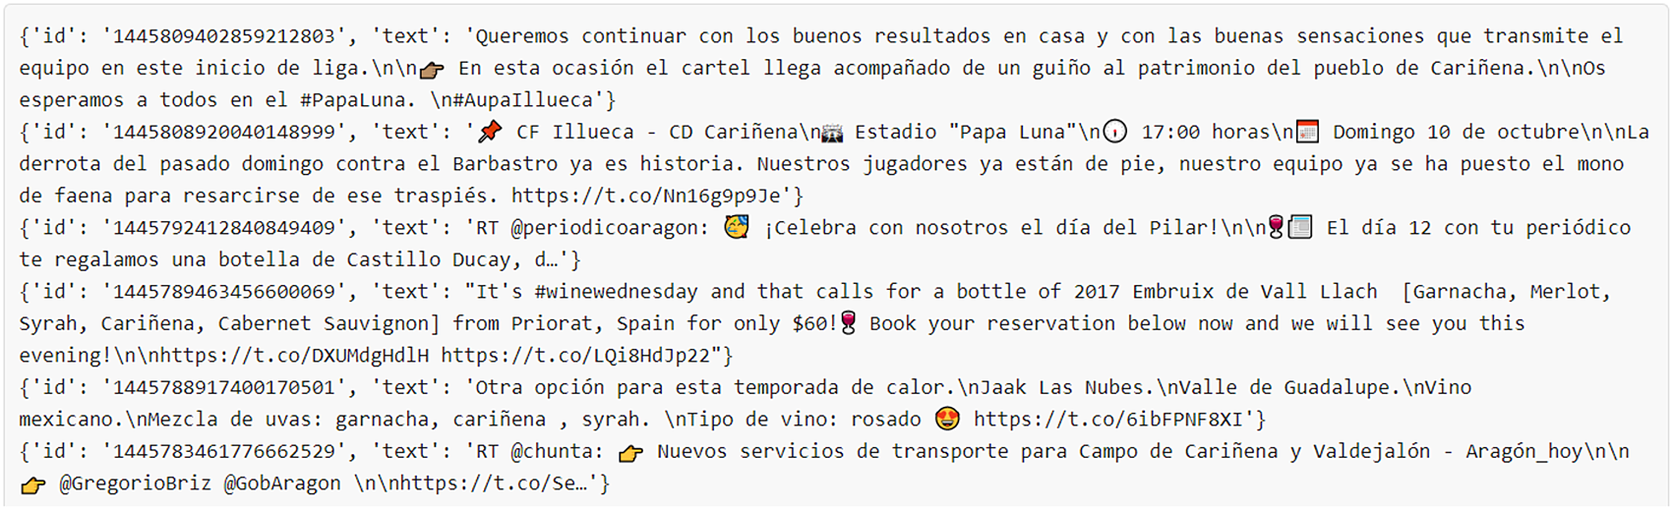
Figure 8. Snapshot of fetched tweets.
We stress the huge advantage of having built the PolicyCLOUD platform over serverless Cloud services: when bursts of data must be ingested, PolicyCLOUD can quickly handle the incoming bulk of data, benefiting from automatic elasticity while on the other hand only paying for used resources, possibly down to zero if the incoming stream of data temporarily stops.
Snapshots of the raw and then cleaned Twitter data are depicted in Figures 9 and 10. A series of validation checks is performed on each incoming tweet text to evaluate its conformance with the constraints currently integrated in the business logic of the service. The current list of validation rules/constraints for such kind of data includes the identification of the existence of emojis, stop words, punctuations, mentions, as well as hashtags, since such rules have seemed to affect the performance of the rest of the components of the pipeline. Then the necessary corrective actions are applied on the data elements marked with errors and the cleaning completes with the verification and the evaluation of the corrective actions undertaken.

Figure 9. Snapshot of raw ingested Twitter data.

Figure 10. Snapshot of cleaned Twitter data.
Following data cleaning, the Enhanced Interoperability mechanism is applied to provide a high level of Semantic Interoperability and rich semantic annotations for the WINE Use Case. The cleaned data is annotated with recognized appropriate entities which are attached as metadata and which will be used by the Sentiment Analysis component to further enhance its functionality. The novel SemAI hybrid mechanism introduced in Section 5.2 is used as it addresses the need for interpretable and meaningful data through the integration of Semantic Web and NLP technologies. Based on this approach raw and unstructured data derived from Twitter can be correlated and integrated with structured data derived from a divergent source. This technique has been applied in the WINE Use Case. More specifically, the utilization of NER, one of the most widely used tasks of NLP, coupled with the utilization of text mining methods based on knowledge databases, SPARQL queries, and related reasoning capabilities enhanced the interoperability and the final linking and annotation of the processed tweets. In this context, an ontology-based NER approach has been followed and implemented. The ontologies that are used to further train the NER task and finally provide the proper URIs to the identified entities can either be introduced by the policymaker, or widely applied ontologies can be used. The overall submechanism for this enhanced functionality is depicted in Figure 11.
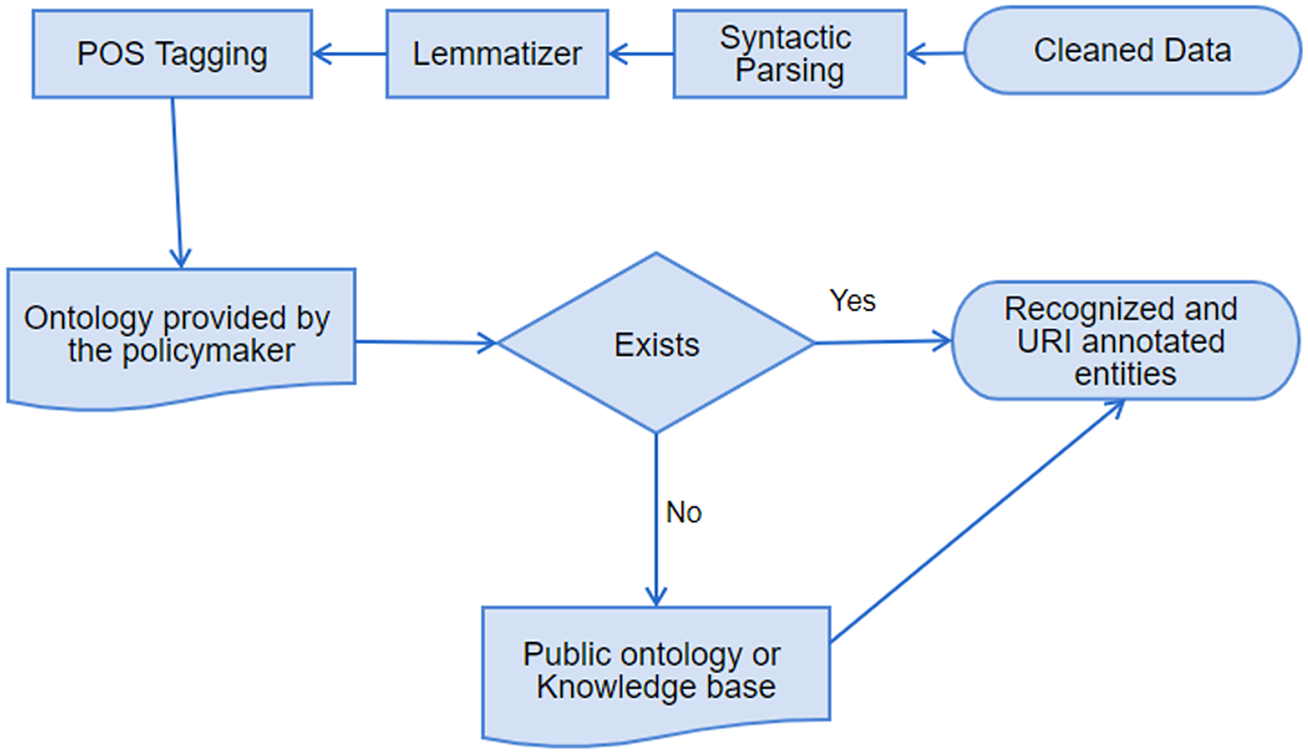
Figure 11. Ontology-based NER.
The overall functionality of Enhanced Interoperability is summarized as follows. The NER performs tasks to locate nouns in the sentences, then the identified nouns are lemmatized. SPARQL is used to further annotate the identified and lemmatized nouns with either URIs derived from the ontology which was initially specified by the stakeholder or from widely used ontologies and knowledge bases. Hence, the final recognized entities are linked with specific identifiers to be further used and analyzed by the Sentiment Analysis component of the PolicyCLOUD project. The resulting annotated tweet is depicted in Figure 12.

Figure 12. Annotated tweet.
As the last step in the analytics pipeline, the sentiment analysis is applied to the WINE use case. It permits assessing the impact and sentiment generated by the different products (wines) in social media contributions. Additionally, this analysis is done not only for the wines themselves but also for their producers (wineries) and areas of production to provide an overall view of the image that these actors have in social media. From an architectural point of view, this capacity is achieved by the continuous data streaming analysis process and data visualization.
The data streaming analysis proceeds as follows: The aspect-based sentiment analysis process is triggered for each tweet in the pipeline and extracts the sentiment regarding the entities identified in the Data Interoperability step. The sentiment is then added as a new field of the tweet and is then persisted in the PolicyCLOUD storage.
The data visualization batch analysis process is triggered by the invocation of an aggregation-visualization function for a specific period and for a specific periodicity (daily, monthly, yearly). The requested sentiment statistics are computed by retrieving the information persisted in the previously commented data streaming analysis process. For example, this batch process will perform at-rest analysis for extracting sentiment-score statistics. The obtained aggregated data is shown to the policymaker through different visualization techniques to present the requested data regarding particular wines, wineries, and denominations of origins, all of them related to the Aragon region. In addition, the policymaker can quantify the presence of certain wine/wineries/denomination of origin around the world and the sentiment toward them in different countries. Concerning the visualization of the sentiment analysis results, a dashboard opinion has been provided. This dashboard-opinion permits policymakers to summarize extracted sentiment. For specific entities, the dashboard supplies a set of dropdown menus to select the desired entity to be monitored. Within the dashboard, the following charts provide specific views of the information extracted from the sentiment analysis:
1. A gauge chart for displaying the accumulated sentiment (mean-based) for a specific period.
2. Timelines charts for monitoring the sentiment evolution along a set of time periods.
3. Maps for showing the accumulated sentiment at specific locations (tweets comprise a geolocation field).
4. Other charts for representing additional statistics such as the total number of positive/negative/neutral impacts.
The following subsection provides more details about these charts.
7.4. Description of experiment output
As described in the previous subsection, the sentiment analysis can support the policymaker with a set of sentiment-related charts which summarize statistics for sentiment (a) extracted from general text or (b) regarding certain entities. For this last case, the policymaker selects targeted entities through the dashboard entities, from a WINE ontology provided by the use case. Consequently, the dashboard will display related graphs. For example, if the user selects the entity: “D.O. Calatayud” (“Region” type in the ontology) then various charts can be visualized:
Figure 13 shows a timeline chart that helps the policymaker monitor the daily sentiment evolution of the “D.O. Calatayud” entity between February 5, and March 5, 2022. If the user clicks on a specific day, the overall sentiment score for this day is shown including the total numbers of positive, negative, and neutral tweets.

Figure 13. Timeline chart.
Figure 14 shows the Gauge chart, which displays the mean score sentiment for the same period.

Figure 14. Gauge chart.
Finally, as shown in Figure 15, the policymaker can visualize a heat map which reflects the mentions of the “D.O. Calatayud” entity. Clicking on a specific country, the policymaker can zoom in and visualize the sentiment statistics (gauge chart, timeline chart) for a specific entity (in our case “D.O. Calatayud”) in this country.

Figure 15. Sentiment analysis pulse—geographic distribution.
7.5. Conclusion for the WINE use case
The WINE use case permits to appreciate how and to what extent the PolicyCLOUD platform can help a policymaker. First, as described in Section 6, the modeling and simulations capabilities of PolicyCLOUD permit to orient the policymaker in terms of critical marketing decisions, such as the selling price or the magnitude of the advertisement effort. In Section 7, we have shown how PolicyCLOUD permits to solve the basic policymaker requirement of being able to visualize the overall sentiment concerning various possible entities. Fulfilling this requirement demanded rigorous analytics preprocessing of the input data, which was made possible through built-in analytic functions of the platform. It is important to stress again the versatility of PolicyCLOUD, which permits the registration of additional analytic functions.
Besides the WINE use case, other use cases have also used all or part of the built-in analytic functions at ingest time, while their analysis was done with sometimes different visualization functions.
8. Critical Evaluation
In this section, we provide a critical assessment of the PolicyCLOUD framework and its integration with policy pilots.
One of the goals pursued by the PolicyCLOUD framework is to promote transparency in the policy-making process.
Transparency has many aspects and involves many trade-offs. A transparent process would ideally permit an external observer to be confident that the datasets and analytic functions used in a specific policy process are adequate.
In the following, we discuss some of the transparency issues that we encountered in PolicyCLOUD, as well as our solutions.
1. What is the quality of the datasets used? For instance, did they introduce a bias in the analysis done in the process?
2. If multiple datasets are processed jointly in relation to some policy studies, how do we know if they are mutually consistent?
3. Could we detect and remove bias in algorithms?
4. Could alternative datasets have been chosen in place of the one(s) used for a policy study? What is the rationale for this choice?
We will take bias, or the lack of it, as an important quality data aspect:
In Section 4.1, we presented the PolicyCLOUD requirement of providing bias management documentation when registering datasets or functions. The goal is to prevent the uninformed use of biased artifacts.
We noticed that this documentation requirement was not fully satisfactory. The main reason is that a dataset will be detrimental to policymaking only relative to the goals of the intended policy. For instance, let us assume a dataset of recorded nutrition disorders observed in male patients: obviously, the use of this dataset for elaborating general policies will suffer from an acute gender bias; however, using the very same dataset for policies intended for males will be free of gender bias.
We handled this problem by requiring that dataset documentation specify basic statistical facts out of which one may infer whether it is biased for a given usage (e.g., 87% of the records pertain to males while only 13% pertain to females, in addition, 99% of the records relate to individuals living in US towns of more than 100,000 inhabitants).
We identified an additional difficulty that relates to inter-dataset consistency: the inconsistency of seemingly identical concepts that appear in schemas of different datasets.
For example, should people discouraged by their inability to find suitable employment (e.g., single mothers), and/or those who no longer seek a job, be considered unemployed? Various datasets dealing with “unemployed” will be inconsistent if their answers to this question differ.
Our basic approach for alleviating this problem is to require that the party registering the dataset will document (within the bias documentation) the specificities of the concepts used within the schema of the dataset (e.g., detail whether “unemployed” includes discouraged people).
Our recommendation, however, is to transform the datasets to remove the inconsistency and render them fully comparable. In the employment example, the data augmentation would consist of defining clear concepts and further transform the datasets to address these concepts. This could be done, for example, by assuming separate “unemployed” and “discouraged” statuses, checking if the “unemployed” status of a given person’s record should be kept or transformed into a “discouraged” status. This transformation may be inferred from attributes of the record.
Generic detection and removal of bias is an important enhancement of PolicyCLOUD. We harness toolkits that serve this goal. One such toolkit is AI Fairness 360, an open-source software that can detect and remove bias in machine learning models (AIF360, 2020). The idea behind leveraging this toolkit is to develop analytic functions aimed at verifying and validating machine learning models used within PolicyCLOUD (i.e., by running those models against the various fairness metrics defined within the toolkit), in order to provide greater assurances that models which are ultimately uploaded and used on the platform have been checked for and are free from discrimination and bias.
Another difficulty is that the choice of a dataset and the specific analytic tool used may not be clearly grounded. In extreme cases, a dataset and its specific processing may be chosen so that they lead to an a priori chosen policy. In some cases, even if a dataset should clearly be chosen as the basis of the policy-making, the analysis may have been applied to a specific subset that will lead to certain conclusions or it can be based on unreasonable assumptions, over-simplification, and problematic estimates of important parameters (Aodha and Edmonds, Reference Aodha, Edmonds and Edmonds2017). This can be the case since there is always an ad hoc character in policy-making, which is essentially a political process and therefore reflects political opinions when framing and solving problems (Cairney, Reference Cairney2021). For example, even deciding whether a certain level of unemployment is a problem that should be addressed by a policy is debatable as there are views arguing for a “natural” level of unemployment in an economy. As a first step in alleviating the problem, we require that the policymaker document answers to a list of questions such as: Why were these specific datasets chosen? Are there other known datasets that could have been chosen? Another proposal is to provide digital tools that promote critique and consensus-building in policy design. Allowing people to comment on the platform about the datasets and functions used in different policy cases and even rate them can help to reconcile objective knowledge coming from observational data and/or simulations with its subjective interpretation as is often the case in the social domain (Martini and Boumans, Reference Martini and Boumans2014). Also providing interfaces that facilitate side-by-side comparisons between different policy alternatives can enhance the level of policy debate.
As a last observation, the effectiveness of a platform such as PolicyCLOUD depends on a redesign of the general policy practice around the use of such open and transparent technologies for public interest and that may require brave political decisions.
9. Conclusion and Future Work
We have presented PolicyCLOUD, a pioneering cloud-based architecture dealing with policymaking and its current implementation. We demonstrated how PolicyCLOUD enables organizations both to simply register analytic tools and datasets and to reuse them. We detailed the ingest analytic tools developed to date as well as the modeling and simulation analytical tool.
While the initial results of PolicyCLOUD are very encouraging, our evaluation shows that important capabilities still need to be added. First, we need a way to evaluate the infrastructure financial costs associated with the processing of a new dataset, given its size, its ingest analytical sequence of tools, and so forth. Another feature is to understand how the reuse of a registered analytic tool can benefit its owner and how to define the liability of these reused tools. In addition, it will be critical to ensure that registered analytical tools will not constitute security problems.
Our initial use of PolicyCLOUD suggests further steps. For example, in the radicalization pilot mentioned at the end of Section 5.3, the location and degree of identification of the tweet author to various social circles of interest can be estimated and thus permit the analysis of radicalization trends as function of location. A next natural step would be to correlate between radicalization trends and radicalization policies in each country to help policymakers understand the actual impact of the policies and infer any adjustments needed. Importantly, the pluggable architecture of PolicyCLOUD makes it easy to register and use new analytic functions such as a “fake news detector” as already remarked at end of Section 3.2.
Sentiment Analysis was critical in several of our pilots; however, this analysis cannot be better than the data on which it relies. For example, as shown in “Retooling Politics” (Jungherr et al., Reference Jungherr, Rivero and Gayo-Avello2020), pushing large amounts of distorted content such as tweets linking a politician to a scandal can create false associations. Thus, a complex but important enhancement of Sentiment Analysis will be to consider the estimated reliability of the input data to assess the reliability of the aggregated sentiment analysis. Additionally, several technical improvements such as enabling Sentiment Analysis to non-English scenarios will widen the applicability of PolicyCLOUD to new scenarios.
The possibility of enabling user feedback is also important when it comes to encouraging reuse. Hence, we should give the PolicyCLOUD users the opportunity to comment and rate both the framework itself and the reused analytical tools. Finally, the PolicyCLOUD platform has been developed subject to various legal and ethical requirements, with the goal of ensuring the platform’s lawfulness and maximizing its trustworthiness (and that of the policies generated through it). This includes an innovative dataset/function registration process which, through the requirements imposed upon registrants, should allow platform users to make informed and balanced decisions about the datasets and functions they wish to leverage in their policymaking process. It will be interesting and important to further analyze how diverse PolicyCLOUD users manage these complex requirements through the platform.
Acknowledgments
This article focuses on the Cloud Analytics framework of the PolicyCLOUD project which was developed by a subset of the PolicyCLOUD team. The authors are grateful to the rest of the PolicyCLOUD crew for their cooperation and support. The authors are also grateful to the arXiv organization for the publishing of a preprint version of this article (Biran et al., Reference Biran, Feder, Moatti, Kiourtis, Kyriazis, Manias, Mavrogiorgou, Sgouros, Barata, Oldani, Sanguino and Kranas2022).
Funding Statement
The research leading to the results presented in this article received funding from the European Union’s funded Project PolicyCLOUD under grant agreement no. 870675. The funder had no role in study design, data collection and analysis, decision to publish, or preparation of the manuscript.
Competing Interests
The authors declare no competing interests exist.
Author Contributions
Author contributions using the CRediT taxonomy (https://www.casrai.org/credit.html) roles as a guide: Conceptualization: O.B.; Data curation: A.M.; Funding acquisition: D.K.; Methodology: M.T.B., N.M.S., O.B., P.K., S.B., Y.M.; Project administration: D.K., O.B., Y.M.; Software: A.K., A.M., G.M., M.A.S., N.M.S., O.F., P.K.; Supervision: Y.M.; Writing—original draft: N.M.S., O.F.; Writing—review and editing: A.K., A.M., D.K., G.M., I.O., M.T.B., M.A.S., N.M.S., O.F., Y.M. All authors approved the final submitted draft.
Data Availability Statement
We present some of the core features and functionalities of the PolicyCLOUD platform. To illustrate them, we provide examples that refer to datasets identified by use cases from our partners in the consortium. These partners are themselves policymakers working in specific scenarios; these scenarios were used by the consortium to identify platform requirements and ensure that the development of the platform was done around actual and concrete policymaker needs.
The datasets mentioned in this article include:
1. The datasets used in the RAD pilot which include public data derived from the Global Terrorism Database (accessible at: https://www.start.umd.edu/gtd/) and the RAND Database of Worldwide Terrorism Incidents (accessible at: https://www.rand.org/nsrd/projects/terrorism-incidents.html);
2. The datasets used in the WINE pilot, which derive data from the Twitter social media platform, under the terms and conditions applicable to Twitter’s API (available at: https://developer.twitter.com/en/docs/twitter-api);
3. The datasets used in the SOF pilot, which are compiled by the respective partner as a local public authority (and are thus not publicly available), and
4. the datasets used in the CAM pilot, which include data derived from Open Data Camden (accessible at: https://opendata.camden.gov.uk/).
As these datasets are used merely for illustrative purposes in this article—which is of a translational, rather than research, nature—we do not present in this article any relevant findings stemming from these datasets which would merit verification via data availability.
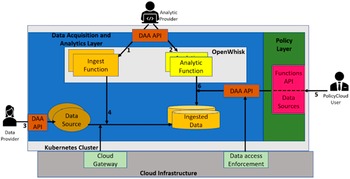
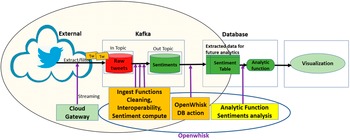
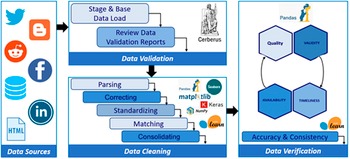
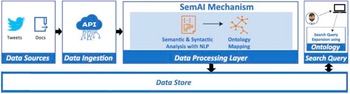
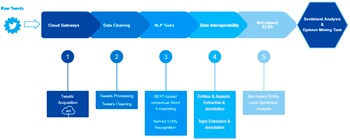
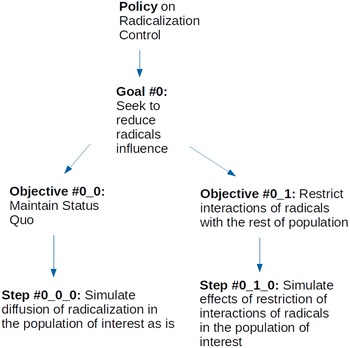
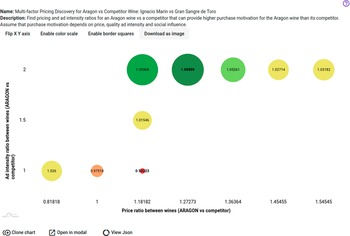
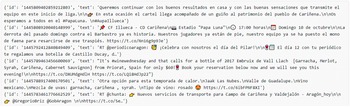


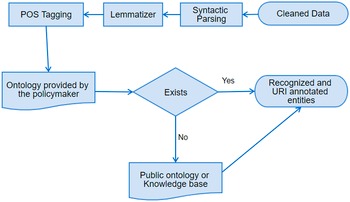
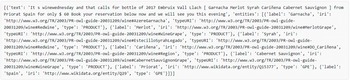
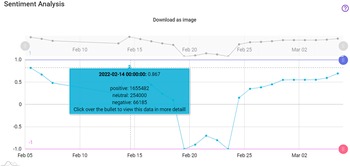
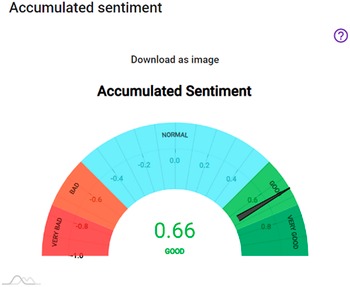
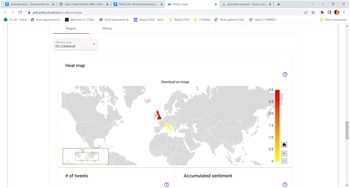

 Open access
Comments
No Comments have been published for this article.