


1. Introduction
With the increasing awareness of sustainability, environmental friendliness and climate protection the need to develop more sustainable and renewable carbon alternatives to fossil-based raw materials has attracted much attention (Kähler et al. Reference Kähler, Carus, Porc and Vom Berg2021). A prominent alternative is biobased composites which are composites created either fully or partly using a biobased matrix or biobased reinforcement materials. Although there have been enormous developments in the field of biobased composites in terms of new polymers, fibres, textiles, synthesis technologies and new product developments, the market introduction of biobased composites that can replace fossil-based materials is still tricky in some cases (Suhaily et al. Reference Suhaily, Jawaid, Abdul Khalil and Ibrahim2012; Sun Reference Sun2018; Manu et al. Reference Manu, Nazmi, Shahri, Emerson and Huber2022). Kainz (Reference Kainz2016) notes several reasons for this lack of acceptance of biopolymers and biocomposites, such as high cost, poor distinguishability from conventional plastics/composites, and confusion about ‘bio’ credentials. Charter & Tischner (Reference Charter and Tischner2017) argued that biocomposites do not possess the aesthetic appeal to succeed in the consumer market. Kurka & Menrad (Reference Kurka and Menrad2009) attributes this lack of acceptance to the poor familiarity of consumers with green composites and products.
To overcome the rather low acceptance of biobased composites seen so far, it is important to establish the mechanism behind material perception. The strategic application of material perception in product design enables designers to ‘program’ emotions into products, making them more appealing to consumers. As per Karana, Hekkert & Kandachar (Reference Karana, Hekkert and Kandachar2009), the way a material is perceived depends on (a) the type of attributed meaning, (b) the type of material, (c) the product in which the material is embodied, (d) how the product is used and (e) the background of the user. These perceptual components could be further explained in detail through various theories of aesthetic appreciation such as Evolutionary Aesthetics (Cosmides & Tooby Reference Cosmides, Tooby, Sternberg and Kaufman2002; Ramachandran Reference Ramachandran2011), the Mechanism of Pleasurable Experiences (Hekkert Reference Hekkert2006) and the Dimension–Lexicon Model proposed by Zuo et al. (Reference Zuo, Hope, Castle and Jones2001). While these concepts explain the desirability aspect of material perception and what constitutes a pleasurable experience, naturality as a perceptual attribute is less well-defined. Karana & Nijkamp (Reference Karana and Nijkamp2014) tried to correlate naturality with attributes such as ‘fibreness’, reflectiveness and roughness of the material, whereas Nakamura, Masuda & Hiramatsu (Reference Nakamura, Masuda and Hiramatsu1994) linked it with pattern anisotropy on the material’s surface. Ashby & Johnson (Reference Ashby and Johnson2003) hypothesise that ‘embedded personality’ is a key element, where the material acquires its visual characteristics due to the natural processes involved in its growth and manipulation (evidence of life).
Combining all these aspects relating to material technology, user experience and perception, the key requirements for designing the ideal biobased composite can be structured into somatic, usability and semiotic requirements (Manu et al. Reference Manu, Nazmi, Shahri, Emerson and Huber2022). Somatic requirements for an ideal green composite include characteristics such as bio-sourced and compostable or recyclable, easily available and sustainable raw material sources, scalable technology to permit decentralised production and manufacturing, and competitive properties and pricing in comparison with fossil-based polymeric materials (Kurka Reference Kurka2012; Kainz Reference Kainz2016; Jayanth et al. Reference Jayanth, Kumar, Nayak, Kumar, Pal and Rajasekar2018; Martina & Oskam Reference Martina and Oskam2021). Usability requirements for such biocomposites consist of an active ‘material experience pattern’ (Giaccardi & Karana Reference Giaccardi and Karana2015), engaging the users and making them co-producers of the material experience. In this case, the material/product characteristics evolve through long-term user interaction, thereby deepening the user-product relationship. Semiotic requirements consist of the material’s unique personality and permanent and natural aesthetics. The material should have evidence of natural life through signs of harmonious inclusions and reactions (grains, knots, shapes) in its appearance, thereby communicating a story. Amongst the above, only semiotic attributes are directly linked with raw materials, as somatic, and usability attributes of the material always evolve in the context of product design.
The classification of perceived attributes for an ideal biobased composite also fits well within components of aesthetic sustainability from prior literature, such as Bateson (Reference Bateson1979), Kagan (Reference Kagan2011) and Harper (Reference Harper2018). Harper argues that aesthetically sustainable objects are those that fulfil a series of specific qualities (harmony, symmetry, minimalism, timelessness, and made of lasting and timeless materials). Harmony and symmetry are substantiated through principles of evolutionary aesthetics, and minimalism in this context may imply abstraction, which is an efficient encoding of complex information in limited sensory signals (Ramachandran Reference Ramachandran2011).
Renoult (Reference Renoult2016) highlights various theories of evolutionary aesthetics and discusses the functional drivers behind these principles. These theories align with the integrated model (IM) proposed by Barkow, Cosmides & Tooby (Reference Barkow, Cosmides and Tooby1992) which proposes that the evolution of aesthetic appreciation and other cognitive features is due to a combination of both cultural and biological mechanisms, aimed at improving our adaptation to the natural world. Bateson (Reference Bateson1979) argues that a strong aesthetic sense derives from a heightened sensitivity to patterns and metapatterns (pattern of patterns) in nature. The ability to sense such metapatterns enables human beings to see beyond differences in sensory stimuli at lower-order patterns and to feel the macro-level connections, providing a sense of aesthetic unity. The correlations between metapatterns and evidence of taxonomic structures are very evident, and hence we can safely assume that metapatterns found in all-natural materials also lead to a ‘beautiful’ visual perception. Such aesthetic experiences can go beyond the scope of physical response to stimuli and intellectual ability, and into a deeper, gratifying experience. This strong link between natural aesthetics and material appreciation or desirability has been termed Biophilia, which is the intrinsic emotional connection of human beings with natural elements (Wilson Reference Wilson1984; Chang et al. Reference Chang, Cheng, Nghiem, Song, Oh, Richards and Carrasco2020). Despite their natural origin, the apparent lack of desirability amongst biobased composites may point towards poor translation of natural aesthetics through material perception.
Another key aspect that influences the adoption of biobased composites is the increasing role of e-commerce and digital marketing in product consumption. With digital media becoming the primary channel for forming material and product impressions, consumers are restricted in terms of physical and tactile sensory signals and have to depend largely on digital-visual inputs to form perception. A digital-visual refers to a digital image or graphic used to represent materials or products and is displayed on a computer screen or other digital devices. Sharan, Rosenholtz & Adelson (Reference Sharan, Rosenholtz and Adelson2009) have argued that human observers can identify and categorise materials from digital images and Fleming, Wiebel & Gegenfurtner (Reference Fleming, Wiebel and Gegenfurtner2013) suggested that material qualities such as hardness and beauty could be perceived fairly closely using digital images. A later study by Tanaka & Horiuchi (Reference Tanaka and Horiuchi2015) revealed that the perceptual qualities decreased while perceiving images of materials.
The reliability of image perception vis-à-vis physical observation is receiving great attention, especially in the context of digital visuals used in critical services such as telemedicine and medical diagnostics (Krupinski Reference Krupinski2010). Likewise, material perception in the context of digital visuals will be key in communicating biomaterial values to consumers in the digital age.
To solve the handicaps faced by biobased composites, it is essential to understand the mechanism of visual perception in these materials, especially in the context of digital visuals. This includes examining underlying components of perception, the impact of visual characteristics on perception and the relationship between visual patterns and semiotic attributes. Identifying the crucial visual and semiotic parameters in the formation of perception is also vital for the development of materials which sustainable.
2. Aims
Like products possessing specific personalities (Carbon Reference Carbon2019), we argue that materials also present a unique set of perceptual qualities to the consumer. This study concentrates on the visual perception of digital-visual imagery to examine its role in forming material perception. The perceptual attributes (digital-visual) under consideration for biobased materials in this study were distinguishability (as natural) and desirability. Within this framework, we aimed to shed some light on the following aspects: (a) do people associate attributes classified under ‘naturality’ and ‘desirability’ while perceiving digital imagery of biobased composites? If yes, which are the key attributes that contribute to biocomposite perception? (b) Is there a correlation between the visual characteristics of biobased composites and their attribution of ‘naturality’ and ‘desirability’? Are there any visual patterns that correlate biocomposite samples with high ratings for ‘naturality’ and ‘desirability’? (c) Is there an effect of demographic variables on biocomposite perception? and (d) Can the selection of polymeric matrix used influence the overall perception of a biobased composite material?
The key significance of this research is that it may help validate the hypothesis about the influence of visual characteristics on the perception of biobased composites. This study also explores the possibility of programming different visual perceptions onto baseline materials through additives and processing. These aspects of the research probe the possibility of having a priori determination of visual perception of materials using this framework and thus creating biocomposites with high distinguishability and desirability. Sikhwal & Childs (Reference Sikhwal and Childs2021) argue that product personalisation will be a necessity of the future and the insights from this research might enable designers and engineers to develop mass-individualised biobased materials for various consumer segments. It is emphasised that the visual perception relationships implied as part of this study are suggested only in the context of digital-visual images.
3. Methodology
3.1. Sample preparation
To create biocomposite samples for digital-visual images, various natural fibre reinforcements and polymeric matrices were used to create eight unique materials. The fibre reinforcements used were wood fibre, regenerated cellulose, coir, sisal, cotton and flax; the polymeric matrices were cellulose, epoxy resin and thermoplastic starch (TPS). This set of materials was selected to represent popular biocomposite categories using a range of random, unidirectional and woven fibres. Three natural materials (Leather, Poplar and Walnut) samples were also used to establish a reference for the visual perception of naturality, which is a core focus of this study.
Wood fibres (WF) were extracted from Pinus radiata wood fibre provided by a local sawmill (Kaiapoi, New Zealand). The average width and length of the WF were 42 ± 14 μm and 1.64 ± 0.7 mm based on the measurement of SEM micrographs. Microcrystalline cellulose was supplied by Sigma Aldrich, dissolved in an ionic liquid was used as a matrix phase for combination with the wood fibre. A detailed methodology is outlined by Huber (Reference Huber2012). TPS was prepared using starch sourced from Shandong Zoneyoung Chemicals, China. Rayon fibre was supplied by Cordenka GmbH (Obernburg, Germany) in the form of a Cordenka 700 yarn, which had a yarn count specified as 1000 and a fibre diameter of 12 μm. This fibre was cut by hand to lengths of approximately 30 mm. The UD flax textile was made from field-retted flax from a longitudinal fibre line of scutched tow and was provided by Sachsen Leinen GmbH (Markkleeberg, Germany). TPS was mixed with water at a 1:6 ratio and heated to 90 °C to form TPS gel, to which various fibres were mixed in manually. Fibre mass fractions are given in Table 1. These were clamped between MDF plates to form biocomposite samples. The epoxy resin used was WEST SYSTEM 105 epoxy resin along with WEST SYSTEM 205 hardener, procured from Adhesive Technologies Ltd., Auckland, NZ. Coir fibre with 30–50 mm in length was sourced in the form of Whites Garden Coconut Fibre. A Sisal fibre fleece was obtained from a Sisal scouring pad from ECOwild and used as-is. Twill-woven cotton (Sweety Twills Fabric) and flax (Zweigart Precut Dublin Linen) were sourced from a local textile store (Lincraft, Christchurch, New Zealand). Epoxy-based composites were moulded between two flat plates of stainless steel and pressed with approximately 0.2 MPa of pressure during curing. Sample thickness varied between 2 and 8 mm. The leather sample was purchased from a local textile store (Tom’s Emporium, Christchurch, NZ). A Black Walnut sample was purchased from a local timber store (Halswell Timber, Christchurch, NZ). The details of various samples (Figure 1) and their composition are given in Table 1.
Table 1. Different material samples used in the study and their composition


Figure 1. Images of biocomposite (1, 2, 4, 5, 7–10) and natural (3, 6, 11) samples used in the study.
3.2. Study design
The semantic differential (SD) method and versions thereof are the most frequently used tool (Veelaert et al. Reference Veelaert, Du Bois, Moons and Karana2020) in the study of sensory attributes in the literature and hence this method was selected for the study. The SD method uses a multipoint scale to collect comparative responses against queries. Instead of values, the SD method employs a scale with Strongly Agree and Strongly Disagree at extreme ends and Neutral in the middle, with the flexibility of adding finer gradations. To define the semantic space for the SD method, a set of adjectives that describes the characteristics of naturality and desirability were shortlisted, and the best-fitting adjectives were selected to form dichotomous pairs. The fitting of attributes under each classification needs careful consideration as many dichotomous pairs are explored in prior literature. It is imperative to choose those bipolar pairs (a) that best suit the objectives of the current study and (b) which have the least ambiguity with regard to their linguistic meaning. Since there is no prior literature available on bipolar pairs for the currently investigated attributes, attributes were drawn from the literature which was considered to have minimum ambiguity in terms of their meaning. No formal definitions of the used terms were provided to the participants, to collect the user’s interpretation of these terms. The pairings were drawn equally from the three major perceptual categories to incorporate the multidimensionality of attribute space (Osgood & Luria Reference Osgood and Luria1954; Trofimova Reference Trofimova2013; Verhagen, Van Den Hooff & Meents Reference Verhagen, Van Den Hooff and Meents2015). The final selection was made based on the appropriateness of adjectives reflected in prior literature on aesthetic theory, natural material perception, and desirability (Bateson Reference Bateson1979; Kleine & Kernan Reference Kleine and Kernan1988; Zuo et al. Reference Zuo, Hope, Castle and Jones2001; van Rompay et al. Reference van Rompay, Hekkert, Saakes and Russo2005; Hekkert Reference Hekkert2006; Ramachandran Reference Ramachandran2011; Giaccardi & Karana Reference Giaccardi and Karana2015; Sauerwein, Karana & Rognoli Reference Sauerwein, Karana and Rognoli2017). Since a large set of bipolar pairs would make the test too long and may result in survey fatigue amongst the respondents, a set of 10 pairs were selected for the study (Table 2).
Table 2. Classification of adjective pairs for the semantic scale based on perceptual characteristics and perceptual categories

Note: Attribute pairs were selected from aOsgood & Suci (Reference Osgood and Suci1955) and bTrofimova (Reference Trofimova2013)
This digital-visual perception study was conducted online through the QUALTRICS XM survey platform from QUALTRICS LLC, North Sydney, Australia (www.qualtrics.com). Photographs (digital-visuals) of the 11 selected biomaterial samples were presented to the participants, one at a time through a digital screen. No physical samples were handed out to participants. The study was conducted anonymously. To avoid demand response, the samples were presented without any hint provided on material composition, thereby eliminating any perceived clues on what the researchers ‘wanted’. The 10 bipolar pairs listed in Table 2 were placed on a SD scale with 5 rating options – Definitely (Left Attribute), Looks Like (Left Attribute), Cannot Say, Looks Like (Right Attribute) and Definitely (Right Attribute). Participants were asked to undertake a visual rating for each material against the 10 dichotomous pairs of attributes. The material images and attribute rating scales were presented randomly to the participants to avoid anchoring.
Approximately half of the participants in this study were recruited from the European Summer School on Bio-based Composites (ESBBC) held during 6–8 July 2021 at FEMTO-ST Institute at the University of Franche-Comté in Besançon, France and can be considered as familiar with the tested materials The remainder of the participants were recruited through social media portals (Twitter, Instagram, Facebook, LinkedIn) and thus cannot be assumed to be familiar with the materials. No rewards were offered for participation. This study included people aged 18 or above only and did not accept subjects with self-reported impaired vision/colour blindness, neurological/psychiatric conditions impairing visual perception or poor proficiency in English. The study recruited 113 participants, including 51 female and 61 male subjects. Their ages ranged from 18 to 70, with a median age of 27, showing a positively skewed distribution (Sk = +1.40). The participants belonged to 29 different nationalities and had educational qualifications ranging from high-school level to doctoral level or above. While 53 respondents were recruited from ESBBC and 60 through social media, 87% of the participants had an education of university graduation or above. Beyond the initial briefing, all participants self-reported the assessments without the opportunity to consult with the research team during the study. The study participants used their screens across multiple device/OS types, and digital images presented for assessment were therefore not adjusted for factors such as screen size, resolution, colour balance or brightness. The median duration of the study per respondent was about 9 minutes.
The median was used to identify the cumulative attribute perception for each material from the responses submitted. This was calculated by the median rating of each material on a 1-to-5 scale converted from the SD scale:
-
(i) a median value of 1 would mean ‘Definitely’ assessed as the left-side adjective on the bipolar scale;
-
(ii) similarly, 5 would mean ‘Definitely’ assessed as the right-side adjective,
-
(iii) whereas a 3 would mean ‘Cannot Say’.
The average ratings against each material–attribute pair were used to rank materials to identify the highest-rated materials and attributes. A frequency matrix of positive responses (Definitely and Looks Like) for each of the 20 attributes was generated with the percentage of positive responses against each attribute. Spearman’s rank correlation coefficient (bivariate correlation, two-tailed) was calculated using IBM SPSS Statistics Version 24 (IBM Corporation, New York) to reveal significant correlations. A scatter plot of significantly correlated attribute pairs created using Microsoft Excel 2019 (Microsoft Corporation, Redmond, WA) was used to correlate visual aesthetics with material perception. The bipolar scales were also simplified into their core attribute or characteristic; for example, the Complex-Ordinary scale could be used to denote complexity, and the Unusual-Ordinary scale may be used to depict the unusualness of the sample. This simplification was used to suggest general guidelines for achieving desired perceptual characteristics.
A nonlinear dimensionality reduction algorithm, t-SNE (t-distributed Stochastic Neighbour Embedding) (van der Maaten & Hinton Reference van der Maaten and Hinton2008), was used to simplify the visualisation of attribute ratings against various material samples. Data from the correlation matrix was fed to ORANGE 3.30 (under GNU General Public License, https://orangedatamining.com/), an open-source data mining and clustering tool to generate t-SNE clustering of raw materials in the attribute space). To examine the effect of the visual characteristics of the samples on the perception assessment, a classification framework was designed (Figure 2). The key visual parameters that form the basis of classification are based on the type of visual patterns (Ordered/Chaotic). This also reveals a categorisation based on the argument made by Humphrey (Reference Humphrey and Mikellides1980) about the ‘rhyming’ of elements in natural experiences. He argues that the ‘rhyming’ of visual elements aids the classification of objects; hence such experiences are pleasurable. This may provide a perceptual compromise in terms of order–disorder, complexity-simplicity, or novelty-familiarity. We could not identify a classification framework for visual aesthetics from prior literature, presumably due to the complexity of having a single framework for all the materials. However, the visual characteristic of biocomposites could be classified, as it is governed primarily by the aesthetic characteristic of the fibres and matrices. It is noted that both naturality and desirability are closely related to the visual rhyme or patterning of the material (Bateson Reference Bateson1979; Smith Reference Smith and Mikellides1980; Wilson Reference Wilson1984; Kellert, Heerwagen & Mador Reference Kellert, Heerwagen and Mador2008). The material samples could be thus classified based on their visual pattern or the level of visual order. We designated the two key visual elements of the materials as A and B (matrix and reinforcement in the case of biobased composites), and the arrangement of these elements forms a chain with a random, rhymic or rhythmic arrangement.

Figure 2. Classification framework for biobased composites based on visual order.
4. Results and discussion
From the data collected, we analysed correlations between various attributes using spearman’s rank correlation method. This helped us to identify the strong correlations and closely-linked attributes. We have used the t-SNE methodology to reduce dimensions so that materials with similar perceptual assessments could be clustered together. The performance of materials under each attribute scale is also explored.
4.1. Attribute–attribute correlations
The rating frequencies of Definitely and Looks Like were added up to find the positive assessments towards each attribute, leaving both these assessments with equal weight. This reveals the fraction of favourable perceptions towards each attribute (Table S2 in the Supplementary Material). A correlation matrix was generated through Spearman’s Rank Correlation Method and significant attribute–attribute correlations, both positive and negative, were recorded. It is noted that the perception of materials with more extreme ratings (Definitely on either extreme on the scale) is not well-represented by this method. A correlation with weighted extreme ratings may be able to reflect this aspect more clearly; hence a correlation matrix with weighted ratings (Looks Like = 1, Definitely = 2) was compared against the unweighted data. The results remain similar with the same number of significant correlations (50) and more than 90% of the significant correlations remain the same in both cases (Tables S3 and S4 in the Supplementary Material). The weighting of ordinal data may lead to its treatment as a linear scale (Stevens Reference Stevens1946; Lawless & Heymann Reference Lawless and Heymann2010) which may not be appropriate in this case. Since the correlations are very similar amongst weighted and unweighted calculations, only unweighted correlations are considered for this publication.
Amongst these 50 significant correlations (p < 0.05, df = 18), 10 correlations are inverse relationships between bipolar attribute pairs in each rating scale, thus confirming that the adjective selection for scales was appropriate. When these are excluded, a set of 40 significant attribute–attribute correlations remain (Table 3). Positive correlations indicate that a high rating for one attribute results in a high rating for the correlated attribute as well. In contrast, negative correlations indicate inversely proportional relationships amongst attribute ratings (such as would be expected within a given dichotomous pair).
Table 3. Correlated attribute pairs along with their spearman’s rank correlation coefficient (⍴) which are statistically significant (p < 0.05, df = 18)

Figure 3 visualises these significant attribute relations, clarifying the links between attributes. This figure also excludes relations between bipolar adjectives, all of which were negative, as expected. This visualisation reveals the general grouping of attributes into two clusters: one along Complexity-Interesting-Unusual-Naturality and the other along Beauty-Value-Surface Texture. These may point towards the principal components of semantic design for biobased composites, and the possibility of combining attributes in this adjective group.

Figure 3. Statistically significant correlations amongst various attributes. The green lines indicate significant positive correlations, and the red lines denote significant negative correlations. Higher line weights of correlations indicate stronger correlations and vice versa. The node sizes are proportional to the number of significant correlations related to each attribute, and the node colours indicate closely related attribute clusters.
The attributes with the greatest number of significant correlations with other attributes were Artificial (7), Smooth (6), Unusual (6), Ordinary (6), Complex (6), Simple (6) and Boring (6) (Table S5 in the Supplementary Material). The least correlated attributes were: Aged (0), New (0), Hot (1) and Cold (1). Hot–Cold displayed the highest perceptual uncertainty, with 42% of participants registering Cannot Say. The Valuable-Worthless scale has 32% uncertainty in responses, followed by Aged-New with 31%. These high percentages of Cannot Say responses may be due to a lack of visual cues in material samples linking them with these attributes. Likewise, this may be an indicator that participants considered these samples to be attributed to both adjectives equally. The neutral responses may hold different meanings for different participants (McCroskey, Prichard & Arnold Reference McCroskey, Prichard and Arnold1968). This study considered ranking responses only (and not the rationale for those rankings); accordingly, these ‘cannot say’ responses are not analysed within this study.
By combining the significant correlations (both positive and negative) from the attribute scales above, a few general inferences may be established for the digital-visual perception of biocomposites (Table 4). This is achieved by combining correlating attributes with their bipolar adjectives, revealing relationships between attribute scales; for example, correlations such as Complex-Unusual, Simple-Ordinary, Complex-Ordinary, and Simple-Unusual all point to a positive correlation between Complex-Simple and Unusual-Ordinary scales. This reveals high-level attribute relationships which may point to certain rules of biocomposite perception (Figure S1 in the Supplementary Material).
Table 4. High-level perceptual relationships are achieved by combining multiple attribute correlations

Materials with high levels of complexity generated an emotion of unfamiliarity and attracted users’ attention. This relationship between complexity and novelty is expected (Berlyne Reference Berlyne1970) as is the case of novelty and interestingness (Hekkert Reference Hekkert2014). The correlation could be expressed as:
 $$ \mathrm{Complexity}\hskip0.35em \propto \hskip0.35em \mathrm{Unusualness}\hskip0.35em \propto \hskip0.35em \mathrm{Interesting}. $$
While high complexity generated visual interest, complexity without an underlying metapattern or visual ‘rhyme’ (Humphrey Reference Humphrey and Mikellides1980) did not result in the perception of beauty. In the absence of visual patterns to relate, a smooth material aesthetic would be considered desirable. Another aspect is the influence of minimalism, as described by Harper (Reference Harper2018), as a condition for sustainable aesthetics. This study found no significant correlation between the beauty and visual simplicity of the samples, while it revealed a correlation with tactile simplicity or perceived smoothness of the sample. It may be assumed that tactile minimalism is a valid requirement for the perception of beauty to the extent that the experience should be cognitively simple. Smoothness also leads to a better visual perception of strength, presumably due to the lack of tactile aberrations on the material. The perceptions of beauty and strength combined form the value assessment of materials, as expressed below:
 $$ \mathrm{Smoothness}\hskip0.35em \propto \hskip0.35em \mathrm{Strength}\hskip0.35em \propto \hskip0.35em \mathrm{Beauty}\hskip0.35em \propto \hskip0.35em \mathrm{Worth}. $$
Samples with a simple or plain appearance were associated with artificiality, likely due to the absence of patterns that are present within natural materials. Like grains on wood and layers in stone, natural materials often leave evidence of growth, which is missing in artificial materials. Materials with little or no pattern, such as Poplar might also fall into this perceptual category. Though plain interfaces are considered boring, their relative visual purity leads to higher strength perception:
 $$ \mathrm{Simplicity}\hskip0.35em \propto \hskip0.35em \mathrm{Artificiality}\hskip0.35em \propto \hskip0.35em \mathrm{Strength}\hskip0.35em \propto \hskip0.35em \mathrm{Ordinary}\hskip0.35em \propto \hskip0.35em \mathrm{Boring}. $$
The presence of visual indicators such as fibres and complex patterns contributes to visual roughness and is correlated with the visual perception of naturality. While the presence of natural materials like fibres provides a direct relationship, visual complexity resulting from chaotic fibre alignment may also contribute to the perception of naturality (Soddu Reference Soddu2001):
 $$ \mathrm{Naturality}\hskip0.35em \propto \hskip0.35em \mathrm{Roughness}. $$
Though the presence of roughness imparts naturality, chaotic visual elements and sample roughness are likely to cause poor overall aesthetic appreciation and thus reduce the overall desirability of the material sample.
4.2. Clustering of materials
A t-SNE algorithm was used to reduce the dimensions of attribute space to two dimensions (t-SNE-x and t-SNE-y) and to generate clustering of raw materials, uncovering distinct clusters amongst the 11 materials used in this study (Figure 4). An analysis by the k-means method also reveals the same clustering (Figure S2 in the Supplementary Material).
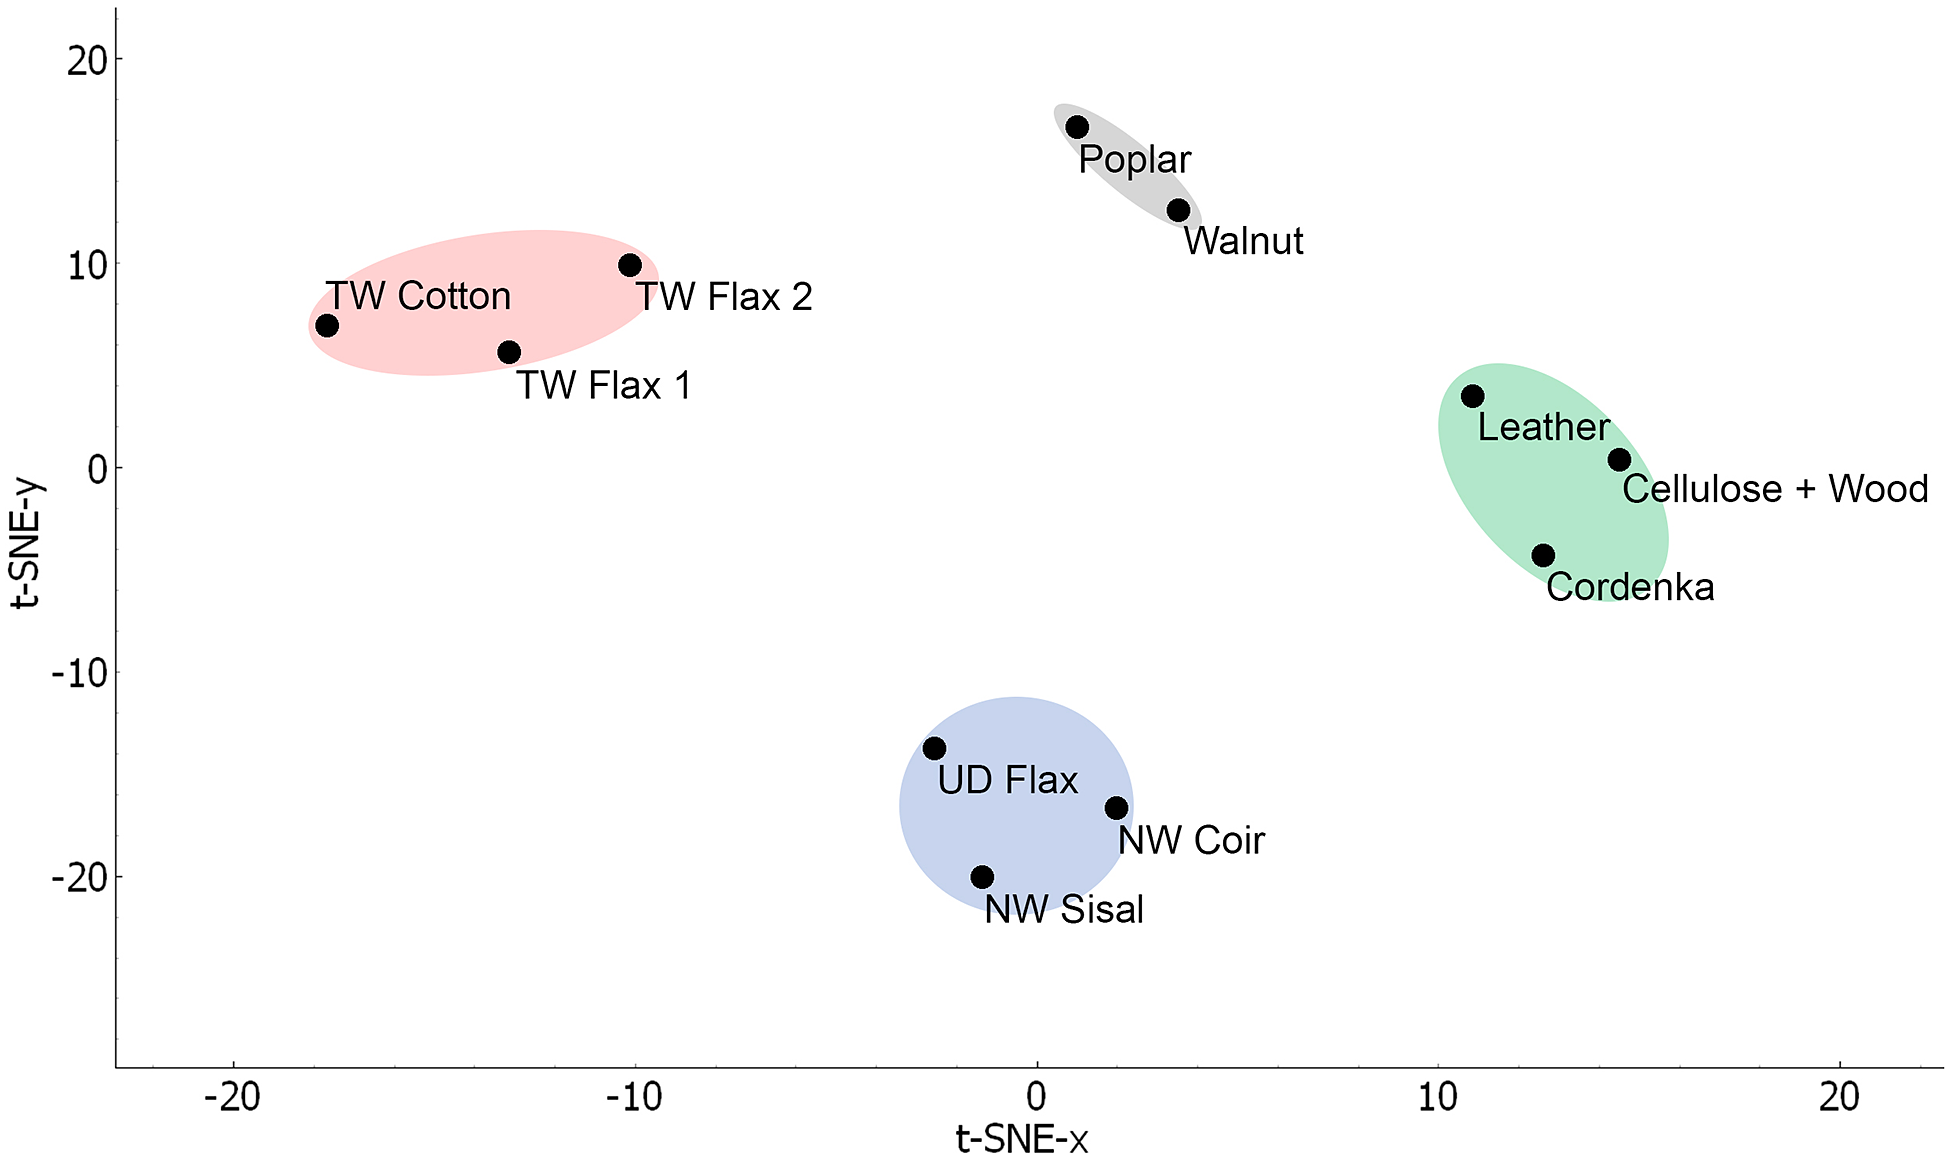
Figure 4. Clustering of material samples using t-SNE algorithm using ORANGE.
This clustering reveals the grouping of materials into four distinct clusters: (a) Poplar and Walnut, (b) Leather, Cellulose + Wood and Cordenka, (c) NW Sisal, NW Coir and UD Flax and (d) TW Flax 1, TW Flax 2 and TW Cotton. When compared against the visual classification framework designed for biobased composites (Figure 2), this clustering reveals relationships amongst cluster elements in terms of visual characteristics. While the samples on the left side of the scale are random, the samples in the middle are rhymic, with grains providing some order in leather and wood samples and the horizontal weave in the case of UD Flax. In the case of the right extremity of the scale, the biocomposites have twill-woven reinforcement, giving a very ordered and rhythmic structure to the pattern. The rhyming nature of the samples in the middle may create an ‘organised complexity’, leading to higher aesthetic preference. Such organised complexity and its preference are more evident in natural materials possessing fractal patterns (Lavdas, Schirpke & Schirpke Reference Lavdas, Schirpke and Schirpke2020). Using this visual categorisation framework of materials, these clusters could also be seen fitting into the chaos-order axis of material patterns in Figure 5. Where Cluster 1 (Leather, Cellulose + Wood and Cordenka) has a highly chaotic visual appearance, Cluster 4 (TW Flax 1, TW Flax 2 and TW Cotton) falls in the highly ordered end of the spectrum, owing to the twill-weave of the reinforcing fibres in the composites. While two materials in Cluster 2 (NW Cotton and NW Sisal) fall into the chaotic region due to the disordered fibres in the product, the third material, UD Flax falls under the rhymic region due to the presence of wefts and unidirectional fibres in it. Cluster 3, consisting of both wood samples (Poplar and Walnut), also falls in the rhymic region, owing to the wood grains providing the rhyme to the material pattern.

Figure 5. Clustering of materials based on their visual order and comparison with t-SNE clusters.
4.3. Attribute–material correlations
The median attribute assessment for each material was used to establish a material’s identity towards each attribute and vice versa. The nonwoven coir-based composite was assessed as ‘Definitely Natural’ and ‘Definitely Rough’, while the unidirectional flax composite was rated ‘Definitely Natural’. This high rating for naturality may be due to the strong visual presence of natural fibres in the materials. While all materials looked Natural, none had affirmative median ratings (Looks Like/Definitely) for Hot, Boring, Artificial, Worthless, Weak or Cold. The neutral rating for these adjectives (other than Hot and Cold) could be explained by the fact that all their polar adjectives were strongly rated, revealing the perceptual homogeneity of the samples used. Pertinently, all three noncomposite natural materials (Walnut, Poplar and Leather) were rated ‘Beautiful’ while only Cellulose + Wood composite was rated so amongst the biocomposites. This may point to the ability of participants to observe metapatterns as discussed earlier. The ranking of various materials against these attributes helps to reveal comparative data, that is, the highest-rated material in each attribute category (Table 5). NW Coir scored the highest rating on the ‘Natural’ scale, followed by UD Flax, likely due to their distinct fibrous appearance. Natural materials, such as Walnut and Leather were the highest-rated materials in the ‘Beautiful’ rating, presumably due to the effect of evolutionary aesthetics and biophilia. Cellulose + Wood was rated most Complex, Unusual and Interesting, while Walnut was rated as most Beautiful, Valuable and Hot among the 11 material samples. There was uncertainty in perceiving either attribute in some materials and the materials with the highest percentage of ‘Cannot Say’ ratings were Cellulose + Wood (26%), NW Sisal (24%) and Poplar (24%) (Table S1 in the Supplementary Material).
Table 5. Materials and their rankings against individual attributes
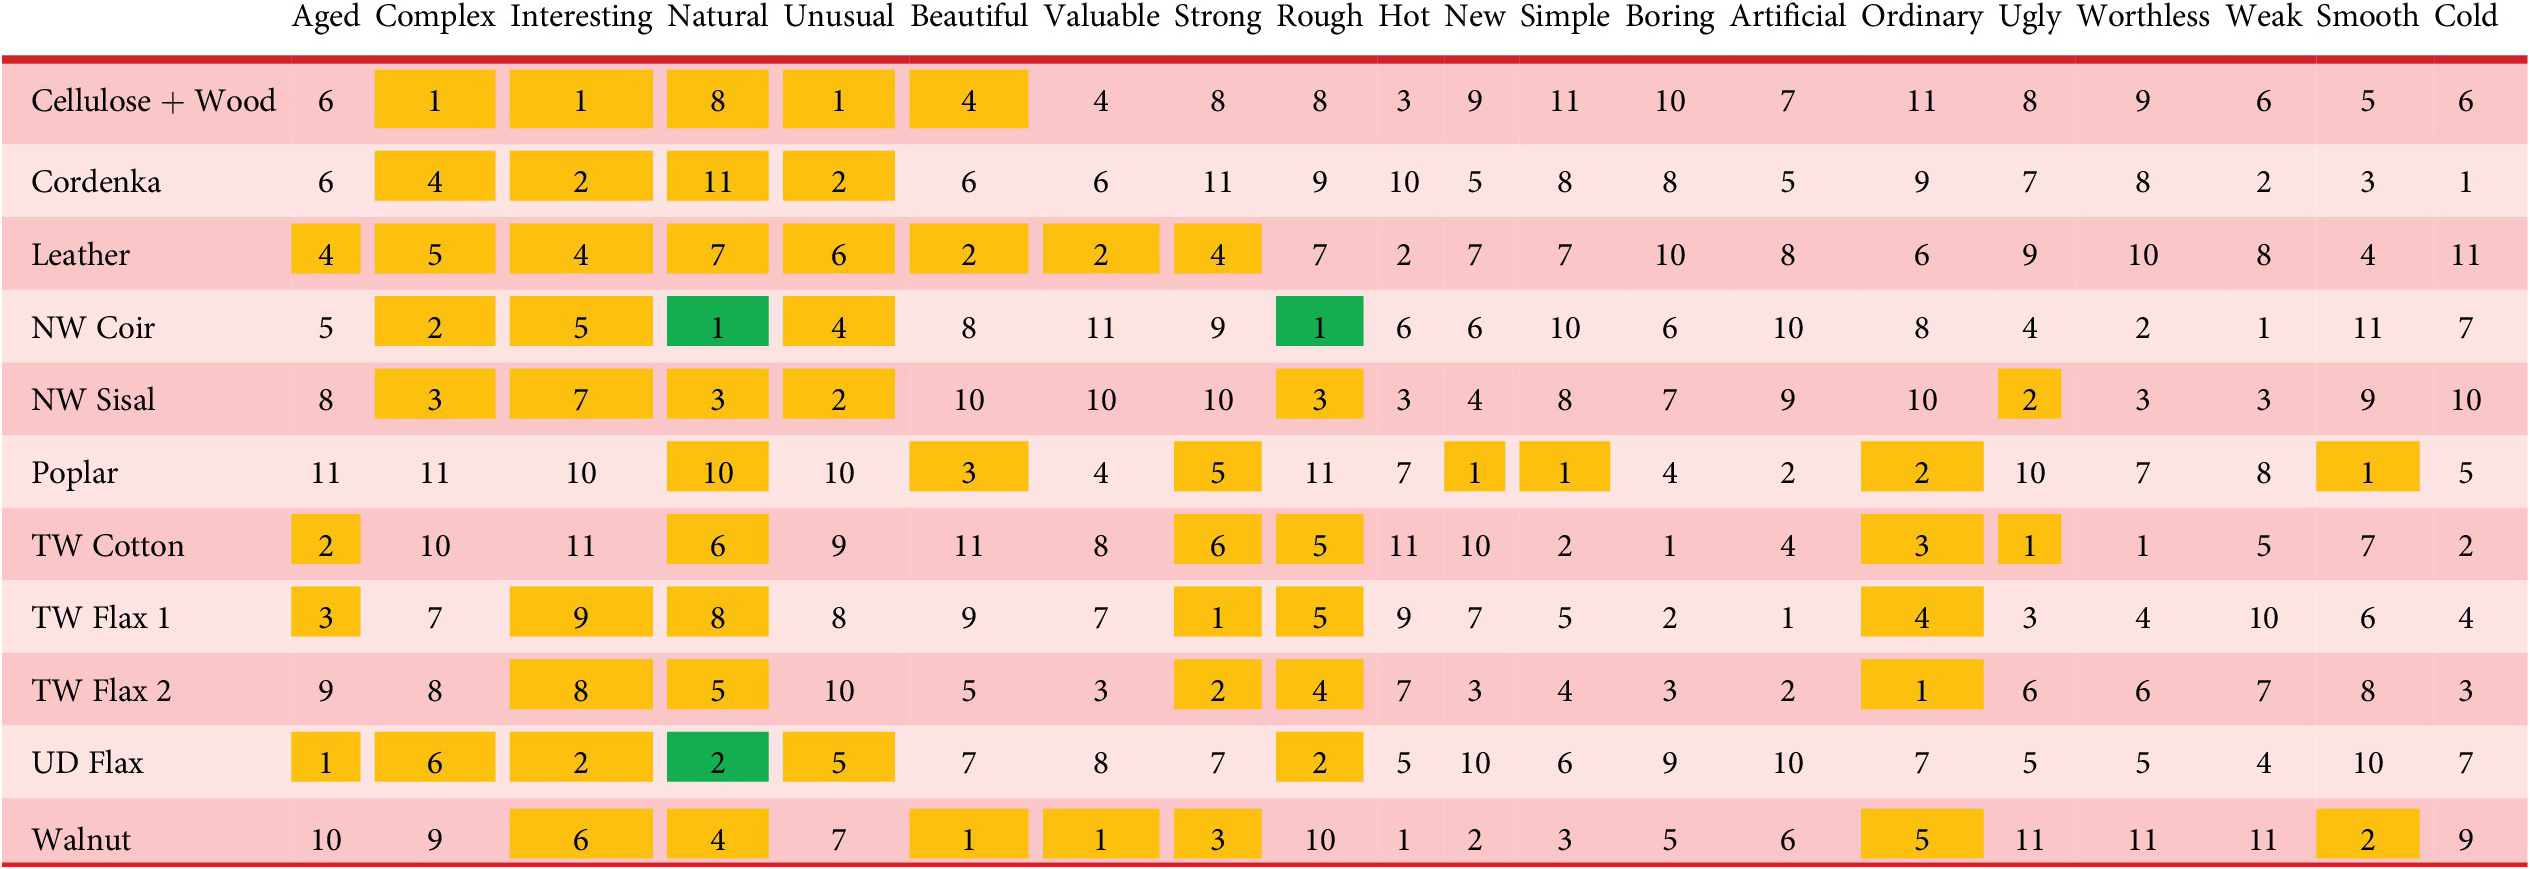
Note: Each cell displays the ranking of the material against each attribute. Yellow cells denote materials with a median rating of ‘Looks Like’; Green cells denote materials with a median rating of ‘Definitely.’
Comparing the bipolar attribute pair ratings of various materials and their correlations (refer to Table S3 in the Supplementary Material) with other attribute pairs uncovers the following relationships.
Ageing
Samples perceived to be highly aged-looking like UD Flax and TW Cotton had visual imperfections/irregularities in their surface pattern. Plain surfaces with no imperfections such as Poplar correlated with stronger assessments of Newness. Materials with highly chaotic and organic patterns (Cordenka, Cellulose + Wood, NW Coir, Leather and NW Sisal) may be able to hide their visual imperfections better but are visually complex which might be resulting in more neutral ratings. With no significant correlation for both Aged and New, this bipolar adjective pair has also shown significant uncertainty (31% Cannot Say) in responses. The concept of graceful ageing and patina correlating with beauty as found in the literature (Rognoli & Karana Reference Rognoli and Karana2013) has not been observed in this class of materials. This might point to the argument made by Lilley et al. (Reference Lilley, Smalley, Bridgens, Wilson and Balasundaram2016) that aesthetic appreciation due to ageing varies widely for different materials. This might also be due to the absence of visual characteristics signifying ageing in natural materials.
Complexity
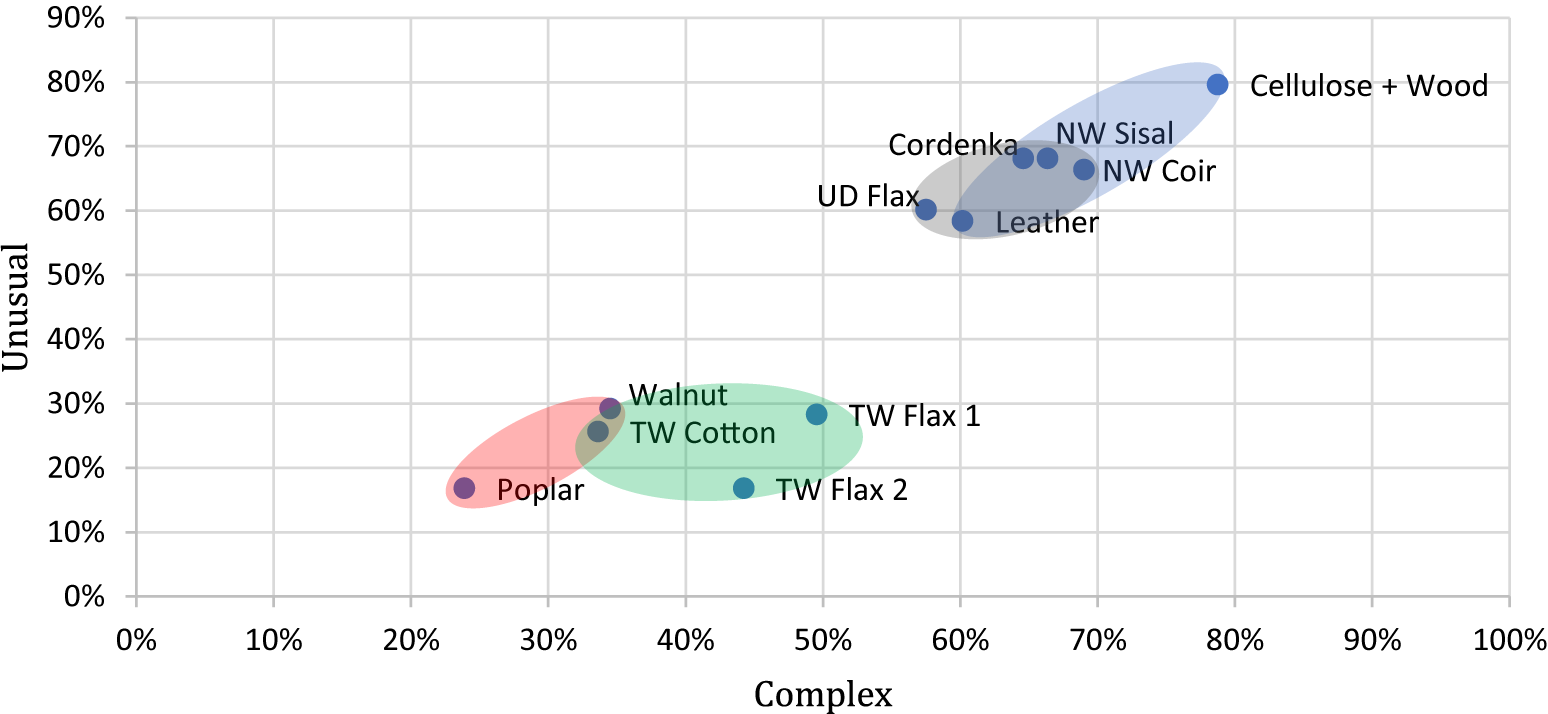
Biobased composite based on ‘nonwoven’ (fleece or needle felt) and organically blended composites (Cellulose + Wood, NW Coir, NW Sisal, Cordenka) and materials in clusters 1 and 2 (Figure 5) led to higher ratings of Complexity. This cluster of samples (top right in Figure 6) with high visual complexity, derived from the relatively chaotic nature evident in Figure 5, may have contributed to the strong positive correlation with Unusual. Though the unusualness of visuals is not strictly dependent on complexity, complex stimuli have been proven to be more potent in enhancing novelty attributes (Berlyne Reference Berlyne1970). This visual complexity and uniqueness may also be the reason for the high correlation with the Interesting–Boring scale as well (Tables 3 and 4), likely due to the cognitive effort required to decipher the complex visual elements. The absence of complex patterns that are integral to natural aesthetics has led subjects to correlate Simple with Artificial, as evidenced by the high artificial assessment for Poplar. These findings align with Soddu (Reference Soddu2001), who argues that uniqueness, complexity and naturality correlated with one another. At the same time, this visual complexity might make it difficult for the user to assess the structural integrity of the material, thus affecting the visual perception of strength. This might explain why the Simple attribute correlates positively (⍴ = 0.633) with Strong, which leads to relatively higher strength perception for clusters 3 and 4 seen at the bottom left of Figure 6.

Figure 6. Percentage of favourable ratings (Looks Like and Definitely) for complex–unusual.
Interestingness
As in the case of the Complex–Simple scale, materials with organic patterns score highly in interestingness. The key factor influencing this perception seems to be the complexity factor of the visual features as evidenced by the strong correlation with the Complex–Simple scale. This is clear in materials where visual features are plain or which have nonnatural aspects such as weaves or geometric patterns (Figure 7). This finding follows the observations made by Aitken (Reference Aitken1974) that higher levels of visual complexity correlated with higher interestingness. This attribute also has a strong correlation with uniqueness (Boring–Ordinary, ⍴ = 0.752) as well as the perceived temperature of the material (Boring–Hot, ⍴ = −0.606) (Table 3). A highly interesting biobased composite will have complex yet organically ordered patterns or surface features. The organically complex nature of the material also imparts an Unusual perception.
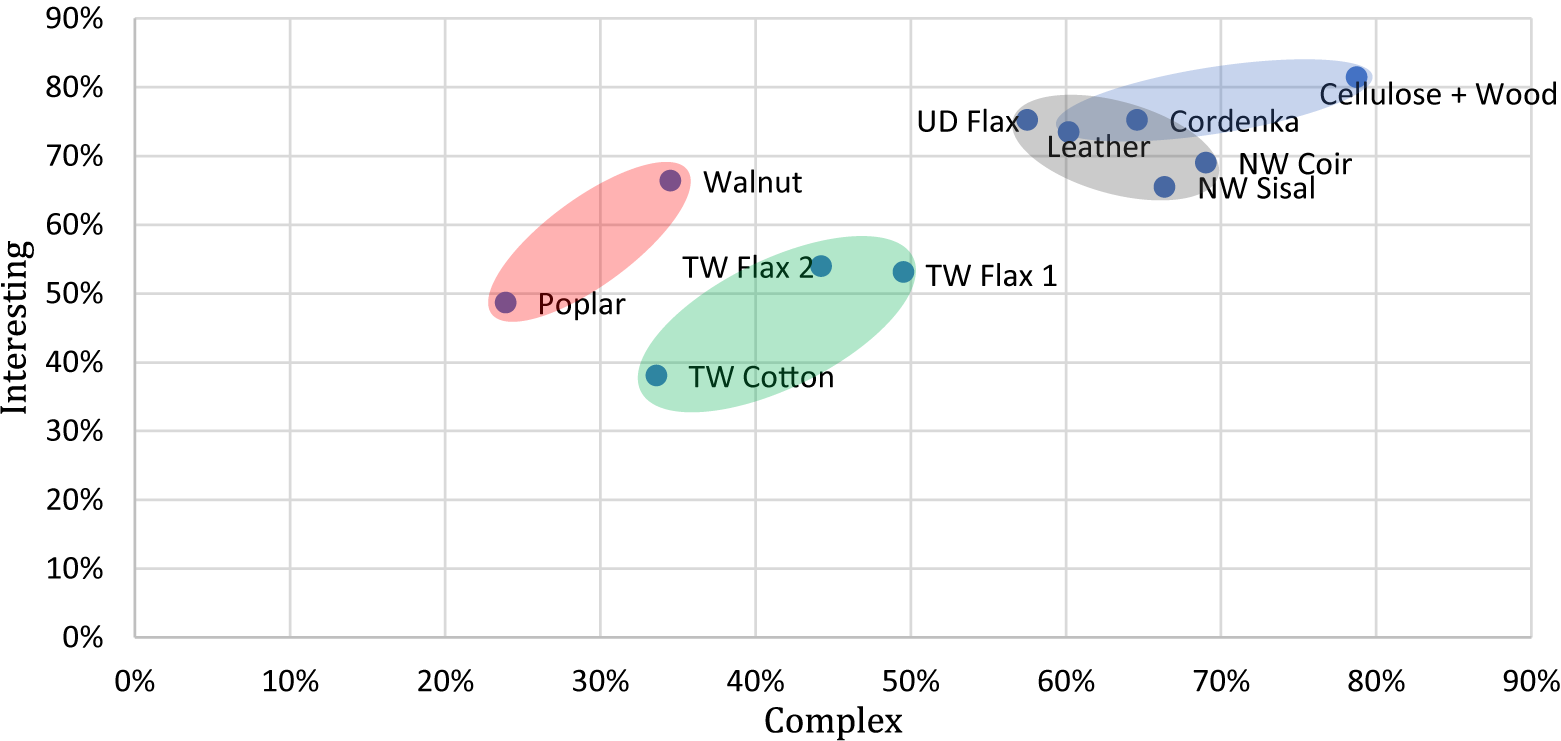
Figure 7. Percentage of favourable ratings (Looks Like and Definitely) for complex–interesting.
Naturality
The natural perception was most influenced by the presence of visual markers such as fibres, as was evident in the top three materials (NW Coir, UD Flax, NW Sisal). Interestingly, one of the three natural material samples presented in the study, Poplar, was adjudged as the least natural-looking material. This might be attributed to the plain, patternless surface of the material, with no significant visual markers. This contradicts the observation of Sharan et al. (Reference Sharan, Rosenholtz and Adelson2009) who noted that people can differentiate between natural and artificial materials with ease. This discrepancy may be due to the presence of visually detail-rich natural materials amongst biobased composites, which affects the viewer’s sensitivity to material assessment. Natural also strongly correlated positively with Rough and negatively with Smooth, as a visible and distinguishable fibre presence also pointed towards a higher visual perception of roughness (Figure 8). This has been documented by Sauerwein et al. (Reference Sauerwein, Karana and Rognoli2017), who noted that visible fibres are important in the perception of naturality. They also note that when there is a contrast between the visual and tactile responses (very visible fibres and rough to look at, but smooth to touch), such materials are considered more beautiful and favoured in design. This scale also revealed a significant correlation of Artificial with Boring, Simple and Ordinary (Table 3) and inversely with their bipolar pairs, strengthening the grounds for the influence of distinguishable and visual characteristics on material perception. Materials with noticeable fibre presence or other natural markers may get perceived as more natural, while materials with no or moderate markers (ex: shorter and thinner fibres) may be perceived as Smooth and Artificial. An aberration to this is the case of wood samples. Though Poplar and Walnut had the least roughness among the samples, they were rated relatively higher on the naturality scale. Despite the absence of strong fibreness in samples, this perception may be due to the recognition of metapatterns in natural materials, as suggested by Bateson (Reference Bateson1979).

Figure 8. Percentage of favourable ratings (Looks Like and Definitely) for natural–rough.
Unusualness
This scale has a strong positive correlation with the Interesting–Boring scale (Unusual–Interesting, ⍴ = 0.799), where the presence of organic and complex patterns leads to higher ratings. In the case of Unusual, more organic and chaotic patterns (as in Cellulose + Wood and Cordenka) may have prompted a higher rating. Due to the unique visual appearance of Unusual materials, they also have a strong positive correlation to the Complex attribute and negatively to Artificial. As with Complexity, it may be difficult to assess the material qualities and hence Unusual materials are also strongly negatively correlated to Strong. Unusual perception is achieved by randomness and complexity of appearances, leading to more interesting features. However, the visual complexity may also make it difficult to assess physical attributes like strength and hence may provide a perception of weakness. The relationship between Unusual–Ordinary and Interesting–Boring scales deserves a closer examination (Figure 9). Despite the assertation of unusualness leading to desirability in the literature, there seems to be no clear consensus, as novelty and familiarity may not be contradictory in the context of aesthetics, and conditions such as high familiarity, high novelty or a balanced combination, all may lead to positive aesthetic appreciation (Hekkert, Snelders & Van Wieringen Reference Hekkert, Snelders and Van Wieringen2003; Menninghaus et al. Reference Menninghaus, Wagner, Wassiliwizky, Schindler, Hanich, Jacobsen and Koelsch2019). The samples used in this study exhibited a strong positive correlation between Unusual and Interesting (⍴ = 0.799, α < 0.01). This may indicate that random patterns and high complexity may lead to higher aesthetic appreciation when compared with highly ordered or plain material surfaces.

Figure 9. Percentage of favourable ratings (Looks Like and Definitely) for unusual – interesting.
Beauty
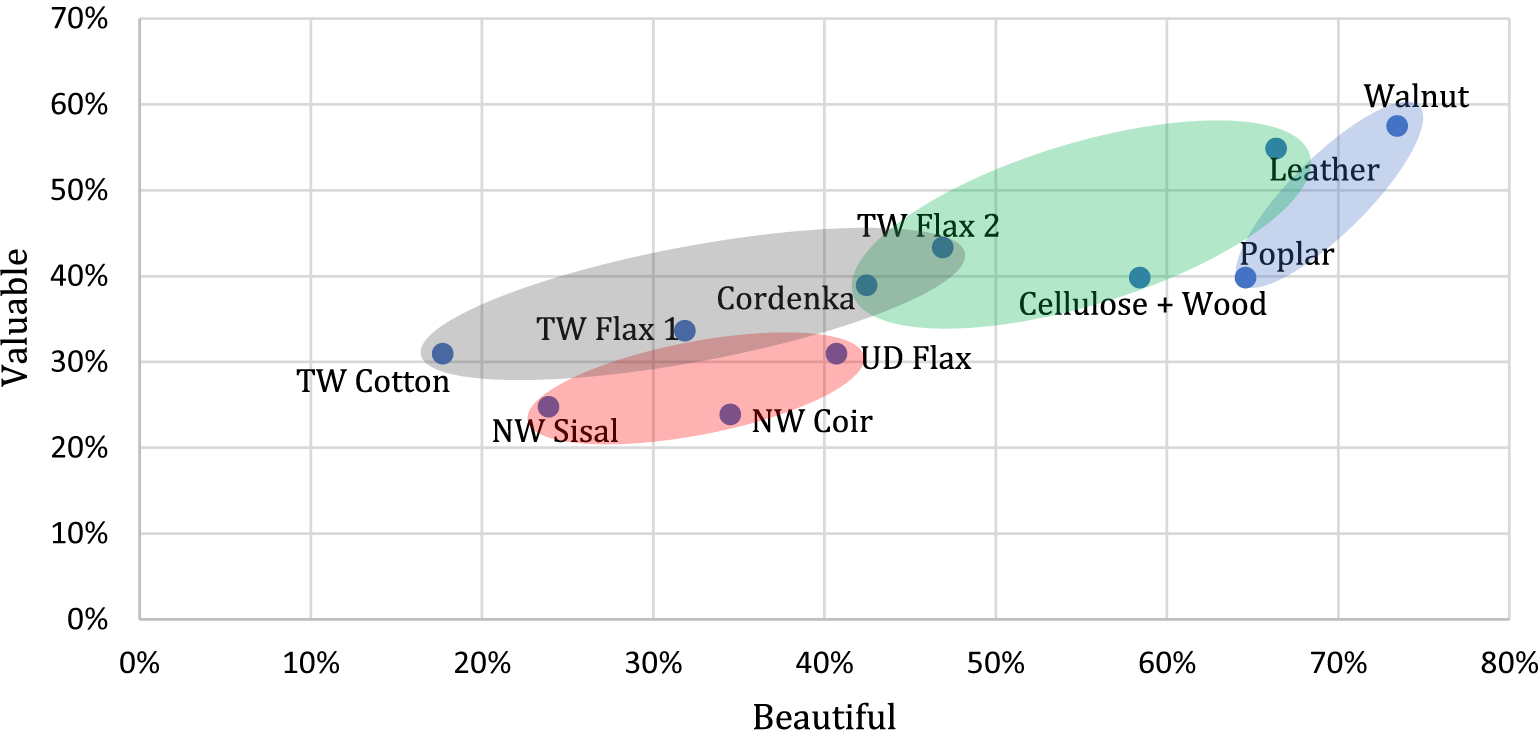
The respondents rated the three natural materials (Walnut, Leather and Poplar) in the top three positions for the Beautiful attribute. It is interesting to note that there was no significant correlation observed between Beautiful and Natural. This greater aesthetic appreciation towards natural materials without realising them to be natural may be caused by the instinctual sensitivity to natural patterns (Bateson Reference Bateson1979). Also, while naturalness was strongly correlated with roughness, the Beautiful rating of samples correlated with Smooth. Beautiful ratings for materials were also strongly associated with Valuable ratings (Figure 10), uncovering the value addition we place in beautiful objects, beyond functionality. Hence, for a sample to be Natural and Beautiful, a toned-down surface appearance with finer surface features or organic patterns (as in leather) may help, while too chaotic visual features, even using contrasting natural fibres, might make it look unpleasant (Ugly).

Figure 10. Percentage of favourable ratings (Looks Like and Definitely) for beautiful–valuable.
Another interesting finding was the apparent lack of correlation between Beautiful and Complex (⍴ = −0.14, refer to Table S3 in the Supplementary Material). It has been widely speculated that the visual perception of beauty is diminished for very low and very high complexity, with the peak beauty at medium complexity, exhibiting an inverted U-curve or Wundt Curve (Birkhoff Reference Birkhoff1933; Berlyne Reference Berlyne1971; Jacobsen et al. Reference Jacobsen, Schubotz, Höfel and Cramon2006). However, this study found no evidence of such a relationship. This may be because the earlier studies were based on man-made objects and artworks, and hence unable to explain the complex aesthetic influences in natural materials (Wu Reference Wu2015). Volkelt (Reference Volkelt1910) argued that there is a distinction in beauty between man-made and natural aesthetics by citing the example of a groomed flower garden and a flowering jungle. Hence aesthetics (beauty) in natural materials may not be linked solely to complexity, but to an array of factors, including complexity.
Worth
This scale strongly correlates with the Beautiful–Ugly scale with top ratings awarded for Walnut & Leather. This supports the prior literature observing that beautiful objects are valued more by consumers (Hassenzahl Reference Hassenzahl, Schifferstein and Hekkert2008; Christensen, Kristensen & Reberb Reference Christensen, Kristensen and Reberb2015). However, the perceived value of material samples is not just influenced by beauty (Beautiful) but also by functional components such as strength and surface finish. This is evident by the significant negative correlation of Valuable versus attributes such as Weak and Rough. Materials perceived smoother generally show higher perceptual valuation (Figure 11). This may suggest that while a certain level of visual complexity is good, an underlying organic pattern is essential to prevent jarring features and to provide visual and tactile harmony.

Figure 11. Percentage of favourable ratings (Looks Like and Definitely) for valuable–smooth.
Strength
Complex, disordered visual features result in a poor visual perception of strength, and materials with simpler attributes (Simple, Ordinary, Smooth) are perceived to be stronger. This correlation of inconsistency in visual features with poor strength is evident in other cases, such as the visual grading of timber (Piter, Zerbino & Blaß Reference Piter, Zerbino and Blaß2004) and other natural materials (Ersboll & Conradsen Reference Ersboll and Conradsen1993). It is also seen that materials with woven fibre reinforcement (twill-weave fibres in this study) are perceived to be stronger. To some extent, this may be due to the professional/educational background and materials’ knowledge of the participants, as 87% of the participants had a degree or higher qualification. The presence of technical features like weaves enhances the perception of strength, but they lose out on beauty and naturalness. Materials leveraging Natural perception along with finer surface details and ordered patterns, which are cognitively simpler, can provide a better perception of strength.
Smoothness
Material samples with obvious and conspicuous details like grains or fibres contribute to the Rough rating of materials, and though such materials are rated more natural, this reduces their ratings in perceived beauty and value (Figure 12). This holds not only for fibre-reinforced materials (NW Coir, NW Sisal) but also for ordered/woven fibre-based composites (UD Flax, TW Flax). A higher yarn count in reinforcing fabric may provide higher material strength without reducing Smooth perception and in turn, keeping their beauty and value intact. While using either woven or nonwoven textile reinforcements for biobased composites, fine fibres, higher yarn count, and subtle features can impart the perception of smoothness in materials, which are correlated with beauty, value and strength.

Figure 12. Percentage of favourable ratings (Looks Like and Definitely) for rough–beautiful.
Temperature
The scale indicating the perceived temperature of the sample, Hot–Cold, also shows high levels of uncertainty in responses (42%), along with only one significant correlation each. Hot was correlated with Boring and Cold with Artificial. The lack of significant correlations and high levels of response uncertainty provides little insight into this attribute pair.
4.4. Defining naturality and desirability in biobased composites
All the eight biocomposite samples used in this study were rated Natural, with a median assessment of ‘Looks Like’ or ‘Definitely’. While the study participants might have correctly identified the natural ingredients in these materials, the rating for pure-natural materials like wood and leather was below natural fibre-reinforced biocomposites for naturality. This may be because participants found it difficult to precisely identify the level/extent of naturalness from visual cues. To identify the baseline at which material perception shifts from ‘natural’ to ‘artificial’, another study with various levels of fibre reinforcements may be required. This benchmark would be specific for the types of matrices, and fibre used as different types of components (for ex: thicker/longer fibres) can elicit different perceptions. Another reason could be the cognitive processing of visual information and rating materials with highly contrasting natural elements, such as fibres, as more natural. It is also observed that ‘natural’ highly correlates with ‘rough’ perception, influenced by distinguishable fibres. This, however, negatively impacts beauty; it has been observed that high friction results in poor pleasantness and finer surface texture cause materials to be perceived as less natural (Harris et al. Reference Harris, Collier, Skedung and Rutland2021). Hence a balance of naturality in terms of visible fibres may be required to achieve biobased composites that are both Desirable and Natural.
Based on correlations from Table 4, it could be argued that Desirability in the context of biobased composites/materials is perceived through the value assessment of the materials. This relationship could be broken down into the following attribute analogues:
 $$ \mathrm{Desirable}=\mathrm{Beautiful}+\mathrm{Valuable}+\mathrm{Strong}. $$
Beautiful materials were found to have a (cognitively) simpler appearance. While chaotic textures were undesirable, complex visual appearance was helpful, if they were presented in an organically patterned manner (as we see in many natural materials). A simpler appearance was also found to have helped participants perceive strength, as a uniform and smooth surface appearance was a guarantee of quality (or lesser chances of uncertainty). As with many social transactions, biobased materials with good emotional perception (Beautiful) and good functional perception (Strong) were perceived as valuable. This might point to not using thick or disordered fibres, like in fleeces or felts, which are visually prominent as fibre reinforcement in composites. A thinner/shorter fibre should fare better as desirable. Further, the possibility of organic patterns in fibre reinforcement would also improve their perception. The preference for fibre reinforcement is as follows:
 $$ \leftarrow \mathrm{Ugly}\hskip0.72em \left|\hskip0.36em \mathrm{Non}\hbox{-} \mathrm{woven}<\mathrm{Woven}<\mathrm{Organic}\ \mathrm{patterns}\hskip0.48em \right|\hskip0.96em \mathrm{Beautiful}\to . $$
Various theories on natural aesthetics and desirability, such as Unique personality, Wabi-Sabi Aesthetics and Graceful Ageing were examined in this study through their bipolar attribute analogues such as Unusual -Ordinary, Interesting–Boring and Aged–New. While uniqueness had a high correlation with aesthetics, high uniqueness, as seen in chaotic textures of ‘nonwovens’ led to poor material perception. When materials possessed some level of visual order (such as harmonious organic patterns), a better material perception was achieved. Hence, being purely complex and unique is detrimental, but when combined with some order such as natural patterns, attractive materials can be created. For creating ‘natural’ and ‘beautiful’ materials, this order of patterns should be similar to organic, natural patterns and possess goodness of configuration under Gestalt principles. Though graceful ageing was found to contribute to desirability (Lilley et al. Reference Lilley, Smalley, Bridgens, Wilson and Balasundaram2016), the results from the study were inconclusive as there were no significantly correlating attributes with the Aged-New scale. Here again, it might be better to consider the influence of ageing only in the context of product experience and not in a standalone material. Hence, a material patina developed through personal use creates emotional attachment, but ageing without personal meaning may depreciate perceptual value.
4.5. Effect of age, gender and familiarity
Trofimova (Reference Trofimova1999, Reference Trofimova2013) hypothesised differences in meaning attribution amongst genders, especially that men preferred novelty while women preferred familiarity. In this study, however, all attributes delivered significant positive correlations (p-value < 0.01) between material attribute ratings of female and male participants, pointing to no significant effect of gender in biocomposite perception (Table S6 in the Supplementary Material).
To study the effect of age, respondents were divided at the median age (27) to form two groups: Young (≤27) and Old (>27). Trofimova (Reference Trofimova1999) observed relatively negative assessments of semantic factors by respondents in the 18–33 age group when compared with younger (<18) and older (>33) respondents. However, this study revealed that attributes delivered significant positive correlations (p-value < 0.05) between various material attribute ratings of young and old participants, barring Artificial and Cold (Table S7 in the Supplementary Material). However, both these attributes present positive correlations, and their significance values are very close to the chosen significance level (α = 0.05) with a negligible difference (Δα < 0.002). Considering the sampling used in this study, we may assume that there is no significant effect of age on digital-visual perception. Further studies using distinctly young (age < 30), and old (age > 60) populations might bring better clarity to this matter.
Since 53 out of 113 respondents were recruited from ESBBC, they could be deemed as technically familiar and competent with biobased composites. It was examined whether this relatively high level of familiarity with biobased composites has skewed the perception of the respondents in any manner. Amongst the 10 attribute pairs, all attributes presented positive correlations between ESBBC participants and general participants (Table S8 in the Supplementary Material). The correlations of all attributes other than Valuable (⍴ = 0.469, p-value = 0.146) and Worthless (⍴ = 0.543, p-value = 0.085) were statistically significant as well. Notably, the biggest differences in perceptual assessment occurred in the cases of twill-woven fibre composites, pointing to the possible effect of technical familiarity. While 68% of ESBBC participants rated TW Flax 2 as Valuable, only 22% in the general group did so. Beyond this influence, the general trend points towards the fact that there was no major influence of technical familiarity in material perception in this study.
4.6. Effect of polymer matrix type
While the presence of fibres has a clear impact on visual perception, the effect of polymeric matrix type is unknown. Beyond natural materials (three samples), the following polymeric matrices were used in various samples used in this study: cellulose (one sample), TPS (three samples) and epoxy resin (four samples). While comparing the relative performance of TPS samples versus epoxy resin samples, patterns emerged only in the case of three attributes. All TPS samples were rated higher on the Beautiful scale than epoxy samples, and all TPS samples were rated less Ugly and Worthless in comparison with epoxy samples. However, when checked for significance using the k-means clustering method, TPS and epoxy samples were grouped in a single cluster compared to natural samples. In short, there was no significant aesthetic advantage in material perception for either natural or synthetic composite matrices in the absence of visual differentiators.
5. Conclusion
The key objective of this study was to understand and identify factors that contribute to desirable and distinguishable perceptual attributes in biobased composites, especially in the context of digital-visuals. These attributes address the perceptual handicaps (aesthetics and identity) of biobased composites and solving these handicaps may lead to wider adoption and acceptance of these sustainable materials (Manu et al. Reference Manu, Nazmi, Shahri, Emerson and Huber2022). The goal of this research is to establish the relationships between digital-visual characteristics of the biocomposites with two perceptual qualities (naturality and desirability). While this study deals with perceptual attributes as variables, the objective of the study is not to quantify each attribute, but to identify relationships. This accommodates the individual variations in adjective/attribute perceptions and combines the unique-but-similar assessments into general trends of material perception.
Though the visual presence of biological elements like natural fibres was expected to create a natural perception at the logical level, this study was to find out if the same effect happens at the perceptual level. Similarly, natural materials possess high desirability due to the evolutionary aesthetic mechanisms in human beings; but did this perception translate into biocomposites made from natural materials? The results of this study show that there are factors beyond the presence of natural materials within a composite and that perceptual assessments related to desirability and naturality are heavily influenced by the pattern and surface aesthetics of the material.
A visual order-based categorisation of biobased composites was applied within this study, revealing four distinct clusters of materials. This framework may be useful to help define the visual characteristics required to achieve specific perceptions in future material development. The material cluster presenting the highest rating for the desired attribute(s) could be used as a reference, and the visual attribute-material cluster relations be used to obtain the desired outcome. Adding more materials beyond the 11 materials in this study could create a robust reference framework for visual characteristic-material-attribute relationships.
While exploring demographic influences, a significant correlation amongst all attributes has been observed in digital-visual perception based on gender, pointing to perceptual homogeneity. In the case of age-based analysis, all attributes presented significant correlations, barring Artificial and Cold with p-values very close to statistical significance. A similar outcome was observed for technically-familiar and ‘general’ populations in the study showing significant correlations for all attributes, barring a nonsignificant but positive correlation for the Valuable-Worthless scale. Since all attribute correlations were positive, we can assume that there is no significant difference in perception based on age and technical familiarity, as is the case for gender.
Overall, it can be concluded that visual aspects such as the presence of fibres and the apparent complexity of the material can contribute significantly to the perception of that material being natural. Rhymic patterns led to the perception of greater beauty. Seemingly ‘simple’ materials (materials with minimal surface variation, patternation, or features) were generally perceived to be stronger, which also improved the valuation of these materials. There was no significant effect of age, gender, or nature of the polymer matrix on the visual perception of the biocomposites in this study.
Combined, the key visual aspects that may provide a natural and desirable material perception may be that:
-
(i) Biobased composites should have a visually distinct fibre presence to signal natural origins; however, this should be subtle in visual impacts, such as finer or low-diameter fibres.
-
(ii) Some type of patterning is crucial, with organic patterns preferred over geometric patterns.
-
(iii) Fibre patterns should have complexity, but not limit this complexity to ensure cognitive comprehension.
Designers and manufacturers are continuously looking to adjust their practices to meet their ethical aims and ever-increasing consumer awareness surrounding sustainability and eco-friendliness. Whilst this study does not attempt to consider the design, manufacture, or context of finished products, the findings of this study can help to create better-biobased composites at the material level. This would ultimately increase the chances of wider adoption of these materials in products of the future.
Supplementary Materials
To view supplementary material for this article, please visit http://doi.org/10.1017/dsj.2023.5.
Financial support
This research received no specific grant from any funding agency, commercial or not-for-profit sectors.


 Open access