


1. Introduction
The open-source hardware (OSH) phenomenon is described and distinguished from proprietary hardware by two main constituents. First is the application of an alternative mode of knowledge production and management – best exemplified by open-source software (OSS) – in the material realm (Shirky Reference Shirky, Feller, Fitzgerald, Hissam and Lakhani2005; Balka, Raasch, & Herstatt Reference Balka, Raasch and Herstatt2009; Raasch, Herstatt, & Balka Reference Raasch, Herstatt and Balka2009; Li et al. Reference Li, Seering, Ramos, Yang and Robert2017; Boujut Reference Boujut2019). And second – partly fuelled by the first – is the still-emerging distributed manufacturing paradigm that has resulted from the maturation and affordability of digital fabrication technologies (Kostakis et al. Reference Kostakis, Niaros, Dafermos and Bauwens2015; Pearce Reference Pearce2015).
The OSH phenomenon can be defined and its degree of openness evaluated following a number of published approaches (Bonvoisin & Mies Reference Bonvoisin and Mies2018; Gavras Reference Gavras2019; Bonvoisin et al. Reference Bonvoisin, Molloy, Haeuer and Wenzel2020; Open Source Hardware Association 2020). However, OSH is distinct from other schemas that, by definition, feature limited openness. For instance, in open-architecture products, certain parts of the platform and all basic functions are closed and proprietary, while certain less crucial interfaces are open for add-ons from third parties (Koren et al. Reference Koren, Hu, Gu and Shpitalni2013).
While the application of modularity in the OSH practice is common (see Bonarini et al. Reference Bonarini, Matteucci, Migliavacca and Rizzi2014; Kostakis & Papachristou Reference Kostakis and Papachristou2014; WikiHouse 2018a; OpenStructures 2019), theoretical approaches are recent and limited (see Gavras Reference Gavras2019; Kostakis Reference Kostakis2019; Bonvoisin et al. Reference Bonvoisin, Molloy, Haeuer and Wenzel2020). Conversely, the OSS literature concerning modularity dates back to the 1970s (Parnas Reference Parnas1972). Also, the corresponding literature on proprietary hardware is vast (see the literature review by Bonvoisin et al. Reference Bonvoisin, Halstenberg, Buchert and Stark2016) and well-established (Starr Reference Starr1965).
For instance, modularity has been the object of extended research in the automotive industry (Johnson & Broms Reference Johnson and Broms2000; Fellini et al. Reference Fellini, Kokkolaras, Michelena, Papalambros, Perez-Duarte, Saitou and Fenyes2004; Pandremenos et al. Reference Pandremenos, Paralikas, Salonitis and Chryssolouris2008; Cabigiosu, Zirpoli, & Camuffo Reference Cabigiosu, Zirpoli and Camuffo2013; Albers et al. Reference Albers, Bursac, Scherer, Birk, Powelske and Muschik2019), as well as the aircraft (Frigant & Talbot Reference Frigant and Talbot2005), computer hardware (Baldwin & Clark Reference Baldwin and Clark2000) and prefabrication industries (Halman, Voordijk, & Reymen Reference Halman, Voordijk and Reymen2008). Modularity bears the cross-industry benefit of cost reduction due to economies of scale (Fixson Reference Fixson2007; Hackl et al. Reference Hackl, Krause, Otto, Windheim, Moon, Bursac and Lachmayer2019). Ulrich (Reference Ulrich, Dasu and Eastman1994) highlights the ease of reverse-engineering as a negative effect of modularity. Sanchez & Mahoney (Reference Sanchez and Mahoney1996) argue that, following a modular product design approach, authority is exercised during the design of product architecture before component design development occurs. However, the approach and context of modularity in proprietary hardware often contrasts with basic constituents of the open-source model. In the open-source model, organisation and authority is bottom-up (Ball & Lewis Reference Ball and Lewis2018) as most of the tasks are self-selected by contributors (Boisseau, Omhover, & Bouchard Reference Boisseau, Omhover and Bouchard2018), and ‘copying’ technical knowledge is a common practice associated with overall positive impact (Raymond Reference Raymond2000). Moreover, economies of scale are incompatible with the idea of localised manufacturing (Kostakis et al. Reference Kostakis, Niaros, Dafermos and Bauwens2015).
The distinction between the open-source and proprietary realms has been evaluated in the OSS literature; MacCormack, Baldwin, & Rusnak (Reference MacCormack, Baldwin and Rusnak2012) paired open-source and proprietary software of similar size and function, showing that the code of OSS is more modular by a factor of six. MacCormack, Baldwin, & Rusnak’s (Reference MacCormack, Baldwin and Rusnak2012) finding echoes the ‘mirroring hypothesis’, according to which product architecture and organisation architecture are dual in structure. Baldwin & Clark (Reference Baldwin and Clark2002): 5, Baldwin & Clark Reference Baldwin and Clark2006) articulate the importance of modularity as a structural constituent of the open-source model, in terms of both product and organisational architecture:
(i) ‘Modularity makes complexity manageable’ through the decomposition of a complex task into simpler tasks, and the selection of optimal solutions from a pool of interchangeable options;
(ii) ‘Modularity enables parallel work’ through the division of a monolithic system into numerous independent modules and
(iii) ‘Modularity is tolerant of uncertainty’. Certain elements of code structure can be swiftly altered at any time and in potentially unforeseen ways.
This article argues that modularity is applicable to various elements and aspects of OSH production; from (co)designing and (co)manufacturing to using hardware. However, our focus is not on how modularity is created, but rather on how modularity within the OSH realm may manifest as a design practice, an organisational principle/property or, sometimes, as both. We thus aim to map, assess, and classify the different types of modularity in OSH.
This article is organised as follows: Section 2 describes the research approach and method. Section 3 discusses qualitative and quantitative definitions of modularity. Section 4 outlines five main types of modularity and Section 5 quantitatively assesses those types, drawing from the selected cases. Section 6 discusses the results of the research and highlights its limitations. Section 7 presents the gist of the current paper and proposes future directions for research and practice.
2. Research design
2.1. Research scope
We discuss modularity in the OSH framework by:
(i) Articulating a generic, qualitative and quantitative definition of modularity from the literature. The aim is to describe modularity irrespective of the subject (e.g., hardware,Footnote 1 community), size or industry (aircraft, automotive or building).
(ii) Tracing a comprehensive modularity typology based on cases and literature, with an emphasis on the less-explored, intangible side of OSH.
(iii) Quantifying the modularity levels of the selected cases to provide preliminary evidence regarding, first, the relation of respective or alternative modularity types between cases, and, second, the relation among modularity types concerning the ‘mirroring hypothesis’ within cases.
2.2. Research significance
The present research is primarily useful in addressing a gap in the OSH literature regarding conceptualisations of modularity. Some of the existing definitions of modularity are specific to a certain subject or industry and are thus unhelpful in terms of a wider understanding of the phenomenon. For example, Emanuel, Wardoyo, & Istiyanto (Reference Emanuel, Wardoyo and Istiyanto2011) present a definition that is exclusively software-specific; Salvador (Reference Salvador2007) conceptualises product family modularity in a way that is only partially extendable to the single product; Braha & Bar-Yam (Reference Braha and Bar-Yam2007) conflate modularity with other properties. Additionally, most quantitative modularity studies adopt comparative methods concerning software or proprietary hardware. Comparative methods are useful, but arguably inadequate for evaluating OSH thoroughly. Consider a structure that is more modular by a factor of six compared to another: both might be almost nonmodular on an absolute scale. Therefore, absolute measures of modularity are also indispensable in practice and research.
However, any quantification method is meaningless without a guide on the actual subjects and types of modularity. To the authors’ knowledge, existing OSH literature does not cover the classification and assessment of modularity types. Consequently, our ambition is to set common ground for future research required in order to understand an unexplored dimension of OSH.
2.3. Research methods
Το address the research goals, two methods were used. Regarding the qualitative aspects of our goals, hybrid instrumental-collective case study research was employed (Stake Reference Stake1995). Case selection was based on the authors’ strategy and background, and excluded mechanical and electronic devices. In-depth analysis of a less represented OSH subset may offer advances of cross-disciplinary importance (Papalambros Reference Papalambros2015). The first case is OpenStructures (2020), a community of industrial designers making furniture, as well as other hardware; and the second is WikiHouse (2020), a community for open-source housing. In terms of the age and volume of designed hardware, both projects are two of the most mature cases in the described OSH subset. The first case represents conventional design through standard computer aided design (CAD) systems, and the second exemplifies a growing trend of design by coding. Data were collected from project websites and secondary sources and databases. Direct interpretation (Stake Reference Stake1995) was used to process data and to extract new meanings concerning the cases.
For the quantitative aspect of the research, tools and methods from network science were employed to approach a quantification method. The algorithm for modularity analysis proposed by Blondel et al. (Reference Blondel, Guillaume, Lambiotte and Lefebvre2008) was used in the GephiFootnote 2 software. Data collection was performed manually from the project’s website in the case of OpenStructures, and through a custom script made by the authors in the case of WikiHouse. In the interpretation of the quantitative results, an axiomatic principle was held that a more modular hardware, ceteris paribus, is a more open hardware, in analogy with the relevant literature on OSS. However, modularity and openness in corporate environments are also associated with product imitations and negative effect on financial turnover (Ulrich Reference Ulrich, Dasu and Eastman1994; Fixson & Park Reference Fixson and Park2008).
3. Modularity in the OSH
This section focusses on the criticisms and the emphases of different viewpoints on modularity. The Section 3.1 articulates generic qualitative definitions of modularity. The second Section 3.2 explores generic quantitative definitions.
3.1. Qualitative definition
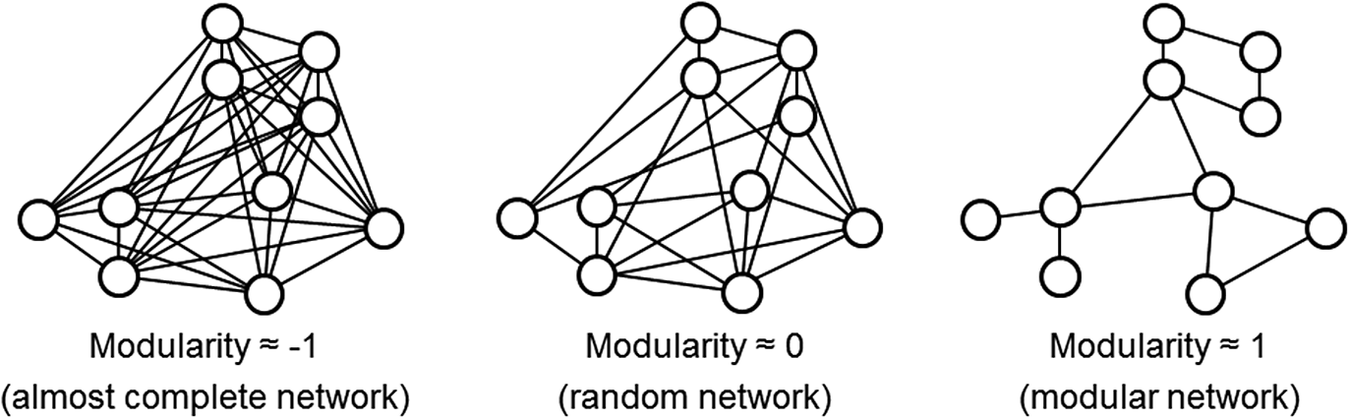
According to Persson & Åhlström (Reference Persson and Åhlström2006), the term ‘degree of modularity’ describes the degree of coupling among different modules in a product. Consequently, in the case that every module can couple with any other module in the system, the product is highly modular. But the highly coupled product is also highly monolithic, no matter how many parts comprise the product (Figure 1, left). If the concept of modularity is limited to the simple division of the whole into parts, it could be inferred that hardware, broadly speaking, has always been modular (Brusoni & Prencipe Reference Brusoni and Prencipe2001). Yet, on the contrary, modularity in OSS does not simply refer to the division but also to the quality of the division (Raymond Reference Raymond2000). However, even this definition is imprecise and incomplete, as more than one of the existing network metrics (e.g., modularity index, clustering coefficient, density, centrality and degree distribution) refers to qualitative aspects of the division or coupling of a structure, leading to ambiguity in terminology.
Left: High degree of coupling within a monolithic structure.Footnote 3 Right: High clustering coefficient within a monolithic structure.  $ \mathrm{C}=\frac{\mathrm{actual}\ \mathrm{closed}\ \mathrm{triangles}}{\mathrm{possible}\ \mathrm{closed}\ \mathrm{triangles}} $ (Colors signify actual closed triangles per the black-filled node).Footnote 4

For example, the common use of the qualitative terms ‘loosely coupled’ and ‘tightly coupled’ to describe modular and nonmodular networks, either organisations or products, is imprecise. Technically, the misconception is expressed by the association of modularity with the clustering coefficient (see Braha & Bar-Yam Reference Braha and Bar-Yam2007). This is a metric concerning a specific qualitative dimension of coupling. ‘Clustering coefficient [0–1]’ expresses the incidence of closed triangles among the nodes of a network. A clustering coefficient value of zero is the equivalent of an unconnected network, whereas the value of 1 stands for a completely connected network (Figure 1, right). Obviously, neither value corresponds to a modular network, which may lie anywhere between the extreme values. Clustering is an important metric concerning network cohesiveness, but cohesiveness is not directly related to the property of modularity. Nevertheless, the clustering coefficient has been associated with certain participatory properties of OSH collaborative networks (Bonvoisin et al. Reference Bonvoisin, Buchert, Preidel and Stark2018).
Product design literature (Ulrich Reference Ulrich1995; Erens & Verhulst Reference Erens and Verhulst1997) offers a more focused definition with the following: 100% modularity in design means that one function is allocated to one single module, while 0% means that all functions are allocated to different modules. However, this definition misses two important aspects: extendability beyond products and multi-level organisation. When mapping the modularity of a collaborative network, the function-based definition is obsolete, apart from the special case that the collaborative network is a perfect ‘mirroring’ of the product functions. However, even in product design, function discretisation is neither always applicable (Ulrich & Seering Reference Ulrich and Seering1990), nor the sole known modularisation principle (Bonvoisin et al. Reference Bonvoisin, Halstenberg, Buchert and Stark2016). Secondly, in real-world cases, modularisation is rarely a single-level organisational process. Modules can be nested in other modules, and so on: a function internally and recursively contains other functions, coupled in a modular way. The power of nested modularisation beyond OSS is exemplified in the parable of Hora and Tempus (Simon Reference Simon1962).
Another example of an over-specialised modularity definition is Salvador’s (Reference Salvador2007) definition for product families, which is built upon the concepts of commonality (common parts), separability (separable parts) and combinability (reconfigurable parts). According to Salvador, the unit of reference is the product family, but despite that, some of these concepts are also fully or partially transferable to the single product. However, the concepts of commonality and combinability do not transfer clearly to the modularity definition of the collaborative network.
Modularity is thus a specific quality of coupling among the components of a system, whether for hardware or people. Outlining a definition at the intersection of several realms, modular structure – as simulated by nodes and edges – features a certain discretisation into modules, characterised by higher internal connectivity among module nodes, rather than external connectivity among modules (Baldwin & Clark Reference Baldwin and Clark2000; Newman & Girvan Reference Newman and Girvan2004; Blondel et al. Reference Blondel, Guillaume, Lambiotte and Lefebvre2008; Jung & Simpson Reference Jung and Simpson2016). Connectivity is more than the mere sum of connections (edges), as outlined in the following quantitative approach.
3.2. Modularity metrics
Various methods to assess modularity exist (Guo & Gershenson Reference Guo and Gershenson2003), but none are universally accepted. Most methods are based on the design structure matrix (DSM), which is an analytical tool used to simulate the structure of complex systems (Steward Reference Steward1981; Eppinger et al. Reference Eppinger, Whitney, Smith and Gebala1994; Sharman, Yassine, & Carlile Reference Sharman, Yassine and Carlile2002; Sosa, Eppinger, & Rowles Reference Sosa, Eppinger and Rowles2004; Sosa, Eppinger, & Rowles Reference Sosa, Eppinger and Rowles2007; MacCormack, Baldwin, & Rusnak Reference MacCormack, Baldwin and Rusnak2012). Modularity metrics based on DSMs have been the subject of extensive research (Huang & Kusiak Reference Huang and Kusiak1998; Newcomb, Bras, & Rosen Reference Newcomb, Bras and Rosen1998; Sosa, Eppinger, & Rowles Reference Sosa, Eppinger and Rowles2000; Guo & Gershenson Reference Guo and Gershenson2004; Hölttä-Otto & de Weck Reference Hölttä-Otto and de Weck2007; Yu, Yassine, & Goldberg Reference Yu, Yassine and Goldberg2007; Hölttä-Otto et al. Reference Hölttä-Otto, Chiriac, Lysy and Suh2012). According to Baldwin, MacCormack, & Rusnak (Reference Baldwin, MacCormack and Rusnak2014), modularity methods based on DSMs are superior to network-based methods. The main advantage of DSM-based methods is the analysis of directed connections among nodes.
Baldwin, MacCormack, & Rusnak’s (Reference Baldwin, MacCormack and Rusnak2014) assumption is that technical systems are always directed. However, in the case of a spatial attachment interface between hardware modules, the cumulative dependency between modules is bidirectional and, by extension, undirected. Asikoglu (Reference Asikoglu2012) analysed a set of electro-mechanical household products and concluded that 85% of them were composed of directly contacting interfaces. Moreover, our cases feature exclusively spatial attachments, which are not common within either electronic or mechanical OSH subsets. Therefore, the advantage of DSMs over network-based methods is less important in hardware, and specifically in the examined OSH subset.
Collaborative networks, as for social networks in general, are undirected structures. Designer ‘A’ cannot collaborate with designer ‘B’ without the reverse being true. To extend the argument, even in software, when function ‘B’ is dependent on function ‘A’, if the dependent function is radically modified, the independent one will also have to be modified. Conversely, any modification in any function, whether dependent or independent, does not automatically transfer to any other function if the interface remains intact. Hence, the directionality of DSM-based analysis methods is meaningless in the described context.
Besides directionality, Milev, Muegge, & Weiss (Reference Milev, Muegge, Weiss, Boldyreff, Crowston, Lundell and Wasserman2009) and Jung & Simpson (Reference Jung and Simpson2016) have recognised different but important limitations in various DSM-based metrics. Notable cumulative limitations of the DSM-based metrics (Table 1) include the following:
(i) Modularity levels are dependent on the size of the analysed object, narrowing comparative evaluation to structures of equal size and precluding analysis of a single project in chronological order.
(ii) The absence of fixed value boundaries results in indeterminacy about what is modular in absolute terms.
(iii) The modelling of the interface is over-simplistic (Binary DSMs). Most DSM modularity metrics are based on a binary state of connection between elements which may be connected or unconnected. However, in real-world hardware, most interfaces are more complicated and feature connections of varying dependency. Beyond hardware, collaborative networks are shaped with connections of surprisingly variable weight (Bonvoisin et al. Reference Bonvoisin, Buchert, Preidel and Stark2018). The assumption that neither pair of developers has collaborated more than once in an OSS project, for example, is extremely flattening.
(iv) Calculation of modifiability instead of modularity. The propagation cost method emphasises dependency among all the nodes of the entire network rather than network-discrete architecture. While modifiability is one of the products of modularity, the inverse is not always true.
(v) Calculation of single module modularity rather than that of the entire architecture.
Limitations of DSM-based modularity metrics

MG&G metric is dependent on number of modules. MJ&S metric is composed from three separate indices arbitrarily weighted.
In network-based methods, the modularity index is clearly defined and used for a wide range of physical and intangible structures (Newman & Girvan Reference Newman and Girvan2004; Blondel et al. Reference Blondel, Guillaume, Lambiotte and Lefebvre2008). The modularity index as formulated in network science has rarely been used in OSS or proprietary hardware (see Paparistodimou et al. Reference Paparistodimou, Duffy, Whitfield, Knight and Robb2020) and even less so in OSH. The modularity index measures the quality of the division, that is, the density and weight of coupling inside modules compared to that among modules (Newman Reference Newman2004; Newman & Girvan Reference Newman and Girvan2004; Blondel et al. Reference Blondel, Guillaume, Lambiotte and Lefebvre2008). Modularity is a scalar value ranging between −1 and 1 (Blondel et al. Reference Blondel, Guillaume, Lambiotte and Lefebvre2008). The value of −1 expresses the state where all ‘module’ parts are interconnected within a monolithic system; the 0 value represents a state of random connectedness lacking any substantial modularisation; and the value of 1 describes a highly modular system (Figure 2).
Indicative examples approaching the boundary values of the modularity index in network science (Newman & Girvan Reference Newman and Girvan2004; Blondel et al. Reference Blondel, Guillaume, Lambiotte and Lefebvre2008).Footnote 5
The approach proposed for calculating modularity in OSH concentrates the following advantages, which are critical in comparison to most of the existing methods (Table 1):
(i) The size-independent metric allows for comparison between different modularity types of the same projects or similar types between different projects, or even studying the evolution of a specific modularity type over time.
(ii) The index is an absolute scalar value delineating what is actually modular.
(iii) The evaluation of weighted dependencies is critical in the precise analysis of connectivity for many subjects relating to modularity, including collaborative networks.
(iv) The evaluation of inter- and intra-module dependencies leads to a thorough understanding of the qualitative property of modularity beyond mere divisibility and detected number of modules.
4. Types of modularity in OSH
4.1. Presentation of the cases
Following the qualitative and quantitative generic definitions of modularity above, this section introduces the selected cases and discusses the types of modularity observed in practice.
4.1.1. OpenStructures
The first selected case is OpenStructures, an open-source project for making modular furniture and other generic hardware (Figure 3). OpenStructures began in 2006 as a student project at the Institute without Boundaries in Toronto, Canada. In September 2009, Thomas Lommee, designer and founder, organised an exhibition showcasing the concept and some initial prototypes, and presented an open call for the collaborative development of the project. OpenStructures is self-defined as an open modular system for building hardware, inspired by the modularity of OSS (OpenStructures 2019).
OpenStructures hardware. From left to right: coat rack, stool and bookcase.Footnote 6

The centerpiece of the OpenStructures system is the OpenStructures grid, a shared geometrical grid built up from the superposition of a rectilinear grid, diagrid and polar grid. The OpenStructures grid is a shared geometric platform for designing parts and their interfaces, which then can be reassembled in different combinations to form new hardware. The featured parts are the lowest-order elements, and usually do not have any functional independence.
In 2019, OpenStructures underwent a major reform, withdrawing most of the older projects from the online database and adding newer projects and designers. The former vertical organisation of artifacts as parts, components and structures was converted to parts that, assembled, comprise apps. In OpenStructures, apps describe objects, appliances, furniture or any other hardware assembly from two or more compatible parts. Macroscopically, the restructuring resulted in a greater level of interaction between designers: in the previous phase most assemblies were composed of parts from the same designer.
4.1.2. WikiHouse
Our second selected case, WikiHouse, was initiated by a nonprofit foundation in 2011 as ‘an open-source project that re-invents the way we make homes’ (WikiHouse 2018a). Since then, architects, builders and users have been locally constructing pilot wikihouses all over the world, based on the distribution of digital fabrication media.
WikiHouse draws a clear parallelisation between OSS and architectural design, as ‘digital design allows every home to be designed as code; instantly customised to its site and user’ (WikiHouse 2018b). It is a collaborative project ‘by everyone for everyone’ (WikiHouse 2018b). WikiHouse is predicated upon the concept ‘Design Global, Manufacture Local’ (Priavolou & Niaros Reference Priavolou and Niaros2019), in which design is developed, shared and improved openly and globally, while manufacturing takes place locally (Kostakis et al. Reference Kostakis, Niaros, Dafermos and Bauwens2015).
WikiHouse’s design knowledge is organised from lower- to higher-order elements in tools, technologies and types. Types are building typologies, designed and configured by technologies (Figure 4). Tools are accessories for assembly and construction, discussion of which is beyond the scope of this article. The most impactful category of WikiHouse design knowledge is technologies.
A housing type that can be reconfigured by Wren technology.Footnote 7

The core technology in the WikiHouse ecosystem is known as Wren. Wren is a design algorithm, developed in a visual programming environment, aiming at two goals. The first goal is the parametric design and customisation of housing types. For instance, the user can adjust the outer dimensions (width, length, height and roof height) of the house, or the number and location of openings (doors and windows) (Figure 4). Based on the outcome of the first goal, the second is to automate the production of detailed fabrication data regarding structural chassis and cladding. In the case of the chassis, the algorithm forms a three-dimensional (3D) structural frame based on the designed outer shell of the first step. Subsequently, that frame is automatically subdivided into indexed interlocking flat-cut elements (Figure 5).
The structural chassis is automatically designed by the Wren algorithm as a three-dimensional puzzle of interlocking flat elements.Footnote 8

4.2. Typology of modularity
Before exploring the modularity types observed in the selected cases, we now introduce our starting point, drawing from the literature on product design and management studies.
4.2.1. Modularity types in product design literature
Kostakis (Reference Kostakis2019: 9), building on Baldwin & Clark (Reference Baldwin, Clark, Garud, Kumaraswamy and Langlois2003), distinguishes three types of modularity pertaining to OSH development:
(i) ‘Modularity in artifact design: It refers to the decomposability of an object into smaller subsystems that may be designed independently but still function together as a whole’.
(ii) ‘Modularity in production processes: It refers to the way that the artifact is produced. Production includes the whole value chain of an artifact, from its design to its manufacturing and distribution. Modularity in production is often a result of increased modularity in design (Brusoni & Prencipe Reference Brusoni and Prencipe2001). Modularity in design is connected to the outsourcing of tasks; however, it is not clear which begets the other (Campagnolo & Camuffo Reference Campagnolo and Camuffo2010)’.
(iii) ‘Modularity in use: It refers to the possibility that the users may have to mix and match modules so that the artifact suits their needs as well as their ability to maintain them’.
Modularity in use is closely related to the ideas of separability and combinability, which build the concept of product system modularity (Salvador Reference Salvador2007). The difference lies with the actor: the user or the firm. Modularity in use is also similar to the concept of open-architecture products by Koren et al. (Reference Koren, Hu, Gu and Shpitalni2013). Fixson (Reference Fixson2007: 90) describes another type of modularity related to (ii):
(iv) Modularity in organisation: ‘the term organisation here is intended to include both intra-firm and inter-firm organisational structures’.
The types described here are also parts, or, better, phases in the Life Phases Modularisation method developed by Krause et al. (Reference Krause, Beckmann, Eilmus, Gebhardt, Jonas, Rettberg, Simpson, Jiao, Siddique and Hölttä-Otto2014). The abovementioned modularity types are not mutually exclusive and their uncoordinated combination can lead to conflicts in product development (Greve, Rennpferdt, & Krause Reference Greve, Rennpferdt and Krause2020). Greve, Rennpferdt, & Krause (Reference Greve, Rennpferdt and Krause2020) have synthesised a method to resolve conflicts identified through the Module Process Chart. Conflicts are resolved by the harmonised amalgamation of the different modularisations of each phase.
The types described above reveal the strong hegemonic position of product modularity. Erixon, Von Yxkull, & Arnström (Reference Erixon, Von Yxkull and Arnström1996) define product modularity as a precondition for modularity in the production process itself. According to Sanchez & Mahoney (Reference Sanchez and Mahoney1996), product modularity facilitates design modularity and organisation modularity. Even the method proposed by Greve, Rennpferdt, & Krause (Reference Greve, Rennpferdt and Krause2020) to resolve modularisation conflicts is based on the conception of different physical product modularisations corresponding to each modularity type or phase. In a holistic hierarchical interpretation, any other type can be modular as long as the product is modular (Figure 6).
Schematic deployment of modularity types according to their relation in the product design literature (Erixon, Von Yxkull, & Arnström Reference Erixon, Von Yxkull and Arnström1996; Sanchez & Mahoney Reference Sanchez and Mahoney1996; Salvador Reference Salvador2007).Footnote 9

4.2.2. Modularity types derived from the selected OSH cases
In addition to the modularity types determined by the literature, the examination of the selected cases of the present study reveals new types of modularity, or redefines existing ones. WikiHouse exemplifies design modularity beyond physical modules. For instance, the components of the Wren design algorithm defining the outer form of the housing type do not correspond exclusively to any single physical module, while their algorithmic structure is potentially modular. Generally, it is common in the building industry for a function (e.g., waterproofing) to be distributed across many physical modules (roof, cladding, doors and windows, etc.). It is also common for a physical module (e.g., a window) not to single-handedly perform a whole function (daylighting, rainproofing, ventilation and visibility). An additional example of potential intangible design modularity, and one of the most promising plans of the WikiHouse team, is PlanXFootnote 10. PlanX is a beta-version design algorithm that automatically checks conformity with building regulations for each instance of a given house type. Consequently, intangible design is a new subject of modularity, bringing OSH closer to the data-driven code structure of OSS. Intangible design modularity – as defined in this paragraph – is wider in scope than merely looking at the level of granularity in the information content of physical modules (Maier, Eckert, & Clarkson Reference Maier, Eckert and Clarkson2017).
Next, the compound nature of the Wren algorithm reveals the absence and importance of another modularity type. For Wren, the processes of conceptual design and design for fabrication are combined and merged into a single algorithm. The amalgamation roughly follows the way different modularisation phases are combined by Greve, Rennpferdt, & Krause (Reference Greve, Rennpferdt and Krause2020) in commercial product development. However, any conceptual design can be materialised using numerous different construction methods: integral, differential, composite or modular (Pahl et al. Reference Pahl, Beitz, Feldhusen and Grote2007), and various fabrication technologies: 3D printers, computerized numerical control (CNC) routers, traditional mechanical tools, or a combination of them.
For example, the Wren algorithm designs a modular chassis out of structural frames and transverse elements. Both are composed from smaller CNC flat-cut plywood panels using a differential construction method (Figure 5). A possible alternative could be to construct the frames out of solid timber beams, but this minor alteration would render the whole Wren algorithm useless. More radical alternatives may include the potential to construct the same conceptual building plan out of precast or cast-in-situ concrete, or even steel. Each construction method requires a totally different dataset: watertight 3D models, flat-cut profile drawings or conventional 2D drawings, sketches and diagrams. Additionally, each of the construction methods results in different levels of hardware modularity. Hence, the disentanglement of design from construction and the simplification of the interface between them, whenever possible, may allow the end-user or maker to combine different designs with different construction methods, and vice versa.
Fabrication features a possibility for another modularity type highlighted by the Wren design algorithm. The Wren design algorithm subdivides structural frames into smaller components for fabrication. Those components are profiles flat cut from plywood sheets that come in the standard size of 1220 × 2440 mm. Thus, the structural chassis is, by default, fabricated using an industrial-grade CNC machine of similar or greater bed size (i.e., greater than 1220 × 2440 mm). This technological dependency limits the ‘Design Global, Manufacture Local’ (Kostakis et al. Reference Kostakis, Niaros, Dafermos and Bauwens2015) potential of OSH. Nevertheless, the Wren design algorithm allows the user to input the available CNC bed size and plywood length, width, and thickness, and subsequently all fabrication drawings are adjusted automatically. In this example, the fabrication is modular, as the interfaces between fabrication media, stock material and fabrication drawings are simple enough to allow independent adjustments. The modularisation of the fabrication process is important, especially in complex assemblies where a simple modification in one parameter (e.g., panel thickness) may result in a substantial volume of design work. The content and target of fabrication modularity are wholly different than modularity in production processes, because the latter aims to outsource the production of components by mirroring product modularisation.
Based on the literature and the types contributed by the cases explored above, we propose the following OSH modularity typology (Figure 7):
Modularity typology drawn from practice and literature. Arrows express potential interdependence and simple lines express succession.Footnote 11

(i) Design modularity, which can be based on:
(1) Physical modularisation. The design of the object is decomposed into the design of separate hardware modules. Physical design modularity is a prerequisite for hardware modularity. The OpenStructures (2020) project exemplifies this in featuring custom parts that, assembled, synthesise into higher-scale objects, called apps.
(2) Intangible modularisation. The design of the object is decomposed into simpler cognitive tasks that form discrete design modules. Modules are generic blocks of design knowledge that are potentially reusable. No over-arching one-to-one correspondence is observed between intangible design and physical modules. Moreover, intangible design modularisation can coexist with physical modularisation as well as with non-modular construction methods. The Wren algorithm and PlanX are instances of intangible design subjected to modularisation. Another example is the structural analysis of a 3D chassis composed of several physical modules (columns and beams).
(ii) Fabrication modularity, which denotes the adaptation of each manufacturing method to varying parameters within the boundaries of the specific method. The function of the Wren algorithm in modularising fabrication data, CNC machine capabilities and stock material dimensions has already been discussed. An example of other manufacturing methods is the customisation of parts and assembly in relation to the maximum printing volume of each available 3D printer. In a broader view, fabrication modularity refers to a design process concerning the final phase of the design: design for fabrication. However, the incentives are different; intangible design modularity aims to ‘design global’ and fabrication modularity aims to ‘manufacture local’.
(iii) Hardware modularity, which is the outcome of design modularity based on physical modules. Bonvoisin et al. (Reference Bonvoisin, Halstenberg, Buchert and Stark2016) completed a systematic literature review of modularisation principles that may be based on material, function, service frequency and reusability. Hardware modularity may refer to a single instance of hardware, or a family of hardware. In the latter case, an ideally highly modular family features modularity in use. In OSH, hardware modularisation remains important for many reasons, but not for outsourcing production tasks.
(iv) Macro-modularity, which is the opposite of the harmonisation of different modularity types in a single project as described by Greve, Rennpferdt, & Krause (Reference Greve, Rennpferdt and Krause2020). Macro-modularity is actuated at the level of the whole OSH ecosystem, based on the simplification or standardisation of interfaces among the different phases of hardware development (e.g., conceptual design and design for fabrication use). A counterexample is the fusion of conceptual design and design for fabrication in the Wren algorithm. A potential example of macro-modularity is the option given to the user or maker to utilise an alternative fabrication method from another OSH housing project in order to construct a WikiHouse-designed house.
(v) Community modularity, which addresses the collaborative structure among contributors, beta testers and users. Community organisation is related to design and hardware modularisation. However, the direction of causality is unclear (Colfer & Baldwin Reference Colfer and Baldwin2016). In contrast with the organisation of the firm, open-source communities are based on voluntary participation, the self-selection of tasks and a lack of top-down authority. In any case, the measure of community modularity cannot separate the distributed from the hierarchical organisation, as both can be modular (Sarkar & Dong Reference Sarkar and Dong2011). Further analysis of network properties reveals node inheritance (Yu & Ramaswamy Reference Yu and Ramaswamy2007) or node centrality (Piccolo, Lehmann, & Maier Reference Piccolo, Lehmann and Maier2018). Both properties are distinctive features of hierarchical organisations.
We next draw an initial scheme of interdependencies and independencies among the modularity types. Hardware modularity cannot exist without physical design modularity. On the other hand, a design based on intangible modules and fabrication modularity, as described so far, may not necessarily provoke any other type of physical modularity. According to the ‘mirroring hypothesis’, community modularity is positively related to design and hardware modularity; however, further research is required to provide systematic evidence of the same in OSH.
An observation by Bonvoisin et al. (Reference Bonvoisin, Halstenberg, Buchert and Stark2016) – with greater extensions in OSH – is that design modularity can be either ex ante or ex post. Ex post modularity approximates the hierarchical division of a whole into parts after the completion of the design. Ex ante modularity is bottom-up, more susceptible to change, and closer to a distributed form of organisation. Ex post modularity resembles what Raymond (Reference Raymond2000) describes as a cathedral structure, and ex ante modularity is closer to a bazaar structure. The modular structure of a bazaar is described by Gentile (Reference Gentile2013) as architecture of additive functionality. Therefore, modularity type and degree aside, a modularisation strategy may influence modularity magnitude and effectiveness.
5. Quantifying modularity
This section quantifies the types of modularity observed in the selected cases that were introduced in Section 4.
5.1. OpenStructures
OpenStructures is a mature OSH project that features design modularity (based on physical modules) and hardware and community modularity. OpenStructures’ network involves 16 designers, 39 apps and 45 unique parts utilised 102 times. The modularity analysis is performed at four different levels (Table 2) of successively enhanced abstraction. Our aim is to capture all possible types of modularity, as well as intermediate conditions that may offer useful meanings.
OpenStructures modularity analysis overview

The first level refers to spatial attachment relations among the parts within a single app: the one made of the greater number of unique parts (Figure 8). The app A.563 was selected from two apps consisting of seven unique parts used several times in each app.
Left: Parts of App A.563 (modularity index: 0.596). An example of design–hardware modularity in a single piece of hardware. Node labels stand for part category. Node colors separate the bigger modules.Footnote 12 Right: App A.563. Coat Rack.Footnote 13

The second level simulates the relation of containment between all apps and parts. When a part is used to assemble an app, those elements are linked (Figure 9). This level is an intermediate-hybrid condition situated between the described types of modularity in OSH, as nodes represent objects of different classes. It is important to note that only custom parts are taken into consideration at all analysis levels, and that ready-made modules are excluded.
Apps-Parts network (Modularity index: 0.770). The analysis refers to an intermediate-hybrid condition between described types of modularity in open-source hardware (OSH), as nodes represent objects of different classes. Big nodes represent the Apps; small nodes represent the contained Parts. Node labels are unique identifiers of designers’ names. Node colors separate the bigger modules.Footnote 14
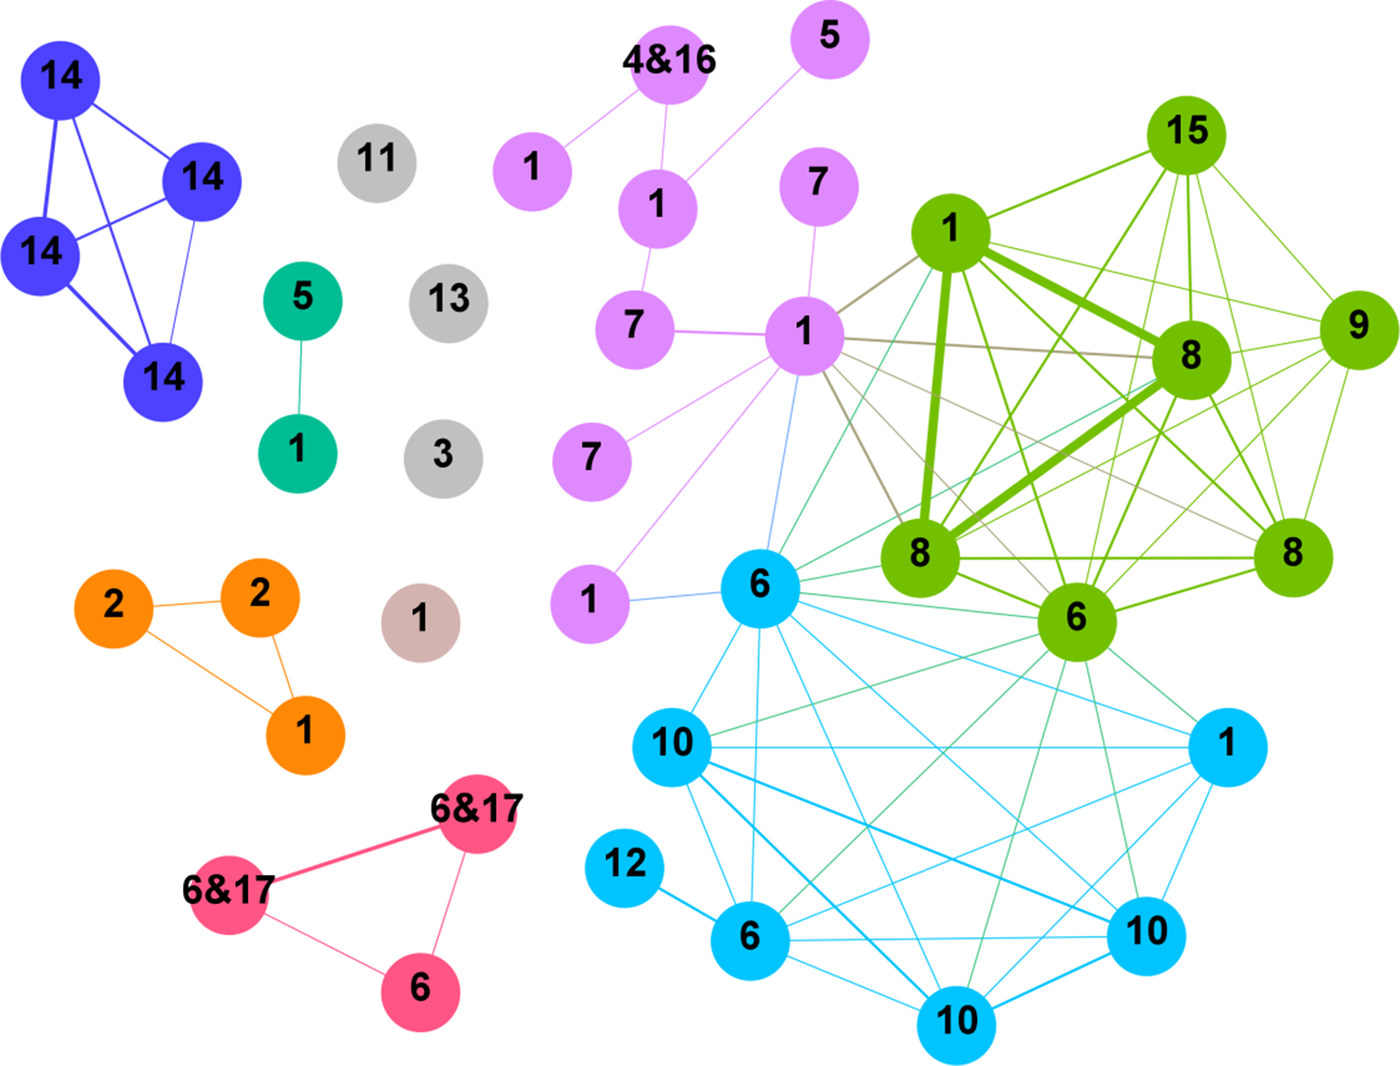
The third level is that of the family of hardware or the representation of weighted relations between apps with one or more common parts (Figure 10).
Apps-Apps network (Modularity index: 0.533). An example of family of hardware modularity. Edge weight represents the number (one or more) of parts in common. Node labels are unique identifiers of designers’ names. Node colors separate the bigger modules.Footnote 15
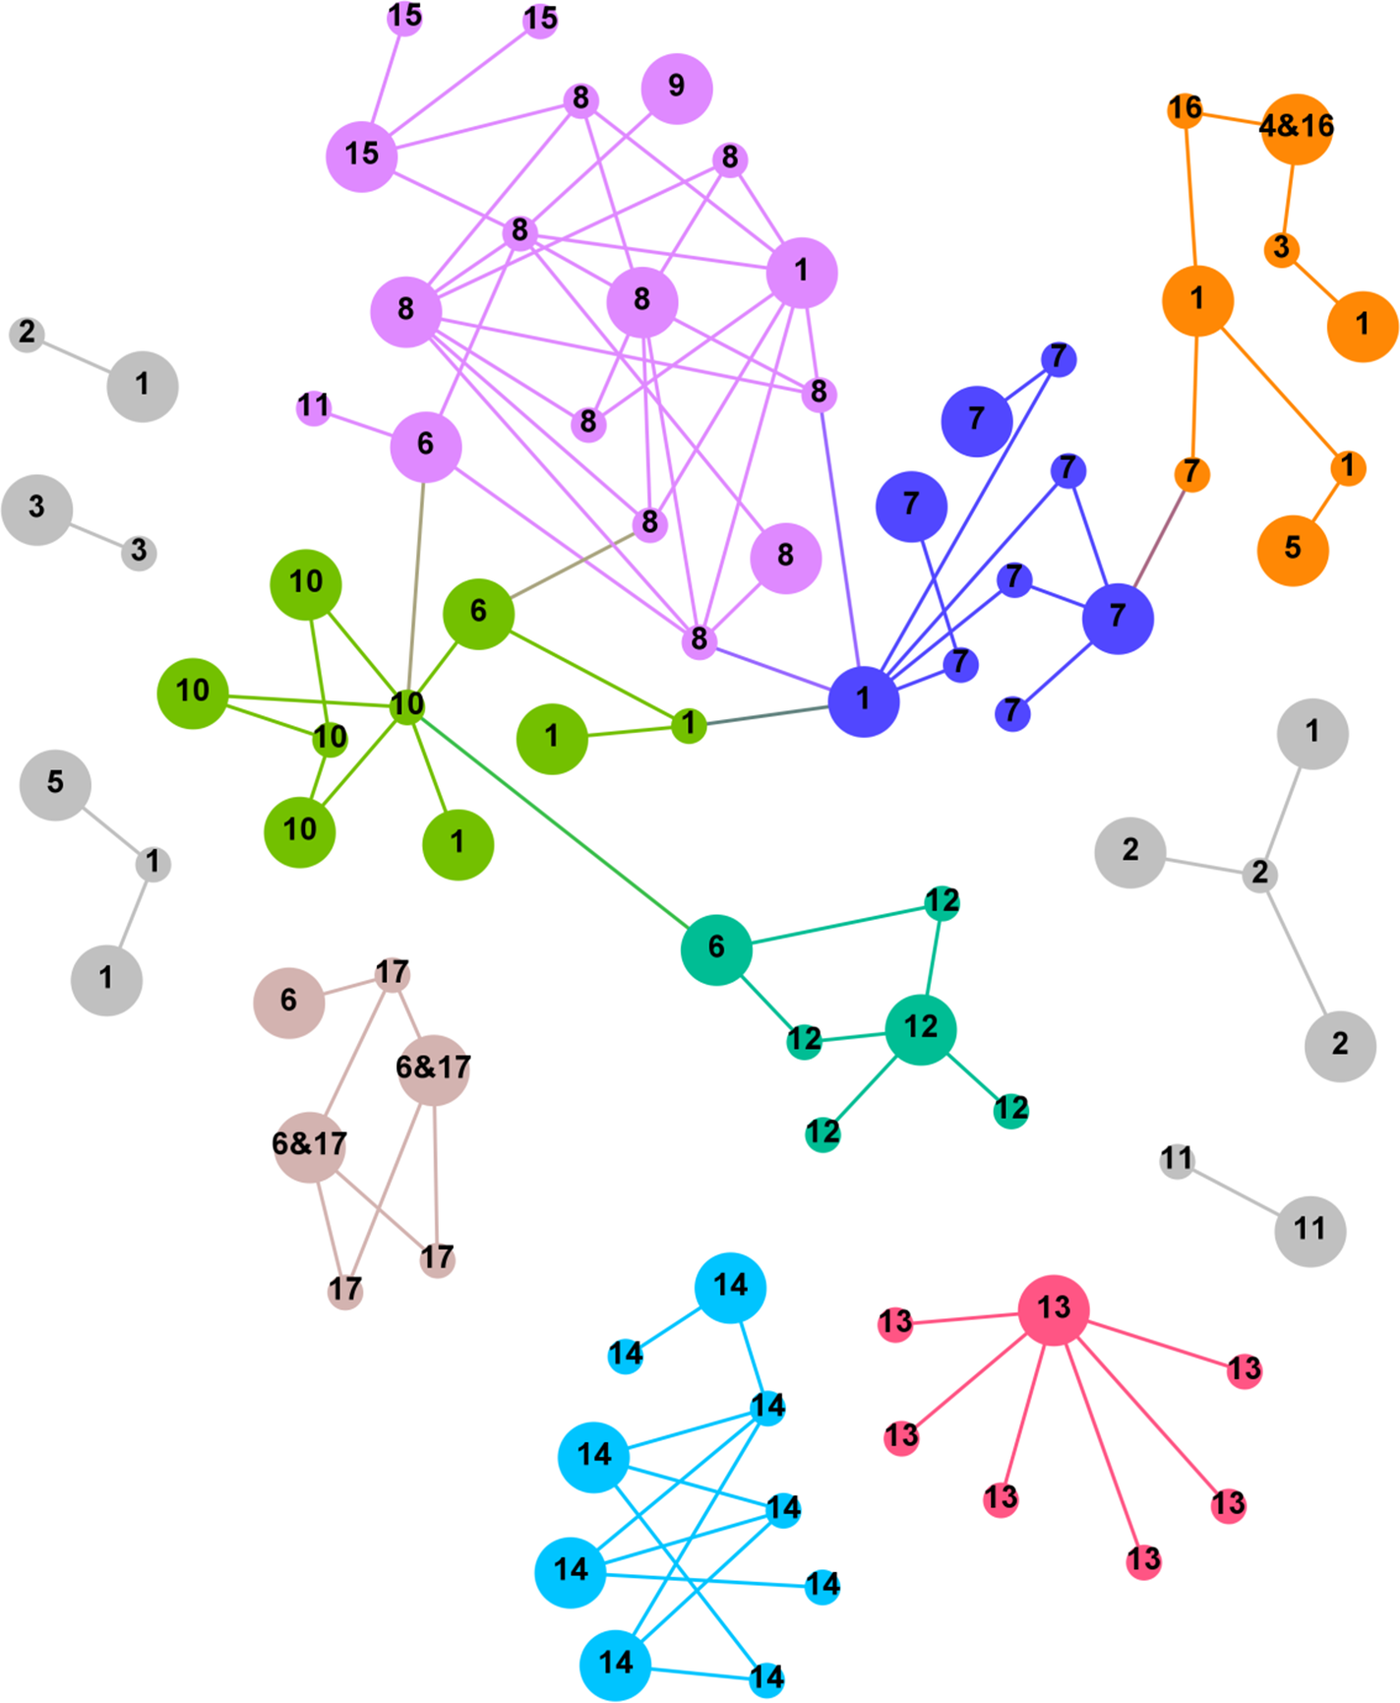
The last level (Figure 11) outlines the relations in the community between designers; the minimum collaboration act (minimal edge weight) is the indirect and asynchronous contribution of one designer to an app of another designer.
Designers network (Modularity index: 0.112). An example of community modularity. Edge weight represents the number of contributions of one designer to another designer’s Apps. Node labels are unique identifiers of designers’ names. Node colors separate the bigger modules (communities).Footnote 16

Beyond the community modularity index, an overview of the community is meaningful for meta-analysis. Specifically, the distribution of collaboration ‘units’ among designers (Table 3) is a useful, though not absolute, indicator of ex ante or ex post modularisation strategies. The distribution of Table 3 concerns both inbound and outbound collaborative ‘units’. Otherwise, the distribution records both the times that a designer used part(s) designed by others and the times that others used his/her part(s). Any modularisation strategy, whether ex post or ex ante, is hard to recognise by the examination of a single artifact. However, when a part is used in more apps of different designers, initial as well as subsequent modularisations are more likely to be ex ante strategies. The meaning of the distribution will be discussed further in Section 6.1.2 (ii).
Distribution of cumulative (inbound and outbound) collaboration ‘units’ among designers

5.2. WikiHouse (Wren)
The Wren algorithm is the core of the WikiHouse project, as well as a characteristic example of intangible design modularity and fabrication modularity. The Wren visual programming script consists of 1086 nodes representing design components, either single or clustered, and 1618 relations (edges) between them. Also, despite the fact that WikiHouse is the result of cooperative efforts in general, according to the GitHub repositoryFootnote 17 and the current authors’ personal communication, the Wren script was developed by a single designer-programmer.
The modularity analysis of the Wren algorithm (Table 4 and Figure 12) is performed at the level of design components, marking their explicitly presented interrelation (Figure 13). In terms of simplicity, the script, which was created by the authors to automatically collect the required data, recognises the clustered design components as single-node design components. Clusters are like global functions in programming, capable of being infinitely reused in a programme.
Wren modularity analysis overview

The modules of the Wren design algorithm. Nodes represent design components. Node colors separate the bigger modules.Footnote 18
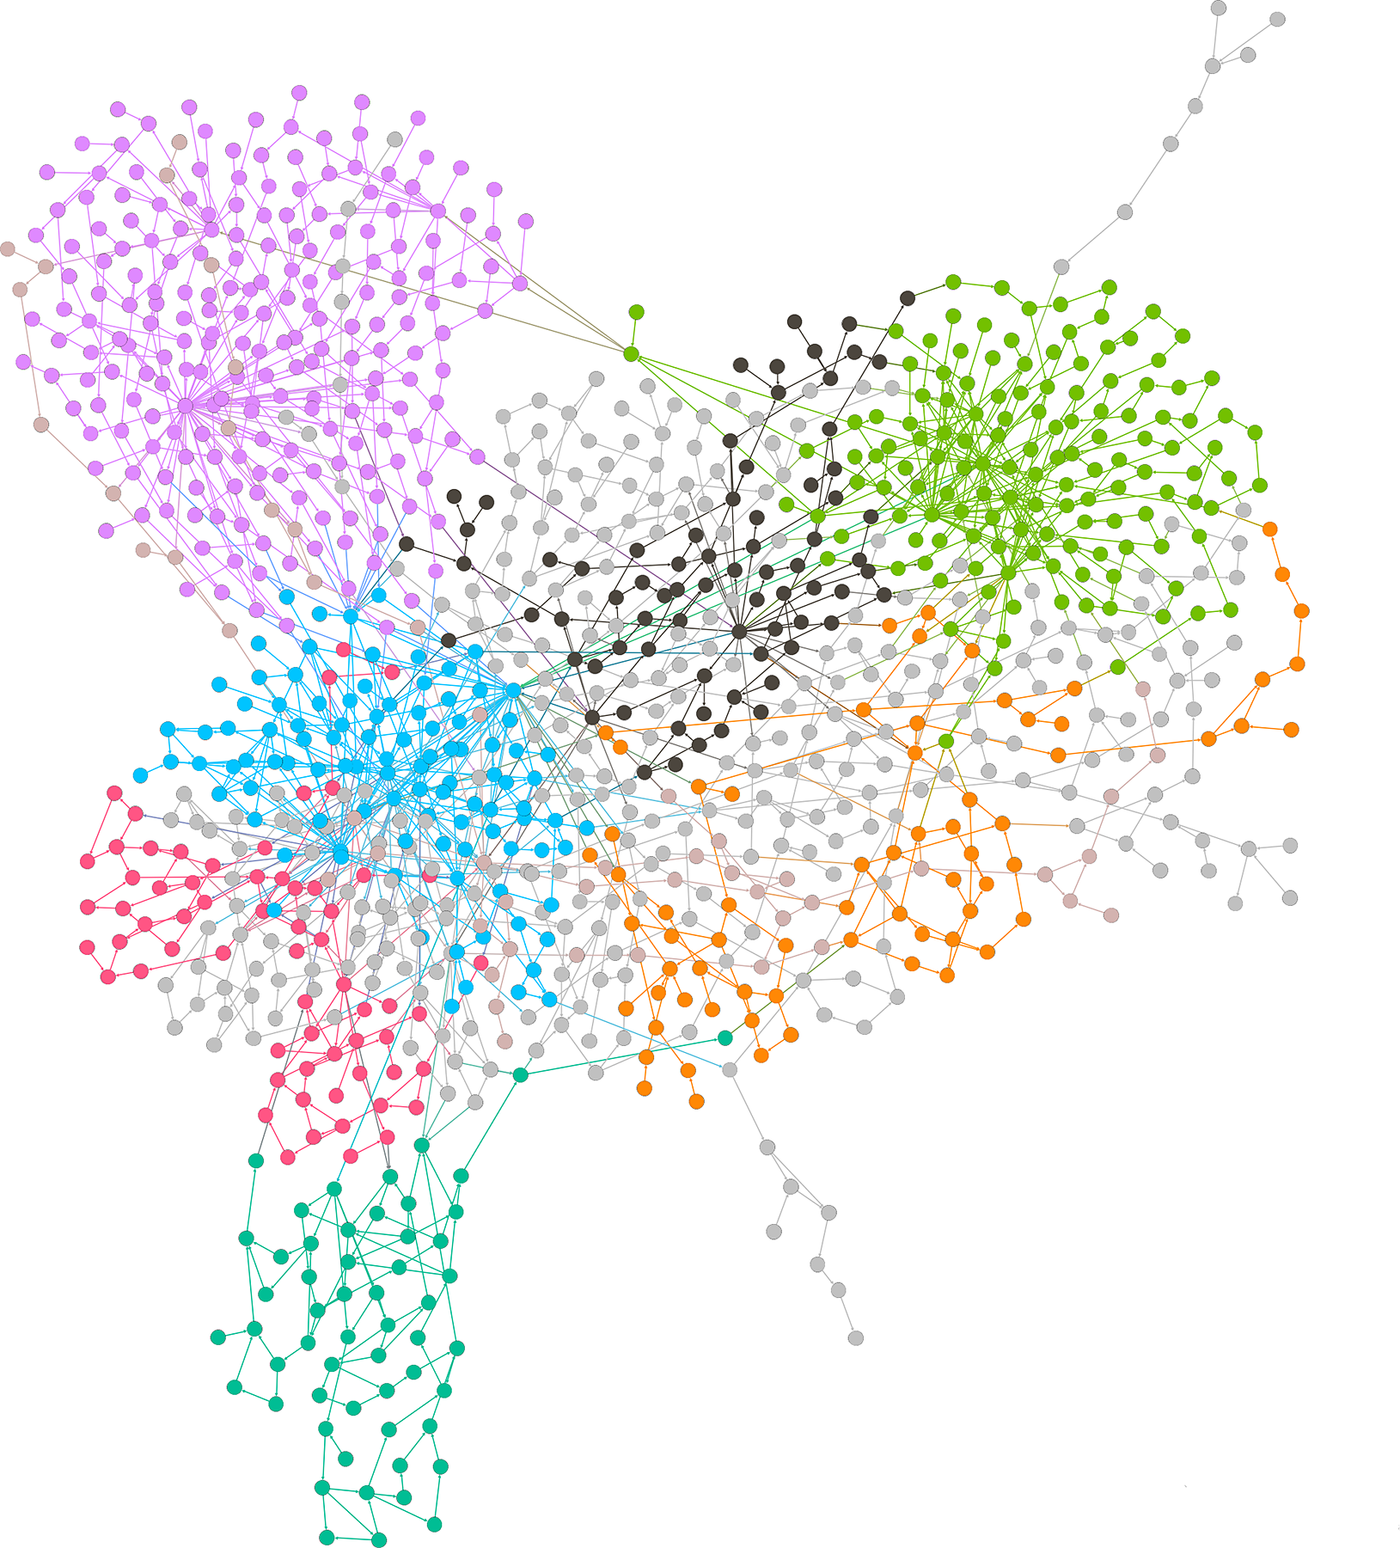
The Wren algorithm in its native visual programming environment (Grasshopper software). The magnified call out indicates single components, clustered components and groups of components. There are more actual connections between design components than the wired connections displayed.Footnote 19

Irrespective of cluster organisation, most design components are grouped by the developer in coloured bounding rectangles (Figure 13) for the purposes of clarity. While this kind of grouping does not imply any functional consequences, groups are indicative of the developer’s notion of design modules. To that end, a second level of analysis was performed (Figure 14) to juxtapose the developer’s intended modules (Figure 13) with those detected from the algorithmic modularity analysis (Figure 12). While no one-to-one coincidence exists between intended–detected design modules, a certain degree of coincidence above randomness is observed at the higher level (Figure 14). Also, the detected modules (except cyan-coloured modules) show a similar coincidence with the procedural design phases noted by the designer-programmer.
Groups of design components (rectangles) and design phases (labels) as set by the Wren developer to order 1086 design components, compared with the modules (colour) as recognised by the modularity algorithm in Figure 12.Footnote 20
6. Discussion
This section discusses the results presented in Section 5 under the framework described in Section 2.
6.1. Interpretation of the results
The presented results delineate a wide range of modularity levels: from near random connectivity (0.112) to fairly modular structures (0.763). According to Newman & Girvan (Reference Newman and Girvan2004), most real-world networks lie between 0.3 and 0.7, while higher values are rare. Therefore, the value of 0.763 corresponds in absolute terms to a highly modular structure. In general, the performed modularity analysis offers two different kinds of metrics: the modularity index and the number of modules.
The first metric – described in Section 3 – is not directly affected by the size of the sample but only by the qualitative attributes of connectivity. An example regarding the scale-free nature of the modularity index is the relative closeness between the levels of a single app (0.596) and of Wren (0.763). The former consists of 22 nodes (parts) and the latter of 1086 nodes (design components). Thus, different modularity types of the same project can be compared regarding possible coincidence (the ‘mirroring hypothesis’). Moreover, alternatives (intangible versus physical) of design modularity, across different projects, can be weighed in regard to their magnitude.
The number of modules, a secondary metric of modularity analysis, is not scale-free. Additionally, the number of modules is important as an indicator of the collaborative potential of each OSH project. According to Benkler (Reference Benkler2006), the greater the number of modules, the greater the potential to attract many contributors from the community. As outlined in Section 1, the number of modules is also connected to parallel work and complexity management (Baldwin & Clark Reference Baldwin and Clark2002), as well as coordination minimisation (Collopy, Adar, & Papalambros Reference Collopy, Adar and Papalambros2020). However, the number of modules itself is not an adequate metric for assessing modularity.
Regarding the comparability of modularity types between the cases, two points should be noted beyond the absolute nature of the modularity index already analysed. First, the Wren algorithm concerns both the design of a single wikihouse and a family of wikihouses, proportionate to the OpenStructures family. The difference lies in the extent and variation of the wikihouse family, which, based on each user input, is almost infinite. Consequently, the hardware modularity levels of the output of the Wren algorithm, being either a single wikihouse or a family of wikihouses, cannot be evaluated without significant assumptions. Second, the size of a wikihouse, measured by the number of unique hardware modules, is similar to the size of A.563 and other OpenStructures apps. Analytically, each wikihouse features identical but generally custom frames in one direction and transverse connectors in the other, with cladding and floor modules between the frames differentiated only in the case of window or door. To summarise, most wikihouses consist of approximately six modules in a repeated arrangement. The difference is that the Wren algorithm includes extra complexity in its intangible design functions and the subdivision of physical modules into smaller intra-module components (Figure 5).
6.1.1. Inter-case design modularity levels
Design modularity is the only common modularity type between the cases. The comparative analysis provides preliminary evidence that intangible design modularisation is likely to produce more modules than physical design modularisation. A comparison between Wren and A.563 provides an example of this: both were designed by a single designer and feature 35 and 5 modules, respectively. Certainly, further research is required to compare more pairs of similar size and complexity before a universal principle can be recognised.
However, intangible design modularisation potentially features increasingly more modularisation levels compared to the physical modularisation of hardware. Whether the hardware modularisation strategy is based on material, function, service frequency or reusability (Bonvoisin et al. Reference Bonvoisin, Halstenberg, Buchert and Stark2016), a different but finite upper limit of modules is anticipated. Conversely, in the case of intangible design modularisation, the upper limit is potentially more flexible due to the intangible nature of the design modules. For example, the designer of a wikihouse can keep adding almost infinite intangible design functions, embedded in a fixed number of physical modules, whereas s/he faces an upper limit when adding chassis physical modules for a wikihouse of a specific size.
The comparison between the modularity indices enhances the previously described outcome in a number of ways. First, the Wren algorithm features greater design modularity than the A.563 (0.763 versus 0.596). Second, even when comparing the Wren design algorithm with the entire OpenStructures family of hardware, featuring 102 parts, intangible design modularisation is prevalent (0.763 versus 0.533). These comparisons emphasise the tendency that intangible compared to physical design modularisation strategies are more effective in yielding more modules and qualitatively more modular structures. Also, the relative coincidence among Wren-detected modules and the horizontal (phases) and vertical (groups) ordering of 1086 design components by the developer is surprising (Figure 14). Even in complex intangible modularisations, the developer can safely predict actual modules. Gopsill, Snider, & Hicks (Reference Gopsill, Snider and Hicks2019) have revealed a significant deviation between intended and designed modular architectures within CAD environments.
6.1.2. Intra-case modularity levels and the ‘mirroring hypothesis’
Following the comparative evaluation of these cases, we focus on the interrelation of modularity types in each project independently. Interestingly, for OpenStructures it may be observed that community modularity is unusually low (0.112), very close to random connectedness. Community modularity is lower than hardware modularity, either examined as a single case (0.596) or as a family of hardware (0.533). Unfortunately, the same comparisons cannot be repeated for Wren. While WikiHouse consists of a small team based in London, the Wren algorithm was created by a single developer. However, in this case the fact that a single developer produced a highly modular design file (0.763) is surprising.
Consequently, each case features an inverse relation between the levels of community modularity and the produced modularity either being design or hardware. Not even a preliminary pattern of correlation among modularity types was detected. On the contrary, the juxtaposition of the available modularity levels in each OSH project reveals an interesting but uncommon contradiction relating to the analogy observed in the software realm, also known as the ‘mirroring hypothesis’ (MacCormack, Baldwin, & Rusnak Reference MacCormack, Baldwin and Rusnak2012).
Before expanding on the possible reasoning for the deviation, we note that MacCormack, Baldwin, & Rusnak (Reference MacCormack, Baldwin and Rusnak2012) have not tested exactly what is known as the ‘mirroring hypothesis’ despite a common misunderstanding. First, MacCormack, Baldwin, & Rusnak (Reference MacCormack, Baldwin and Rusnak2012) axiomatically supposed that firms and OSS communities are tightly and loosely coupled organisations, respectively, no matter what the actual or comparative extent of the property is in each case. Next, the researchers compared proprietary code with OSS in terms of their modifiability, proving that OSS is more ‘modular’ by a factor of six. Therefore, no quantified modularity mirroring exists between the examined software and the community. It is likely that the lack of a unified qualitative and quantitative definition of modularity, as well as the limitations of utilised metrics – outlined in Section 3 – has resulted in the vagueness and ambiguity described above.
Regarding our cases, possible explanations for the deviation among modularity types include the following:
(i) The ‘mirroring hypothesis’ is inaccurate near extreme values and boundary conditions, as in the case of a single designer or developer.
(ii) Ex post modularisation strategies may result in modular hardware or families of hardware, yet also monolithic collaboration networks. Top-down modularised hardware may be highly modular, but such modules are less useful (closed) in another designer’s hardware. Consider the example of the cathedral and the bazaar: one can approximately build both out of cellular Lego bricks, but one can build only the cathedral out of pinnacles, triforiums and buttresses. The potential interoperability of modules in practice is not predicted or captured by the modularity metrics. In OpenStructures, the assumption of ex post modularisation strategies is supported to some extent by the analysis performed. A considerable portion of the designers (4/16) have not collaborated with anyone, and few (6/16) have collaborated with more than one (Figure 11 and Table 3). At the level of parts, almost half of the parts (20/45) have not been reused in another designer’s app (Figure 9), and very few have been reused in three or more designers’ apps (Figure 10).
(iii) Asynchronous and distance-based collaboration as well as the self-selection of tasks may be critical for community modularity to emerge. According to the OpenStructures website (2020), the design of a significant portion of hardware had been commissioned by museums, galleries or even the OpenStructures studio itself, revealing a top-down organisation of tasks. Also, the monolithic and well-connected core of designers (Figure 11) is located mainly in Brussels (the base of the OpenStructures studio) and nearby cities. In contrast, designers from Ramallah or Taipei are less well connected to the central core.
(iv) Beyond all other parameters, design modularity may also depend on the design tool. Visual programming – in the case of Wren – may provoke more modular design than conventional CAD or other design tools. Beeker L, Pringle, & Pearce (Reference Beeker, Pringle and Pearce2018) and Oberloier & Pearce (Reference Oberloier and Pearce2018) report that the parametric nature of the code leads to easily customisable designs. For Wren, the integral distribution of detected modules in procedural phases (Figure 14) highlights that algorithmic design, due to its inherently procedural nature, is closer to an inherently modular structure. In contrast, sketching is a highly nonmodular knowledge structuration process (Brun, Le Masson, & Weil Reference Brun, Le Masson and Weil2016). Bonvoisin et al. (Reference Bonvoisin, Buchert, Preidel and Stark2018) have reported significantly lower distributed collaboration based on CAD files compared with other design documentation in OSH. Even in software, the programming paradigm (procedural or object-oriented language) affects code structure (Baldwin, MacCormack, & Rusnak Reference Baldwin, MacCormack and Rusnak2014). The Million Penguins collaborative writing project forms a counterexample (Shirky Reference Shirky, Feller, Fitzgerald, Hissam and Lakhani2005), indicating that the open-source model cannot be applied to any creative realm without first transforming each conventional workflow (Troxler Reference Troxler, Bogers and Chiappini2019).
6.2. Limitations
Most limitations in the present article stem from the type of research adopted. The case studies analysed here offer a plethora of useful and detailed insights, but results cannot be safely generalised without further systematic investigation. As the OSH realm is still immature, the selection of the sample is crucial for any future systematic research.
Additionally, the unconditional positive impact of modularity levels on OSH development was an axiomatic assumption in this article. In proprietary hardware, optimal modularity is considered preferable to maximum modularity. In contrast with OSH and OSS, in the proprietary realm modularity is a tool to manage limited resources efficiently (Colfer & Baldwin Reference Colfer and Baldwin2016). Further research is required to investigate the potential drawbacks of high modularity levels in OSH development.
A limitation concerning OpenStructures is that the app design files were unavailable. The only available design files were the CAD files for single parts. Therefore, at the lowest analysis level, that of the selected single app A.563, the detection of dependencies among parts was based on spatial attachment relations interpreted from photographic documentation. The relative simplicity of the artifact and the absence of other dependencies (apart from spatial) among modules ensured the accuracy of data collection and analysis. Even if the app design files were available, dependencies between CAD entities (lines, arcs, solids or other) are rarely explicit. Regarding the levels of family of hardware and community analysis, data collection was restricted to the relations of containment between apps and parts as explicitly recorded on the project website (OpenStructures 2019). Explicit relations may not cover the full range of engagement among designers, as described by Kohtala, Hyysalo, & Whalen (Reference Kohtala, Hyysalo and Whalen2019).
A less important limitation concerns the recognition of clustered design components as single-node design components in the Wren case. The simplification of the script that collects connectivity data was rated as more important than accuracy loss. As there are 9 clustered design components in a total of 1086 design components (translating to less than 1%), the accuracy loss is acceptably low.
7. Conclusions
The application of an open-source approach to hardware inaugurates a new research field regarding modularity. This article critically discussed widely used definitions of modularity to argue that proprietary hardware and OSH are phenomena with distinct motives and theoretical frameworks. First, we provided a qualitative and quantitative framework to assess modularity in OSH, drawing mainly from the literature of network science. Second, we presented a tentative classification of modularity types, attempting to address the full range of OSH development. Interestingly, intangible design, fabrication and macro modularity types are unique in the OSH realm and are presented and defined herein, to our knowledge, for the first time. Such a framework and classification may be integral for future systematic research in OSH modularity. Moreover, our quantitative analysis introduced preliminary evidence to argue that intangible design modularisation is more effective than exclusively physical modularisation strategies. Our final remark is that the ‘mirroring hypothesis’ is not a universal pattern in OSH. The selection of design tools as well as the modularisation strategy (ex ante or ex post) may affect the levels of modularity types.
It would be interesting to explore whether other network structural properties such as hierarchy counteract or enhance the impact of modularity. Existing approaches in literature (Baldwin, MacCormack, & Rusnak Reference Baldwin, MacCormack and Rusnak2014), which correlate modularity with hierarchy, have implemented arbitrary thresholds in order to classify structures. Therefore, the quantification methodology and the meaning of other structural metrics (hierarchy, commonality and combinability, among others) in each OSH modularity type is a promising research topic per se. Another promising direction is the mapping of modularity levels along the phases of the development of successful OSH projects. As even the larger projects begin locally with a small team, the recognition of a common pattern may reveal the stages by which quantitative change provokes or requires qualitative reform. By mapping the different types of modularity in OSH, we hope that this paper may prompt a discussion into a wide but less-explored subset in OSH and beyond.
Glossary
CAD Computer Aided Design
CNC Computerized Numerical Control
DSM Design Structure Matrix
OSH Open-Source Hardware
OSS Open-Source Software
Acknowledgements
Network analyses and visualisations were generated with the free and open-source Gephi software. We thank three anonymous reviewers whose comments/suggestions helped improve and clarify this manuscript. V.K. acknowledges funding from the European Research Council (ERC) under the European Union’s Horizon 2020 research and innovation programme (Grant No. 802512). Authors acknowledge financial support from the Hellenic Academic Libraries Link (HEAL) regarding article processing charge (APC).


 Open access