


1. Introduction
The attractiveness of Payment for Ecosystem Services (PES) schemes to restore, protect, secure or enhance the supply of ecosystem services and to alleviate poverty in the agricultural ecosystems of developing countries has recently increased (Wunder, Reference Wunder2005, Reference Wunder2007; Pagiola and Platais, Reference Pagiola and Platais2007; Engel et al., Reference Engel, Pagiola and Wunder2008; Sommerville et al., Reference Sommerville, Jones and Milner-Gulland2009; Scales, Reference Scales2015). However, PES remains a contested conservation approach. PES is a market-based approach with a ‘buyer’ and ‘seller’ of a ‘well-defined ecosystem service’ (Wunder, Reference Wunder2005: 3). While some researchers consider PES a neoliberal policy with negative implications for the marginalized and the global South (McAfee and Shapiro, Reference McAfee and Shapiro2010; Dempsey and Robertson, Reference Dempsey and Robertson2012; Wunder, Reference Wunder2015), others consider it an effective and efficient mechanism for the provision of ecosystem services (Wunder, Reference Wunder2007; Engel et al., Reference Engel, Pagiola and Wunder2008; Molnar et al., Reference Molnar, Liddle, Bracer, Khare, White and Bull2008; Tacconi et al., Reference Tacconi, Mahanty and Suich2010; Vatn, Reference Vatn2010). Also, while poverty alleviation and rural development are considered by some to be the only potential side benefits of PES (Wunder, Reference Wunder2006, Reference Wunder2008), others believe that social and environmental goals are intrinsically linked and should be on an equal footing in PES design (Corbera and Pascual, Reference Corbera and Pascual2012; Singh, Reference Singh2015). As such, there have been calls for a broader definition of PES encompassing markets, subsidies and other strategies for aligning individual and collective land use decisions and broader social interests in managing natural resources (Sommerville et al., Reference Sommerville, Jones and Milner-Gulland2009; Miranda et al., Reference Miranda, Porras and Moreno2003).
Numerous PES initiatives ranging from local initiatives for conserving watersheds to regional and global arrangements for biodiversity and carbon sequestration services have been implemented worldwide (Landell-Mills and Porras, Reference Landell-Mills and Porras2002; Corbera et al., Reference Corbera, Kosoy and Martínez Tuna2007; Wunder et al., Reference Wunder, Engel and Pagiola2008). Further initiatives exist for landscape beauty and bundles of several ecosystem services (Landell-Mills and Porras, Reference Landell-Mills and Porras2002; Clot et al., Reference Clot, Andriamahefazafy, Grolleau, Ibanez and Méral2014). There is also growing interest in implementing PES schemes in agro-ecosystems of developing countries to achieve conservation and livelihood objectives simultaneously (Hope et al., Reference Hope, Porras, Miranda, Agarwal and Amezaga2005; Wunder, Reference Wunder2006, Reference Wunder2008; FAO, 2007b; Cole, Reference Cole2010; Branca et al., Reference Branca, Lipper, Neves, Lopa and Mwanyoka2011). Paying the poor for adopting sustainable land management (SLM) practices could ensure the provision of ecosystem services, improve livelihoods and alleviate poverty, because the poor often live in areas of low agricultural potential with poor soils, steep slopes, insecure land tenure and lack of access to credit (FAO, 2007b; Bulte et al., Reference Bulte, Lipper, Stringer and Zilberman2008; Corbera et al., Reference Corbera, Soberanis and Brown2009; Branca et al., Reference Branca, Lipper, Neves, Lopa and Mwanyoka2011; Matzdorf and Meyer, Reference Matzdorf and Meyer2014). The poor also often lack knowledge about new farming technologies and can be discouraged by temporary negative economic returns associated with transitions from old production systems to new ones (FAO, 2007a; TerrAfrica, Reference TerrAfrica2007; Branca et al., Reference Branca, Lipper, Neves, Lopa and Mwanyoka2011; Liniger et al., Reference Liniger, Studer, Hauert and Gurtner2011).
Yet despite the growing interest in implementing PES to improve livelihoods and alleviate poverty in agro-ecosystems of developing countries, limited attention has been given to developing better understanding of the perils and promises of adoption of the new and largely untested conservation approach (Redford and Adams, Reference Redford and Adams2009; Brockington, Reference Brockington2011). We seek to contribute to filling this gap in the literature by examining the direct and indirect livelihood impacts of the Equitable Payments for Watershed Services (EPWS) program piloted in Morogoro, Tanzania. We use a multi-method, quasi-experimental research design drawing from both quantitative and qualitative data and analysis. Our findings indicate that, while the direct financial payments to program participants for adopting SLM practices contribute to their livelihoods, the program's indirect financial and non-financial benefits are even more important. In the next section we review existing studies on PES and livelihoods and then outline our evaluation approach and material collection and analysis solutions. We then report our findings and relate them back to the literature in the discussion section.
2. PES and livelihoods
Although PES was not designed for improving livelihoods or alleviating poverty, research on its livelihood impacts has grown in recent years (Landell-Mills and Porras, Reference Landell-Mills and Porras2002; Miranda et al., Reference Miranda, Porras and Moreno2003; Grieg-Gran et al., Reference Grieg-Gran, Porras and Wunder2005; Locatelli et al., Reference Locatelli, Rojas and Salinas2008; Tacconi et al., Reference Tacconi, Mahanty and Suich2010, Reference Tacconi, Mahanty, Suich, Tacconi, Mahanty and Suich2011). The findings indicate that a PES program can affect rural livelihoods directly and indirectly. Directly, program participants receive payments for adopting land use changes or improved land use practices specified by the program (Pagiola et al., Reference Pagiola, Arcenas and Platais2005; Molnar et al., Reference Molnar, Liddle, Bracer, Khare, White and Bull2008). In the Latin American PES programs reviewed by Wunder (Reference Wunder2006), payments to participants formed from 10 to 50 per cent of their annual household cash income. These payments are a stable source of cash for investing in, for example, land productivity (Grieg-Gran et al., Reference Grieg-Gran, Porras and Wunder2005; Corbera et al., Reference Corbera, Kosoy and Martínez Tuna2007; Tacconi et al., Reference Tacconi, Mahanty and Suich2010; Wunder et al., Reference Wunder, Angelsen and Belcher2014).
Indirect impacts of PES programs include improvements to land tenure security and increases in the use of marginal land for tree planting, particularly when opportunity costs are lower than PES payments (Grieg-Gran et al., Reference Grieg-Gran, Porras and Wunder2005; Pagiola et al., Reference Pagiola, Arcenas and Platais2005). PES programs have also been shown to increase the capacity of participants through training, technical support and extension services (Tacconi et al., Reference Tacconi, Mahanty and Suich2010). They have also increased labor demand (Caplow et al., Reference Caplow, Jagger, Lawlor and Sills2011), improved the availability of and access to non-timber forest products and land, as well as contributing to social and cultural aspects of communities (Pagiola et al., Reference Pagiola, Arcenas and Platais2005; Tacconi et al., Reference Tacconi, Mahanty and Suich2010). Moreover, PES programs have forged internal and external relationships within communities (Grieg-Gran et al., Reference Grieg-Gran, Porras and Wunder2005; Pagiola et al., Reference Pagiola, Arcenas and Platais2005). For example, the implementation of the Pimampiro PES program in Ecuador increased the institutional capacity of the Nueva America community, enabling them to influence their municipality's decision to enforce environmental regulations (Echavarria et al., Reference Echavarria, Vogel, Albán and Meneses2002).
Most studies on the livelihood impacts of PES have focused on programs implemented in forest ecosystems for reforestation, afforestation and forest protection (Landell-Mills and Porras, Reference Landell-Mills and Porras2002; Grieg-Gran et al., Reference Grieg-Gran, Porras and Wunder2005; Pagiola et al., Reference Pagiola, Arcenas and Platais2005; FAO, 2007a; Porras et al., Reference Porras, Grieg-Gran and Neves2008; Wunder, Reference Wunder2008; Tacconi et al., Reference Tacconi, Mahanty and Suich2010). This is because the majority of PES programs in developing countries are implemented in forest ecosystems rather than in agro-ecosystems (Zilberman et al., Reference Zilberman, Lipper and McCarthy2008; Tachibana and Adhikari, Reference Tachibana and Adhikari2009). However, the potential of agro-ecosystems to restore or provide valuable ecosystem services is increasingly acknowledged (FAO, 2007b; Cole, Reference Cole2010; Branca et al., Reference Branca, Lipper, Neves, Lopa and Mwanyoka2011; Smith and Sullivan, Reference Smith and Sullivan2014). For example, the Intergovernmental Panel on Climate Change (Reference Metz, Davidson, Bosch, Dave and Meyer2007) estimated that by 2030 the agricultural sector in developing countries could contribute up to 1.9 Gt/yr of CO2 equivalent to carbon mitigation, and the forestry sector another 1.6 Gt/yr. That is, there is substantial potential for carbon sequestration initiatives on agro-forestry and conservation agriculture, which could enhance natural resource-based livelihoods and increase smallholders' resilience to drought, climate change and economic instability (Stevenson et al., Reference Stevenson, Serraj and Cassman2014).
Existing PES studies also highlight the growing integration of the livelihood approach to broaden the PES programs so that they acknowledge all those natural, human, financial, sociopolitical and physical assets that are central to livelihoods (Chambers and Conway, Reference Chambers and Conway1992; Echavarria et al., Reference Echavarria, Vogel, Albán and Meneses2002; Ellis and Freeman, Reference Ellis, Freeman, Ellis and Freeman2005; Tacconi et al., Reference Tacconi, Mahanty and Suich2010). However, the majority of impact studies rely on anecdotal evidence or information gathered only from participating households which may be biased and lead to incomplete assessment of livelihood impacts (Ferraro and Simpson, Reference Ferraro and Simpson2002; Pagiola, Reference Pagiola2005; Ferraro and Pattanayak, Reference Ferraro and Pattanayak2006; Pattanayak, Reference Pattanayak2009; Brown et al., Reference Brown, Dettmann, Rinaudo, Tefera and Tofu2011). Most studies do not differentiate the impacts of PES programs from the impacts of other development efforts (Asquith et al., Reference Asquith, Vargas Ríos and Smith2002, Reference Asquith, Vargas and Wunder2008; Engel et al., Reference Engel, Pagiola and Wunder2008; Jindal, Reference Jindal2006; Wunder and Albán, Reference Wunder and Albán2008). The assessment of what would have happened to the livelihoods of program participants without the PES intervention is vital in order to inform the increasing number of PES programs and plans to invest billions of dollars in activities aimed at enhancing the provision of ecosystem services such as water regulation and carbon sequestration in developing countries (FAO, 2007a; Miles and Kapos, Reference Miles and Kapos2008; Ferraro, Reference Ferraro2009; Schomers and Matzdorf, Reference Schomers and Matzdorf2013).
To this end, this paper examines the direct and indirect livelihood impacts of the EPWS program for adopting SLM practices in Morogoro, Tanzania. We use a multi-method, quasi-experimental research design drawing from both quantitative and qualitative data and analysis. Our findings indicate that, while the direct financial payments to program participants for adopting SLM practices contribute to their livelihoods, the program's indirect financial and non-financial benefits are even more important.
3. Case study, materials and methods
The EPWS program led by CARE and WWF was piloted between 2008 and 2012 in the Kibungo juu ward of Morogoro region in Tanzania (figure 1). It was targeted at upstream farmers in the upper catchment of the Ruvu River in the Uluguru Mountains, the source of water supply to Dar-es-Salaam (Branca et al., Reference Branca, Lipper, Neves, Lopa and Mwanyoka2011; Lopa et al., Reference Lopa, Mwanyoka and Jambiya2012). The Dar-es-Salaam Water and Sewage Company (DAWASCO) and Coca Cola Kwanza Ltd were the service buyers and the Lukenge, Kibungo, Lanzi, Dimilo and Nyingwa villages were the service providers in the Kibungo juu ward (CARE/WWF, Reference CARE/WWF2007). The main livelihood activities in these villages are annual crop farming, off-farm activities such as banana businesses and carrying bananas to the market, permanent crop farming, and employment as farm labor, as well as hunting and gathering.

Figure 1. (a) The Eastern Arc Mountains; (b) The Uluguru Mountains showing the location of the Equitable Payments for Watershed Services program; (c) Kibungu sub-catchment with the location of villages and individual farmers' fields under project interventions (inset)
EPWS was a voluntary program whereby the payments to service providers were conditional on the adoption of SLM practices such as agro-forestry, fanya juu Footnote 1 and bench terracing to reduce nutrient mining and soil erosion and to improve rural livelihoods on over 2,240 ha of farmland (Branca et al., Reference Branca, Lipper, Neves, Lopa and Mwanyoka2011; Lopa et al., Reference Lopa, Mwanyoka and Jambiya2012). Each farmer who participated in the EPWS program chose SLM practices that suited the slope of his/her land and received agricultural inputs and technical assistance from CARE and monetary rewards for adopted practices through village-level contracts from DAWASCO. Lopa et al., (Reference Lopa, Mwanyoka and Jambiya2012) provide details of the development, operationalization, payment mechanism and sustainability of the EPWS scheme. Branca et al., (Reference Branca, Lipper, Neves, Lopa and Mwanyoka2011) used the EPWS program as a case study to explore the key challenges of PES programs in supporting the adoption of SLM practices in developing countries. This paper examines the direct and indirect, financial and non-financial livelihood impacts of the EPWS program to draw conclusions about how the livelihoods of program participants were affected when compared to non-participants.
We used a multi-method quasi-experimental approach drawing from qualitative and quantitative methods to examine the direct and indirect financial and non-financial livelihood impacts of the EPWS program. In 2011 we administered a household questionnaire to 116 program participants and 117 non-participants selected from a stratified random sample generated through a participatory wealth ranking to generate a representative sample from the EPWS program villages. The household questionnaire collected basic social and demographic data alongside data on changes in human capital variables (i.e., the amount of training attended by members of a household), social capital variables (i.e., the number of memberships and affiliations of trust), and financial capital variables (i.e., the number of livestock, crop harvests, non-agricultural salaries and remittances) (Carney, Reference Carney and Carney1998; Ellis and Freeman, Reference Ellis, Freeman, Ellis and Freeman2005). In addition, focus group discussions were performed with eight groups of program participants and eight groups of non-participants for triangulation purposes. Semi-structured interviews were conducted with key informants – four EPWS program staff, four village leaders, eight representatives from EPWS farmer groups in each program village and eight EPWS participating and eight non-participating household heads. Both key informant interviews and focus group discussions captured information on the modality, amount and use of EPWS payments and the influence of the program on the value of land and access, livestock keeping, crop yields, environmental and agricultural knowledge, local institutions and trust within and outside.
3.1. The propensity score matching and implementation
The propensity score matching (PSM) technique was used to construct a statistical comparison group based on balancing scores b(X) of the probability for an individual to participate in a treatment given his/her observable covariates unaffected by the program, such that the conditional distribution of X given b(X) is independent of assignment into treatment (Rosenbaum and Rubin, Reference Rosenbaum and Rubin1983; Rosenbaum, Reference Rosenbaum2002; Caliendo and Kopeinig, Reference Caliendo and Kopeinig2008). This probability or propensity score is then used to match EPWS program participants to non-EPWS participants. The average treatment effect of the program is then calculated as the mean difference in outcomes across the two groups Rosenbaum and Rubin, Reference Rosenbaum and Rubin1983; Rosenbaum, Reference Rosenbaum2002). This counterfactual condition establishes what would have happened to the livelihoods of participants if there had been no EPWS program intervention. Being an observational quasi-experimental evaluation study, the validity of PSM depends on: (a) conditional independence (namely, that unobserved factors do not affect participation); and (b) the presence of sizable common support or overlap in propensity scores across the EPWS participants and non-EPWS participants to reduce selection bias (Rosenbaum, Reference Rosenbaum2002).
The choice of the model to be used for estimation of propensity score and the variables to be included in the model are two important choices that need to be made when using PSM (Dehejia and Wahba, Reference Dehejia and Wahba2002; Rosenbaum, Reference Rosenbaum2002). In this study, the logit model of program participation was used to estimate probabilities or propensity scores. Any discrete choice model can be used for estimating propensity scores because logit and probit models yield similar results when estimating the probability of participation vs. non participation in binary treatment cases (Rosenbaum, Reference Rosenbaum2002). In the general framework of the probability model we have: Prob(EPWS participation) = Prob(D = 1) =F[relevant effects, parameters]. In this case, the probability of participation in EPWS is a cumulative distribution function F evaluated as a function of a set (X) of explanatory variables that include household socio-economic characteristics, and a vector β of unknown parameters. The probability of participation model can be written as:
 $$Prob\lpar {{D_i} = j} \rpar = \displaystyle{{{{e^{\beta {x_{ij}}}}}}\over{{{e^{\beta {x_{io + }}}}{e^{\beta {x_{i1}}}}}}}\; f\; or\; j = 0,1.$$
The choice of variables used for building up the propensity score model were based on sound knowledge of previous research and those unaffected by participation or anticipation of it (Rosenbaum, Reference Rosenbaum2002; Caliendo and Kopeinig, Reference Caliendo and Kopeinig2008). The variables included in the propensity score estimation model are household head's gender, age and education, household family size, farm size of the household, and household's past land use. To make sure the bias in PSM program estimates is low, the same survey instrument was administered to participants and non-participants from the same geographical area facing the same economic incentives (i.e., that might be driving choices such as program participation) to ensure that the observed characteristics entering the logit model of participation are measured similarly across the two groups (Heckman et al., Reference Heckman, LaLonde, Smith, Ashenfelter and Card1999; Dehejia and Wahba, Reference Dehejia and Wahba2002; Ravallion, Reference Ravallion, Schultz and Strauss2007; Caliendo and Kopeinig, Reference Caliendo and Kopeinig2008).
Nearest neighbor (NN) matching with replacement estimator (i.e., an untreated individual was used more than once as a match) was used to tradeoff bias and variance (Dehejia and Wahba, Reference Dehejia and Wahba2002; Caliendo and Kopeinig, Reference Caliendo and Kopeinig2008). By allowing replacement, the average quality of matching was increased and the bias decreased (Dehejia and Wahba, Reference Dehejia and Wahba2002). This approach was vital in this study because the propensity score distribution in the data between the treatment and the control group was slightly different. This could reduce the number of distinct non-participants used to construct the counterfactual outcome and increase the variance of the estimator (Rosenbaum and Rubin, Reference Rosenbaum and Rubin1983; Dehejia and Wahba, Reference Dehejia and Wahba2002). Matching with replacement allowed the reduction of bias, by producing matches of higher quality than that which could have be achieved with matching without replacement, given the lower number of control observations (Dehejia and Wahba, Reference Dehejia and Wahba2002; Scales, Reference Scales2015).
Visual analysis of histograms (figures 2a and 2b) showing density distribution of the propensity score in the two groups was used to check the overlap and the region of common support assumption (Caliendo and Kopeinig, Reference Caliendo and Kopeinig2008). This ensured that any combination of characteristics observed in the treatment group can also be observed among the control group (Caliendo and Kopeinig, Reference Caliendo and Kopeinig2008). In NN matching with replacement, only the closest neighbor from the control group is used to match treatment individuals. Control individuals that fall outside the region of common support were discarded as bad matches (Rosenbaum and Rubin, Reference Rosenbaum and Rubin1983). The region of common support before NN matching with replacement is shown in figure 2a, while figure 2b shows the region after NN matching with replacement.
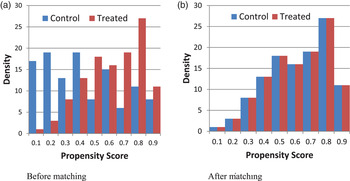
Figure 2. Regions of common support before (panel a) and after (panel b) nearest neighbor matching with replacement
The quality of matching in terms of characteristics of the treatment and control groups before and after matching is presented in table 1, which also shows observable socio-economic characteristics used for matching that had the potential to influence participation or selection into the EPWS program (Ravallion, Reference Ravallion, Schultz and Strauss2007; Caliendo and Kopeinig, Reference Caliendo and Kopeinig2008). Before matching, the sample shows that the heads of participating households are younger than non-participants and that they have more years of schooling. The participating households also have more members and land. Indeed, the Mann–Whitney U-test shows significant difference between the treated and control group (table 1). After matching, the treatment and control groups are similar in terms of propensity scores (table 1) because the Mann–Whitney U-test shows no significant difference between the two groups.
Table 1. Comparison of pre-matched and matched samples of Equitable Payments for Watershed Services (EPWS) program participants and non-participants

Notes: Yes = Treated (EPWS program participants) and No = Control (EPWS program non-participants).
a Indicates a dummy variable, coded as 1= statement true for respondent, and 0 = statement false for respondent; the mean for these variables is therefore a percentage of respondents.
1 Gender of household head: 1 if male and 0 if female; Past land use: 1 if implemented conservation practice in the past before EPWS program and 0 otherwise. Test statistic used is Mann–Whitney U.
After matching the treatment group with the control group, a simple difference approach (Baker, Reference Baker2000; White and Barbu, Reference White and Barbu2006) was employed to estimate the impact of the EPWS program on the livelihoods of program participants. The impacts were analyzed using the t-test with SPSS for Windows. Qualitative data from focus group discussions, semi-structured interviews and participant observations were manually coded (Neuendorf, Reference Neuendorf2002) and relevant quotes were extracted to support themes and interpretation of quantitative questionnaire data.
4. Results
According to the key informants, program participants were paid between US$8 and US$48 once for implementing SLM techniques, depending on the area of land dedicated to improved land management practices. The average payment was US$11.Footnote 2 The average annual household cash income of program participants and non-participants was US$54 (Tsh85,621) and US$42 (Tsh66,892), respectively. The EPWS payments in 2010 contributed 20 per cent of program participants' annual household cash income.
According to key informants and focus group discussions, EPWS payments were an important source of cash income. One key informant said: ‘The payment I received is a large amount of cash that I can get at once’ (female farmer, program participant, Lanzi village – interview statement, 2011). Another key informant explained that: ‘The money I received helped to buy chickens which are an important source of meat and quick source of money to attend urgent problems such as sickness or children's school needs’ (male farmer, program participant, Nyingwa village – interview statement, 2011). The payments were used to improve houses, purchase food, livestock, clothes, radios and furniture, to pay school fees and to purchase better seeds. Also, the ownership of consumer durables such as machetes (p < 0.01), hoes (p < 0.01), spades (p < 0.01), radios (p < 0.01), and buckets (p < 0.01) was significantly higher among the program participants (figure 3).

Figure 3. Equitable Payments for Watershed Services participants' ownership of consumer durables when compared to non-participants
In the implementation of activities introduced by the EPWS program, some wealthier participants employed other villagers for casual work such as the construction of terraces and excavation of banana and tree pits. Cash income from casual work was an indirect benefit to many more participants (31.7 per cent) than non-participants (20.7 per cent), due to more trust among program participants. Key informants explained that the average income of a casual laborer was US$1.8 per day or US$25.7 for 14 days for constructing terraces or excavating banana pits. Also, in each program village, three to five people employed in tree nurseries established by the program received an annual salary of about US$441 per year.
Yields of beans and cabbage are statistically larger among the treatment group. Maize, bean, groundnut, sugarcane, banana, cassava, sweet potato and tomato yields are also larger in the treatment group but the differences are not statistically significant (figure 4). Key informant interviews and focus group discussions suggested that yields increased because of the introduction of improved agricultural practices such as intercropping of maize with cover crops such as beans and groundnuts, use of improved seeds, application of animal manure, and specialization in high-value crops such as beans, tomatoes and cabbage. Compost manure was used by 69 per cent of participants and 21 per cent of non-participants.

Figure 4. Outcome of Equitable Payments for Watershed Services program on average crop yields among the program participants in 2011
Our findings indicate that the number of chickens (p < 0.01) and goats (p < 0.05) was much higher among the program participants (figure 5). Key informants and participants of focus group discussions explained that program participants had been encouraged to keep goats and chicken for manure, income and meat and to construct livestock sheds for them. By 2011, 35 new livestock sheds had been constructed and most of the program participants had moved their goats from the forest to the sheds. In addition, some program participants had purchased goats, pigs and chickens with the PES payments they had received.
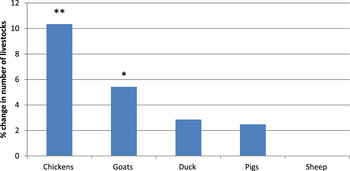
Figure 5. Outcome of the Equitable Payments for Watershed Services program in livestock keeping among program participants
The implementation of the EPWS program activities not only increased crop yields, but also increased the amount of land farmed by 2.7 per cent among the treatment group. It also increased the value of land where SLM practices such as terraces had been introduced. A key informant explained that:
‘According to our custom, anyone can go to a landholder with idle land and borrow that land either without paying or in return for an agreed share of the harvest. The program has now motivated those who used to give or lease their idle land to plant trees in order to be paid money and … for future sale of trees or timber.’ (male farmer, program participant, Nyingwa village – interview statement, 2011)
The average price of land perceived by key informants and focus group participants before the construction of terraces ranged between US$74 and US$216 per acre in a hilly terrain and between US$248 and US$496 in flat terrain. According to the key informants and focus group participants, the average price of arable land increased to US$2,168 per acre in hilly terrain after terracing. While this increase has benefited land owners, it has reduced access to land among the landless and those with small land holdings. According to the village leaders, average land rents also increased from being free in 2008 to between US$1.8 and US$3 per acre per year in 2011.
We also found that program participants had improved their ability to meet household food needs more than non-participants. The proportion of participants exchanging labor for food, reducing the number of meals eaten in a day, limiting meal sizes, skipping eating for an entire day, purchasing food on credit and experiencing difficulty satisfying household food needs was lower among participants than among non-participants (figure 6).

Figure 6. Household food needs of Equitable Payments for Watershed Services program participants compared to non-participants in 2011
The EPWS program also had indirect non-financial impacts such as improved access to information, new and strengthened institutions and enhanced reciprocity and trust in the community, and extension of internal and external networks. About 77 per cent of program participants had received training and 86 per cent had received assistance from EPWS extension staff and the ward agricultural extension officers. Only 16 per cent of non-participants had received such support. The availability of and access to extension services was better for program participants: 83 per cent of participants and 27 per cent of non-participants considered that the availability of and access to extension services had improved, while 15 per cent of participants and 67 per cent of non-participants considered them to have remained the same. Program participants received extension services provided by the ward extension officer in addition to the EPWS program extension services, while non-participants received ward extension services only.
Another indirect non-financial impact of the program was the increased availability of environmental and agricultural information: up to 91 per cent of participants and 42 per cent of non-participants felt such information had increased; only 10 per cent of participants and 55 per cent of non-participants considered it to have remained the same. Key informants and focus group participants considered that the increase in environmental and agricultural knowledge and skills among participants was the result of their interaction with the program extension officers, as well as participation in dissemination workshops and study tours. Program participants also received support from the program-trained para-professionals (five to eight in each village) who served as local extension contacts. Environmental information was also disseminated in four primary schools and one secondary school. Over 10,000 trees were planted in the schools and students took trees home from the school-managed tree nurseries established through the program (EPWS program officer – interview statement, 2011).
The EPWS program also created new institutions and strengthened existing ones, improved trust in the community and expanded internal and external networks. The program established farmer groups, which in turn adopted rules to guide their operation and to achieve collective program obligations. These rules helped the farmer groups to sanction defaulters by fines or eviction. A farmer explained that ‘if a member of our group fails to attend group work for more than two days, s/he will be required to return any group tools and pay a fine of US$12’ (female farmer group leader in Nyingwa village – interview statement, 2011).
The EPWS program also improved trust among the participants. Program participants have a significantly higher number of memberships (p < 0.05) (figure 7) in all categories (figure 8). The increase in memberships after the EPWS program is more pronounced for men than women (p < 0.05) (figure 7). Key informants and focus group participants explained that males' involvement in community, village and external expert meetings and workshops was more common because women were more involved in daily household activities. Memberships and interactions increased their ability to work together and exchange ideas. Consequently, trust among program participants was significantly higher (p < 0.1). The concept of trust was defined by the key informants and focus group discussions as the ability and willingness to give and receive assistance from people beyond relatives and friends if food or money was needed. Our findings suggest that 67 per cent of participants and 44 per cent of non-participants provided help to a friend, 58 per cent of participants and 49 per cent of non-participants borrowed money from a friend, and 62 per cent of participants and 40 per cent of non-participants lent money to a friend or relative.

Figure 7. Percentage change in household number of memberships and in various groups among Equitable Payments for Watershed Services program participants

Figure 8. Change in household memberships in various groups among Equitable Payments for Watershed Services program participants
Villagers also trusted outsiders more as a result of networks expanded to national and international researchers, CARE and WWF organizations and associated program staff, extension staff, DAWASCO and Coca Cola Kwanza Ltd. and other external organizations and actors. Key informants and focus group discussions suggested that outsiders were traditionally feared and called ‘chinja chinja’ (i.e., killers) because of deaths and disappearances in the villages in the 1890s and early 1900s during German colonial rule. As development projects became more common in the villages, trust gradually increased. A farmer explained that ‘as more people were joining and attending CARE training, and as no bad news were reported about them, and as their livelihood are improving … I think it is worth joining and benefiting as they are benefiting’ (male farmer, program non-participant, Nyingwa village – interview statement, 2011).
Nevertheless, some villagers remain concerned about the conservation intentions, particularly of land confiscation and relocation after conservation measures. One key informant explained that ‘we are worried that this program has been secretly sent to the village by the government to promote tree planting which will become the property of the government’ (male farmer, program participant, Kibungo village – interview statement, 2011). Some program participants and non-participants were also concerned about PES, asking ‘how can someone give you trees for free and also pay you money for planting them in your own farm?’
5. Discussion
We have demonstrated how the implementation of PES programs in agro-ecosystems of developing countries can benefit rural livelihoods by examining the direct and indirect financial and non-financial livelihood impacts of the EPWS program. Our findings suggest that the EPWS program payments make a 20 per cent direct contribution to program participants' annual cash income. These payments are one way through which a PES program can improve livelihoods (Pascual et al., Reference Pascual, Muradian, Rodríguez and Duraiappah2010). The EPWS payments can be compared to payments made in PES programs implemented in Latin America: their participants have received payments amounting to between 10 and 50 per cent of their annual income (Miranda et al., Reference Miranda, Porras and Moreno2003; Kosoy, Reference Kosoy, Corbera and Brown2008; Wunder, Reference Wunder2008; Bremer et al., Reference Bremer, Farley, Lopez-Carr and Romero2014).
The additional income improved the EPWS program participants' ability to invest in houses, to purchase food, better seeds, livestock, clothes, radios and furniture and to pay school fees. Although the payments are not large enough to make a substantial difference to livelihoods, participants are mostly happy to have a PES program as a new and additional source of income (de Man, Reference de Man2004) and as a means of improving income diversification and stabilization (Grieg-Gran et al., Reference Grieg-Gran, Porras and Wunder2005; Calvet-Mir et al., Reference Calvet-Mir, Corbera, Martin, Fisher and Gross-Camp2015). A concern in many PES programs is what happens when payments end, as many developing country programs have existed for only a short time and the payments often do not extend beyond coverage of the design and start-up costs (Wunder, Reference Wunder2008; Tacconi et al., Reference Tacconi, Mahanty and Suich2010). However, it is expected that by the end of projects, a functioning PES scheme could be in place with sellers and buyers (Tacconi et al., Reference Tacconi, Mahanty and Suich2010; Martin et al., Reference Martin, Gross-Camp, Kebede and McGuire2014; Calvet-Mir et al., Reference Calvet-Mir, Corbera, Martin, Fisher and Gross-Camp2015).
Our findings also indicate that the construction of terraces and tree planting for agro-forestry and reforestation increased the value of land enrolled in the EPWS program (Zilberman et al., Reference Zilberman, Lipper and McCarthy2008). This demonstrates the potential of PES to induce the adoption of improved land management practices despite being currently seldom used for this purpose (Landell-Mills and Porras, Reference Landell-Mills and Porras2002; Huang et al., Reference Huang, Upadhyaya, Jindal and Kerr2009; Martin et al., Reference Martin, Gross-Camp, Kebede and McGuire2014). However, our findings also suggest that increased value of land can have negative consequences for the landless poor and smallholders. The land they used to access for free or at low cost can now be used by the owners to maximize their benefits from PES. German et al. (Reference German, Ruhweza, Mwesigwa, Kalanzi, Tacconi, Mahanty and Suich2011) also report that access to land among the landless was reduced as a result of the expansion of forest carbon sequestration in the Trees for Global Benefits Programme in the Bushenyi District in Uganda. The Cinadau PES program in Indonesia had similar outcomes (Leimona et al., Reference Leimona, Pasha, Rahadian, Tacconi, Mahanty and Suich2010).
Indirect benefits of the EPWS program included increased capacity, skills and knowledge of participants and improved access to information. These impacts have also been reported from other programs. For example, in Mexico's PES programs, the training offered increased conservation awareness and created new skills such as program design and seeking of funding among participants (Corbera, Reference Corbera, Tacconi, Mahanty and Suich2010). Because of regular interaction with NGO staff and researchers, program participants in the Cidanau PES program in Indonesia were found to be more aware of environmental issues such as causes of erosion, downstream sedimentation, erosion prevention and the role of trees in water and soil conservation than non-participants (Leimona et al., Reference Leimona, Pasha, Rahadian, Tacconi, Mahanty and Suich2010).
We also found that raising awareness about PES is vital because poor understanding of it raised concerns and delayed enrolment in the EPWS program. The fears of land confiscation and relocation and uncertainty about the ownership of trees demonstrated poor understanding of the PES concept. These findings have been echoed in other studies such as that of Robertson and Wunder (Reference Robertson and Wunder2005) in the Los Negros River Watershed, which indicated that farmers did not trust PES initiatives implemented in their area. Limited understanding of PES made some farmers interpret cash payments as covert attempts to buy their land (Leimona et al., Reference Leimona, Pasha, Rahadian, Tacconi, Mahanty and Suich2010).
Improved trust among the program participants and internal and external networks were demonstrated as other important benefits of the EPWS program. The EPWS program's choice of establishing new, and strengthening the capacity of existing, local-level institutions through formation of farmer groups and internal and external visits and training helped to bring about the above outcomes (Lopa et al., Reference Lopa, Mwanyoka and Jambiya2012). Research on other programs has shown that PES have enhanced cohesion in communities and expanded farmer networks beyond the community (Bartels et al., Reference Bartels, Schmink, Arcos, Borges, Duarte, Tacconi, Mahanty and Suich2010; Tacconi et al., Reference Tacconi, Mahanty and Suich2010; Hejnowicz et al., Reference Hejnowicz, Raffaelli, Rudd and White2014). Extended networks have been found to reduce household vulnerability and enhance welfare of the poor, both in terms of empowerment and poverty alleviation (Pagiola et al., Reference Pagiola, Arcenas and Platais2005; Wunder, Reference Wunder2008; Hejnowicz et al., Reference Hejnowicz, Raffaelli, Rudd and White2014). Moreover, improvement and establishment of local institutions such as farmer groups as shown in this study have been considered to reduce the transaction costs of a PES program when activities and payments are distributed in groups (Bartels et al., Reference Bartels, Schmink, Arcos, Borges, Duarte, Tacconi, Mahanty and Suich2010; Tacconi et al., Reference Tacconi, Mahanty and Suich2010).
6. Conclusion
We have examined the direct and indirect financial and non-financial livelihood impacts of the EPWS program. Our findings demonstrate that, while cash payments to participants in return for the adoption of SLM practices are important, other benefits such as training and the introduction of improved agricultural practices, improved seeds, animal manure, and high value crops and various local workshops and training are also substantial. Together they resulted in increased crop yields, value of land and employment opportunities as well as stronger institutions, increased trust, expanded internal and external networks, increased knowledge of farmers and capacity in farming, and leadership and business. These impacts are transferable assets which can underpin activities outside the PES program and thus offer potential to enhance rural development.
The perceived increase in the value of land resulted in higher land rents and reduced the availability of land, thus reducing access to land by the landless and the poor. This finding calls for greater attention to the pro-poor design of PES programs implemented on agro-ecosystems. Furthermore, there is room for more research on how the landless and smallholders cope with increased land rent and reduced access to land, to establish, for example, to what extent increased employment opportunities could compensate for reduced access to land. Given the limited research and recent implementation of PES programs on agro-ecosystems in developing countries, more research is also needed to fully understand the effectiveness of these programs to deliver ecosystem services and improve rural livelihoods.


