


1. Introduction
Globally, Agriculture is facing increased challenges due to climate change. Vulnerability to climate change in the form of climate extremes is likely to increase in the future (World Bank, 2013). Crop cultivation has become more vulnerable under changing global climate (Kumar and Parikh, Reference Kumar and Parikh2001), especially in developing countries that face frequent exposure to climate extremes. The economic impact of climate change varies around the world, and the ability to adapt differs across various regions (Taraz, Reference Taraz2018). Compared to other extreme events, droughts account for the majority of agricultural production risk in India (Cole et al., Reference Cole, Giné, Tobacman, Topalova, Townsend and Vickery2013; Birthal et al., Reference Birthal, Negi and Hazrana2019). Prolonged and frequent droughts significantly impact crop productivity in the country (Pandey et al., Reference Pandey, Bhandari and Hardy2007; Auffhammer et al., Reference Auffhammer, Ramanathan and Vincent2012; Birthal et al., Reference Birthal, Negi, Khan and Agarwal2015; Fontes et al., Reference Fontes, Palmer and Gorst2020).
A sizable yield gap exists in several crops across the world (Lobell et al., Reference Lobell, Cassman and Field2009). Global yield variability is mainly a result of nutrient management, water management, and climatic factors (Mueller et al., Reference Mueller, Gerber, Johnston, Ray, Ramankutty and Foley2012). The impact of the first two factors on agricultural productivity is magnified in the presence of climatic shocks because it can influence the adoption of soil and water management practices (Birthal and Hazrana, Reference Birthal and Hazrana2019). Numerous studies on nutrient management have provided evidence that fertilizer is one of the critical inputs to increase crop yield across the world (McArthur and McCord, Reference McArthur and McCord2017). Further, fertilizer use can play an essential role in adapting to changing climate and weather variability (Kumar and Parikh, Reference Kumar and Parikh2001).
Thus, the application of chemical fertilizer can affect agricultural production in two ways: first, through the pathway of nutrient management to bridge the yield gap; and second, it can act as a coping or production optimisation mechanism to counter risks posed by climatic extremes. Concerning changes in rainfall patterns, existing studies have shown both positive and negative associations of fertilizer adoption under rainfall variability (Alem et al., Reference Alem, Bezabih, Kassie and Zikhali2010; Dercon and Christiaensen, Reference Dercon and Christiaensen2011; Heisse and Morimoto, Reference Heisse and Morimoto2019).
Linkages between climatic shocks and chemical fertilizer use in India is not well studied. To the best of our knowledge, only studies by Selvaraj and Ramasamy (Reference Selvaraj and Ramasamy2006) and Pandey et al. (Reference Pandey, Bhandari and Hardy2007) have investigated this aspect and compared the effect of chemical fertilizer on crop yields in normal and drought years. Selvaraj and Ramasamy (Reference Selvaraj and Ramasamy2006) observed that fertilizer inputs did not significantly impact crop yield in drought-affected years in the Indian State of Tamil Nadu. However, in a normal year, application levels of chemical fertilizer positively impacted crop productivity. Very few prior empirical studies investigate how fertilizer use is affected by climatic shocks (notable exceptions are Kusunose et al. (Reference Kusunose, Mason-Wardell and Tembo2020) and Jagnani et al. (Reference Jagnani, Barrett, Liu and You2021)).
Against this backdrop, our paper attempts to assess the relationship between fertilizer use and water availability (measured through rainfall and irrigation) in the context of existing research gap. The study empirically analyses the impact of rainfall shocks on fertilizer use in India. An econometric investigation is carried out to provide estimates of changes in the levels of fertilizer use due to rainfall shocks. The first and primary objective of this paper is to analyse how intensity of fertilizer use varies with climate-related shocks. The second objective is to understand the impact of drought intensity (adverse shocks) on the amount of fertilizer application. This work adds to the knowledge pool that deals with formulating strategies to insulate agricultural productivity and income from climate variability and extremes. We contribute to the emerging climate-economy literature by evaluating how climatic extremes can affect productive farm investments such as fertilizer using long-term district-level panel data.
The paper presents three key findings. First, a greater area under irrigation and good annual rainfall positively contribute to the levels of fertilizer use. Secondly, fertilizer application rates are not significantly different for contemporaneous positive or negative rainfall shocks in India. Lastly, exposure to drought in the previous year is likely to result in lower usage of fertilizers in the current year. However, more intense droughts during the previous year can increase the amount of fertilizer consumption at the district level in the current year.
The remainder of this paper is organized as follows. Section 2 provides background about chemical fertilizer application in India. This section also reviews the literature focusing on the role of weather and climatic extremes in determining fertilizer consumption. Data and empirical approaches are outlined in section 3. Section 4 presents the results and robustness checks. Section 5 summarises and discusses the results, and section 6 provides concluding remarks.
2. Background and analytical framework
2.1 Chemical fertilizer use in Indian agriculture
In 2015–16, India consumed 25,576 thousand tonnes of chemical fertilizers, averaging 128 kg per hectare of crop area (Government of India, 2017). The consumption of fertilizer has increased substantially, from 69 thousand tonnes during 1950–51. Fertilizer consumption increased rapidly after the start of green revolution in the late 1960s (Chand and Pandey, Reference Chand and Pandey2009; Sharma and Thaker, Reference Sharma and Thaker2011). However, it became sluggish during the mid-1970s due to the crude oil crisis. Nevertheless, the growth in fertilizer consumption recovered and increased till 1990–91 (Sharma and Thaker, Reference Sharma and Thaker2011). After 1991, a progressive slowdown in the growth of fertilizer consumption occurred, but signs of renewed consumption were observed from 2003–04 (Chand and Pandey, Reference Chand and Pandey2009; Chand and Parappurathu, Reference Chand and Parappurathu2012).
Higher consumption rates of fertilizer are skewed towards some regions within India characterised by improved irrigation and intensive cultivation practices (Chand and Pandey, Reference Chand and Pandey2009; Sharma and Thaker, Reference Sharma and Thaker2011; Ghosh and Dey, Reference Ghosh and Dey2014). These regions include several districts of Punjab, Haryana, Western Uttar Pradesh, and Andhra Pradesh (Raghavan, Reference Raghavan2008). On the contrary, total chemical fertilizer consumption is relatively low in several parts of eastern India, namely the States of Assam, West Bengal and Odisha (Venugopal, Reference Venugopal2004; Birner et al., Reference Birner, Gupta and Sharma2011). Figure A1 in the online appendix illustrates the difference in fertilizer consumption per hectare across various regions of India. We have observed a gradual increase in consumption rates of chemical fertilizer across all the areas since 1966. Still, region-wise heterogeneity continued to remain over the years.
In terms of the cost of cultivation, fertilizer cost is an important component of total input cost. Srivastava et al. (Reference Srivastava, Chand and Singh2017) show that the share of fertilizer cost in total paid-out cost hovered around 11–12 per cent from 1990–91 to 2014–15. Although the cost-share remains constant, fertilizer cost per hectare has risen since 1970–71 (Raghavan, Reference Raghavan2008). Fertilizer prices are connected to the price policy of particular chemical fertilizers. Different subsidies can lead to changes in relative prices of different types of fertilizers. For example, the divergence between nitrogenous fertilizers and other macro-nutrients (phosphorus and potassium) has widened after the decontrol of fertilizer prices in India in 1992 (Venugopal, Reference Venugopal2004; Chand and Pandey, Reference Chand and Pandey2009). India introduced a nutrient-based subsidy scheme in 2010. Although it aims to promote balanced use of nutrients, the price disparity between nitrogenous fertilizer and other macro-nutrients widened sharply after its implementation (Gulati and Banerjee, Reference Gulati and Banerjee2015).
Higher yields and profitability due to mineral fertilizer application have been demonstrated in past studies (FAO, 2005). However, fertilizer consumption in India is highly varied across regions. India has witnessed an overall increase in fertilizer consumption over the last six decades. Hence, it would be worthwhile to analyse how fertilizer application varies in response to weather anomalies that impact crop productivity.
2.2 Weather, climate extremes and fertilizer use
The literature on the impact of droughts on crop productivity is still emerging. These studies highlight the adverse effects of droughts on crop productivity in India (for example, Auffhammer et al., Reference Auffhammer, Ramanathan and Vincent2012; Kumar et al., Reference Kumar, Joshi and Aggarwal2014; Birthal et al., Reference Birthal, Negi, Khan and Agarwal2015; Fontes et al., Reference Fontes, Palmer and Gorst2020). Some recent studies checked the effectiveness of adaptation pathways against climatic shocks. Birthal et al. (Reference Birthal, Negi, Khan and Agarwal2015) and Zaveri and Lobell (Reference Zaveri and Lobell2019) have demonstrated gainful impacts of irrigation against droughts and heat stress in India, respectively. Similarly, Birthal and Hazrana (Reference Birthal and Hazrana2019) find long-run benefits of crop diversification as an adaptation strategy for climatic shocks. Several empirical studies have explored the relationship between crop yield and inputs, such as rainfall (Gupta et al., Reference Gupta, Sen and Srinivasan2014; Pattanayak and Kumar, Reference Pattanayak and Kumar2014; Powell and Reinhard, Reference Powell and Reinhard2016; Murari et al., Reference Murari, Mahato, Jayaraman and Swaminathan2018), irrigation (Birthal et al., Reference Birthal, Negi, Khan and Agarwal2015), fertilizer (McArthur and McCord, Reference McArthur and McCord2017), and labour and wages (Mahajan, Reference Mahajan2017; Emerick, Reference Emerick2018).
The sensitivity of the crop yields to climate rely on one or more inputs limiting physical production under climatic stress. Agronomic and soil science literature provide a firm scientific insight on the subject. Among bio-physical inputs, water and nutrient availability are crucial for crop growth. A synergetic relationship is involved between soil-nutrient uptake and water availability. Water-use efficiency can be enhanced by the availability of macronutrients such as nitrogen and phosphorus through crop root development. Similarly, nutrient-use efficiency is dependent on soil moisture availability.Footnote 1 Under drought conditions, these intricate relationships become more complicated, and crop systems can simultaneously turn deficient in water and soil nutrients (Karim and Rahman, Reference Karim and Rahman2015; Plett et al., Reference Plett, Ranathunge, Melino, Kuya, Uga and Kronzucker2020).
These broad agronomic relationships hold in several socio-economic studies done around the world. Conventionally, rainfall is used as an indicator of moisture availability. Precipitation favours a higher quantity of fertilizer application (Kaliba et al., Reference Kaliba, Verkuijl and Mwangi2000; Alem et al., Reference Alem, Bezabih, Kassie and Zikhali2010; Haider et al., Reference Haider, Smale and Theriault2018). The decision to use fertilizer is positively associated with a higher amount of precipitation received in the previous years (Heisse and Morimoto, Reference Heisse and Morimoto2019). In contrast, Nyssen et al. (Reference Nyssen, Biruk, Tesfamariam, Frankl, Demissie, Ghebreyohannes, Meaza, Poesen, Van Eetvelde, Zenebe and Deckers2017) find a negative correlation of average annual rainfall with the quantity of fertilizer purchased in northern Ethiopia. In Nigeria, low rainfall has encouraged the adoption of fertilizer and application in higher doses (Takeshima and Nkonya, Reference Takeshima and Nkonya2014). Past studies on India show lower fertilizer application in deficient rainfall years (Nagaraj, Reference Nagaraj1983; Mohanam, Reference Mohanam2002).
Risk-coping literature provides an analytical understanding of fertilizer use responses to climate extremes. Pandey et al. (Reference Pandey, Bhandari and Hardy2007) have given a detailed summary of drought-coping mechanisms by farmers. They have classified coping strategies into two broader groups: (i) ex-ante (income smoothing) and (ii) ex-post (consumption smoothing).
Ex-ante mechanisms target risk reduction through portfolio diversification and production decision-making changes. Altering fertilizer doses might be regarded as such change under flexible decision making. Risk and uncertainty related to weather are among the reasons for the high-intensity application of inorganic fertilizer (Babcock, Reference Babcock1992; Lamb, Reference Lamb2003; Paulson and Babcock, Reference Paulson and Babcock2010; Sheahan and Barrett, Reference Sheahan and Barrett2014). Past studies opine that nitrogen is perceived as risk-reducing input, even by risk-neutral farmers (SriRamaratnam et al., Reference SriRamaratnam, Bessler, Rister, Matocha and Novak1987; Babcock, Reference Babcock1992). A few studies have evaluated rainfall risks and uncertainties from farm/household datasets and measured the risk by variability in rainfall received. Rainfall variability can negatively impact the decision to use fertilizers and lower fertilizer use in Ethiopia (Alem et al., Reference Alem, Bezabih, Kassie and Zikhali2010). However, Heisse and Morimoto (Reference Heisse and Morimoto2019) find a positive association between the adoption of chemical fertilizer and rainfall variability among Tanzanian maize farmers.
Crop insurance is an effective risk-reducing mechanism. The adoption of crop insurance in India is substantially low (Aditya et al., Reference Aditya, Kahan and Kishore2018). In the absence of formal channels of crop insurance, higher application rates can serve as a partial risk insuring mechanism. Below and Brandau (Reference Below and Brandau2001) document the application of higher doses of fertilizer as a cheap form of insurance. Crop insurance literature also provides insights into how farmers can change input use when crop insurance is available. Yu and Hendricks (Reference Yu and Hendricks2020) reviewed the existing studies and suggested that crop insurance can positively and negatively affect input use. Babcock and Hennessy (Reference Babcock and Hennessy1996) and Mishra et al. (Reference Mishra, Nimon and El-Osta2005) find evidence of reducing fertilizer use if farmers adopt revenue insurance. A recent study by Yu and Hendricks (Reference Yu and Hendricks2020) links input use decisions with information on growing conditions or forecasts. They show that farmers apply more inputs when the forecast predicts a good crop harvest but reduce the input application if the weather forecast is bad.
Several perception-based studies also highlight the increase in fertilizer rate as one of the coping strategies in response to climate change as reported by farmers (Wood et al., Reference Wood, Jina, Jain, Kristjanson and DeFries2014; Khanal et al., Reference Khanal, Wilson, Hoang and Lee2018). Chen and Gong (Reference Chen and Gong2021) show that extreme heat reduces the quantity of fertilizer use in both the short and long run. Disease incidence due to unfavourable climate may accentuate plant protection costs. Jagnani et al. (Reference Jagnani, Barrett, Liu and You2021) find evidence of lowering fertilizer investment because of the increased plant protection cost. However, it is tough to single out coping strategies as they are adopted in bundles.
Ex-post strategies deal with the losses due to shocks after the event. Reduction in production and income due to droughts can lead to lower investment in agriculture in the following years. Lowering the quantity of fertilizer in the subsequent years after a drought can be an ex-post response. Dercon and Christiaensen (Reference Dercon and Christiaensen2011) explain that low rainfall can be perceived as a consumption risk in the absence of insurance, resulting in lower fertilizer adoption decisions in Ethiopia. Given the high cost of chemical fertilizer, farmers can amend fertilizer consumption due to shocks. Nevertheless, the expected direction of change in fertilizer use is not clear from the literature. A reduction in fertilizer consumption due to negative climatic shock seems more plausible under existing economic explanations.
In addition, several other factors can be associated with fertilizer adoption and application rates. Irrigation can safeguard yield in a moisture shortage period. As yield response is a function of the interaction between fertilizer and water availability, irrigation complements nutrient management (Nagaraj, Reference Nagaraj1983; Kurosaki and Wada, Reference Kurosaki and Wada2015). Similarly, other biophysical and technological factors such as soil type, cropping intensity and high-yielding varieties can influence fertilizer application (Parikh, Reference Parikh1978; Nagaraj, Reference Nagaraj1983). The ratio of output price of crop to the price of fertilizer required to produce one unit is an essential economic factor in determining per unit consumption (Sharma and Thaker, Reference Sharma and Thaker2011). Institutional factors such as tenancy (Bharadwaj, Reference Bharadwaj1974; Vaidyanathan, Reference Vaidyanathan2010), credit availability (Nagaraj, Reference Nagaraj1983; Croppenstedt et al., Reference Croppenstedt, Demeke and Meschi2003), and extension services (McArthur and McCord, Reference McArthur and McCord2017) are other associated factors driving the level of fertilizer use. Nonetheless, the list of factors is not exhaustive, and there might be several other factors.Footnote 2 Moreover, there can be several interactions among the factors, which are not mutually exclusive.
This study focuses on technological and physical factors that determine fertilizer application in India, with a particular focus on rainfall shocks. We confine this study to evaluating changes in fertilizer application under water stress conditions. Following the standard climate impact on agriculture literature (Auffhammer et al., Reference Auffhammer, Ramanathan and Vincent2012; Birthal et al., Reference Birthal, Negi, Khan and Agarwal2015; Fontes et al., Reference Fontes, Palmer and Gorst2020), we assess the changes in the quantity of fertilizer when exposed to different intensities of rainfall shocks with varying levels of irrigation.
3. Data and methodology
3.1 Data source
The study uses district-level panel data on the agricultural and climatic (rainfall) variables from 1966 to 2009. The dataset, compiled by the International Crops Research Institute on Semi-Arid Tropics (ICRISAT) and Tata-Cornell Institute (TCI), is known as the District Level Database for India (DLD-India) (ICRISAT-TCI, 2015). As several districts are bifurcated into smaller districts during the period of the study, district boundaries are apportioned to the original 1966 district boundaries. The States whose data are used for analysis are Andhra Pradesh, Assam, Bihar, Chhattisgarh, Gujarat, Haryana, Himachal Pradesh, Jharkhand, Karnataka, Kerala, Madhya Pradesh, Maharashtra, Orissa, Punjab, Rajasthan, Tamil Nadu, Telangana, Uttar Pradesh, Uttarakhand and West Bengal.Footnote 3 The data are available for these 20 States of India from 1966 to 2015. However, our analysis is restricted to 311 districts over 44 years.Footnote 4 Our study period ends in 2009 because India introduced a nutrient-based subsidy scheme in 2010.
The first part of the investigation uses DLD-India data on fertilizer consumption (measured in tonnes of nitrogenous, phosphorous and potassic fertilizer) and information on other variables such as gross cropped area (in hectares), gross irrigated area (in hectares), the area under high-yielding varieties (HYV) (in hectares), and cropping intensity (in per cent). We use weather variables such as annual rainfall (in millimetres) and monsoon rainfall (in millimetres) in the study. Data on all the agricultural and climatic variables are recorded for all crops at the district level. Lack of crop-disaggregated data, especially for fertilizer consumption, is an essential limitation of the study.
3.2 Variable construction
Using agricultural variables, we construct two variables related to the total consumption of fertilizer and irrigation intensity for the district. First, we compute the total consumption of chemical fertilizer (in kg per hectare) by aggregating the consumption of nitrogenous (N), phosphorous (P), and potassic (K) fertilizers and then dividing it by the gross cultivated area (GCA). Secondly, the extent of irrigation is measured as a share of gross irrigated area in the GCA, and we express it in percentage. Table 1 provides summary statistics of key variables of interest.
Table 1. Summary statistics and definition of variables, 1966–2009

Notes: Unit of analysis is district. Full set of descriptive statistics is available in table A1 (online appendix).
Source: Author's calculations.
Rainfall shocks are captured in two ways. First, we create a categorical variable for rainfall shocks by following Yu and Babcock (Reference Yu and Babcock2010). Our study does not include the temperature component as in the original article. We denote the discrete measure as Rainfall Shock 1 (RS1) and construct it using equation (1). We compute the standardized deviation of total rainfall from its long-term normal and express it as total rainfall deviation (TRD)Footnote 5:

where subscripts i and t denote district and time, respectively. TR is the total rainfall, and sd(TR) is the standard deviation of annual rainfall. To categorise RS1 as a negative and positive shock, we use the following criterion: (i) positive rainfall shock if TRD > 0; and (ii) negative rainfall shock if TRD < 0. Secondly, we construct a continuous precipitation-based measure for negative shocks, also denoted as drought index (DI). This variable can quantify the intensity of drought. We create it by separating negative shock years from TRD, as outlined in equation (2):

A similar precipitation-based drought measure was used by earlier studies such as Auffhammer et al. (Reference Auffhammer, Ramanathan and Vincent2012) and Amare et al. (Reference Amare, Jensen, Shiferaw and Cissé2018). Our DI ranges from 0 to 3.77 (table 1). The main limitation in quantifying drought by this category of indices is the non-inclusion of temperature because the results of any analysis can be sensitive to the definition of drought (Fontes et al., Reference Fontes, Palmer and Gorst2020). However, the advantage of this measure lies in the simplicity of construction and its representativeness of meteorological drought. Since water availability is a key factor for nutrient uptake from the soil, the research is confined to examining water and fertilizer response.
4. Effect of rainfall shocks on fertilizer
4.1 Effect of rainfall shocks
Before investigating the impact of rainfall shocks on fertilizer use, we examine the relationship between water availability and fertilizer use. The amount of available soil moisture is not directly obtained; irrigation and annual rainfall are used as proxies. As per prior studies, a positive relationship between water availability and fertilizer use is expected. We reconfirm a similar association, irrigation and annual rainfall emerge as positive contributors to fertilizer use (table A2, online appendix). Given the sensitivity of fertilizer consumption to moisture availability, we anticipate a similar change in fertilizer consumption in response to rainfall shocks.
The analysis to evaluate the effect of rainfall shock on fertilizer consumption is carried out in two ways. First, we compare the average amount of fertilizer consumed in each rainfall shock category of RS1 measure. Table 2 highlights the occurrence of different types of rainfall shocks and relative fertilizer consumption. Nearly 47 per cent of observations are excess rainfall years, and 53 per cent are negative shock years. Table 2 shows that in comparison to positive shock years, fertilizer consumption is 3 kg per hectare more during rainfall deficit years. However, we could not visually find any glaring differences in the distribution between the categories from the density plot (figure A2, online appendix).
Table 2. Distribution of different levels of rainfall shocks and average fertilizer use, 1966–2009

Note: Rainfall shock status corresponds to RS1 measure.
Source: Author's calculations.
Secondly, we empirically investigate how rainfall shock affects the quantum of chemical fertilizer application. Equation (3) specifies the model to investigate the heterogeneous effect of rainfall status on fertilizer consumption:

where $\text{NP}{\text{K}_{it}}$ is fertilizer consumption (NPK) in kg/ha; $\text{IR}{\text{R}_{it}}$
 is irrigation intensity defined as the proportion of gross irrigated area over the gross cropped area; i denotes districts; t denotes time; and d and δ are the district and time fixed effects, respectively. Trend variable is the linear state-specific trend, where s denotes States. We also use two additional controls for HYV area (HYV) and cropping intensity (CI).
In a rainfall-deficient year, farmers are more likely to get a bad harvest, resulting in a low ability to reinvest in successive seasons. So, a one-year lag of rainfall shock is included in this model. Dercon and Christiaensen (Reference Dercon and Christiaensen2011) and Heisse and Morimoto (Reference Heisse and Morimoto2019) also used a similar specification for Ethiopia and Tanzania, respectively. As the unit root is not a problem in this panel for any of the concerned variables, we proceed with modelling the effects (table A3, online appendix). We use a Fisher-type unit root test because the panel is unbalanced. Since our fixed effect regression estimates suffer from the problem of heteroskedasticity and serial correlation, we compute two-way clustered standard errors for all the estimations. First, to allow for heteroskedasticity and serial correlation, clustering is done within districts across years. Second, within a State (region) by year clustering is followed to account for spatial auto-correlation. Fishman (Reference Fishman2016) followed a similar strategy of two-way clustering.
Table 3 shows the coefficients and standard errors of the model as specified in equation (3) for the log-level specification. Presence of irrigation positively and significantly influences fertilizer consumption. We do not find any significant change in fertilizer consumption due to a change in the current year rainfall shock from excess to negative. However, change in the previous year rainfall status from positive to negative shock significantly changes the level of fertilizer consumption. A deficient previous year rainfall reduces fertilizer consumption by 4.1 per centFootnote 6 compared to a positive previous year rainfall shock (column 3). The magnitude of the effect persists at a similar level even after the inclusion of two control variables, HYV area (column 4) and cropping intensity (column 5).Footnote 7 The sign of the coefficient of the interaction term with irrigation and current rainfall status is non-significant (table A4, online appendix). In terms of average marginal effects, negative shocks in the present and the preceding year can lower fertilizer consumption by 3 and 4 per cent, respectively (column 5).
Table 3. Estimated regression coefficients for effects of irrigation and different levels of rainfall shock (RS1) on the rate of fertilizer consumption, 1966–2009
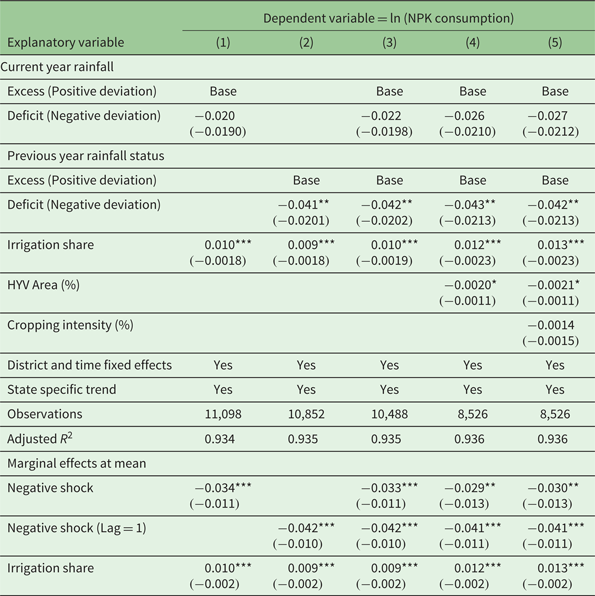
Notes: ***, **, and * indicate levels of significance at 1, 5 and 10%, respectively. Two-way clustered standard errors (district and state × year) are reported in the parenthesis. Full results are available in table A4 (online appendix).
Source: Author's calculations.
It could be erroneous to assume all deviations from the long-term normal are shocks and classify them as weather anomalies. We redefine rainfall anomalies under a three-way classification by adding a normal category to test for sensitivity. We outline two methods to classify normal rainfall years along with rainfall shock years. First, we define a new rainfall shock variable RS2 under the following classification: (i) positive rainfall shock if TRD≥ + 1; (ii) normal if TRD is between −1 and + 1; and (iii) negative rainfall shock if TRD ≤−1.Footnote 8 Secondly, we use the definition provided by the Indian Meteorological Department (IMD) for rainfall anomalies to construct our rainfall shock ‘RS3’ variable. According to the IMD, annual rainfall deviation (ARD) is expressed as:
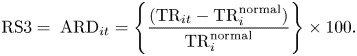
Similar to equation (1), TR is the annual rainfall, and TR (normal) is the long-term rainfall in the district. Anomalies are characterised based on the following cut-off: (i) normal year if ARD is between −20% to +20%; (ii) positive rainfall shock if ARD ≥+ 20%; and (iii) negative rainfall shock if ARD ≤−20%. Pandey et al. (Reference Pandey, Bhandari and Hardy2007) used a similar definition of drought in their analysis.
Table A5 (online appendix) presents the results of the new classifications. Columns 1 and 2 correspond to the results of RS2, and we reconfirm the adverse effects of the previous year rainfall shock. The IMD-based rainfall shock (RS3) definition also yields similar results (columns 3 and 4). The reduction effect is found to be more extensive compared to the previous two definitions. The use of the same cut-off across all the districts to define negative shock could be the reason for the higher effect.
The results from the above analysis do not provide sufficient evidence to predict the direction of the relationship between the level of fertilizer use and the current year rainfall status. No change in concurrent fertilizer use signifies that fertilizer is less likely to be used for ex-ante production risk management in our sample. Nonetheless, we find a robust negative effect of rainfall shock in the previous year on fertilizer application per hectare. The importance of irrigation as a determinant is certain. However, we do not find any significant effect of an increase in irrigated area impacting the level of fertilizer use when a district is exposed to rainfall shocks. A further analysis is required to investigate the differential impact of the intensity of droughts (negative deviation) on investment in fertilizer.
4.2 Effect of droughts
Equation (5) provides a basic specification to model the effect of drought on fertilizer use:

here, the DI is a continuous variable defined in equation (2). A continuous variable gives more flexibility than the earlier categorical variable of rainfall shock. The coefficient of the squared term can be interpreted as the impact of high-intensity droughts. We compute a panel fixed effects model for linear and log-linear specifications. Our specifications continue to include HYV area and cropping intensity as controls.
The following are highlights of the results shown in table 4. First, the reduction in the quantity of fertilizer applied is not conclusive for contemporaneous drought shock; coefficients are only significant for log-linear specification in column 4.Footnote 9 Secondly, previous year drought shocks significantly lower fertilizer consumption. A one unit increase in past drought intensity can reduce per hectare NPK consumption by 10 per cent (column 4). Thirdly, this relationship turns positive at a higher level of drought exposure. Finally, the magnitude of reduction in fertilizer is higher in response to the previous year than the current-year drought.
Table 4. Estimated regression coefficients for effects of irrigation and drought intensity (DI) on the rate of fertilizer consumption, 1966–2009

Notes: ***, ** and * indicate levels of significance at 1, 5 and 10%, respectively. Two-way clustered standard errors (district and state × year) are reported in the parentheses. Full results are available in table A6 (online appendix).
Source: Author's calculations.
The average marginal effects show that the negative effect of past drought shock on fertilizer application is 1.3 percentage points more than the current (see estimates of log-linear specification of marginal effects in table 4). We obtain similar results even after changing state-specific trend variables by district-specific linear time trend (table A7, online appendix). As irrigation is perceived as the best-adapting strategy against droughts, we use the interaction of irrigation with drought to study the effect in different levels of irrigation. Similar to section 4.1, we find a significant effect of the area under irrigation for NPK consumption (online appendix table A6). We fail to ascertain any positive effect of irrigation in lowering the impact of droughts on fertilizer consumption.
We find a significant negative relationship between previous droughts at the district level on the current year fertilizer application rates. Figure 1 represents the predicted relationship between NPK consumption and drought levels (current and previous year) at a 95 per cent confidence interval (based on column 2 of table 4). On both occasions, the curve is convex. The curves are negative sloping at the beginning until DI = 1, then a reversal of the relationship occurs. Following the SPI classification, we can categorise DI less than one as low-intensity droughts. Our results exhibit a negative response to low-intensity past droughts. However, moderate and severe droughts in the past induce higher application of fertilizer. In total, we find that incremental addition of NPK becomes higher with the severity of droughts.

Figure 1. Predicted level of NPK fertilizer consumption by changing levels of drought (current and previous year)
Source: Author's calculations.
4.3 Robustness checks
We check the robustness of our main results to alternative specifications and definitional change of drought variable. We test the robustness of our categorical rainfall shock variable to a few definitional changes in the latter part of section 4.1. Here, we focus on checking the robustness of fertilizer response to drought intensity results.
We begin by checking to see that changes in fertilizer use are not driven by changes in district gross cropped area. Iizumi and Ramankutty (Reference Iizumi and Ramankutty2015) point out that weather and climatic factors can influence all spheres of crop production, including crop area. Zaveri et al. (Reference Zaveri, Russ and Damania2020) find 9 per cent of cropland expansion on account of dry anomalies around the globe. Since our dependent variable is fertilizer consumption per hectare of gross cropped area, drought-induced cropland adjustment might be causing the change in our dependent variable. We find a reduction in the cultivated area if a district experiences drought in any given year (columns 1 and 2 in table 5). However, our estimates do not show any changes in the cultivated area on account of previous year exposure to droughts. We believe that climatic shocks can alter the extent of the planting area in a district. However, changes to fertilizer consumption cannot be entirely attributed to such changes.
Table 5. Estimated regression coefficients for effects of gross cropped area and drought intensity on rate of fertilizer consumption, 1966–2009

Notes: ***, ** and * indicate levels of significance at 1, 5 and 10%, respectively. Two-way clustered standard errors (district and state × year) are reported in the parentheses. Full results are available in table A8 (online appendix).
Source: Author's calculations.
We change our dependent variable to NPK consumption (tonnes) and include the gross cropped area as a covariate in the specification of equation (5). For the concurrent year drought effect, the reduction in total consumption of fertilizer is valid only for the log-linear specification. The negative effect of previous year drought shock is still persistent (table 5). Reversal of the relationship at higher levels of past drought is equally significant. The magnitude of reduction remains at a similar level of about 10 per cent (column 4, table 5).
The second set of evidence of the robustness of our results is related to consumption of nitrogenous fertilizer. In terms of cost, the price of nitrogenous fertilizer (e.g., urea) is the lowest among the three macronutrients as a result of subsidies. Because of the subsidised price of nitrogenous fertilizers, only a small increase in their prices occurred in the study period. We do not expect changes in price because of any climatic adversaries. Since nitrogen is consumed in higher quantities, we expect a possible change in the amount of N-fertilizer application to reduce the overall cost of cultivation. Columns 1 and 2 of table A9 (online appendix) present the estimated coefficients of previous year drought shocks on nitrogen consumption. Our earlier assessment about the reduction in NPK fertilizer application remains valid for nitrogenous fertilizer as the dependent variable. The negative effect is slightly less for nitrogenous fertilizer (about 8 per cent) than the overall results from the baseline specification. A higher application of nitrogenous fertilizer is also observed for high-intensity droughts but it is non-significant in the log-linear specification. An increase in irrigation share contributes to about a 1.2 per cent increase in nitrogenous fertilizer (similar to earlier estimates in the main specification).
Thirdly, we change our assumption that any shortfall in annual rainfall is driving the relationship. The productivity of several crops is dependent on the sufficiency of monsoon rainfall, so we modify the DI to be based on monsoon rainfall. We define monsoon rainfall as the total of rainfall in June, July, August, and September. Table A9 (columns 3 and 4) presents regression results based on our new monsoon DI. A similar response to a one-year lag monsoon drought shock is observed on fertilizer application (about 10.6 per cent reduction). The relationship continues to be convex. In comparison to annual drought, we find a slightly higher effect of monsoon drought in reducing the fertilizer application. The current year monsoon drought shock produces inconsistent findings for linear and log-linear specification, and we fail to assert any effect conclusively.
4.4 Estimates based on agro-ecological regions
Previous assessments of climatic impacts on agricultural productivity show differential magnitude of adverse effects by agro-climatic regions (Mall et al., Reference Mall, Singh, Gupta, Srinivasan and Rathore2006; Barnwal and Kotani, Reference Barnwal and Kotani2013; Murari et al., Reference Murari, Mahato, Jayaraman and Swaminathan2018). Aggarwal and Mall (Reference Aggarwal and Mall2002) demonstrate that yield sensitivity to climate change varies over agro-environments for irrigated rice in India. Based on the crop simulation model, the study highlights that climate sensitivity would be higher for the southern and eastern regions of India. However, the same research finds that the magnitude of sensitivity varies with nitrogen management levels. Keeping heterogeneity of climate in mind, we further disaggregate our analysis by agro-ecological regions (AERs). This exercise aids us in delineating our national-level results by agro-climatic regions.
DLD-India database classifies Indian districts into four AERs based on length of growing period (LGP) and temperature.Footnote 10 We can evaluate the differences in mean drought exposure and its ranges from table A10 (online appendix). Although the mean DI over the years looks very similar, the range of drought intensity differs considerably across the regions. The average fertilizer application is distinctively dissimilar by region, and we expect a differential response to drought exposure within each region. The highly input-intensive part of northern India falls into the semi-arid temperate region classification. From the climate sensitivity point of view, semi-arid tropics and arid areas are very important as these regions experience long-lasting exposure to drought conditions.
Our split-sample analysis for different agro-climatic regions produces mixed results. For consistency, we focus only on the effect of past droughts on fertilizer consumption. Previous year drought exposure in the districts of semi-arid temperate and semi-arid tropics negatively affect current year fertilizer consumption (table A11 and figure 2). The effect is highest in the semi-arid temperate region compared to other areas. We find a reduction of about 8 kg per hectare for a unit increase in drought exposure. At the mean level of DI (excluding DI = 0), our estimate shows a 4.7 and 3.4 per cent reduction for a 1 per cent increase in current and previous year DI, respectively (see marginal elasticity rows of column 2 of table A11). It is worth noting that the reduction is highest in the region where the intensity of chemical fertilizer application is highest. A much smaller but significant decrease of 2.7 kg per hectare is observed for semi-arid tropics. Figure 2 shows the predicted values of NPK consumption for different AERs. The arid region shows an exceptional pattern in contrast to all other regions. This region maintains a negative relationship throughout the range of drought intensity. The marginal elasticity (at mean) for lag DI is about −5.5 per cent. The difference in behaviour may be because frequent exposure to droughts reduces the capacity of farmers to reinvest in any productive inputs in arid districts.

Figure 2. Predicted level of NPK fertilizer consumption, by levels of drought (current and previous year), by AER
Source: Author's calculations.
5. Discussion
The results of the above sections can be summarised in several findings. First, fertilizer application levels are determined by rainfall and the area under irrigation in any particular year. Secondly, we do not find sufficient evidence of contemporaneous change in chemical fertilizer use due to negative rainfall shocks. Thirdly, with specific reference to droughts, the analysis finds a new pattern of fertilizer consumption. A low level of drought in the preceding year would lower the application rates, but higher levels of droughts contribute positively. Finally, previous year drought can exhibit a differential effect on fertilizer use by agro-climatic conditions.
As the central hypothesis is to check whether adverse shocks decrease fertilizer application, the results from the study are mixed. Insignificant reduction in chemical fertilizer application levels under negative shocks could be because farmers perceive fertilizer as a risk-reducing input and do not change their current investment portfolio. The results support the observation of Auffhammer et al. (Reference Auffhammer, Ramanathan and Vincent2012) who find that the non-weather variables (such as fertilizer and labour) are not sensitive to the weather conditions in India. In a different setting, Jagnani et al. (Reference Jagnani, Barrett, Liu and You2021) find a reduction in fertilizer use with warmer growing season temperatures for maize farmers in Kenya. In this case, the authors argue that farmers are diverting investment from productivity-enhancing technology, like fertilizer, to more defensive inputs such as pesticide and weeding. Katengeza et al. (Reference Katengeza, Holden and Fisher2019) find inconsistent effects for organic manure use in response to dry spells of the previous three years in Malawi for maize crop.
Our study finds a negative relationship between fertilizer use and previous year drought exposure. This pattern would probably mean a reduction in current year fertilizer expenditure because of the lower profitability caused by droughts in the last year. Dercon and Christiaensen (Reference Dercon and Christiaensen2011) also find that crop failure discourages the application of fertilizer in Ethiopia. Alem et al. (Reference Alem, Bezabih, Kassie and Zikhali2010) explain that favourable-rainfall years could relax the liquidity constraints for the next year, and farmers can afford fertilizer accordingly. Our findings can also be understood through these mechanisms, and productive investments appear to have been affected by bad harvests.
In the absence of district-level fertilizer price data, we could not convert our estimates to economic value terms. However, based on estimates of FAO (2005), we get a rough sense of the economic implications of our findings. For 2004–05, FAO (2005) estimates show an increase of 12 kg (or Rs 66 in value terms) of rice for an additional kilogram of nitrogen. Our estimated average marginal effect of the previous year drought shock is about 1.2 kg/ha of N. Certainly the mentioned estimates will differ widely across the regions, crops and year. A reduction in fertilizer application would reduce land productivity and farmers' income.
The phenomenon of increasing the amount of fertilizer usage when the district is exposed to severe drought conditions in the previous year is challenging to explain. With severe droughts resulting in higher yield loss in the previous year, farms might alter fertilizer application towards the higher side to safeguard production or in anticipation of higher yield in the subsequent period. The total number of moderate and high-intensity droughts is only about 14 per cent in our sample (table A12, online appendix), and low-intensity droughts (DI<1) account for most shocks (figure A3, online appendix). We could not corroborate the exact reasons from district-level analysis because of limitations of data availability.
A probable reason could be the higher application of fertilizer as a cheap form of insurance (as documented by Below and Brandau (Reference Below and Brandau2001)). We believe the increase in fertilizer application at high-intensity droughts is linked to the inability of smallholders to invest in irrigation infrastructure. Lack of ability to invest in fixed inputs by smallholders, particularly in irrigation, is a reason for the existence of an inverse (negative) relationship between farm size and inorganic fertilizer application rates in China (Wu et al., Reference Wu, Xi, Tang, Luo, Gu, Lam, Vitousek and Chen2018; Ren et al., Reference Ren, Jin, Wu, Zhang, Kanter, Wu, Xican, Zhang, Chen, Xu and Gu2021). The inverse relation also holds for Indian conditions, and fertilizer application rates are highest among smallholders compared to large farmers (Murari and Jayaraman, Reference Murari, Jayaraman, Swaminathan and Baksi2017). Past research in India indicates better access to irrigation by large landowning classes compared to smaller ones (Sarkar, Reference Sarkar2011; Srinivasan and Nuthalapati, Reference Srinivasan and Nuthalapati2019). Therefore, we made a possible connection that the convex relationship could be because of the behaviour of small and marginal farmers. Small farmers may try to compensate for costly inputs related to climatic adaptation (irrigation) with increased fertilizer application even after drought exposure. We select a sub-sample of Punjab and Haryana to test this hypothesis and check the drought-fertilizer application relationship (table A13, online appendix). The average size of operational area in these two States is among the highest across the States of India. The coverage of irrigation has been gradually increasing since the green revolution in this region. These two States have more than 85 per cent area under irrigation in the total cultivated area (figure A4, online appendix). The convex relationship does not hold for these two states. The absence of a convex relationship in this region with better irrigation infrastructure makes a probable case for fertilizer being used as a cheaper form of insurance against weather risks. Alem et al. (Reference Alem, Bezabih, Kassie and Zikhali2010) show a similar convex relationship and find higher chemical fertilizer use when rainfall variability or risk is very high.
The results of this study have implications for agricultural productivity, profitability, and environmental sustainability. Sustaining agricultural productivity under unfavourable climatic extremes has a broader impact on the poverty trap in a developing country like India. As observed by several other studies such as Birthal et al. (Reference Birthal, Negi, Khan and Agarwal2015) and Amare et al. (Reference Amare, Jensen, Shiferaw and Cissé2018), a negative association between crop yields and rainfall shocks is a reality in agriculture. However, crop yields are not substantially higher even when water is not a limiting factor in excess rainfall years in India (Gadgil and Gadgil, Reference Gadgil and Gadgil2006). Past studies find a higher negative effect of low rainfall on crop productivity in farmers' fields as compared to an agricultural research station. In contrast, the gain in crop yields by farmers is less in good monsoon years compared to the research stations in semi-arid tropics of India (Sivakumar et al., Reference Sivakumar, Singh and Williams1983). This asymmetry may be attributed to differences in input management between research stations and farmers' fields (mainly in terms of applying productive inputs like fertilizer and pesticides). Our study does not find any difference in application levels of fertilizer during adequate and deficient rainfall years. This finding points towards the inability of farmers to adequately invest in productivity-enhancing mechanisms to reap the benefit of a good monsoon.
Our region-disaggregated results show a pattern of increase in fertilizer application in the semi-arid temperate zone following any moderate and high-intensity drought. Given that some areas of this country are already using high levels of chemical fertilizer, any additional increase is not encouraging for the environment. On the contrary, in the arid region, where consumption of chemical fertilizer is at a lower level, any further reduction induced by climatic shock can have a negative consequence on soil fertility. As Kurosaki and Wada (Reference Kurosaki and Wada2015) document the prevalence of low gross value crops (e.g., pearl millet, sorghum, and other millets) in arid ecosystems, we can expect drought-coping mechanisms to be different in this region. Moreover, these crops are less responsive to fertilizers than rice and wheat. In harsh environments, weather shocks contribute to persistent poverty, and even affluent households are vulnerable (Gaiha and Imai, Reference Gaiha and Imai2004). However, the ability to cope with rainfall shock is contingent on wealth status, as demonstrated for semi-arid tropics of India (Rosenzweig and Binswanger, Reference Rosenzweig and Binswanger1993). Palmer-Jones and Sen (Reference Palmer-Jones and Sen2003) effectively demonstrate the need for irrigation development to foster agricultural growth in less favourable agricultural regions. Our study makes an argument for effective nutrient-management strategies to maintain soil health in these areas. We believe a further reduction in fertilizer application in areas of low crop yields and less intensive input use (semi-arid tropics and arid regions) can have a far-reaching consequence on poverty.
6. Concluding remarks
Nutrient management through fertilizer application can be a vital mechanism for adjusting to climatic variability because of its potential to reduce the yield gap. Although the benefits of fertilizer use have been widely acknowledged, the environmental implications of excessive fertilizer application are also a matter of concern. A range of negative externalities, such as nitrate leaching and runoff, are associated with chemical fertilizers (Abrol and Raghuram, Reference Abrol and Raghuram2007; Vitousek et al., Reference Vitousek, Naylor, Crews, David, Drinkwater, Holland, Johnes, Katzenberger, Martinelli, Matson, Nziguheba, Ojima, Palm, Robertson, Sanchez, Townsend and Zhang2009). In the Indian context, indiscriminately higher use of chemical fertilizers, mainly nitrogen, is already prevalent in some parts of the country. Globally, the safe operating space or planetary boundaries for biogeochemical flows (nitrogen and phosphorus cycle) has already been exceeded (Steffen et al., Reference Steffen, Richardson, Rockström, Cornell, Fetzer, Bennett, Biggs, Carpenter, De Vries, DeWit and Folke2015). However, given the intensive nature of cultivation and widespread soil-nutrient deficiencies worldwide, it is not possible to ban the use of chemical fertilizers (Singh and Wanjari, Reference Singh and Wanjari2013).
Droughts are expected to increase in future and coping, or production optimisation processes, may increase fertilizer demand. It has to be noted that it is tough to ascertain any management practice as an adaptation against climate variability. It is tough to disentangle the sole climatic adaptation aspect of agricultural management practices, such as fertilizer, from the regular input optimisation behaviour of farmers. In the context of the increase in the frequency of climate extremes due to climate change, the focus should be therefore on integrated soil fertility management to safeguard farmers against productivity losses. Further research is required, particularly at the crop-disaggregated level, to better understand farmers' responses toward different nutrient-management practices under climatic risks.
Supplementary material
The supplementary material for this article can be found at https://doi.org/10.1017/S1355770X21000413.
Acknowledgements
The author is thankful for the suggestions made by the participants of Tenth INSEE Biennial Conference, 2019, an associate editor, and the two anonymous referees of the journal. The study has greatly benefited from the discussions and comments by Madhura Swaminathan, VK Ramachandran, Kamal Murari and K.S. Kavi Kumar.


 Open access