


Introduction
Schizophrenia is a complex, chronic, heterogeneous, and devastating psychotic syndrome that causes a considerable healthcare burden worldwide [Reference Millan, Andrieux, Bartzokis, Cadenhead, Dazzan and Fusar-Poli1, Reference Owen, Sawa and Mortensen2]. Patients with schizophrenia have a reduced life expectancy of about 15 years compared with the general population [Reference McCutcheon, Reis Marques and Howes3, Reference Hjorthøj, Stürup, McGrath and Nordentoft4]. However, the diagnosis of schizophrenia is impacted by the heterogeneity in clinical presentation, biomarker expression, illness course, functional outcome, treatment response, and so on [Reference Chand, Dwyer, Erus, Sotiras, Varol and Srinivasan5–Reference McCutcheon, Pillinger, Mizuno, Montgomery, Pandian and Vano11]. Identifying distinctive subtypes of schizophrenia can improve diagnostic accuracy and help precise therapy [Reference Dwyer, Cabral, Kambeitz-Ilankovic, Sanfelici, Kambeitz and Calhoun12, Reference Xiao, Liao, Long, Tao, Zhao and Luo13].
Before the emergence of objective quantification such as neuroimaging and genetic measures, psychiatrists often categorized the subtypes of schizophrenia based on patients’ clinical symptoms. For example, schizophrenia was traditionally classified into paranoid, catatonic, disorganized subtypes, and so forth, based on the Diagnostic and Statistical Manual of Mental Disorders (DSM) and International Classification of Diseases (ICD) classification systems [Reference Braff, Ryan, Rissling and Carpenter14]. Some scholars also tried to subdivide schizophrenia based on the symptom dimensions, such as the Positive and Negative Syndrome Scale (PANSS) [Reference Kay, Fiszbein and Opler15–Reference Chen, Patil, Weis, Sim, Nickl-Jockschat and Zhou18], Assessment of Positive/Negative Symptoms [Reference Nenadic, Sauer and Gaser19, Reference Nenadic, Yotter, Sauer and Gaser20], or cognitive performance [Reference Lim, Smucny, Barch, Lam, Keefe and Lee21–Reference Lewandowski23]. With the advance of big data mining and pattern recognition, unsupervised machine learning (ML) techniques are emerging to recognize the biological subtypes of various neuropsychiatric diseases [Reference Pelin, Ising, Stein, Meinert, Meller and Brosch24]. Compared to traditional manual subtyping by clinicians according to diagnostic guidelines, unsupervised ML is a type of powerful data-driven technique designed to recognize the intrinsic stratified structure of unlabeled data, and thus is more objective and could reproducibly identify subtypes in neuropsychiatric diseases from high dimensional features that are difficult or impossible for humans to discriminate [Reference Jordan and Mitchell25]. ML techniques have shown the potential to classify schizophrenia patients into several subtypes with diverse symptomatic patterns [Reference Zhang, Koutsouleris, Meisenzahl and Davatzikos16, Reference Koutsouleris, Gaser, Jager, Bottlender, Frodl and Holzinger17, Reference Nenadic, Sauer and Gaser19, Reference Nenadic, Yotter, Sauer and Gaser20]. Besides, ML techniques have been recently applied to subtype schizophrenia based on the biological measures derived from magnetic resonance imaging (MRI), such as white matter microstructural measures from diffusion tensor imaging (DTI), and gray matter morphometric measures from structural MRI [Reference Chand, Dwyer, Erus, Sotiras, Varol and Srinivasan5, Reference Liang, Wang, Greenshaw, Li, Deng and Ren8, Reference Dwyer, Cabral, Kambeitz-Ilankovic, Sanfelici, Kambeitz and Calhoun12, Reference Xiao, Liao, Long, Tao, Zhao and Luo13, Reference Watson, Giordano, Suckling, Barnes, Husain and Jones22, Reference Sun, Lui, Yao, Deng, Xiao and Zhang26–Reference Gupta, Castro, Rachkonda, van Erp, Potkin and Ford30]. These ML-based subtyping techniques might provide an objective way for a precise diagnosis of schizophrenia.
A key challenge for ML-based schizophrenia subtyping is its interpretability for psychiatrists. Bridging the gap between ML-based neuroimaging subtypes and clinical phenotypes could not only deepen the understanding of the biological underpinnings contributing to clinical heterogeneity, but also promote the application of the ML-based subtypes in disease diagnosis and treatments. For example, it has been shown that neuroanatomical subtyping could enhances discrimination of schizophrenia from the healthy controls [Reference Dwyer, Cabral, Kambeitz-Ilankovic, Sanfelici, Kambeitz and Calhoun12]. However, there remains debate on the clinical symptomatic relevance of neuroanatomical subtypes derived from ML techniques, and vice versa for symptomatic subtypes. Although noticeable brain structural differences were reported among symptomatic subtypes based on ML techniques, most studies only reported subtle differences, no difference, or considerable overlap in brain signatures among subtypes, which impeded the interpretation of these ML-based clinical subtypes [Reference Zhang, Koutsouleris, Meisenzahl and Davatzikos16, Reference Koutsouleris, Gaser, Jager, Bottlender, Frodl and Holzinger17, Reference Nenadic, Sauer and Gaser19, Reference Nenadic, Yotter, Sauer and Gaser20]. Similar situations were also shown for ML-based neuroimaging subtypes. For example, no PANSS differences were reported between schizophrenia neuroimaging subtypes using gray matter volume (GMV) by several independent studies [Reference Chand, Dwyer, Erus, Sotiras, Varol and Srinivasan5, Reference Dwyer, Cabral, Kambeitz-Ilankovic, Sanfelici, Kambeitz and Calhoun12, Reference Xiao, Liao, Long, Tao, Zhao and Luo13, Reference Honnorat, Dong, Meisenzahl-Lechner, Koutsouleris and Davatzikos27, Reference Zhao, Cao, Zhang, Li, Xiao and Tamminga31]. And only differences in negative symptoms were identified between neuroimaging subtypes derived from white matter DTI metrics [Reference Sun, Lui, Yao, Deng, Xiao and Zhang26].
In this study, we tried to elucidate the potential association between the ML-based neuroanatomical subtypes and symptomatic subtypes in schizophrenia patients, namely, whether the ML-based neuroanatomical subtypes had different clinical manifestations, or the ML-based symptomatic subtypes had different neuroanatomic damage patterns. It should be noted that early reported schizophrenia subtypes were significantly diverse across different studies in either a number of categories or manifestations, which may be induced by sample heterogeneities (such as medication history and disease progression) and subtyping methods diversity [Reference Chand, Dwyer, Erus, Sotiras, Varol and Srinivasan5, Reference Dwyer, Cabral, Kambeitz-Ilankovic, Sanfelici, Kambeitz and Calhoun12, Reference Koutsouleris, Gaser, Jager, Bottlender, Frodl and Holzinger17, Reference Gupta, Castro, Rachkonda, van Erp, Potkin and Ford30]. Therefore, to account for these confounding factors, this study planned to enroll a relatively large schizophrenia sample from four independent sites, including the chronic and drug-naïve first-episode patients. Besides, we applied two publicly used ML methods that had been used for psychiatric diseases subtyping [Reference Sun, Lui, Yao, Deng, Xiao and Zhang26, Reference Drysdale, Grosenick, Downar, Dunlop, Mansouri and Meng32], K-means and hierarchical clustering, to validate if the ML-based subtypes are stable by different algorithms. Specifically, we aimed to explore: (1) Brain GMV difference between PANSS-derived subtypes clustered using the K-means and hierarchical methods; (2) PANSS differences between two GMV-derived subtypes using the K-means and hierarchical methods; (3) the consistency and diversity between different subtyping methods (K-means vs. hierarchical), and between different features (PANSS vs. GMV); and (4) the effects of sites on the subtyping classification.
Materials
Subjects
This study included two independent Chinese structural MRI (sMRI) datasets from Tianjin Medical University General Hospital (TIANJIN) (112 patients and 106 HCs) and Guangzhou Medical University affiliated Brain Hospital (GUANGZHOU) (51 patients and 29 HCs), and two Western public datasets from the SchizConnect database [Reference Wang, Alpert, Calhoun, Cobia, Keator and King33], including BrainGluSchi (71 patients and 44 HCs) [Reference Landis, Courtney, Dieringer, Kelly, King and Miller34] and COBRE (80 patients and 78 HCs) [Reference Landis, Courtney, Dieringer, Kelly, King and Miller34]. Patients from TIANJIN, BrainGluSchi, and COBRE were chronic and had stable antipsychotic medication. And patients from GUANGZHOU were drug-naïve and first-episode. All the patients with schizophrenia were diagnosed based on the structured clinical interview for DSM-IV axis I disorders (SCID-I). In addition, patients’ psychopathology ratings were assessed using the PANSS at MRI examination. The nonpatient version of SCID was applied to ensure the lifetime absence of psychiatric illness in the HCs, and there were also no known histories of major psychiatric illness in HCs’ first-degree relatives. The subjects were excluded if they had other neurological and psychiatric disorders, present or past regular alcohol and illicit drug abuse, a history of traumatic brain injury with consciousness loss, MRI contraindication, or electroconvulsive treatment. Finally, 314 schizophrenia patients (age range, 41–59; mean, 33.81 ± 11.03; male, 217; female, 97) and 257 healthy controls (HCs) (age range, 41–59; mean, 34.40 ± 10.91; male, 159; female, 98) were recruited. The local Ethics Committees approved the enrollment of TIANJIN and GUANGZHOU datasets, and the subjects from the corresponding institutes gave their informed written consent before the MRI scanning.
MRI data acquisition
MRI data of BrainGluSchi and COBRE sites were collected using the 3.0 T Siemens Trio Tim scanner (Siemens Healthineers, Erlangen, Germany). MRI data of the TIANJIN and GUANGZHOU sites were collected using the 3.0 T GE Discovery MR750 system (General Electric, Milwaukee, WI) and the 3.0 T Philips Achieva scanner (Philips, Andover, MA), respectively. The sMRI sequence parameters of each scanner are listed in Table 1.
Table 1. The parameters of 3D T1 sMRI data from different MRI scanners in each site

Data preprocessing
The sMRI data underwent standard voxel-based morphometry (VBM) pipeline to derive the absolute GMV and smoothed with 8-mm full-width at half-maximum (FWHM) (Supplementary Methods: MRI Data Preprocessing). Next, Combat harmonization was performed to eliminate the systematic bias in GMV and PANSS across four sites [Reference Fortin, Cullen, Sheline, Taylor, Aselcioglu and Cook35]. Then a linear regression was applied to regress out confounders for metrics (age, sex, and TIV for GMV; age and sex for PANSS). Finally, a principal component analysis (PCA) was carried out on unsmoothed GMV to extract the top 464 components that explain 95% variance for clustering analysis (Supplementary Methods: Data Harmonization and Feature Extraction).
Subtypes identification based on ML
K-means and Hierarchical clustering algorithms were used to cluster the recruited schizophrenia patients into different subtypes based on the GMV (464 features) and PANSS data (30 features), respectively. A 10 randomization 5-fold cross-validation strategy was used to estimate and eliminate sample selection bias during clustering. The multiplication of Calinski-Harabasz Index (CHI) and Adjusted Rand Index (ARI) was used to determine the best clustering hyperparameters for K-means and Hierarchical clustering methods. Finally, the Jaccard similarity coefficient was used to match the clustering labels across shuffles, and the label with the maximum probability across all shuffles was considered as the subtype ID of this subject (Supplementary Methods: Subtypes Identification).
Statistical analysis
Neuroimaging data analyses were performed using SPM12 software. The statistical analyses of tabular data were performed using SPSS software (version 17.0, SPSS Inc.).
One-way analysis of variance, the Mann–Whitney U test, Kappa test, two-sample t-test, Spearman correlation, and Kolmogorov–Smirnov test were performed in our study. The detailed descriptions of statistical methods were provided in Supplementary Methods: Statistical Analysis section.
Results
Clustering performance
As shown in Figure 1, both K-means and Hierarchical clustering methods identified two neuroanatomical subtypes (K-means: ARI*CHI = 6.018; Hierarchical: ARI*CHI = 2.724) and two symptomatic subtypes (K-means: ARI*CHI = 46.573; Hierarchical: ARI*CHI = 20.557) according to the chosen best model (Figure 1A). Jaccard similarity coefficients demonstrated high similarity between shuffles for the neuroanatomical subtypes using K-means (median = 0.974, interquartile range [IQR] = [0.964, 0.980]) and Hierarchical clustering (median = 0.855, IQR = [0.834, 0.885]), and for the symptomatic subtypes using K-means (median = 0.975, IQR = [0.970, 0.985]) and Hierarchical clustering (median = 0.864, IQR = [0.833, 0.897]), indicating high repeatability of the clustering across shuffles (Figure 1B). The maximum probability of the subtypes across shuffles was also high for neuroanatomical subtypes using K-means (median = 1.000, IQR = [1.000, 1.000]) and Hierarchical clustering (median = 0.985, IQR = [0.800, 1.000]), and for symptomatic subtypes using K-means (median = 1.000, IQR = [1.000, 1.000]) and Hierarchical clustering (median = 0.950, IQR = [0.825, 1.000]), further supporting that the subtype for each subject was reliable across different randomizations (Figure 1C).

Figure 1. Subtyping performance evaluation. (A) The best model is based on ARI*CHI criteria during K-means and Hierarchical clustering in two (PANSS vs. GMV) feature types. (B) The Jaccard similarity coefficients between shuffles before (cyan) and after (red) labels match the best model. A larger coefficient represents a better match across shuffles. (C) The max probability of each patient across 50 shuffles. Max probability of most individuals was higher than 80%, indicating the reproducibility of subtyping.
Demographics and clinical characteristics of subtypes
There were no significant differences in age, gender, and TIV among the neuroanatomical subtypes and HCs in the total cohort (Table 2) and in each site (Supplementary Tables 1–4) using either K-means and Hierarchical clustering (all P > 0.05). Neuroanatomical subtype-1 based on the K-means clustering method had significantly lower CPZ equivalents than subtype-2 in the total cohort (z = −2.859, P = 0.004) (Table 2) and in BrainGluSchi dataset (z = −2.768, P = 0.006) (Supplementary Table 1). In addition, neuroanatomical subtype-1 using Hierarchical clustering had lower CPZ equivalents (z = −3.007, P = 0.003), lower age when schizophrenia was first diagnosed (z = −2.064, P = 0.039), lower age when symptoms firstly appeared (z = −1.998, P = 0.046), and lower age when therapy was firstly received (z = −2.994, P = 0.003) than subtype-2 in the total cohort (Table 2). Neuroanatomical subtype-1 based on Hierarchical clustering had lower CPZ equivalents (z = −2.224, P = 0.026), lower age when therapy first received (z = −2.077, P = 0.038) than subtype-2 in COBRE dataset (Supplementary Table 2). There were no significant differences in clinical indicators among the symptomatic subtypes and HCs in either the total cohort or each site (P > 0.05) (Table 2 and Supplementary Tables 3 and 4).
Table 2. Demographic and clinical characteristics of the schizophrenia subtypes and healthy controls
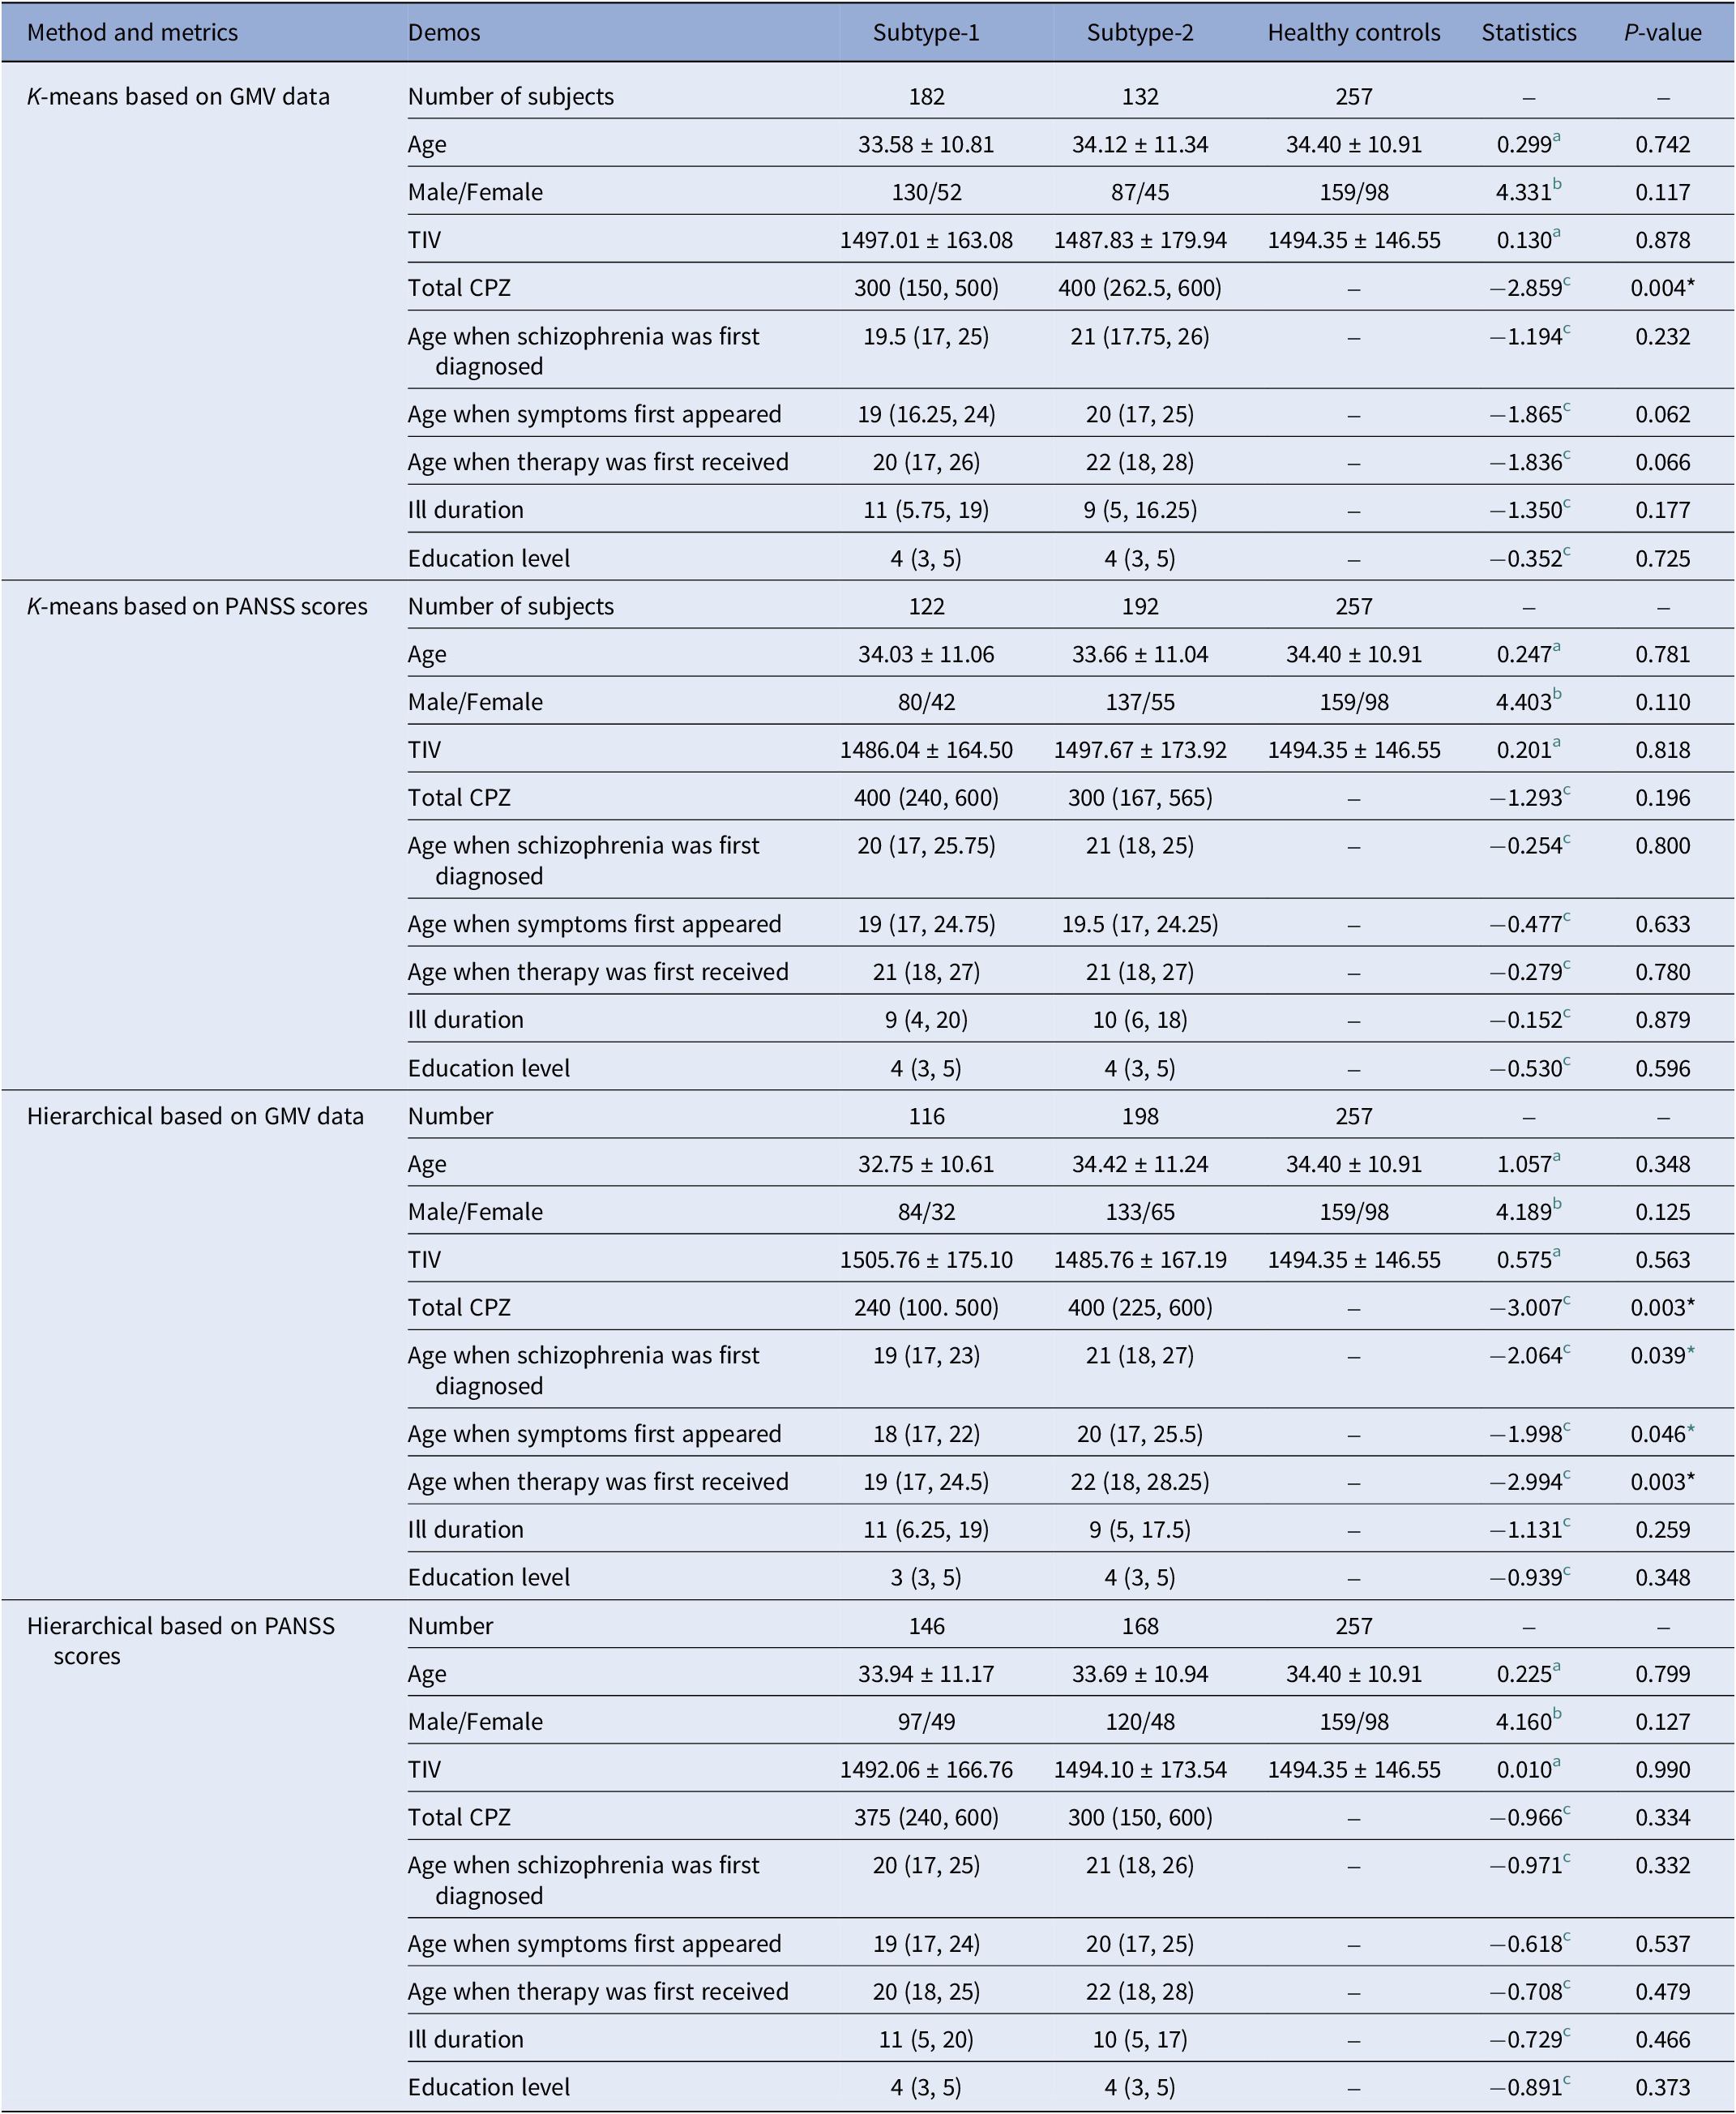
a ANOVA.
b Chi-square test.
c Mann–Whitney U test.
* represent statistically significant items.
GMV features of the GMV-derived subtypes
One-way ANOVA found neuroanatomical subtype-1 based on the K-means method had focally increased GMV in the left medial orbital superior frontal gyrus (moSFG), left superior frontal gyrus (SFG), bilateral middle frontal gyrus (MFG), and right supplementary motor area (SMA), and right precentral gyrus (PrecG) than the HCs; in contrast, neuroanatomical subtype-2 also had broadly reduced GMV than the HCs, especially in the bilateral orbital frontal lobes, thalamus, insular and medial prefrontal cortex (MPFC) (Figure 2A). The GMV changes patterns of the neuroanatomical subtypes using the Hierarchical method were similar to those using the K-means method (Figure 3A) (P < 0.05, voxel-wise FWE corrected).

Figure 2. Schizophrenia neuroanatomical subtypes based on K-means clustering. (A) Intergroup differences in GMV between schizophrenia neuroanatomical subtypes by K-means clustering and HCs. (B) Inter-subtype differences in GMV at each site. The color bar represents the T values. (C) The Spearman spatial correlation in T values of inter-subtype GMV differences between each pair of sites.
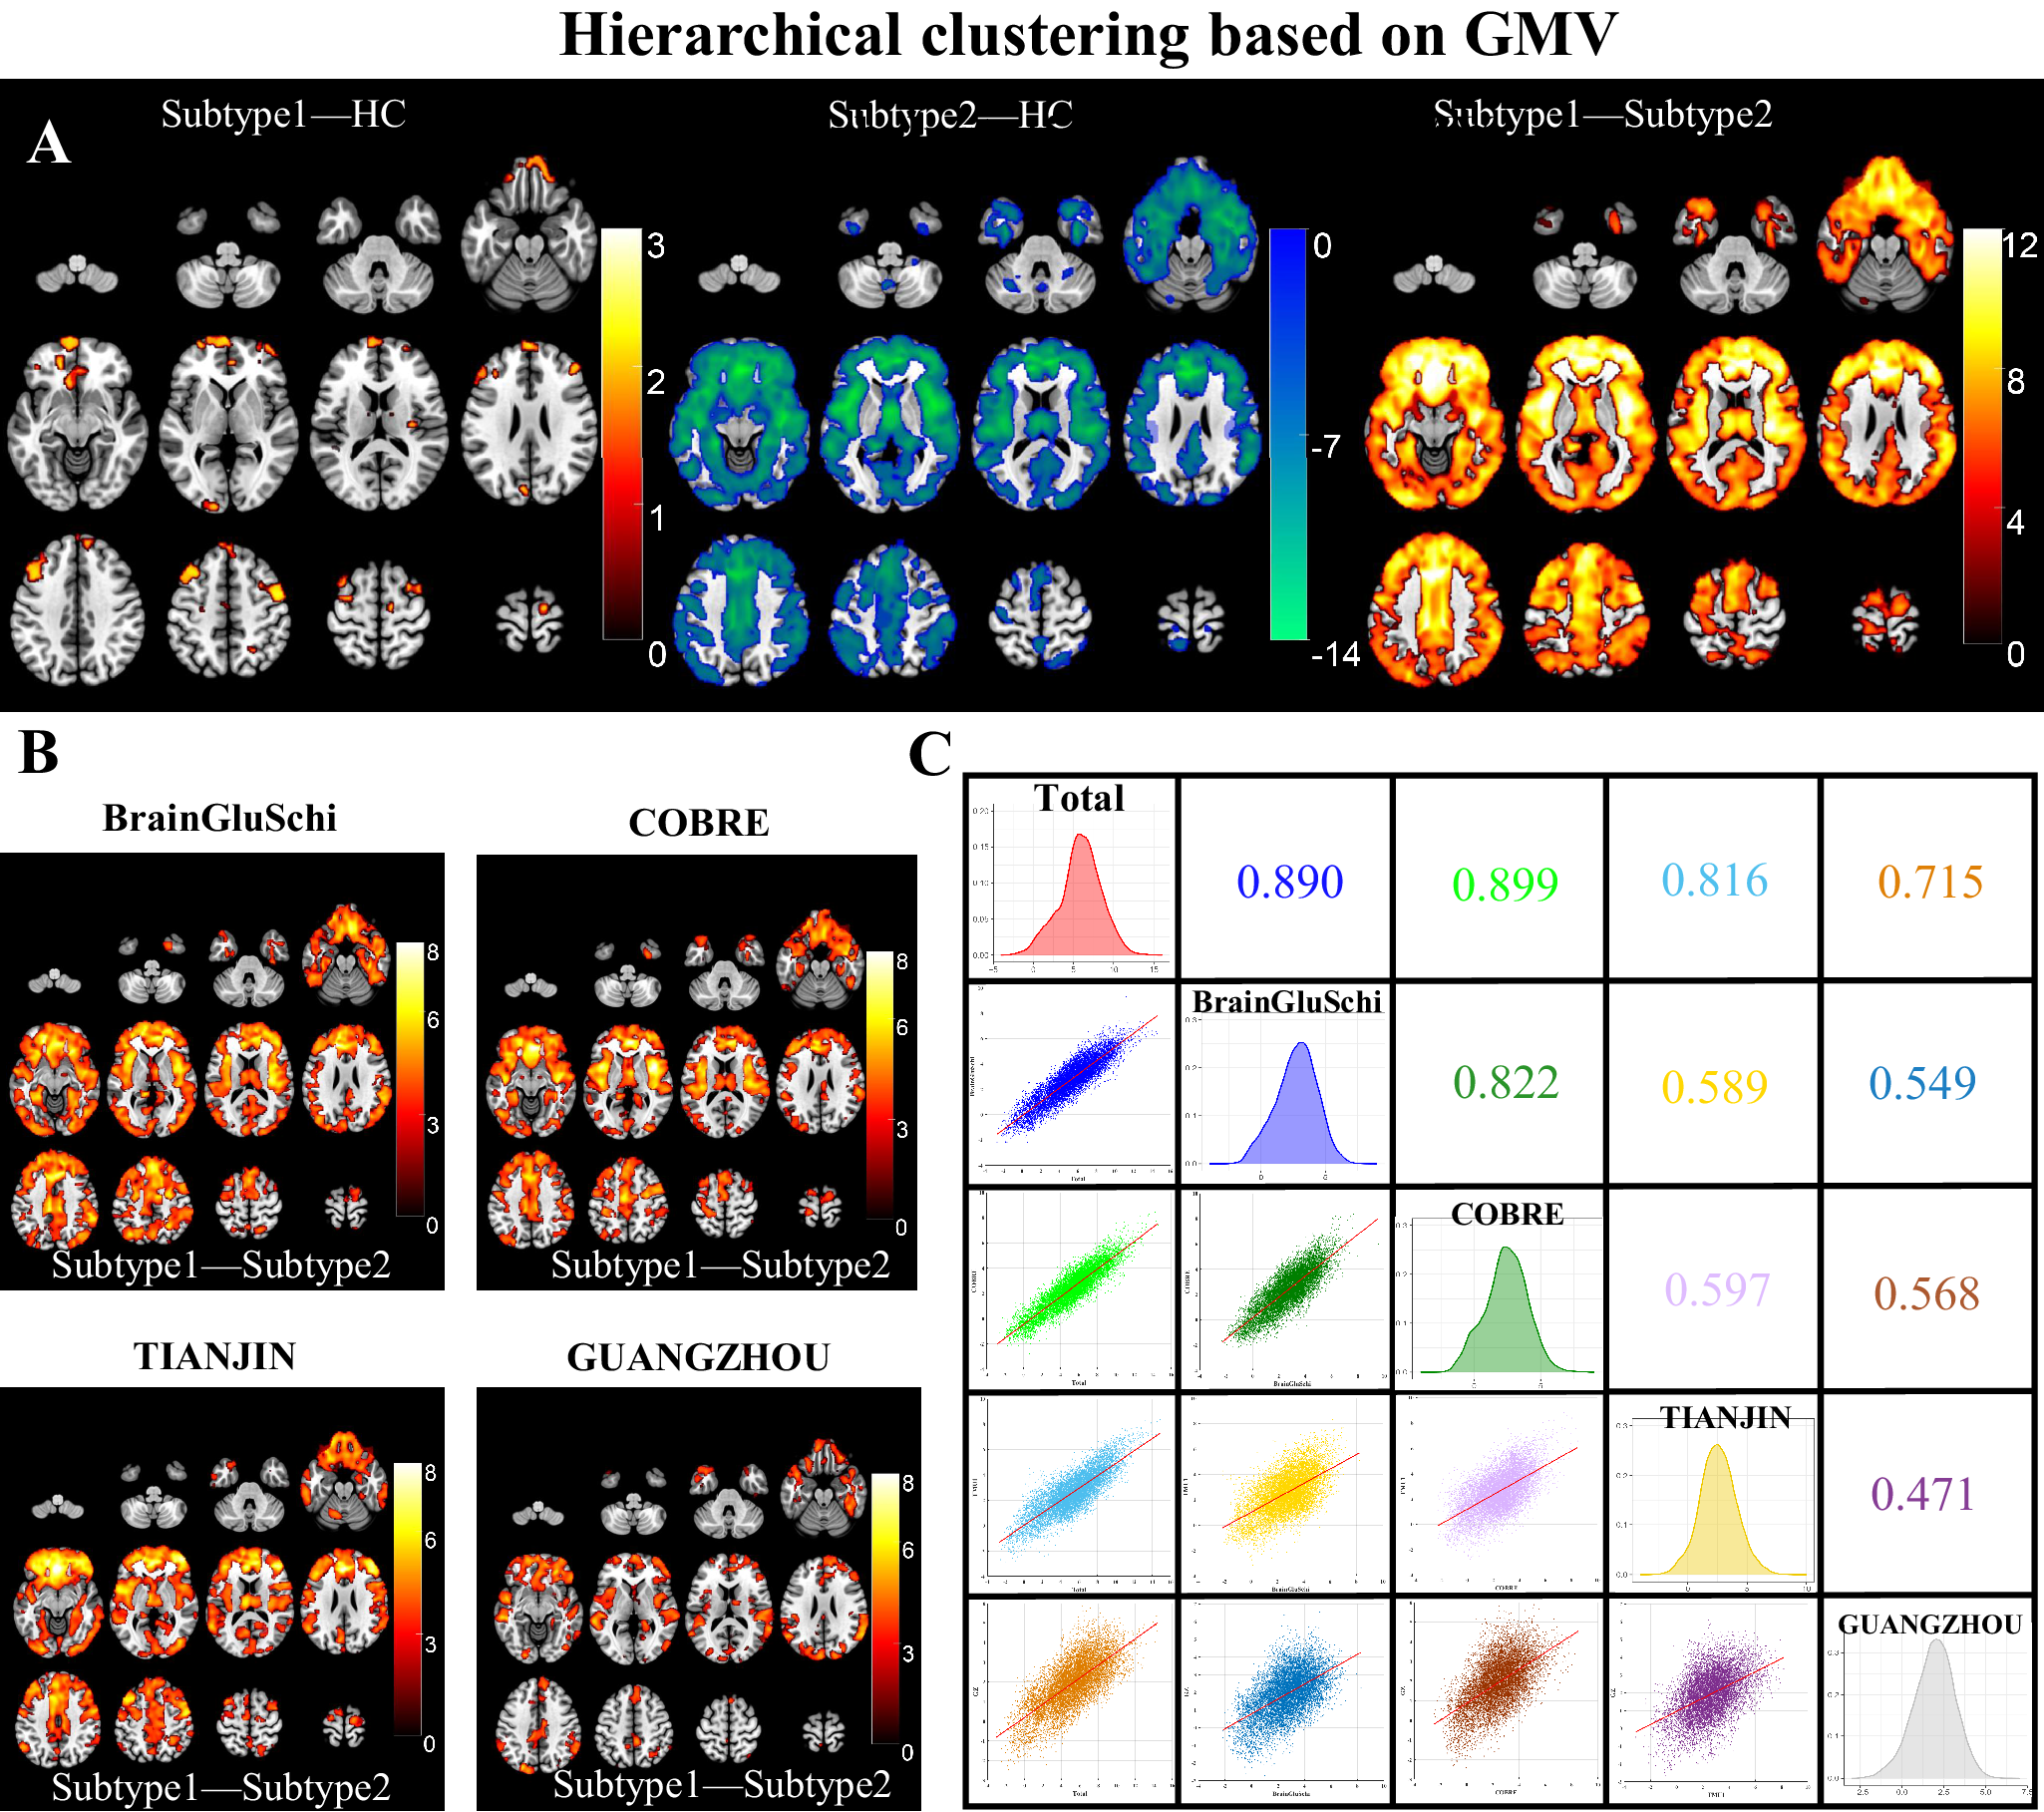
Figure 3. Schizophrenia neuroanatomical subtypes based on Hierarchical clustering. (A) Intergroup differences in GMV between schizophrenia neuroanatomical subtypes by Hierarchical clustering and HCs. (B) Inter-subtype differences in GMV at each site. The color bar represents the T values. (C) Spearman spatial correlation in T values of inter-subtype GMV differences between each pair of sites.
The GMV of neuroanatomical subtype-2 was broadly lower than in subtype-1 using either K-means (Figure 2A) or the Hierarchical clustering method (Figure 3A) (P < 0.05, voxel-wise FWE corrected), which was replicated at each of the four sites (Figures 2B and 3B) (P < 0.05, cluster-wise FWE corrected). Further spatial correlation analyses demonstrated a significant positive association in T-distributions of inter-subtype GMV differences across voxels between each pair of sites (P < 0.05, Bonferroni corrected). In addition, the GUANGZHOU site (first-episode cohort) had relatively low spatial similarity with the sites having chronic patients than those within chronic sites using either K-means (r = [0.396:0.446] for GUANGZHOU vs. [0.621:0.749] for chronic sites) or Hierarchical clustering method (r = [0.471:0.568] for GUANGZHOU vs. [0.589:0.822] for other sites) (Figures 2C and 3C).
Symptomatic features of the PANSS-derived subtypes
Mann–Whitney U test found PANSS-derived subtype-1 by K-means clustering had more severe symptoms in 28 of the 30 PANSS items (P1–4, 6–7; N1–7; G1–13, 15–16) than those of subtype-2 (Figure 4A). Similarly, PANSS-derived subtype-1 by Hierarchical clustering had more severe symptoms in 26 of the 30 PANSS items (P1–3, 6–7; N1–7; G2–8, 10–16) than subtype-2 (Figure 4B). The inter-subtype PANSS difference pattern was replicated at each site (Figure 4C,D) (P < 0.05, Bonferroni corrected). Spatial Spearman correlation also demonstrated a significant positive association in Z-distributions of inter-subtype differences across PANSS items between each pair of sites (P < 0.05, Bonferroni corrected). In addition, the PANSS differences between symptomatic subtypes were more similar within Western (BrainGluSchi and COBRE, K-means: r = 0.595; Hierarchical: r = 0.709) or within Chinese cohorts (TIANJIN and GUANGZHOU, K-means: r = 0.727; Hierarchical: r = 0.858) than between races (K-means: r = [0.371, 0.512]; Hierarchical: r = [0.482, 0.664]) (Figure 4E,F).

Figure 4. Schizophrenia symptomatical subtypes based on K-means and Hierarchical clustering. (A) Inter-subtype differences in PANSS scores clustered by K-means algorithm. (B) Inter-subtype differences in PANSS scores clustered by Hierarchical algorithm. (C) Inter-subtype differences in PANSS scores for each site clustered by K-means algorithm. (D) Inter-subtype differences in PANSS scores for each site clustered by Hierarchical algorithm. (E) Spearman correlation in T values of inter-subtype PANSS differences between each pair of sites by K-means algorithm. (F) Spearman correlation in T values of inter-subtype PANSS differences between each pair of sites by Hierarchical algorithm.
PANSS differences between two GMV-derived subtypes
Mann–Whitney U test demonstrated no statistical differences in PANSS items scores between neuroanatomical subtypes based on K-means (P > 0.05, Bonferroni corrected), except that subtype-1 had a lower negative symptom (N4, passive/apathetic social withdrawal) than the subtype-2 (Figure 5A) (P < 0.05, Bonferroni corrected). Similarly, there were no statistical differences in any item of the PANSS scale between neuroanatomical subtypes based on the Hierarchical method (Figure 5B) (P > 0.05, Bonferroni corrected).

Figure 5. Dissociated GMV- and PANSS-derived subtypes as identified by inter-subtype comparisons. (A) PANSS differences between two GMV-derived subtypes by K-means algorithm. (B) PANSS differences between two GMV-derived subtypes by Hierarchical algorithm. (C) GMV differences between two PANSS-derived subtypes by K-means algorithm did not survived after FWE correction. (D) GMV differences between two PANSS-derived subtypes by Hierarchical algorithm did not survived after FWE correction.
GMV difference between two PANSS-derived subtypes
Although both symptomatic subtypes had similar reduced GMV in the bilateral temporal cortex, hippocampus, MPFC, insula, and so on (Figure 5C-5D, left and middle pannels) (P <0.05, FWE corrected), there were no differences in GMV between the two symptomatic subtypes by either K-means (Figure 5C, right panel) or Hierarchical clustering (Figure 5D, right panel) (P > 0.05, FWE corrected).
Similarity between GMV- and PANSS-derived subtypes
Cohen’s Kappa test was employed to explore the similarity of subtyping results between different subtyping features (GMV vs. PANSS), or between different subtyping methods (K-means vs. Hierarchical). A very low Kappa score was found between the neuroanatomical subtypes and symptomatic subtypes either by K-means (Kappa = 0.004, P = 0.946) (Figure 6A), or Hierarchical clustering (Kappa = −0.051, P = 0.356) (Figure 6B). In contrast, a high Kappa score was found between the neuroanatomical subtypes by K-means and those by Hierarchical clustering (Kappa = 0.596, P < 0.001) (Figure 6C), and between the symptomatic subtypes by K-means and those by Hierarchical clustering (Kappa = 0.754, P < 0.001) (Figure 6D). The dissimilarity pattern between GMV-derived subtypes and PANSS-derived subtypes could be replicated in each site (Supplementary Figures 1–4).

Figure 6. Subtypes consistency comparisons between different features and between different clustering methods. A Kappa test was employed to explore the consistency of subtypes using different subtyping features (GMV vs. PANSS) or between different subtyping methods (K-means vs. Hierarchical). (A) GMV versus PANSS subtypes consistency using K-means clustering; (B) GMV versus PANSS subtypes consistency using Hierarchical clustering; (C) GMV subtypes consistency between K-means and Hierarchical clustering methods; (D) PANSS subtypes consistency between K-means and Hierarchical clustering methods.
Discussion
In this study, we applied unsupervised ML methods to subtype schizophrenia patients into two neuroanatomical and two symptomatic subtypes, respectively. We found no differences in GMV between the PANSS-derived symptomatic subtypes and almost no differences in PANSS scores between the GMV-derived neuroanatomical subtypes. Moreover, the GMV-derived and PANSS-derived subtypes are mismatched in patients belonging. The dissociation patterns were replicated in four independent sites with different disease progressions (chronic vs. first episodes) and different ancestors (Chinese vs. Western) and were validated by different clustering methods (K-means vs. Hierarchical). To our knowledge, this is the first study directly reporting the dissociations between ML-based neuroanatomical subtypes and ML-based symptomatic subtypes of schizophrenia. These findings may provide a new viewpoint toward understanding the heterogeneity of schizophrenia.
One of the most important findings is that we found two replicable ML-based neuroanatomical subtypes, with one showing broadly reduced GMV and the other having focally increased GMV, but almost no differences in PANSS item scores between the two GMV-based neuroanatomical subtypes. These findings were consistent with early studies showing no PANSS differences between neuroimaging subtypes using GMV by several independent studies [Reference Chand, Dwyer, Erus, Sotiras, Varol and Srinivasan5, Reference Dwyer, Cabral, Kambeitz-Ilankovic, Sanfelici, Kambeitz and Calhoun12, Reference Xiao, Liao, Long, Tao, Zhao and Luo13, Reference Honnorat, Dong, Meisenzahl-Lechner, Koutsouleris and Davatzikos27, Reference Zhao, Cao, Zhang, Li, Xiao and Tamminga31]. Our findings seem inconsistent with one study by Gupta et al. [Reference Gupta, Castro, Rachkonda, van Erp, Potkin and Ford30], who categorized schizophrenia into three subtypes (S1, S2, and Sinter) by manually setting a loading cutoff (mean ± std) for two independent components derived from source-based morphometry. Although they found a statistical difference in positive symptoms between the S1 and S2, this subtyping method is not strictly ascribed to “unsupervised” ML, and the comparison ignored a large subset with an intermediate state. Another study reported only differences in negative symptoms between neuroimaging subtypes derived from white matter DTI metrics [Reference Sun, Lui, Yao, Deng, Xiao and Zhang26]. In this study, we excluded the possible influences of clustering methods and sites on ML-based subtyping, suggesting that the absence of PANSS differences between ML-based GMV subtypes is reliable.
We also identified two ML-based symptomatic subtypes, with one having generally more severe PANSS symptoms than the other, but the two ML-based symptomatic subtypes showed no statistical differences in GMV. In supporting our findings, although brain structural differences were reported among PANSS-based symptomatic subtypes based on some multivariate pattern analyses, most studies only reported subtle differences, no difference, or considerable overlap in brain signatures among symptomatic subtypes [Reference Zhang, Koutsouleris, Meisenzahl and Davatzikos16, Reference Koutsouleris, Gaser, Jager, Bottlender, Frodl and Holzinger17, Reference Nenadic, Sauer and Gaser19, Reference Nenadic, Yotter, Sauer and Gaser20, Reference Sallet PC, Alves, Oliveira, Sassi, de Castro C and Busatto36]. It should be noted that early studies have reported cerebral structural alterations associated with symptoms of psychosis, such as auditory verbal hallucinations (AVH) [Reference Di Biase, Zhang, Lyall, Kubicki, Mandl and Sommer37, Reference Kubera, Sambataro, Vasic, Wolf, Frasch and Hirjak38], which seems to contradict the present findings. However, a meta-analysis did not find any GMV difference between patients with AVH and those without AVH, but a significant association between the severity of AVH and GMV reduction in the superior temporal gyri [Reference Modinos, Costafreda, van Tol, McGuire, Aleman and Allen39]. Similar to the meta-analysis, our study did not find a statistical difference in hallucination symptoms (P3 item of PANSS) between the two schizophrenia anatomical subtypes. The possible explanation for inconsistent AVH-related GMV changes included: First, AVH is a state characteristic that changes dynamically with disease course [Reference Kubera, Sambataro, Vasic, Wolf, Frasch and Hirjak38]. Second, psychometric heterogeneities and/or different AVH subtypes (episodic, persistent symptoms, and treatment-resistant) may exist across studies [Reference Modinos, Costafreda, van Tol, McGuire, Aleman and Allen39]. Finally, long-term antipsychotics can suppress AVH symptoms and affect brain atrophy, complicating the associations between brain damage and AVH [Reference Di Biase, Cropley, Baune, Olver, Amminger and Phassouliotis40, Reference Di Biase, Cropley, Cocchi, Fornito, Calamante and Ganella41].
Multiple factors may explain the dissociation between neuroanatomical subtyping and symptomatic subtyping. First, the classification of symptomatic subtypes may be affected by: (1) Dimension overlap. The symptom diversity might also be accompanied by overlapping and coexisting symptom dimensions, which may cause difficulty in determining subtypes. (2) Comorbidity and shared symptoms across psychiatric diseases [Reference Chang, Womer, Gong, Chen, Tang and Feng42]. It has been reported that some psychotic diseases, such as bipolar disorder and major depressive disorder, may be misdiagnosed as schizophrenia because of their shared symptoms or clinical features [Reference Harris, Shen, Cox, Gibson, Adams and Clarke43, Reference Van Rheenen, Lewandowski, Tan, Ospina, Ongur and Neill44]. (3) Symptom dynamics during disease progression. The patients with positive symptoms became progressively less conspicuous and were gradually replaced with negative and disorganized phenotypes [Reference McGlashan45, Reference Wang, Xue, Pu, Yang, Li and Yi46]. Second, regarding neuroanatomical subtyping classification, early studies had reported that Olanzapine could lead to GMV loss after 1 year’s treatment [Reference Lieberman, Charles, Zipursky, Sharma, Kahn and Keefe47], while risperidone and ziprasidone could partially reverse brain atrophy [Reference Garver, Holcomb and Christensen48]. All these neuroanatomical and symptomatic subtyping uncertainties could cause mismatches between neuroanatomical and symptomatic subtypes. Finally, the mismatch in the time course between GMV changes and symptoms may also cause subtyping dissociation. For example, early studies have revealed that GMV changes have occurred in prodromal or even symptom-free individuals, which are not matched with their symptoms [Reference Nenadic, Sauer and Gaser19, Reference Shan, Ou, Pan, Ding, Zhao and Liu49, Reference Buechler, Wotruba, Michels, Theodoridou, Metzler and Walitza50].
In our study, the GMV changes between neuroanatomical subtypes were relatively broader in chronic schizophrenia patients (BrainGluSchi, COBRE, TIANJIN) than the first-episode drug-naïve ones (GUANGZHOU). We also found that the CPZ equivalent of neuroanatomical subtype 2 (widespread GMV loss) was higher than that of neuroanatomical subtype 1 (focal GMV increase). Previous in vivo and ex vivo MRI and postmortem histological studies suggested that exposure to antipsychotic treatment causes significantly reduced whole brain volume, especially gray matter [Reference Vernon, Natesan, Modo and Kapur51–Reference Liang, Silva, Jeon, Ford, MacKinley and Theberge53]. Thus, antipsychotic drugs could partially explain the wider brain atrophy in neuroanatomical subtype-2 chronic patients [Reference Cahn, Lems, van Haren, Schnack, van der Linden, Schothorst, van Engeland and Kahn54]. It should be noted that the slight difference in subtypes between chronic and first-episode datasets was not evident for PANSS-based symptomatic subtypes. Instead, we found PANSS differences between symptomatic subtypes were more similar within Western (BrainGluSchi and COBRE) or within Chinese cohorts (TIANJIN and GUANGZHOU) than between them, which may be caused by heterogeneities in psychiatrists’ evaluations of PANSS and patients recruitments between the Western and Chinese cohorts.
Although we did not find any symptomatic differences between the ML-based neuroanatomical subtypes, the potential clinical meanings of our findings included: (1) Neuroanatomical subtypes could deepen our understanding of the biological heterogeneity of internal traits of schizophrenia. Compared to the symptomatic subtypes, the neuroanatomic subtypes were relatively stable and varied to a lesser over time than clinical symptoms [Reference Gupta, Castro, Rachkonda, van Erp, Potkin and Ford30], and thus may more closely represent the biological heterogeneity. For example, neuroanatomic subtypes were reported to be closely associated with brain tissue expression heterogeneities of schizophrenia risk genes [Reference Ji, Zhang, Wang, Qin, Liu and Xue55]. One recent study also reported distinctive cortical damage patterns between subtypes with and without prominent alterations in methylation and immune features [Reference Luo, Pi, Hu, Wang, Xiao and Li52]. (2) Neuroanatomical subtypes may increase the diagnosis accuracy by resolving the inter-patient heterogeneities. It has been shown that the subtyping improved the computer-aided diagnostic accuracy of schizophrenia patients from control subjects using neuroanatomical measures [Reference Dwyer, Cabral, Kambeitz-Ilankovic, Sanfelici, Kambeitz and Calhoun12]. (3) Neuroanatomical subtypes may predict therapeutic outcomes. This study found two neuroanatomical subtypes: one with focally increased GMV and the other with broadly reduced GMV, similar to Chand’s findings [Reference Chand, Dwyer, Erus, Sotiras, Varol and Srinivasan5]. Early neuroanatomic studies suggest that patients with more GMV reduction are marked with relatively poor outcomes [Reference McGuire and Dazzan56]. The regions with increased GMV in subtype 1 were supposed to be related to the dopaminergic system [Reference Cannon57], while the broad GMV decreases in subtype 2 may be associated with the glutamatergic and GABAergic systems [Reference Howes, McCutcheon and Stone58]. Thus, the neuroanatomical subtypes may be sensitive to drugs acting on different pathways, which should be validated in the future.
Our studies have some limitations. First, although the dissociation patterns between the schizophrenia neuroanatomical and symptomatic subtypes were validated in four independent sites with different disease progressions and ancestors by different clustering methods, this study is a cross-sectional design, and the number of enrolled sites is relatively small. Thus, future longitudinal studies with more involved sites are preferred to validate our hypothesis. Second, we only introduced GMV for subtyping. Other neuroimaging techniques, such as diffusion MRI and functional MRI, would provide additional knowledge about the heterogeneity of schizophrenia. As a result, it is hoped to combine multimodal neuroimaging features to recognize schizophrenia subtypes to more fully characterize the biological heterogeneities of schizophrenia. Finally, we have not directly associated the identified subtypes with underlying neurobiological basis, including their association with genetic, epigenetic, transcriptomic, metabolic, and treatment heterogeneities. This issue is critical for understanding the neurobiological underpinnings of heterogeneity and contributing to precision medicine.
Supplementary Material
The supplementary material for this article can be found at http://doi.org/10.1192/j.eurpsy.2023.2446.
Data availability statement
The critical data and scripts for clustering analyses were publicly available on the website (https://github.com/BrainWanderLab/Schizophrenia_subtyping_GMV_PANSS).
Author contribution
C.Y. and W.Q. contributed to the concept and design of the study. C.Z., B.Z., Y.N., and W.Q. contributed to the data acquisition. C.C., H.D., X.D., Y.X., W.M., Y.Z., Y.J., M.L., and W.Q. contributed to the data analysis. C.C. and W.Q. contributed to the drafting of the manuscript. C.Y. and W.Q. contributed to the supervision and critical revision of the manuscript. All authors approved the final version to be submitted.
Financial support
This work was supported by the National Natural Science Foundation of China (grant numbers 81971599 and 81771818 for W.Q., 82030053 for C.Y., and 81971694 for M.L.); National Key Research and Development Program of China (grant number 2018YFC1314300 for C.Y.); Tianjin Natural Science Foundation (grant number 19JCYBJC25100 for W.Q. and 21JCQNJC01480 for C.C.); Tianjin Health High Level Talent Selection and Training Project (grant number TJSQNYXXR-D2-143 for C.C.); and Tianjin Health Research Project (grant number TJWJ2023QN031 for C.C.).
Competing interest
The authors declare no conflict of interest.


 Open access
Comments
No Comments have been published for this article.