


Introduction
Solar flares, large releases of energy from the solar corona, are driven by a process called magnetic reconnection (e.g., Priest, Reference Priest2014). This is where free energy stored in the magnetic field is released as thermal and kinetic energy through the magnetic field changing its connectivity (e.g., Yamada et al., Reference Yamada, Kulsrud and Ji2010). Observations of flares show that the energy release takes place on a timescale of hours (e.g., Fletcher et al., Reference Fletcher, Dennis, Hudson, Krucker, Phillips, Veronig, Battaglia, Bone, Caspi, Chen, Gallagher, Grigis, Ji, Liu, Milligan and Temmer2011; Shibata & Magara, Reference Shibata and Magara2011). However, this timescale is much shorter than the timescale to diffuse the magnetic field in the solar corona of $ {10}^6 $
years (e.g., Shibata & Magara, Reference Shibata and Magara2011).
$ {10}^6 $
years (e.g., Shibata & Magara, Reference Shibata and Magara2011).
Understanding the short timescales, compared to the diffusion time, of solar flares has presented a theoretical challenge for many years. The first major step forward in explaining flare energy release was the Sweet–Parker reconnection model (Parker, Reference Parker1957; Sweet, Reference Sweet and Lehnert1958), a steady-state model where flows bring magnetic field into a region of high current (called a current sheet), where it is annihilated, leading to heating and driving jets of material ejected from the reconnection region. In this model, the reconnection rate scales as $ {S}^{-1/2} $
, where
$ {S}^{-1/2} $
, where $ S $
is the Lundquist number defined as
$ S $
is the Lundquist number defined as $ S\equiv {LV}_A/\eta ={\tau}_{\eta }/{\tau}_{\mathrm{A}} $
with
$ S\equiv {LV}_A/\eta ={\tau}_{\eta }/{\tau}_{\mathrm{A}} $
with $ L $
the current sheet half-length,
$ L $
the current sheet half-length, $ {V}_A $
the Alfvén speed,
$ {V}_A $
the Alfvén speed, $ \eta $
the magnetic diffusivity, and
$ \eta $
the magnetic diffusivity, and $ {\tau}_{\eta } $
and
$ {\tau}_{\eta } $
and $ {\tau}_{\mathrm{A}} $
the diffusion and Alfvén times. With timescales for reconnection in this model scaling as the inverse root of the Lundquist number, with
$ {\tau}_{\mathrm{A}} $
the diffusion and Alfvén times. With timescales for reconnection in this model scaling as the inverse root of the Lundquist number, with $ S>{10}^{12} $
in the solar corona, this model is still unable to explain the short timescales of solar flares.
$ S>{10}^{12} $
in the solar corona, this model is still unable to explain the short timescales of solar flares.
To bridge this gap in timescales, it was proposed that the development of plasmoids in a reconnecting current sheet through the tearing instability (Furth et al., Reference Furth, Killeen and Rosenbluth1963) could play an important role in breaking up the current sheet and driving fast reconnection (e.g., Loureiro et al., Reference Loureiro, Schekochihin and Cowley2007; Shibata & Tanuma, Reference Shibata and Tanuma2001). This would be either through creating a turbulent current sheet or through plasmoid dynamics locally thinning the current sheet to scales where kinetic effects can anomalously enhance the magnetic diffusivity (e.g., Zweibel & Yamada, Reference Zweibel and Yamada2009). Subsequently, observations have shown what appear to be plasmoids developing in a flare current sheet (e.g., Takasao et al., Reference Takasao, Asai, Isobe and Shibata2012) supporting this idea. Figure 1a shows the flare observed by Takasao et al. (Reference Takasao, Asai, Isobe and Shibata2012) using the Atmospheric Imaging Assembly (AIA; Lemen et al., Reference Lemen, Title, Akin, Boerner, Chou, Drake, Duncan, Edwards, Friedlaender, Heyman, Hurlburt, Katz, Kushner, Levay, Lindgren, Mathur, McFeaters, Mitchell, Rehse and Waltham2012) on the Solar Dynamics Observatory with a zoomed image of the current sheet showing the plasma blobs interpreted as plasmoids. Panel (b) of that figure gives a schematic diagram that explains how the observations connect to the formation of plasmoids in a reconnecting current sheet.
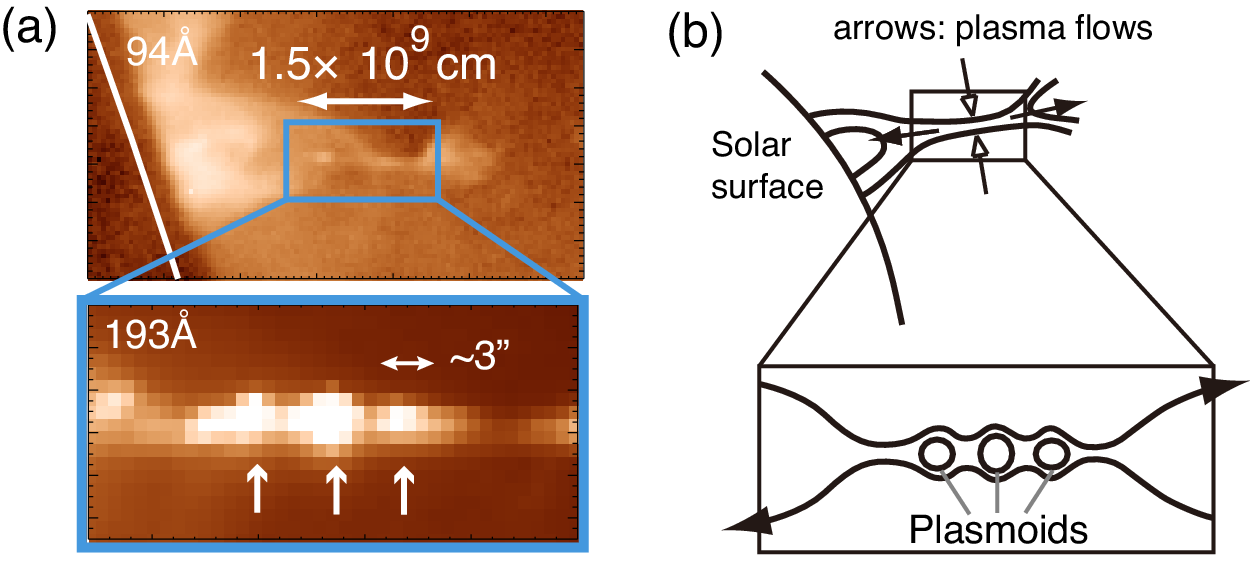
Figure 1. Image of a solar flare observed on August 18, 2010 with the Atmospheric Imaging Assembly (panel [a]). The zoomed image shows plasma blobs formed in the plasma sheet. Panel (b) presents a schematic diagram of these observations where the plasma sheet is understood as a current sheet with the plasma blobs interpreted as plasmoids.
To understand how the tearing instability develops in a reconnecting current sheet, it is standard practice to rescale the growth rates and wavenumbers to calculate them in terms of the half-length of the current sheet and not the half-width (which is used normally when calculating the growth rate of the instability; e.g., Furth et al., Reference Furth, Killeen and Rosenbluth1963). To do this, the aspect ratio $ a/L $
(with
$ a/L $
(with $ a $
the half-width of the current sheet and
$ a $
the half-width of the current sheet and $ L $
the half-length of the current sheet) is given to scale as
$ L $
the half-length of the current sheet) is given to scale as $ {S}^{-\alpha } $
(e.g., MacTaggart, Reference MacTaggart, MacTaggart and Hillier2020). After performing this rescaling, the instability is often known as the plasmoid instability. In a Sweet–Parker current sheet (
$ {S}^{-\alpha } $
(e.g., MacTaggart, Reference MacTaggart, MacTaggart and Hillier2020). After performing this rescaling, the instability is often known as the plasmoid instability. In a Sweet–Parker current sheet ( $ \alpha =1/2 $
), the maximum growth rate of the instability scales as
$ \alpha =1/2 $
), the maximum growth rate of the instability scales as $ {S}^{1/4} $
(e.g., Loureiro et al., Reference Loureiro, Schekochihin and Cowley2007). However, as explained by Pucci and Velli (Reference Pucci and Velli2014), the current sheet would become unstable to plasmoid formation before it has thinned/stretched to the Sweet–Parker aspect ratio. They proposed that
$ {S}^{1/4} $
(e.g., Loureiro et al., Reference Loureiro, Schekochihin and Cowley2007). However, as explained by Pucci and Velli (Reference Pucci and Velli2014), the current sheet would become unstable to plasmoid formation before it has thinned/stretched to the Sweet–Parker aspect ratio. They proposed that $ \alpha =1/3 $
is the correct scaling to expect as this is the aspect ratio where the tearing timescale becomes equal to the timescale for the ejection of a plasmoid (i.e., the Alfvén time).
$ \alpha =1/3 $
is the correct scaling to expect as this is the aspect ratio where the tearing timescale becomes equal to the timescale for the ejection of a plasmoid (i.e., the Alfvén time).
The aspect ratio of $ \sim {S}^{-1/3} $
has been found to be important for triggering the onset of plasmoid formation in a number of analytical and numerical studies (e.g., Comisso et al., Reference Comisso, Lingam, Huang and Bhattacharjee2016; Huang et al., Reference Huang, Comisso and Bhattacharjee2017), but the question still remains as to what is happening in observed astrophysical systems. In this paper, we will investigate whether the magnetic reconnection behind observed solar flares can be understood through the plasmoid instability paradigm. We use some simple scaling laws to investigate the value of
$ \sim {S}^{-1/3} $
has been found to be important for triggering the onset of plasmoid formation in a number of analytical and numerical studies (e.g., Comisso et al., Reference Comisso, Lingam, Huang and Bhattacharjee2016; Huang et al., Reference Huang, Comisso and Bhattacharjee2017), but the question still remains as to what is happening in observed astrophysical systems. In this paper, we will investigate whether the magnetic reconnection behind observed solar flares can be understood through the plasmoid instability paradigm. We use some simple scaling laws to investigate the value of $ \alpha $
required to explain the development of plasmoids that have been observed in solar flares, and connect these values with the current theoretical understanding.
$ \alpha $
required to explain the development of plasmoids that have been observed in solar flares, and connect these values with the current theoretical understanding.
Scaling laws and their application to observations
For the tearing instability, there are well-established derivations of the most unstable mode of the instability (e.g., Tajima & Shibata, Reference Tajima and Shibata2002). These give
 $$ \frac{a}{V_A}{\sigma}_{\mathrm{max}}={C}_1{S}^{\ast -1/2}, $$
 $$ {ak}_{\mathrm{max}}={C}_2{S}^{\ast -1/4}, $$
where $ {k}_{\mathrm{max}} $
is the most unstable wavenumber of the system,
$ {k}_{\mathrm{max}} $
is the most unstable wavenumber of the system, $ {\sigma}_{\mathrm{max}} $
is the corresponding growth rate,
$ {\sigma}_{\mathrm{max}} $
is the corresponding growth rate, $ {S}^{\ast}\equiv {aV}_A/\eta $
(the Lundquist number defined by the current sheet half-width
$ {S}^{\ast}\equiv {aV}_A/\eta $
(the Lundquist number defined by the current sheet half-width $ a $
), and
$ a $
), and $ {C}_1 $
and
$ {C}_1 $
and $ {C}_2 $
are constants of order 1. For example, for a Harris current sheet, they become
$ {C}_2 $
are constants of order 1. For example, for a Harris current sheet, they become $ {C}_1\approx 0.62 $
and
$ {C}_1\approx 0.62 $
and $ {C}_2\approx 1.36 $
.
$ {C}_2\approx 1.36 $
.
Following the arguments for the plasmoid instability (e.g., MacTaggart, Reference MacTaggart, MacTaggart and Hillier2020), we set that the half-width and half-length of the current sheet are connected by $ a/L={S}^{-\alpha } $
. We can rescale the maximum growth rate and the most unstable wavelength to be in terms of
$ a/L={S}^{-\alpha } $
. We can rescale the maximum growth rate and the most unstable wavelength to be in terms of $ S $
and not
$ S $
and not $ {S}^{\ast } $
. For the growth rate, we have
$ {S}^{\ast } $
. For the growth rate, we have
 $$ {\sigma}_{\mathrm{max}}=\frac{V_A}{a}{C}_1{S}^{\ast -1/2}={C}_1\frac{V_A}{L}\frac{L}{a}{S}^{-1/2}{\left(\frac{a}{L}\right)}^{-1/2}={C}_1\frac{V_A}{L}{S}^{\left(3\alpha -1\right)/2}. $$
For the corresponding wave number, we have
 $$ {k}_{\mathrm{max}}=\frac{1}{a}{C}_2{S}^{\ast -1/4}={C}_2\frac{1}{L}\frac{L}{a}{S}^{-1/4}{\left(\frac{a}{L}\right)}^{-1/4}={C}_2\frac{1}{L}{S}^{\left(5\alpha -1\right)/4}. $$
Using Equation (4), and taking that $ {C}_2\hskip0.35em \approx \hskip0.35em 1 $
, we can rearrange to solve for
$ {C}_2\hskip0.35em \approx \hskip0.35em 1 $
, we can rearrange to solve for $ \alpha $
, that is,
$ \alpha $
, that is,
 $$ \alpha =\frac{4}{5}\left(\frac{\log_{10}\left({k}_{\mathrm{max}}L\right)}{\log_{10}(S)}+\frac{1}{4}\right). $$
It is these relations that we will apply to the flare observations to determine the value of $ \alpha $
.
$ \alpha $
.
The hypothesis we will test is whether, as expected from reconnection theory, solar flare observations present a consistent value of $ \alpha $
. If found, this would provide further evidence of the importance of the tearing instability in solar flare reconnection.
$ \alpha $
. If found, this would provide further evidence of the importance of the tearing instability in solar flare reconnection.
Application to observed plasmoids
In this section, we analyze the plasmoids observed in three separate flares (displaying notably different scales). The data for the three flares we use are presented in Takasao et al. (Reference Takasao, Asai, Isobe and Shibata2012), Milligan et al. (Reference Milligan, McAteer, Dennis and Young2010), and Patel et al. (Reference Patel, Pant, Chandrashekhar and Banerjee2020), respectively. Below, we detail the key characteristics of these different observations, and then summarize the key quantities in Table 1, where the estimated $ \alpha $
value is also presented.
$ \alpha $
value is also presented.
Table 1. Key characteristics of the current sheet and plasmoids including the half-length of the current sheet, the estimated Alfvén speed, the characteristic plasmoid size, and the Lundquist number and $ \alpha $
value calculated from these measurements for the different observed flares
$ \alpha $
value calculated from these measurements for the different observed flares

a Data extracted from Takasao et al. (Reference Takasao, Asai, Isobe and Shibata2012).
b Data extracted from Milligan et al. (Reference Milligan, McAteer, Dennis and Young2010).
c Data extracted from Patel et al. (Reference Patel, Pant, Chandrashekhar and Banerjee2020).
The observations of Takasao et al. (Reference Takasao, Asai, Isobe and Shibata2012) show the development of a long, thin current sheet, in which plasma blobs develop and are ejected. The outflow velocity (a good proxy for the Alfvén speed, e.g., Parker, Reference Parker1957) was observed to be $ 220 $
–
$ 220 $
– $ 460 $
km/s. Here, we take the largest value
$ 460 $
km/s. Here, we take the largest value $ 4.6\times {10}^5 $
m/s to be the representative value of the Alfvén speed. The half-length of the current sheet was observed to be at least
$ 4.6\times {10}^5 $
m/s to be the representative value of the Alfvén speed. The half-length of the current sheet was observed to be at least $ 7\times {10}^6 $
m. The typical size of the observed plasma blobs, interpreted to be plasmoids due to their movement along the current sheet, was
$ 7\times {10}^6 $
m. The typical size of the observed plasma blobs, interpreted to be plasmoids due to their movement along the current sheet, was $ 2.9\times {10}^6 $
m (the interpretation as plasmoids was further supported by radio observations that detected the signatures of electron acceleration associated with their movement [Takasao et al., Reference Takasao, Asai, Isobe and Shibata2016]). This implies a wavenumber of
$ 2.9\times {10}^6 $
m (the interpretation as plasmoids was further supported by radio observations that detected the signatures of electron acceleration associated with their movement [Takasao et al., Reference Takasao, Asai, Isobe and Shibata2016]). This implies a wavenumber of $ 3\times {10}^{-6} $
/m. Taking the temperature to be
$ 3\times {10}^{-6} $
/m. Taking the temperature to be $ {10}^6 $
K, we expect the magnetic diffusivity to be
$ {10}^6 $
K, we expect the magnetic diffusivity to be $ 1 $
m
$ 1 $
m $ {}^2 $
/s, meaning that we have
$ {}^2 $
/s, meaning that we have $ S=3.2\times {10}^{12} $
.
$ S=3.2\times {10}^{12} $
.
The observations of Milligan et al. (Reference Milligan, McAteer, Dennis and Young2010) show a plasmoid observed in hard X-ray by RHESSI (Reuven Ramaty High Energy Solar Spectroscopic Imager). From the observations presented in Figure 3 of Milligan et al. (Reference Milligan, McAteer, Dennis and Young2010), it seems reasonable to take a plasmoid (Source A in that figure) to be of size $ \sim 35 $
arcsec (
$ \sim 35 $
arcsec ( $ \sim 2.5\times {10}^7 $
m), which becomes the wavelength used for our analysis. We can also make an estimate of the half-length of the current sheet. First, we can consider as a lower estimate the distance between the center of the two hard X-ray sources (again as shown in Figure 3 of Milligan et al., Reference Milligan, McAteer, Dennis and Young2010), which is
$ \sim 2.5\times {10}^7 $
m), which becomes the wavelength used for our analysis. We can also make an estimate of the half-length of the current sheet. First, we can consider as a lower estimate the distance between the center of the two hard X-ray sources (again as shown in Figure 3 of Milligan et al., Reference Milligan, McAteer, Dennis and Young2010), which is $ \sim 60 $
arcsec (
$ \sim 60 $
arcsec ( $ \sim 4.4\times {10}^7 $
m). Alternatively, we can take as an upper limit of the length the distance between the flare arcade and the inner edge of the COR2 Coronagraph on the STEREO B satellite (Kaiser et al., Reference Kaiser, Kucera, Davila, St. Cyr, Guhathakurta and Christian2008), which is
$ \sim 4.4\times {10}^7 $
m). Alternatively, we can take as an upper limit of the length the distance between the flare arcade and the inner edge of the COR2 Coronagraph on the STEREO B satellite (Kaiser et al., Reference Kaiser, Kucera, Davila, St. Cyr, Guhathakurta and Christian2008), which is $ \sim 300 $
arcsec, which gives an upper estimate of the half-length of
$ \sim 300 $
arcsec, which gives an upper estimate of the half-length of $ 150 $
arcsec (
$ 150 $
arcsec ( $ \sim 1.1\times {10}^8 $
m). From these observations, it is not possible to directly estimate the Alfvén speed. We can give an upper estimate for the Alfvén speed from the CME speed, which is
$ \sim 1.1\times {10}^8 $
m). From these observations, it is not possible to directly estimate the Alfvén speed. We can give an upper estimate for the Alfvén speed from the CME speed, which is $ 1.3\times {10}^6 $
m/s (the SOHO/LASCO CME Catalog; Yashiro et al., Reference Yashiro, Gopalswamy, Michalek, St. Cyr, Plunkett, Rich and Howard2004), although we also look at the effect of using the slower speed of
$ 1.3\times {10}^6 $
m/s (the SOHO/LASCO CME Catalog; Yashiro et al., Reference Yashiro, Gopalswamy, Michalek, St. Cyr, Plunkett, Rich and Howard2004), although we also look at the effect of using the slower speed of $ 4.6\times {10}^5 $
m/s as found in the study of Takasao et al. (Reference Takasao, Asai, Isobe and Shibata2012). Again, we take
$ 4.6\times {10}^5 $
m/s as found in the study of Takasao et al. (Reference Takasao, Asai, Isobe and Shibata2012). Again, we take $ \eta =1 $
m
$ \eta =1 $
m $ {}^2 $
/s. These values give a range of Lundquist numbers between
$ {}^2 $
/s. These values give a range of Lundquist numbers between $ S=2.2\times {10}^{13} $
and
$ S=2.2\times {10}^{13} $
and $ 1.4\times {10}^{14} $
.
$ 1.4\times {10}^{14} $
.
The observations of Patel et al. (Reference Patel, Pant, Chandrashekhar and Banerjee2020) show an evolving current sheet, which produces many plasmoids of varying size traveling at varying speeds. These plasmoids are observed in the lower solar corona by AIA and further out by COR2. To distill the observations into the key set of numbers we require, we focus on the observed plasmoids as seen by AIA. Taking the Alfvén speed as the approximate upper limit of the observed plasmoid velocity, we use a value of $ 4.3\times {10}^5 $
m/s. The observed plasmoid width of
$ 4.3\times {10}^5 $
m/s. The observed plasmoid width of $ \sim 5.65\times {10}^6 $
m is used as the wavelength of the tearing instability. The estimate for the half-length of the current sheet can be estimated from their Figure 11, where the stagnation height of the plasmoids can be determined. Subtracting the height of the flare arcade leads to a height of
$ \sim 5.65\times {10}^6 $
m is used as the wavelength of the tearing instability. The estimate for the half-length of the current sheet can be estimated from their Figure 11, where the stagnation height of the plasmoids can be determined. Subtracting the height of the flare arcade leads to a height of $ \sim 75 $
arcsec (
$ \sim 75 $
arcsec ( $ 5.4\times {10}^7 $
m). Again, we take
$ 5.4\times {10}^7 $
m). Again, we take $ \eta =1 $
m
$ \eta =1 $
m $ {}^2 $
/s.
$ {}^2 $
/s.
The $ \alpha $
values found for these observations are displayed in the rightmost column of Table 1, giving a range between
$ \alpha $
values found for these observations are displayed in the rightmost column of Table 1, giving a range between $ 0.26 $
and
$ 0.26 $
and $ 0.31 $
. Although there is naturally some uncertainty in the number of the parameters used to calculate the
$ 0.31 $
. Although there is naturally some uncertainty in the number of the parameters used to calculate the $ \alpha $
values, and this is potentially responsible for some of the spread observed, in general the widely different scales of the observations are presenting
$ \alpha $
values, and this is potentially responsible for some of the spread observed, in general the widely different scales of the observations are presenting $ \alpha $
values that are in a relatively small range. Considering the range of Lundquist numbers by one to two orders of magnitude, as well as the order of magnitude range in plasmoid size and current sheet lengths, this provides evidence that the theoretical understanding of how plasmoids are formed in flaring current sheets is consistent with the observations.
$ \alpha $
values that are in a relatively small range. Considering the range of Lundquist numbers by one to two orders of magnitude, as well as the order of magnitude range in plasmoid size and current sheet lengths, this provides evidence that the theoretical understanding of how plasmoids are formed in flaring current sheets is consistent with the observations.
To highlight how robust the values calculated for $ \alpha $
actually are, we can look at what happens if we take into account some of the uncertainties in our estimates for various quantities and apply these to the
$ \alpha $
actually are, we can look at what happens if we take into account some of the uncertainties in our estimates for various quantities and apply these to the $ \alpha $
value for the flare observed by Takasao et al. (Reference Takasao, Asai, Isobe and Shibata2012). First, we can take
$ \alpha $
value for the flare observed by Takasao et al. (Reference Takasao, Asai, Isobe and Shibata2012). First, we can take $ {C}_1 $
to be
$ {C}_1 $
to be $ 1.36 $
. In this case, we find a value of
$ 1.36 $
. In this case, we find a value of $ \alpha =0.27 $
. Alternatively, we can assume that the half-length of our current sheet has been underestimated due to projection effects. Making
$ \alpha =0.27 $
. Alternatively, we can assume that the half-length of our current sheet has been underestimated due to projection effects. Making $ L $
to be 30% larger (and with it
$ L $
to be 30% larger (and with it $ S $
to be
$ S $
to be $ {1.3}^2 $
larger due to the effect of the projection effects on the estimate of the Alfvén speed), we find
$ {1.3}^2 $
larger due to the effect of the projection effects on the estimate of the Alfvén speed), we find $ \alpha =0.28 $
. Finally, for the diffusion, we had assumed that the temperature of the medium was
$ \alpha =0.28 $
. Finally, for the diffusion, we had assumed that the temperature of the medium was $ {10}^6 $
K, but
$ {10}^6 $
K, but $ \eta \propto {T}^{-3/2} $
and the temperature in the current sheet is likely to be up to one order of magnitude hotter than the temperature assumed here. Taking
$ \eta \propto {T}^{-3/2} $
and the temperature in the current sheet is likely to be up to one order of magnitude hotter than the temperature assumed here. Taking $ T={10}^7 $
K, we find
$ T={10}^7 $
K, we find $ \alpha =0.27 $
. Further uncertainties still exist. The question of accurate determination of the current sheet length (where the observed length may also contain the reconnection jets as well as the current sheet) also leads to uncertainty. However, for the flare observed by Takasao et al. (Reference Takasao, Asai, Isobe and Shibata2012), reducing the length by a factor of 2 results in a small reduction of
$ \alpha =0.27 $
. Further uncertainties still exist. The question of accurate determination of the current sheet length (where the observed length may also contain the reconnection jets as well as the current sheet) also leads to uncertainty. However, for the flare observed by Takasao et al. (Reference Takasao, Asai, Isobe and Shibata2012), reducing the length by a factor of 2 results in a small reduction of $ \alpha $
to
$ \alpha $
to $ \alpha =0.26 $
. Moreover, the observed plasmoid size may be overestimated as the observations are likely to show the later state of a plasmoid once it has accumulated more flux. Taking a plasmoid to initially be only half the observed size results in
$ \alpha =0.26 $
. Moreover, the observed plasmoid size may be overestimated as the observations are likely to show the later state of a plasmoid once it has accumulated more flux. Taking a plasmoid to initially be only half the observed size results in $ \alpha =0.29 $
. Therefore, we can conclude that reasonable levels of uncertainty do not result in large variation in the calculated value of
$ \alpha =0.29 $
. Therefore, we can conclude that reasonable levels of uncertainty do not result in large variation in the calculated value of $ \alpha $
.
$ \alpha $
.
Determining an $ \alpha $
value has a particular consequence, and it implicitly makes a prediction for the thickness of the flare current sheet. Looking at the value obtained for the flare studied by Takasao et al. (Reference Takasao, Asai, Isobe and Shibata2012), the calculated value of
$ \alpha $
value has a particular consequence, and it implicitly makes a prediction for the thickness of the flare current sheet. Looking at the value obtained for the flare studied by Takasao et al. (Reference Takasao, Asai, Isobe and Shibata2012), the calculated value of $ \alpha $
implies that the actual thickness of the flare current sheet is
$ \alpha $
implies that the actual thickness of the flare current sheet is $ a\hskip0.35em \approx \hskip0.35em 2.2\times {10}^3 $
m. This is approximately 2.5 orders of magnitude smaller than the observed half-thickness of the plasma sheet in the observations of
$ a\hskip0.35em \approx \hskip0.35em 2.2\times {10}^3 $
m. This is approximately 2.5 orders of magnitude smaller than the observed half-thickness of the plasma sheet in the observations of $ 7\times {10}^5 $
m (Takasao et al., Reference Takasao, Asai, Isobe and Shibata2012). However, this can be easily explained if the current sheet is not exactly aligned with the line of sight, meaning that its depth is projected to look like its width, or as a result of a thermal halo formed around the current sheet through heat conduction (Forbes & Malherbe, Reference Forbes and Malherbe1991; Takasao et al., Reference Takasao, Matsumoto, Nakamura and Shibata2015; Yokoyama & Shibata, Reference Yokoyama and Shibata2001). In this case, the measured value of
$ 7\times {10}^5 $
m (Takasao et al., Reference Takasao, Asai, Isobe and Shibata2012). However, this can be easily explained if the current sheet is not exactly aligned with the line of sight, meaning that its depth is projected to look like its width, or as a result of a thermal halo formed around the current sheet through heat conduction (Forbes & Malherbe, Reference Forbes and Malherbe1991; Takasao et al., Reference Takasao, Matsumoto, Nakamura and Shibata2015; Yokoyama & Shibata, Reference Yokoyama and Shibata2001). In this case, the measured value of $ \alpha $
would imply a timescale for the growth of the tearing instability of
$ \alpha $
would imply a timescale for the growth of the tearing instability of $ \approx 150 $
s. This is much shorter than the timeframe of the flare observations, meaning that for the
$ \approx 150 $
s. This is much shorter than the timeframe of the flare observations, meaning that for the $ \alpha $
value we find it would be reasonable for plasmoids to develop during the course of the observations.
$ \alpha $
value we find it would be reasonable for plasmoids to develop during the course of the observations.
Discussion
There have been many attempts in recent years to understand the connection between the fast, bursty reconnection observed in astrophysical systems through the plasmoid instability. These studies have made great progress through analytic theory and through numerical modeling. In this paper, we have extended these studies by looking at observational data of three solar flares and showing that it is consistent with an aspect ratio of $ a/L={S}^{-0.26} $
to
$ a/L={S}^{-0.26} $
to $ {S}^{-0.31} $
.
$ {S}^{-0.31} $
.
The key finding for the solar flares we have studied is that the value for $ \alpha $
(
$ \alpha $
( $ \alpha =0.26 $
to
$ \alpha =0.26 $
to $ 0.31 $
) is relatively close to the theoretical predictions of Pucci and Velli (Reference Pucci and Velli2014) (e.g.,
$ 0.31 $
) is relatively close to the theoretical predictions of Pucci and Velli (Reference Pucci and Velli2014) (e.g., $ \alpha =1/3 $
). However, it is important to note that this small difference is in fact somewhat difficult to reconcile through observational error due to the lack of sensitivity of
$ \alpha =1/3 $
). However, it is important to note that this small difference is in fact somewhat difficult to reconcile through observational error due to the lack of sensitivity of $ \alpha $
to reasonable estimates of the errors in the parameters used. There will always be some uncertainty with the value of
$ \alpha $
to reasonable estimates of the errors in the parameters used. There will always be some uncertainty with the value of $ \alpha $
that cannot be quantified; for example, Huang et al. (Reference Huang, Comisso and Bhattacharjee2017) found in their numerical simulations that the wavenumber that ultimately grew was a factor of
$ \alpha $
that cannot be quantified; for example, Huang et al. (Reference Huang, Comisso and Bhattacharjee2017) found in their numerical simulations that the wavenumber that ultimately grew was a factor of $ 3 $
to
$ 3 $
to $ 6 $
smaller than the most unstable mode. If we take that the measured plasmoids are from a wavenumber six times smaller than the most unstable mode, we then find
$ 6 $
smaller than the most unstable mode. If we take that the measured plasmoids are from a wavenumber six times smaller than the most unstable mode, we then find $ \alpha =0.31 $
to
$ \alpha =0.31 $
to $ 0.35 $
, that is, it gives the predicted scaling of
$ 0.35 $
, that is, it gives the predicted scaling of $ \alpha =1/3 $
by Pucci and Velli (Reference Pucci and Velli2014), but it is not possible to prove with current observations that this process is happening in solar flare reconnection.
$ \alpha =1/3 $
by Pucci and Velli (Reference Pucci and Velli2014), but it is not possible to prove with current observations that this process is happening in solar flare reconnection.
If we consider how a plasmoid may be formed when the timescale for its growth is longer than the expected timescale of the ejection, there may be some aspect of the reconnection flow that allows this to happen. For example, this may be occurring through plasmoid formation around the stagnation point of the flows into and out of the current sheet, allowing the first plasmoid to form in the current sheet where it takes significantly longer to eject allowing them to grow. This is an area for future investigation.
Magnetic reconnection is an important physical process in many astrophysical and space systems for driving the quick release of energy stored in magnetic fields. Therefore, quantifying how observed magnetic reconnection fits into current models of magnetic reconnection is an important topic of research. The methods laid out in this paper should be applicable for any observed reconnection region where the plasmoids have been observed. Finding further observations, in any system, to see if a similar value of $ \alpha $
is consistently found would be an important future step.
$ \alpha $
is consistently found would be an important future step.
Acknowledgment
A.H. would like to acknowledge the lectures of Dr. David MacTaggart at the Advanced Topics in MHD Summer School held in CISM, Udine, which led to the idea for this paper.
Data availability statement
The data used in this paper are available already in other published works.
Author contributions
A.H. designed the study and wrote the manuscript. S.T. provided feedback and guidance on the flare observations and application of the theory.
Funding statement
A.H. is supported by STFC Research Grant No. ST/V000659/1. S.T. is supported by JSPS KAKENHI Grant Nos. JP22H00134, JP22K14074, and JP21H04487.
Conflict of interest
Both authors have no conflicts of interest to declare.


 Open access
Comments
Comments to the Author: In this manuscript the authors tried to connect observational parameters of solar flares to the scaling law of magnetic reconnection, and it seems that the scaling law is quite similar to what proposed earlier via numerical simulations. If the topic fits into the theme of the journal, I’d like to recommend it to be published after revisions.
Major issues:
1. Personally I tend to think that the 1.5*10^9 cm in Fig. 1 is not the length of the current sheet. It might consists of a much shorter current sheet in the middle and long bidirectional outflows both upward and downward. In this case L might be much smaller. Its effect on alpha should also be discussed on p.4.
2. In this paper, the magnetic diffusivity is taken to be the classical value. However, it has been proposed that anomalous resistivity is required for MR to occur, and particle simulations indeed showed that the diffusivity is enhanced by ~6 orders of magnitude during reconnection. In this case, S would be substantially smaller, and alpha would be much larger according to Eq. (5).
Minor issues:
1. In several places, “magnetic diffusion” should be “magnetic diffusivity”;
2. In several places, “Arcsec” should be “arcsec”;
3. P. 1: “is unable to still” --> “is still unable to”;
4. Figure1 panel (a) --> Figure 1(a);
5. table 1 -->Table 1;
6. The X8.2-class solar flare on 2017-09-10 can be used as the 4th example if possible.