


Introduction
Electric fish explore their surroundings with an electric field characterized by either pulsating patterns or continuous sine-waves generated by the discharge of an electric organ (EOD). “Electric images” generated by the presence of objects are differently encoded by primary afferents (pulse evoked bursts in pulse-emitting and pseudorandom trains in wave-emitting fish). This draws clear distinctions between pulse and wave electroreception strategies (Caputi & Aguilera, Reference Caputi and Aguilera2020). In the electrosensory lobe (ESL) of wave Gymnotiformes, the spike rate of individual neurons and synchrony within neuronal subpopulations encode the modulation of local signals (reviewed in Clarke et al., Reference Clarke, Longtin and Maler2015; Krahe & Maler Reference Krahe and Maler2014). The ESL of pulse Gymnotiformes appears to show different signal processing rules since each pulse reclutes the network with neuron-specific post-EOD phase preferent patterns (Pereira et al., Reference Pereira, Rodriguez-Cattaneo and Caputi2014) and evokes local field potential which patterns are modulated by changes in the electrosensory environment (Pereira et al., Reference Pereira, Centurión and Caputi2005).
Objectives
This raises the question of whether spike timing of different unit types of the ESL of pulse Gymnotiform fish carry information regarding nearby objects in natural conditions. To start answering this question, we used a tethered technique (in the absence of a wireless option, as in Cohen et al., Reference Cohen, Vinepinsky and Segev2019; Fotowat et al., Reference Fotowat, Lee, Jaeyoon Jun and Maler2019) to record unitary activity from electrodes positioned at the polymorphic layer of the ESL (as indicated by their typical field potentials Pereira et al., Reference Pereira, Rodriguez-Cattaneo and Caputi2014). This allowed us to explore peri-EOD spiking patterns and their modulation by metal and plastic, cubic or tubular, and static or moving objects.
Methods
Data were obtained from 4 Gymnotus omarorum (12-15 cm length, undetermined sex). All potentially-painful procedures were performed in fish non-responsive to noxious stimuli (IIBCE’s animal care committee, protocol 001/003/2011; protocols.io). Fish were scalped under systemic and local anesthesia. A small skull opening was made to introduce two insulated nichrome twisted wires (50 μm diameter each). Wires were cemented to the skull with their exposed tips at the polymorphic layer of the centro-medial map of the lobe (1400 μm depth). This pair, and another in the tank (40x50x7 cm, water at 20º and 100 μS/cm), were connected to differential amplifiers (1800-AM-systems, bandpass: 300-3000 and 10-10000 Hz for spikes and EOD, respectively) whose outputs were digitized (50 kHz), stored, and processed using Experimenter (Datawave Technologies). Recordings started four hours after the EOD rate returned to the previous baseline (Fig. 1). After recordings, fish were euthanized.
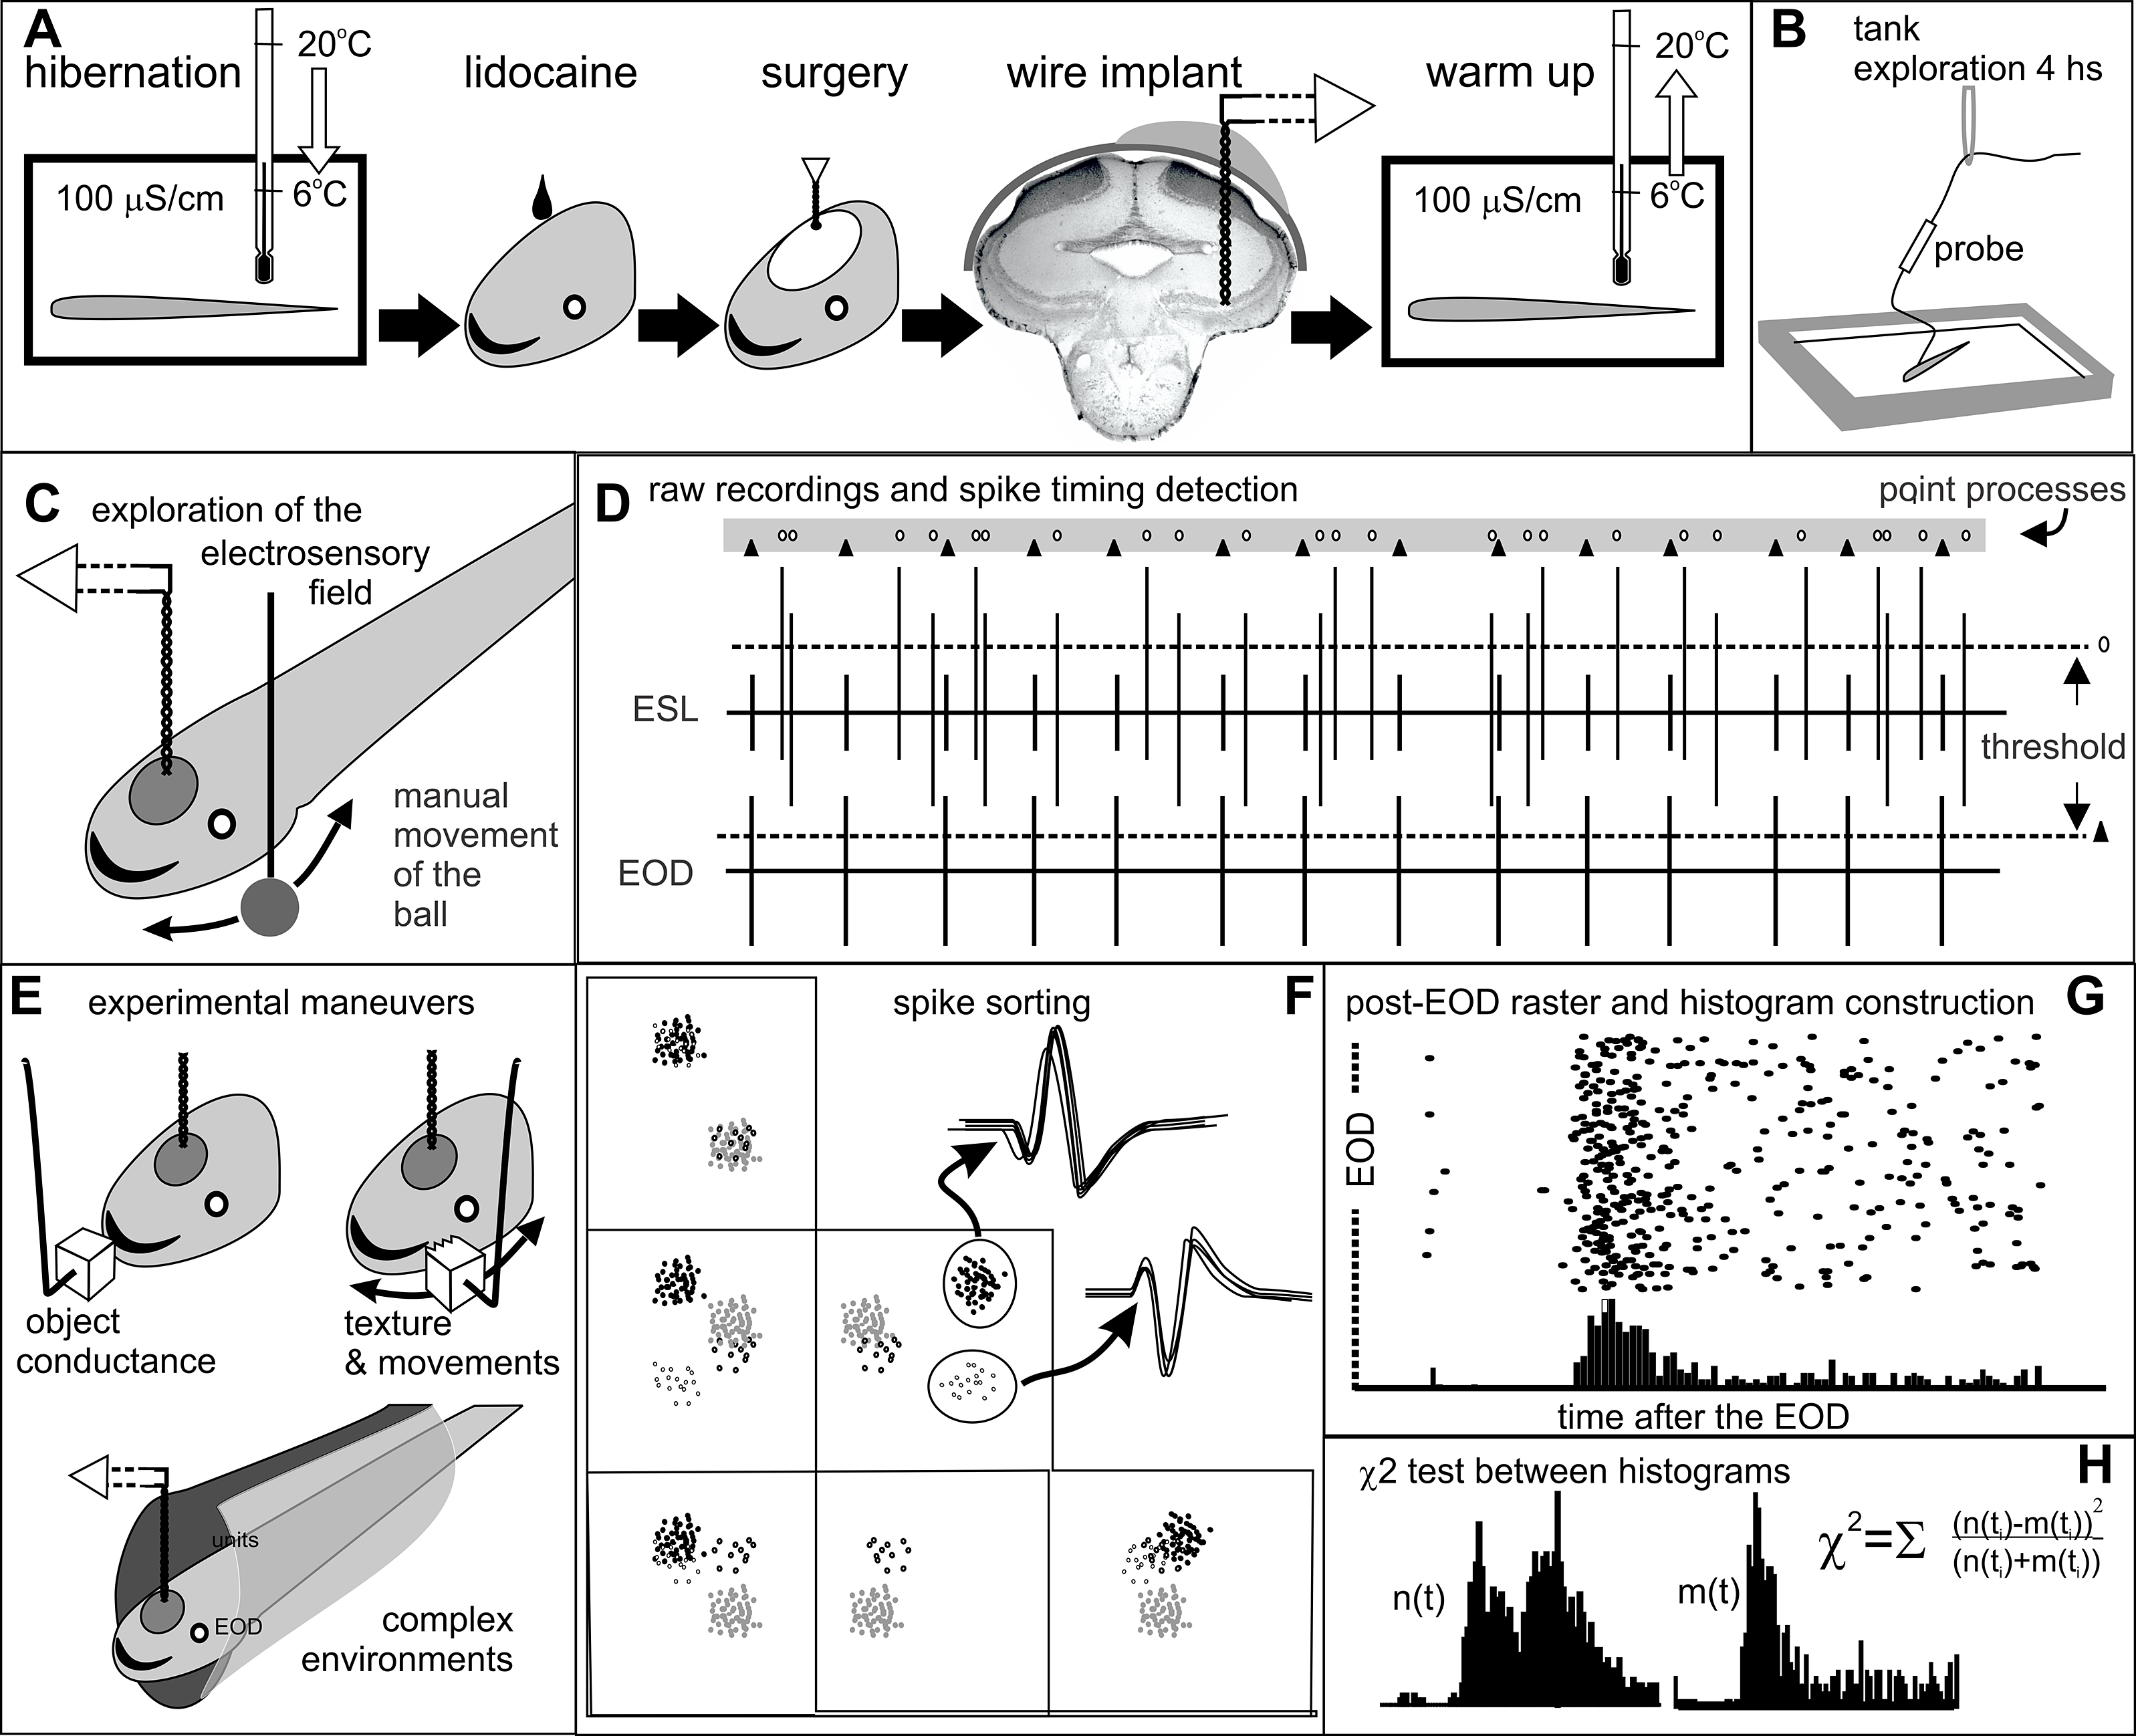
Figure 1. Methods. Step-by-step detailed explanation in protocols.io A) Surgical procedures. B) Recovery and fish adaptation to the tank. During this period the implanted wires (20-25 cm long) were connected to the amplified probe, which in turn was hanging from a rubber band. We verified electrode location recording field potentials at 10 Hz - 10 KHz bandpass filtering and setup unit recordings and analysis (Pereira et al., Reference Pereira, Rodriguez-Cattaneo and Caputi2014). C) Identification of receptive fields. We took advantage of long resting periods to manually explore the receptive field of the best sorted unit with a small copper ball (8 mm diameter) moved in all directions parallel to the skin. D) Raw recordings and point process conversion. Each signal was appropriately thresholded (dotted lines) to define the timestamp of each recorded unit (ovals) and EOD (triangles). E) Experimental maneuvers aimed to: i) Identify opposite responses to plastic or metal objects at the center of the receptive field (Clarke et al., Reference Clarke, Longtin and Maler2015); ii) Explore electric texture effects caused by sharp edges and gutters on object’s surface (Caputi et al., Reference Caputi, Aguilera and Pereira2011); and, iii) Explore the effect of hiding in a plastic tube. F) Spike clustering and sorting plotting various spike parameters in a multidimensional space. G) Construction of raster plots. H) Statistical comparison of post-EOD spike timing distributions using chi-squared tests.
Results
Multiunitary recordings were obtained in one fish. In the other 3 fish, 2 units were clearly sorted in each. In these 6 units, spike timing showed a non-uniform probability distribution following the EOD. Spike patterns exhibited the presence of a silence between 7 to 10 ms, and 1 to 3 modes found at ca. 5, 12, or more than 23 ms after the positive peak of the EOD. Post-EOD spike histogram peaks were differently modulated, corresponding to the unit and sensory context. In three units we identified the receptive field. These were selected to explore their responses to distinct types of electrosensory stimuli. Each of these responses is illustrated in different figures (Fig 2: object conductivity, plastic vs. metal cubes 2 cm side, see Clarke et al., Reference Clarke, Longtin and Maler2015; Fig. 3: movement and texture effects, see Caputi et al., Reference Caputi, Aguilera and Pereira2011; and Fig. 4: tube hiding behavior, see Pereira et al., Reference Pereira, Centurión and Caputi2005).
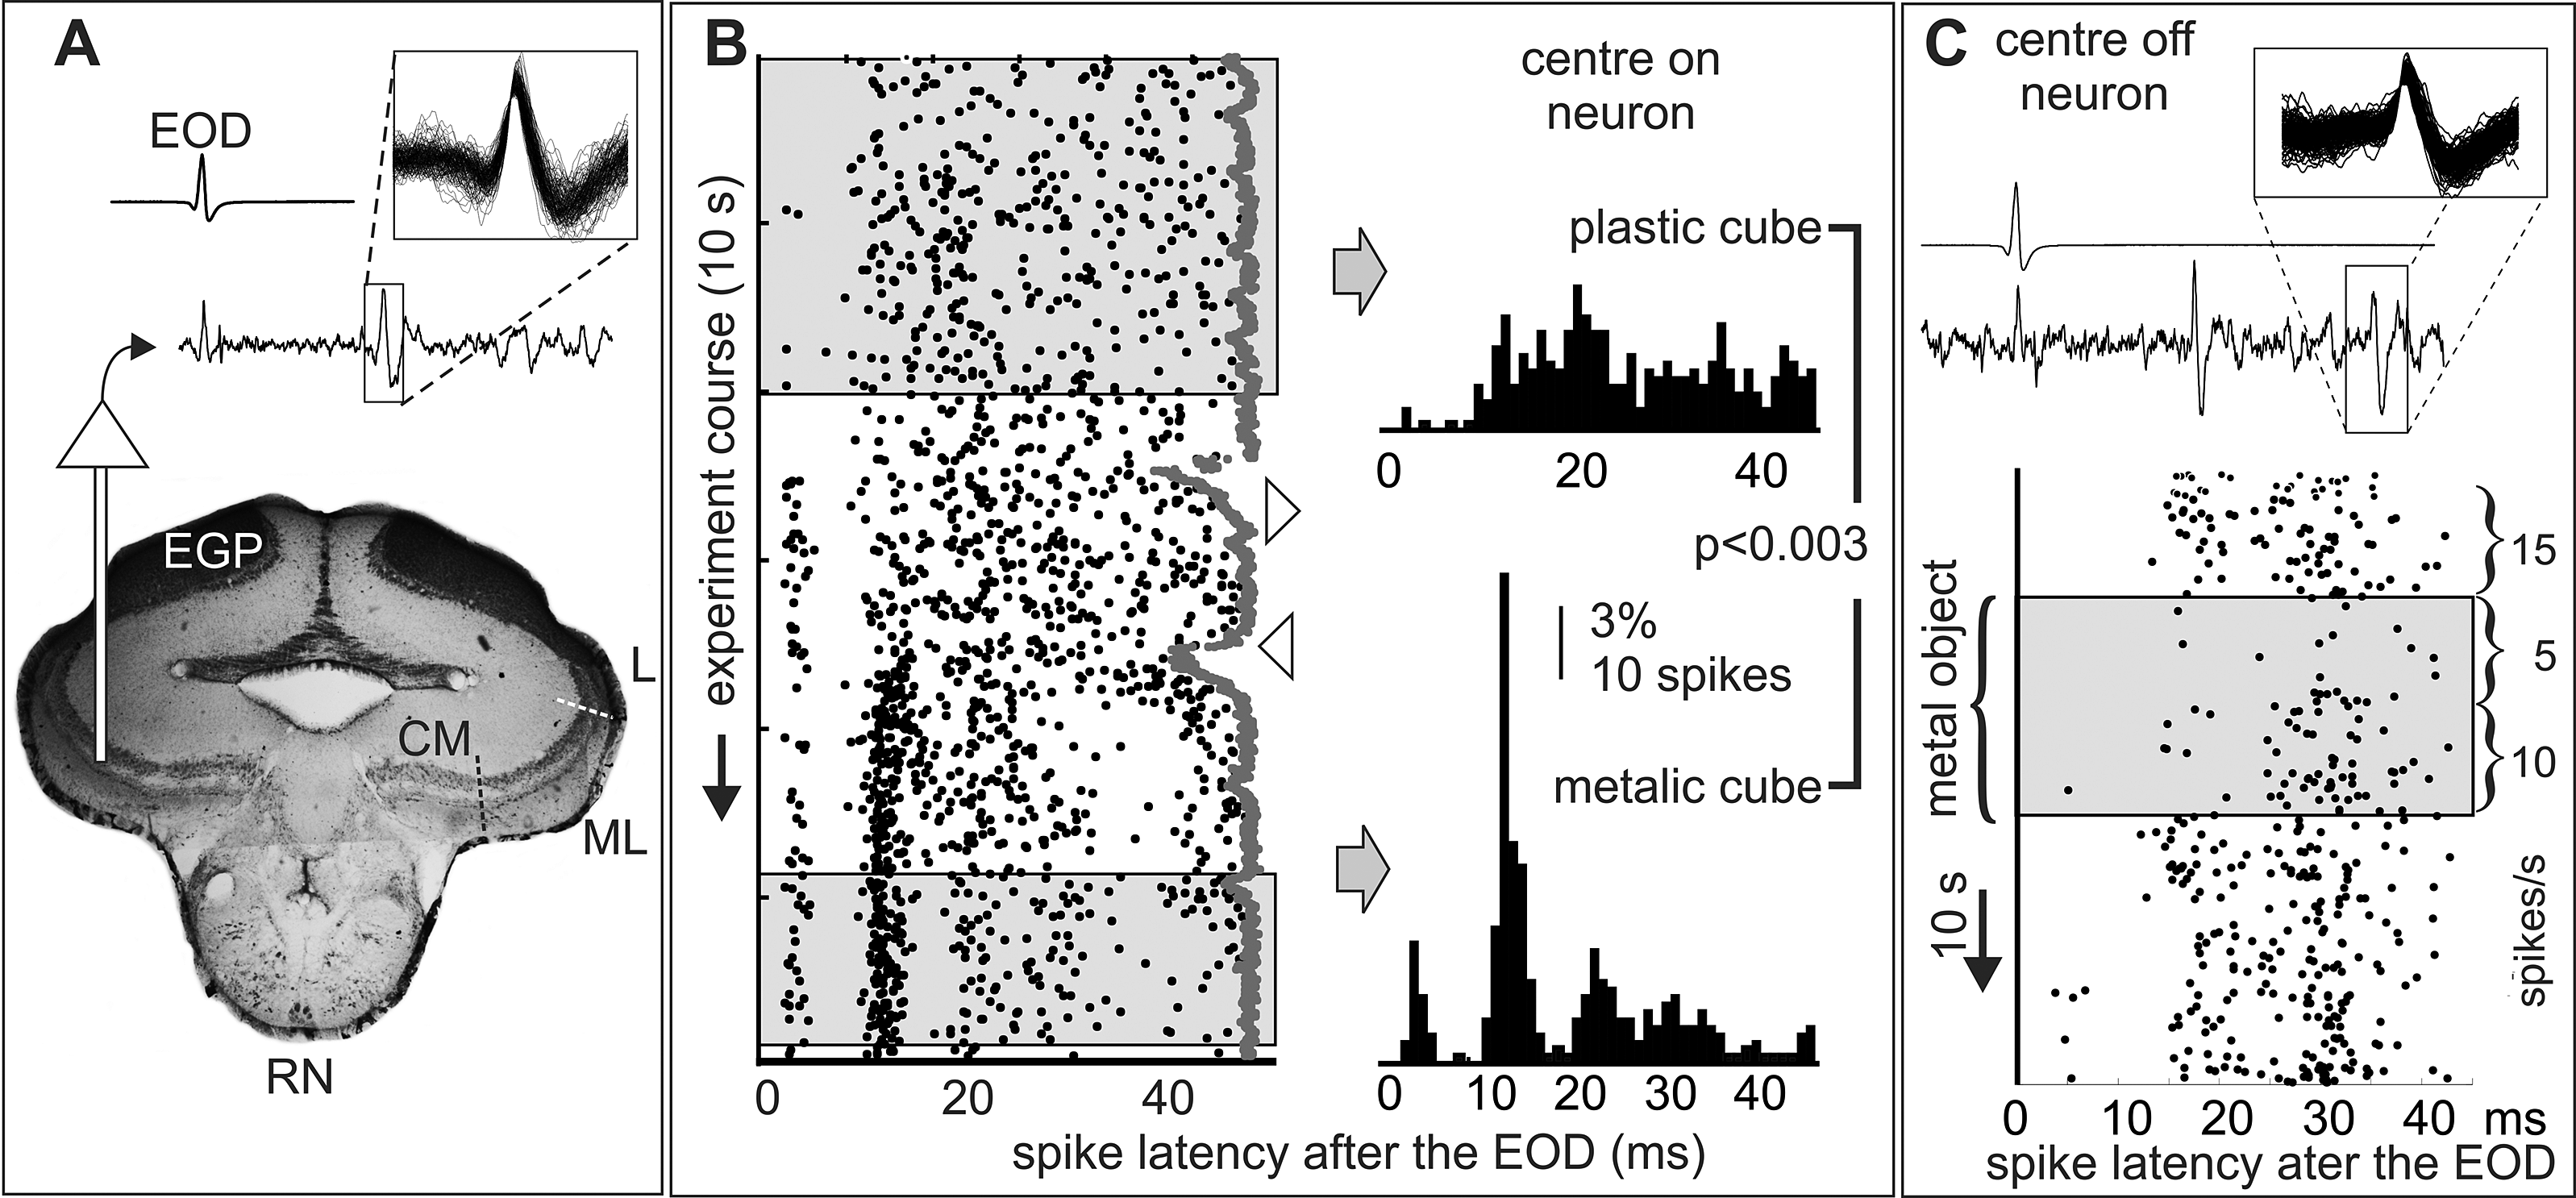
Figure 2. On and off neurons. Conductance dependent post-EOD spiking patterns and adaptation. These experiments were made to confirm the presence of two types of opposite responses to metal and plastic objects and to evaluate the presence of adaptation. A) Traces: EOD (top) and the electrosensory lobe (bottom) recordings; inset: superimposed waveforms of sorted spikes. Histology indicates the recording site(CM: centromedial, ML: mediolateral, L: lateral, maps). B and C) A metal static cube (2 cm side) facing the center of the receptive field (shadowed regions of the rasters) either caused increases (B) or decreases (C) in the firing rate depending on its conductivity. These increments may represent those that led the functional classification of electrosensory neurons as “centre-on” (B) and “centre-off” (C) in wave fish (Clarke et al., Reference Clarke, Longtin and Maler2015). The motion of the plastic object and the introduction of the metal object (downward and upward pointing triangles in B, respectively) causes novelty responses (sudden reductions in the interEOD interval, gray dots). Strikingly, G. omarorum centre-on neuron (panel B, receptive field at the foveal region) showed changes in the post-EOD firing pattern in addition to the change in the number of spikes per EOD. Plastic and metallic objects caused opposite effects in the firing rate. However, they did not provoke simple mirror-image changes, but drastic changes in the post-EOD pattern when comparing the stationary state prior to removal of the plastic cube with the stationary state after positioning the metal cube (200 spikes indicated by from left and right boxes were used to build each histogram χ2=221, DF=49, p<0.003). Both the “centre on” (B) and “centre off” units (C, receptive field at mouth commissure, same unit as in Fig. 3) shows clear adaptation. The “centre off” unit (C) shows a maximal decrement just after placing the metal object before the receptive field the spike rate measured on the first half of the stimulation period was reduced to one third of the control. This was followed by a slow return to two thirds of the resting value in the second half period even when fish and object positions remained unchanged. When the object was removed a rebound was observed.
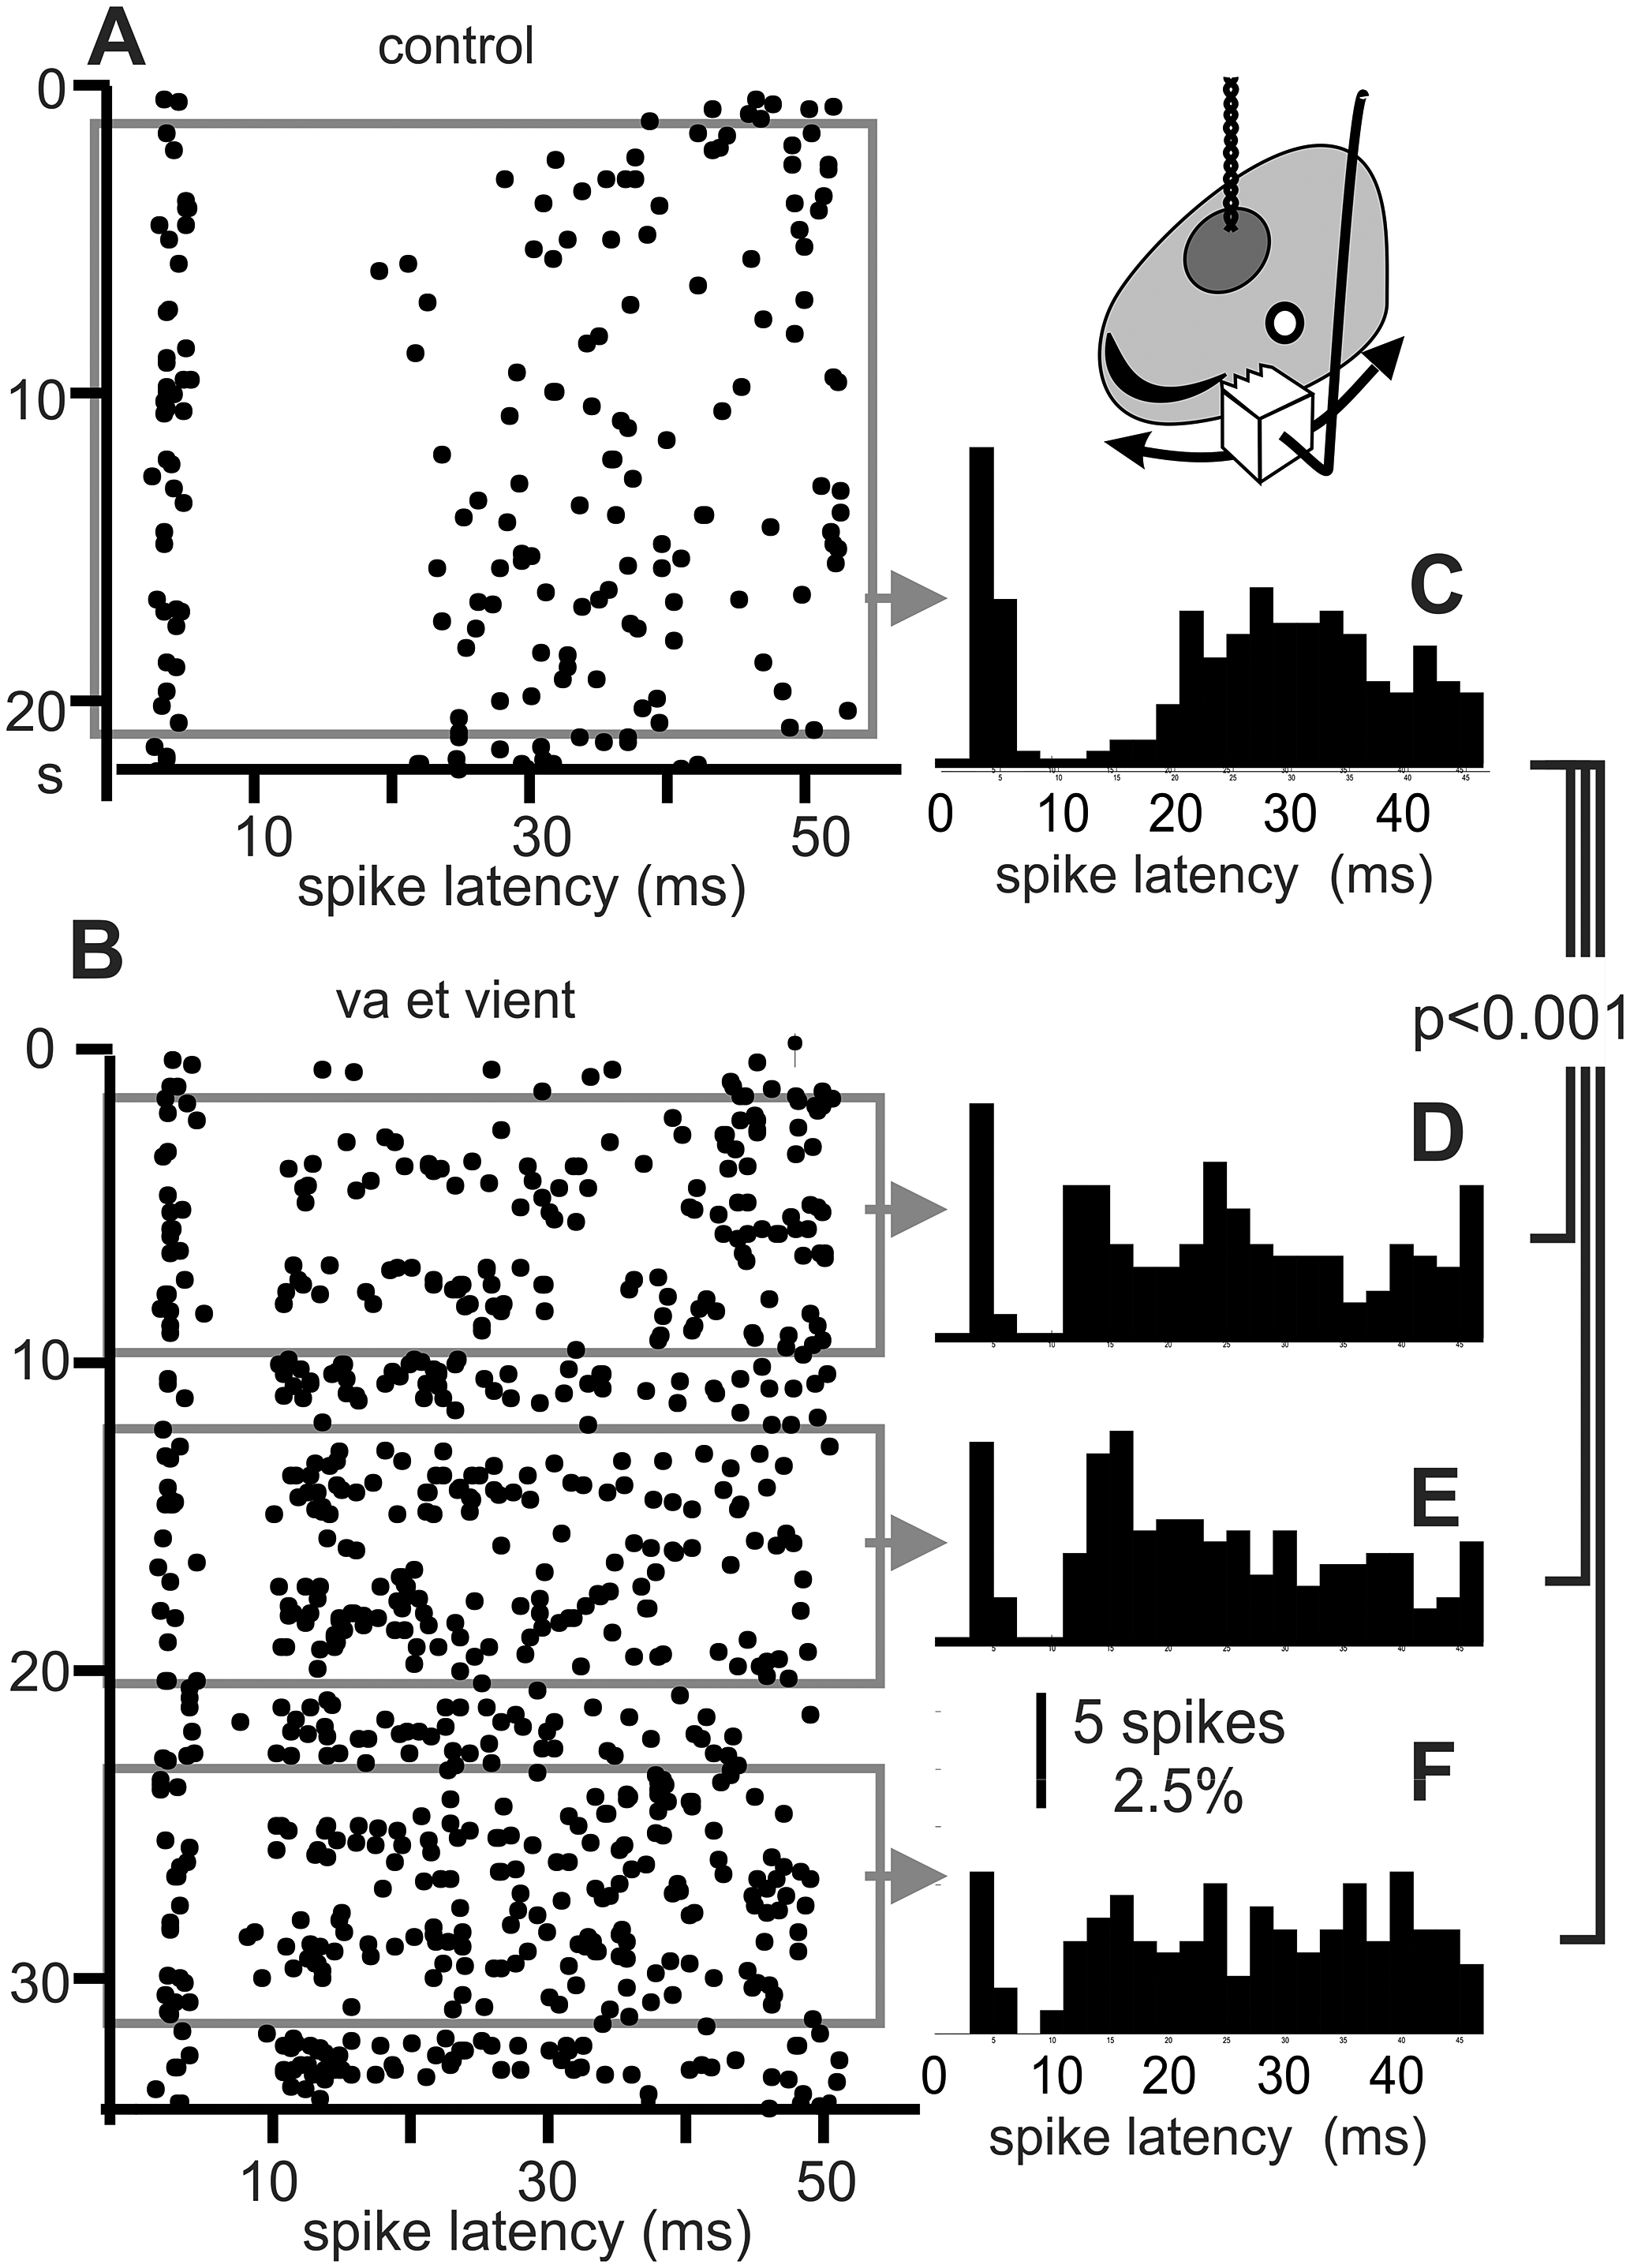
Figure 3. Electric “texture”. The ability to respond to the “electric texture” of object surfaces was proposed by Caputi et al. (Reference Caputi, Aguilera and Pereira2011). To explore this effect, the 2 cm wide face of a copper cube (carved with a saw-tooth profile) was moved back and forth against the skin at the receptive field (head side, inset). A) Raster of a “centre off” in the absence of an object (control). B) Raster plot when the unit was strongly modulated in its firing rate and post-EOD spike timing pattern by va-et-vient movements. Paradoxically for a “centre-off” neuron, a moving metal object caused an increase in its firing rate (note the difference in the number of EODs required to recruit 200 of spikes, indicated by the width of gray bands respect to that observed in the absence of an object) and also a relative peak at about 12-14 ms after the silence. C) Histograms corresponding to the control condition. D-F) Histograms corresponding to mobile stimulus (built from the three samples of the same number of spikes as the control, gray rectangles). χ2 tests showed significant differences between the distribution of each sample obtained during object movement and during the control without object (χ2=58.1, 50.1, and 67.3 respectively, p<0.001 in all cases) but were not able to show significant differences between pairs of distributions obtained during object movement (χ2=20.9, 18.3, and 22.5 respectively, p>0.45, DF=23, significance: 0.003 after Holm-Bonferroni sequentially rejective procedure).

Figure 4. “Centre off” unit responses when fish hide in a tube. A drastic change in the transcutaneous self-generated current profile was described in Pereira et al. (Reference Pereira, Centurión and Caputi2005). To test whether the presence of a tube modifies the post EOD spiking pattern we explored a unit when it was at two positions inside a tube of 5 cm diameter, 10 cm long and compared the profiles between them and with that obtained in a control condition outside the tube. A) “head sticking out”; B) control; and, C) “head inside” (insets). Top row, spike rasters at stable conditions. Middle row: post-EOD firing histograms normalized to the number of EODs. The most common position observed during natural behavior (“head sticking out”) increases the signal at the receptive field center (mouth commissure) and causes a global reduction in spike rate with a virtual disappearance of the late modal peak observed in the control condition. The “head inside” position elicited a reduction of the stimulus, a small difference in rate but a sharp increase of the early modal peak, and a shift to longer latency of the second mode. Bottom row: histograms normalized by spike rate show different patterns (χ2 tests, DF=49, largest p<0.003, which is equivalent to 0.01 after Bonferroni's correction).
Discussion
Although swimming behavior is relatively limited in tethered recordings, the experimental modulation of post-EOD spiking patterns in freely discharging, drug free, permanently implanted fish, shows that spike timing contains additional information on the electrosensory input that is not contained in the average number of spikes per EOD. This form of post-EOD spike-timing code is shared with the phylogenetically distant Mormyroidea, but not with the much more closely related wave Gymnotiformes, who exhibit similar electrosensory lobe anatomy (Bell & Maler, Reference Bell, Maler, Bullock and Heiligenberg2005). This suggests that distinct central processing mechanisms are associated with the polarization strategies and electroreceptor responsiveness characteristic of each taxonomic group (Caputi & Aguilera, Reference Caputi and Aguilera2020).
Conclusion
Data suggest that post-EOD spike timing encoding of electrosensory signals have evolved concomitantly with the ability to explore the environment using pulsatile discharges in a convergent manner for African and American species. Our study paves the way to unveil electric image processing in G. omarorum, since unitary recordings can now be correlated with video tracking available models (Pedraja et al., Reference Pedraja, Aguilera, Caputi and Budelli2014) of the electric image flow. For these purposes, tethered recordings should be complemented with recently introduced wireless systems facilitating skeletomotor motor exploration behaviors with a lower common mode rejection ratio (Cohen et al., Reference Cohen, Vinepinsky and Segev2019; Fotowat et al., Reference Fotowat, Lee, Jaeyoon Jun and Maler2019).
Author contributions
Design and first draft AAC; experiments and analysis: AAC, ARC, ACP and PAA; ARC and ACP have equal merit in this work.
Acknowledgments.
The authors thank Dr. J. C. Waddell for valuable comments and English edition.
Funding information
This work was supported by Agencia Nacional de Investigación e Innovación, Uruguay (AAC, grant number FCE_1_2019_1_155541), (ARC and ACP, PhD fellowships); UDELAR/CAP fellowship to ARC.
Conflict of Interest
Authors ARC, ACP, PAA, and AAC declare none.
Data availability
The data that support the findings of this study are available from the corresponding author (AAC) upon request.


 Open access
Comments
Comments to the Author: Rodriguez-Cattaneo and co-workers present interesting neuronal data recorded in freely moving electric fish. These animals emit electric discharges creating an electric field around the animal which is distorted by nearby objects. Object induced distortions lead to changes in the neuronal activity following an electric organ discharge. The authors show that the differences in the response pattern include changes of the firing rate but also in the temporal pattern of the response. Applying a spike-time code in this South-American species is similar to the encoding strategy employed by the independently evolved African pulse-type species of electric fish. From this the authors conclude a convergent evolution in South American and African species. In my opinion this data is very interesting, the applied recording methods are sound and thus the experimental results are very worth being published. I do have several questions and quite a few minor comments. (i) I did not entirely understand how exactly the experiment was conducted. The animal underwent the surgery and after recovery was allowed to freely behave in an experimental tank. How did you introduce the objects into the water especially when it was moving while maintaining the fish’s position relative to the object. (ii) How strongly is the animal’s behavior affected by the procedure (electric behavior as well as movement behavior)? (iii) What are the pros and cons of the “tethered” approach vs. the wireless approach chosen by Fotowat et al.? Please discuss. (iii) Could you guide the reader better through your results? The figures, especially figure 1, are full of information. Minor comments: Text/Language: line 22 Missing word “Here we show that…” line 34 “In wave type… ” I do not entirely agree with this statement. Even the P-units you are referring to show quite precise spike timing and, as you know, there is the T-unit system for timing information. I wonder whether the sentence is at all important here. line 35 “In pulse-emitting” missing word “fish”? line36 “…whose strength” can you specify which features do change line 38 “polarization strategies” I have never seen this term being used, maybe “discharge mode”? line41: “… each EOD evokes an electric field whos spatio-temporal …” line 44: here “field potential ” refers to the recording of the neuronal activity this is confusing. line 44 “raises” line 45 “unit types carries…” Further, please explain what unit types are there. line 50 51: When looking at the electrosensory world in a stroboscopic fashion, what is the difference between moving and stationary objects? line 61: here you refer to the field potential recordings as “spikes” please be consistent. line 66: Not sure if i correctly understand the given numbers, is six the total number of units in all three fish, or is it meant for each fish? line 68: I had difficulties understanding the distinction between peak-to-peak amplitudes and peak amplitudes. Maybe talk about positive and negative potential deflections in the the spike waveform? line 77 “…are reliable in …” maybe “can be reliably done in …”? line 80: “Image encoding strategy is similar…” Not sure if image encoding can be misunderstood. And in which respects are the similar? line 84: “polarization strategy” see above line 86: “Our study shows… and suggests.. encoding strategy evolved… with the ability to … ”Methods, please provide more details regarding: How were objects presented? How long you could record? What is the sampling rate of the data recording? What was the drug and the dose of the anaesthetic (I assume MS222)? The recording electrode had a total diameter of 50 um? Or each wire individually? How did you identify the “best unit” and how does this choice affect the results? How did you select the data for analysis? I understand that you took the same number of spikes from each condition, but how did you decide to place grey segments? Why not choose randomly until the same number of spikes were collected? Same issue, how does the selection affect the result? figure 1 B: what is the grey line at about 50 ms and why is it highlighted? what to the open arrows at about 50s and 70s point at? figure 1C: why did the orientation change? Experiment course is now on the y-axis. the metal object is the same as in B? If so, why different labels? caption:top shows EOD and the field potential recording; “overlapped” is the wrong word here “superimposed”? “recording location” or “recording site” instead of “place”? How did you identify the location? The canal or by creating a lesion? Where do I see the adaptation? Could you show the adaptation effect in the data? figure 2: rearrange to show the no-object panel first and then the one with the object? can you explain “va et vien”? How did you choose the placement of the grey area? “… modulated in spike firing rate…” remove “spike” ? figure 3: what is the material of the cube?