


1. Introduction
COVID-19 is a widespread global pandemic caused by SARS-CoV-2 coronavirus causing significant socio-economic impact. As of 8th February 2021, over the duration of the pandemic over 106 million confirmed cases and 2 million deaths have been reported in over 200 countries, areas or territories (Johns Hopkins University, 2020). Previous studies show that cold and dry weather may positively influence coronavirus survival time and the transmission rate of upper respiratory tract coronavirus infections (Chan et al., Reference Chan, Peiris, Lam, Poon, Yuen and Seto2011; Van Doremalen et al., Reference Van Doremalen, Bushmaker and Munster2013). However, the role of meteorological effect on the spread of COVID-19 is still controversial (Demongeot et al., Reference Demongeot, Flet-Berliac and Seligmann2020; Qi et al., Reference Qi, Xiao, Shi, Ward, Chen, Tu, Su, Wang, Wang and Zhang2020; Tosepu et al., Reference Tosepu, Gunawan, Effendy, Lestari, Bahar and Asfian2020). A recent review on 23 studies about weather and COVID-19 showed that temperature and humidity can contribute to increased transmission of COVID-19, particularly in winter conditions which is a conductive environment for virus survival (McClymont & Hu, Reference McClymont and Hu2021). For example, a study on the growth of new cases in tropical and temperate regions showed that temperature has a positive association with the number of daily new cases (Chennakesavulu & Reddy, Reference Chennakesavulu and Reddy2020). Another study on multiple cities in China indicated that temperature and absolute humidity are negatively associated with COVID-19 daily new cases (Liu et al., Reference Liu, Zhou, Yao, Zhang, Li, Xu, He, Wang, Fu, Niu, Yan, Shi, Ren, Niu, Zhu, Li, Luo and Zhang2020). However, these studies only used confirmed case number as response variable, rather than transmissibility, to investigate the climate effect in COVID-19 transmission.
Effective reproductive number (Reff) is a robust model-based indicator of transmissibility of COVID-19, which can reflect the real-time transmissibility of COVID-19 through an outbreak. The research aims to assess the effects of climate factors (i.e. daily average temperature and average relative humidity) on Reff of COVID-19 based on local cases in Wuhan, China. The Reff we used in this study considered the effect from public health interventions, providing more information and reducing confounding factors compared with daily cases. Also, compared with research only reporting the basic reproductive number (R0), Reff can also provide greater accuracy in estimating transmissibility as it does not need to meet the model assumption that the virus is freely transmitted with no intervention (Nishiura & Chowell, Reference Nishiura, Chowell, Chowell, Hyman, Bettencourt and Castillo-Chavez2009).
2. Data collection and statistical methods
Wuhan city was chosen as our study site due to strict lockdown measures which were implemented from 23rd January 2020. During this time, all cases included in our study could be considered as locally transmitted without any imported cases during this period. This environment is ideal for modelling the COVID-19 transmission dynamic via effective reproductive number based on Susceptible-Infected-Removal (SIR) model from Bayesian estimation.
Daily number of confirmed COVID-19 cases reported between 14th January 2020 and 17th March 2020 were obtained from the JHU coronavirus resource center (Dong et al., Reference Dong, Du and Gardner2020). Daily data on temperature and humidity through the same period were obtained from National Climatic Data Center, US Department of Commerce (https://www.ncdc.noaa.gov).
We used Bayesian Estimation theory to estimate the Reff, and a 10-days averaging window was applied to reduce the impact from stochastic events (e.g., population migration during Chinese New Year). The method was used to estimate daily parameter of SIR model and calculate daily Reff (Cori et al., Reference Cori, Ferguson, Fraser and Cauchemez2013; Forsberg White & Pagano, Reference Forsberg White and Pagano2008). The mean and standard deviation of the incubation period used in this study are 4.7 days and 2.9 days respectively, estimated by Nishiura et al. (Reference Nishiura, Linton and Akhmetzhanov2020). Besides a 10 day time window was assigned in estimation to improve the estimation accuracy via EpiEstim (Cori et al., Reference Cori, Ferguson, Fraser and Cauchemez2013). To control for alterations to case reporting criteria on 12th February, only laboratory confirmed cases were included, which for this date was 1,072 cases, issued by Health Commission of Hubei Province (Health Commission of Hubei Province, 2020).
Time series generalized linear model (GLM) and generalized additive model (GAM) with Gamma distribution and logarithm link function were used to assess the relationship between meteorological factors and Reff. The GLM can be defined as:
 $$ \mathit{\log}\left({Y}_t\right)={\beta}_0+{\beta}_1 TEM{P}_t+{\beta}_2R{H}_t $$
where  $ {\mathrm{Y}}_{\mathrm{t}} $ denotes the estimated Reff at time $ \mathrm{t} $ during the outbreak. $ {\unicode{x03B2}}_0,{\unicode{x03B2}}_1 $ and $ {\unicode{x03B2}}_2 $ represents the model intercept and coefficients of independent variables under lag effect on average temperature (TEMP) and average relative humidity (RH), respectively. We used cross-correlation function (CCF) to evaluate the lag effect at different days between TEMP, RH and COVID-19 transmission. Based on the assessment of CCF, we used lag 0–8 days on TEMP and lag 0–3 days on RH in our model.
The GAM can be defined as:
 $$ \log \left({\mathrm{Y}}_{\mathrm{t}}\right)={\unicode{x03B2}}_0+\mathrm{s}\left(\mathrm{TEM}{\mathrm{P}}_{\mathrm{T}},\mathrm{df}=4\right)+\mathrm{s}\left(\mathrm{R}{\mathrm{H}}_{\mathrm{t}},\mathrm{df}=4\right) $$
where  $ \mathrm{s}\left(\bullet \right) $ is the thin plate regression spline function for smoothing, which are average temperature and average relative humidity at time $ \mathrm{t} $; $ \mathrm{df} $ is the degrees of freedom; $ {\mathrm{Y}}_{\mathrm{t}} $ and $ {\unicode{x03B2}}_0 $ represents the same term as in model (1).
Sensitivity analysis on the degree of freedom (df) of smoothing spline showed that the model has better performance in generalized cross-validation (GCV) when df = 4 (k-index = 0.82, p = 0.12) compared with the model when df = 3 (k-index = 0.83, p = 0.07) and df = 2 (k-index = 0.83, p = 0.04).
3. Results
Figure 1 showed that the real-time changes of Reff during the outbreak had a gradual downward trend until the end of February.
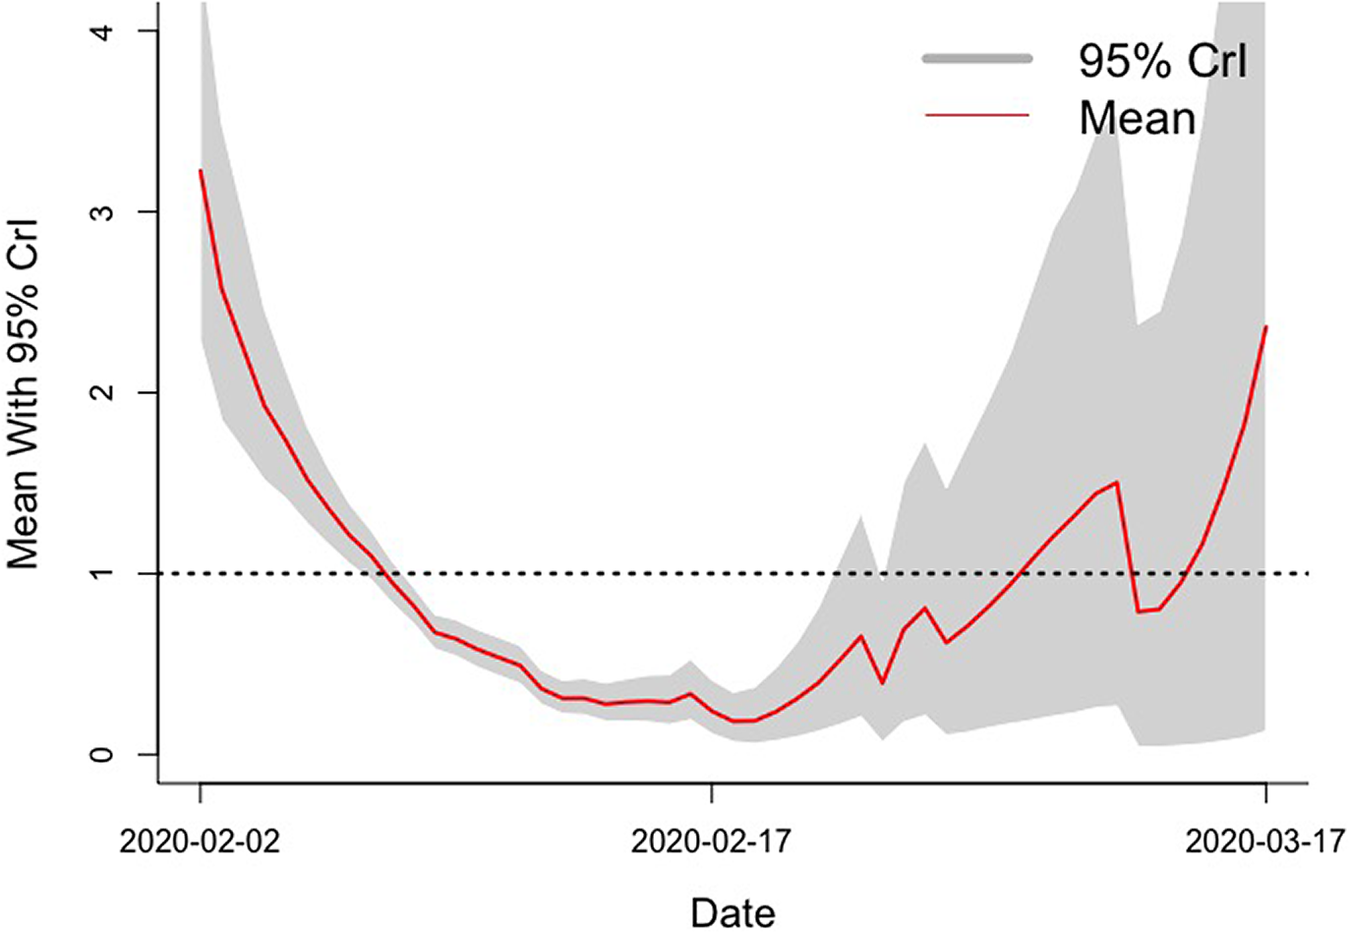
Figure 1. Daily Reff curve in Wuhan, China
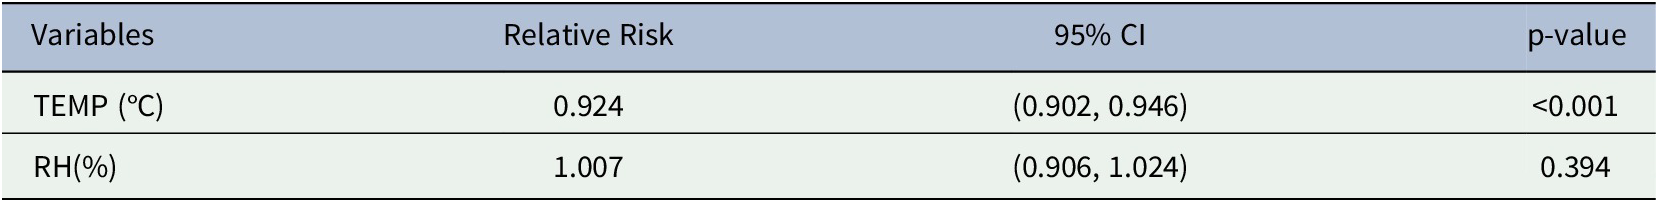
Table 1 showed that a moving average of lag 0–8 days temperature after adjusted with RH was associated with daily Reff in Wuhan city (Relative Risk (RR): 0.924, 95% Confidence Interval (CI): 0.902–0.946). However, there was no association between RH and Reff.
Table 1. Relative risks of Reff from time series generalized linear model
As for GAM, Figure 2 showed the scatter plots with smoothing spline with 4 degrees of freedom from the model between daily Reff, TEMP and RH respectively. Figure 2 suggested that TEMP has an approximate linear relation with Reff, but average relative humidity shows more nonlinear variation in the relationship.
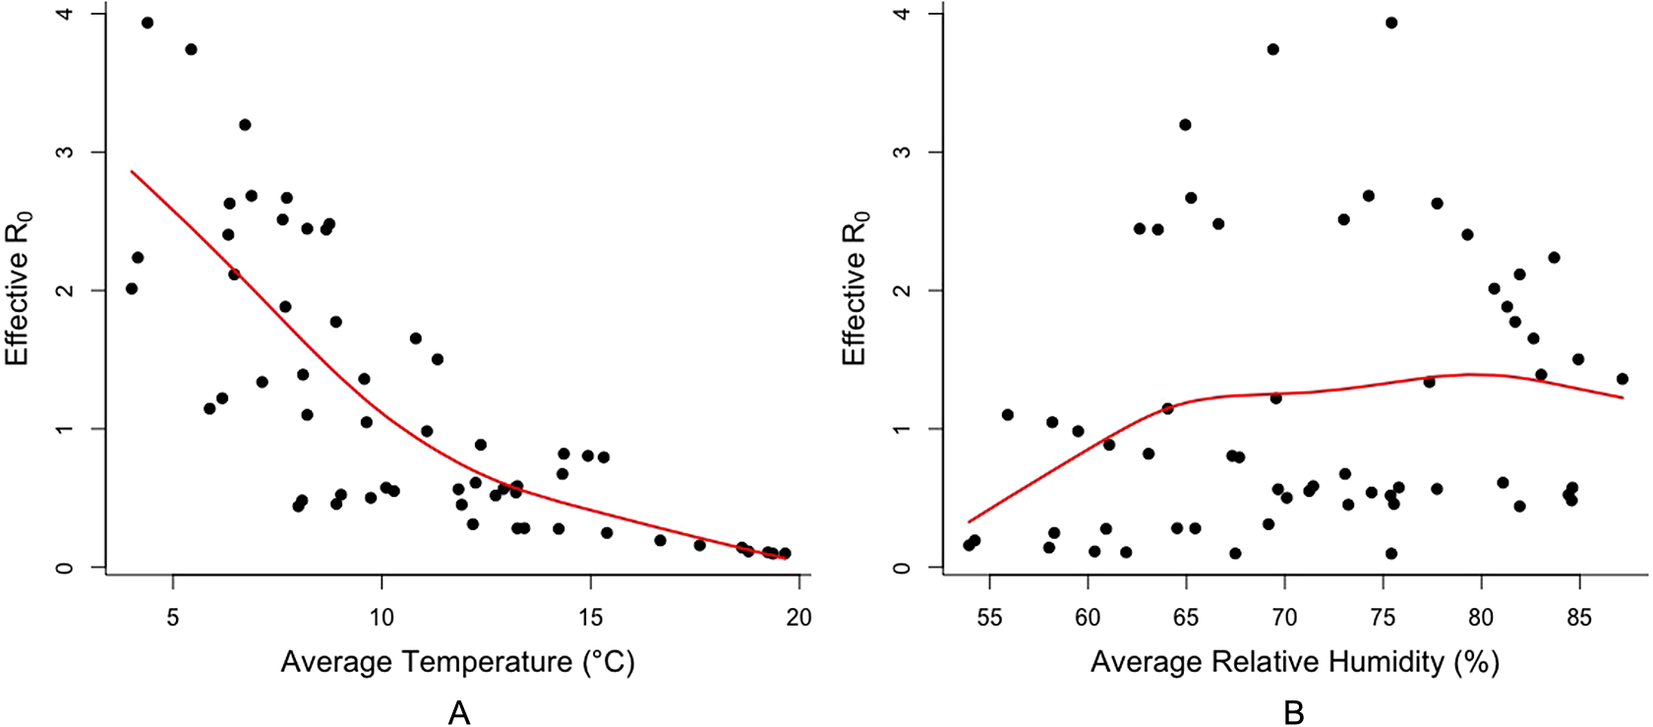
Figure 2. The smoothing spline with 4 degrees of freedom between daily Reff and TEMP (panel A); daily Reff and RH (panel B).
4. Conclusions
Our research based on the Reff suggested that temperature has a significant negative association with COVID-19 transmission. This result was similar to results reported in some studies for the association between temperature and COVID-19 case numbers (Tosepu et al., Reference Tosepu, Gunawan, Effendy, Lestari, Bahar and Asfian2020; Zhu & Xie, Reference Zhu and Xie2020). However, relative humidity was not found to contribute significantly in explaining variation in transmissibility of COVID-19. Our research filled the gap in illustrating the weather effect on COVID-19 transmission rate via Reff with strong public health interventions.
Our result gives a higher variation range of Reff by 1°C changes on temperature (5.4% ~9.8%) compared with previous studies (2%~4% or no effects) which excluded intervention effects and used reproductive number looking at virus transmission (Sahafizadeh & Sartoli, Reference Sahafizadeh and Sartoli2020; Wang et al., Reference Wang, Tang, Feng and Lv2020). One possible explanation for this difference is the choice of time period: a study assessed a very short time period with no public health intervention in China (19 January–23 January) and U.S. (15 March–6 April), and all data were from the period prior to stay-at-home orders being fully implemented (Wang et al., Reference Wang, Tang, Feng and Lv2020). Furthermore, a large number of cities in different locations were included in some studies to estimate transmissibility of COVID-19 contemporaneously but without a single region or area having sufficient epidemic duration for a more robust analysis (Baker et al., Reference Baker, Yang, Vecchi, Metcalf and Grenfell2020; Liu et al., Reference Liu, Zhou, Yao, Zhang, Li, Xu, He, Wang, Fu, Niu, Yan, Shi, Ren, Niu, Zhu, Li, Luo and Zhang2020; Qi et al., Reference Qi, Xiao, Shi, Ward, Chen, Tu, Su, Wang, Wang and Zhang2020; Zhu & Xie, Reference Zhu and Xie2020). Our two-month study period is long enough to be considered as a full epidemic outbreak, given the lag for incubation period of up to 14 days for transmission of this disease. Another focus which might cause such variation is the potential nonlinear relation between Reff and studying meteorological variable. Future studies are required to explore these complex nonlinear and interactive effects on virus transmission risk.
Previous research showed absolute or relative humidity had positive or negative influence on COVID-19 transmission (Guo et al., Reference Guo, Zhang and Zeng2020; McClymont & Hu, Reference McClymont and Hu2021; Park et al., Reference Park, Son, Ryu, Choi and Ahn2019). These studies reported marginal correlations between humidity and COVID-19 cases number. Further potential caveats is the classification of imported versus local cases, which might contribute to the wide variation in transmission between different groups and potential for super spreaders (Baker et al., Reference Baker, Yang, Vecchi, Metcalf and Grenfell2020; Liu et al., Reference Liu, Zhou, Yao, Zhang, Li, Xu, He, Wang, Fu, Niu, Yan, Shi, Ren, Niu, Zhu, Li, Luo and Zhang2020; Qi et al., Reference Qi, Xiao, Shi, Ward, Chen, Tu, Su, Wang, Wang and Zhang2020; Yao et al., Reference Yao, Pan, Liu, Meng, Wang, Kan and Wang2020). The misclassification between imported cases and local transmitted cases might lead to the overestimation of transmissibility of COVID-19, especially in those countries or regions where imported cases are the cases majority.
Two other studies used time series Auto Regressive Integrated Moving Average (ARIMA) model and machine learning as new approaches to assess the association between weather and COVID-19 cases (Malki, Atlam, Ewis, et al., Reference Malki, Atlam, Ewis, Dagnew, Alzighaibi, Elmarhomy, Elhosseini, Hassanien and Gad2020; Malki, Atlam, Hassanien, et al., Reference Malki, Atlam, Hassanien, Dagnew, Elhosseini and Gad2020). However, ARIMA model requires a relatively long time period and stationarity of time series data (Chintalapudi et al., Reference Chintalapudi, Battineni and Amenta2020). In future research, seasonal ARIMA modelling can be used to predict the trend of COVID-19 transmission, with potential socio-environmental factors.
A possible limitation of this study is that we used the case notification date rather than onset date due to data availability which may have reduced the strength and/or accuracy of the estimated relationship between temperature and Reff. UV radiation and air pollution were not included in our study. UV radiation is associated with COVID-19 transmission as reported in several studies (Cadnum et al., Reference Cadnum, Li, Redmond, John, Pearlmutter and Donskey2020; Hamzavi et al., Reference Hamzavi, Lyons, Kohli, Narla, Parks-Miller, Gelfand, Lim and Ozog2020). However, UV radiation will only be relevant to outdoor human activities and subsequent transmission, due to strict lockdowns, Wuhan city banned all outdoor activities for the entirety of the study period (Pun et al., Reference Pun, Turner, Strapazzon, Brugger and Swenson2020). Moreover, air pollutant significantly reduced during the study period in Wuhan while the city was in lockdown (Lian et al., Reference Lian, Huang, Huang, Liu, Wang and Zhang2020). Under these conditions, it is reasonable to believe UV radiation and air pollutant could have a limited effect on COVID-19 transmission.
In conclusion, our study suggested that temperature changes have an effect on the transmissibility of COVID-19, with transmission increasing as temperature declines. However, further research is required to assess the complex relationship at global, regional and local levels, and develop a spatiotemporal weather-based early warning system for COVID-19.
Acknowledgements
We acknowledge the work and contribution of all workers in National Health Commission of China, Health Commission of Hubei Province and Johns Hopkins University Coronavirus Resource Center on collecting and publishing data of COVID-19 outbreak, and of the National Climatic Data Center, US Department of Commerce on climate data publication. We gratefully acknowledge the efforts of healthcare workers in Wuhan, and globally, caring for patients infected with SARS-CoV-2.
Author contributions
WH conceived and designed the study. XS and YZ conducted data gathering. XS performed statistical analyses and drafted the paper. All authors interpreted the results and revised the paper.
Funding information
This research received no specific grant from any funding agency, commercial or not-for-profit sectors.
Conflicts of interest
All authors declare none.
Availability of data
All data used in this article are publicly available.
Daily counts of reported confirmed COVID-19 cases, recoveries and deaths for each country are obtained from the JHU coronavirus resource center [1, 18] (publicly available at https://github.com/CSSEGISandData/COVID-19).
Weather data is available from National Climatic Data Center, US Department of Commerce (https://www.ncdc.noaa.gov).
Code availability
Using R 4.0.0 with package EipEstim 2.2 and mgcv 1.8 for modelling.


 Open access
Comments
Comments to the Author: This study investigated the effects of air temperature and relative humidity on SARS-CoV-2 transmission in Wuhan, China. Great improvements have been made in this manuscript, such as the brief review of existing studies, the sensitivity analyses by testing different degrees of freedom, and more justification in the discussion part. There are several minor issues needed to be addressed before publication:
1. The authors used lag of 5 days for temperature and 8 days for RH in the statistical model. Explanations on how these lag durations were chosen is necessary. In addition, the selection of lag period could influence the final estimates. Sensitivity analyses using different lags are needed.
2. Line 94-96, it is good to perform these sensitivity analyses, but please display model statistics to support this statement.
3. In the description of the GAM, it is unclear which type of smoothing basis was used (i.e., bs=? in the s(.))?
4. There are still several typos in the text (e.g., line 49, “tete”), please check again in the revision.