

1. Introduction
High-throughput gene expression profiling studies have been extensively conducted, searching for markers associated with the development and progression of cancer. In this study, we analyse cancer prognosis studies, where the outcome variables are progression-free, overall, or other types of survival. In many cancer gene expression studies especially the early ones, it has been assumed that genes have interchangeable effects (Knudsen, Reference Knudsen2006). Biomedical studies have shown that there exists inherent coordination among genes and, essentially, all biological functions of living cells are carried out through the coordinated effects of multiple genes. There are multiple ways of describing the interplay among genes. The most popular ways are gene pathways and networks (Casci, Reference Casci2010). Compared with pathway analysis, network analysis sometimes can be more informative as it describes not only whether two genes are connected but also the strength of connection. In addition, some network analysis methods can analyse all genes, whereas many pathway analysis methods focus on the annotated genes only. On the negative side, unlike with pathways, research linking specific network structures with biological functions remains scarce. In the literature, there is no definitive evidence on the relative performance of pathway and network analysis methods. Here, we focus on developing a network analysis method and refer to other studies for discussions and comparisons of pathway and network analyses.
In network analysis, nodes represent genes. Nodes are connected if the corresponding genes have co-regulated biological functions or correlated expressions. There are multiple ways of constructing gene networks. For example, directed, biological networks can be constructed based on the results of knockout experiments. The weighted gene co-expression network analysis (WGCNA: http://www.genetics.ucla.edu/labs/horvath/CoexpressionNetwork/), which is adopted in this study, is based only on gene expression data and does not demand additional experiments. There are multiple model-based approaches, using the Akaike information criterion (AIC), multi-model inference (MMI), Bayesian model selection and averaging or minimum description length (MDL) as the network construction criteria. Friedman et al. (Reference Friedman, Hastie and Tibshirani2008) proposed network construction using a penalization approach. More recently, Maathuis et al. (Reference Maathuis, Colombo, Kalisch and Buhlmann2010) investigated directed networks when the biological information is partially available. A sparse singular value decomposition-based method has also been proposed for network construction (Jornsten et al., Reference Jornsten, Abenius, Kling, Schmidt, Johansson, Nordling, Nordlander, Sander, Gennemark, Funa, Nilsson, Lindahl and Nelander2011). In addition, multiple approaches have been proposed to compute the connectedness measure between pairs of genes. See for example Langfelder & Horvath (Reference Langfelder and Horvath2007), Saris et al. (Reference Saris, Horvath, van Vught, van Es, Blauw, Fuller, Langfelder, DeYoung, Wokke, Veldink, van den Berg and Ophoff2009) and references therein. Published studies have suggested that the network connectedness measure may have important implications. For example, hub genes, which are genes ‘well connected’ with a large number of genes, tend to have important biological functions. There are subsets of nodes, called modules, which are tightly connected to each other. Genes within the same modules tend to have coordinated biological functions, whereas genes in different modules tend to have different, unrelated biological functions.
Statistical methods that can accommodate the high dimensionality of cancer gene expression data can be roughly classified as dimension reduction and variable selection methods. Both families of methods have been employed in network analysis. Dimension reduction methods search for linear combinations of all genes or genes within the same modules as cancer markers. In Ma et al. (Reference Ma, Kosorok, Huang and Dai2011), principal component analysis is used for network-based dimension reduction. Such methods may have satisfactory prediction performance but often suffer a lack of interpretability. In addition, they contradict the fact that not all genes are involved in cancer development and progression. Variable selection methods search for a subset of genes as markers and may be more interpretable. A network thresholding regularization method is proposed in Ma et al. (Reference Ma, Shi, Li, Yi and Shia2010b). Huang et al. (Reference Huang, Ma, Li and Zhang2011a) proposed a penalization method for network variable selection (see references therein for more penalization network analyses). In this article, we focus on the development of a network variable selection method and refer to other publications for comprehensive discussions and comparisons of dimension reduction and variable selection methods.
The rest of the article is organized as follows. In Section 2, we first describe the WGCNA. We describe prognosis using an accelerated failure time (AFT) model and adopt a weighted least squares estimation approach. We then develop the NSBoost approach for gene selection. Simulation study in Section 3 demonstrates satisfactory performance of the proposed approach. Four cancer prognosis studies are analysed in Section 4. The article concludes with discussion in Section 5. Some additional analysis results are provided in Appendices.
2. Methods
(i) Network construction
As described in Section 1, there are multiple ways of building gene networks. They can be roughly classified as biological and statistical constructions. Different statistical construction methods rely on different, usually unverifiable data and model assumptions. To the best of our knowledge, in the literature there is still a lack of definitive evidence on the relative performance of different network construction methods. The WGCNA approach is built on the understanding that the coordinated co-expressions of genes encode interacting proteins with closely related biological functions and cellular processes. Detailed investigations of WGCNA have been conducted by Dr Steve Horvath and his group at UCLA. Published studies suggest that modules in the weighted co-expression network have important biological implications. Genes with a higher connectivity are more likely to be involved in important molecular processes. In addition, incorporating connectivity in the detection of differentially expressed genes can lead to significantly improved reproducibility. For integrity of this study, we describe the WGCNA algorithm below and refer to (WGCNA) for more details.
1. Assume that there are d genes. For genes k and j(=1, …, d), compute cor(k, j), the Pearson correlation coefficient of their expressions. Compute the similarity measure S(k, j)=|cor(k, j)|.
2. Compute the adjacency function ak,j=Sb(k, j), where the adjacency parameter b is chosen using the scale-free topology criterion. In our data analysis, we find that b=6, which has been suggested in several published studies, lead to satisfactory results.
3. For gene k, compute its connectivity

4. For gene k(=1, …, d), compute the topological overlap-based dissimilarity measure dk,j=1−wk,j, where wk,j=(lk,j+ak,j)/(min(Ck,Cj)+1−ak,j) and
. Define the dissimilarity matrix D, whose (k, j)th element is dk ,j.5. Identify network modules using matrix D and the hierarchical clustering approach. Apply the dynamic tree cut approach (Langfelder et al., Reference Langfelder, Zhang and Horvath2008) to cut the clustering tree (dendrogram), and identify the resulting branches as modules. Denote M as the number of modules and S(m) as the size of module m(=1, …, M).
Several quantities are defined in the above algorithm. In the downstream analysis, we use the ‘final product’ – modules constructed in Step 5. As can be seen from the algorithm, the construction of WGCNA is computationally simple. A user-friendly R package is available for implementation (http://cran.r-project.org/web/packages/WGCNA/index.html). A significant advantage of WGCNA is that it is completely inferred from gene expression measurements of a single study and hence does not demand a large amount of biological experiments. On the negative side, it is built on the estimated covariance matrix. In a typical cancer gene expression study, with the sample size significantly smaller than the number of genes, the uniform consistency of the covariance matrix estimation is debatable. Thus, unlike some other ways of describing gene interplay (e.g. pathways), the weighted co-expression network structure may vary across studies with comparable setup.
(ii) Statistical modelling
Let Ti be the logarithm of survival time and Xi be the d-dimensional gene expressions for the ith subject in a random sample of size n. The AFT model assumes that
where α is the intercept, β∊Rd is the unknown regression coefficient and ∊i is the random error. Under right censoring, one observation consists of (Yi, δi and Xi), where Yi=min(Ti, Ci), Ci is the logarithm of censoring time and δi=I(Ti⩽Ci) is the censoring indicator. In the AFT model, the logarithm transformation can be replaced with another monotone transformation. The log transformation is the most commonly adopted in the literature and generates reasonable results with data analysed in this study. When the distribution of random error is known, the parametric likelihood function can be easily constructed, and likelihood-based approaches are more efficient than the one described below. Here, we consider the more flexible case with an unknown random error distribution.
The AFT model provides a flexible alternative to the Cox proportional hazards model (Wei, Reference Wei1992). It assumes a linear function for the log-transformed survival time and may provide a more straightforward description of gene effects on survival than alternatives (e.g. the Cox model, which describes the survival hazard). There are multiple approaches for estimating the AFT model with an unspecified error distribution. Examples include the Buckley–James estimator, which adjusts censored observations using the Kaplan–Meier estimator, and the rank-based estimator, which is motivated by the score function of the partial likelihood function. With high-dimensional gene expression data, those approaches suffer a high computational cost. A computationally more feasible approach is the weighted least squares approach (Stute, Reference Stute1993). Denote ![]() as the Kaplan–Meier estimator of F, the distribution function of T. It can be computed as
as the Kaplan–Meier estimator of F, the distribution function of T. It can be computed as ![]() Here, wi/s are the jumps in the Kaplan–Meier estimator computed as
Here, wi/s are the jumps in the Kaplan–Meier estimator computed as ![]() and
and ![]() wi/s have also been referred to as the Kaplan–Meier weights (Stute, Reference Stute1993). Y (1)⩽···⩽Y (n ) are the order statistics of Yi/s, δ(1), …, δ(n ) are the associated censoring indicators, and X (1), …, X (n ) are the associated gene expressions. The weighted least squares loss function is
wi/s have also been referred to as the Kaplan–Meier weights (Stute, Reference Stute1993). Y (1)⩽···⩽Y (n ) are the order statistics of Yi/s, δ(1), …, δ(n ) are the associated censoring indicators, and X (1), …, X (n ) are the associated gene expressions. The weighted least squares loss function is
We centre X (i ) and Y (i ) using their corresponding wi-weighted means, respectively. Let ![]() and
and ![]() . Denote
. Denote ![]() and
and ![]() . We can rewrite the weighted least squares loss function as
. We can rewrite the weighted least squares loss function as
The simple form of this loss function makes it computationally affordable and suitable for high-dimensional gene expression data.
(iii) Gene selection with NSBoost
The proposed NSBoost approach belongs to the family of boosting approaches. Boosting assembles a strong learner using a set of weak learners (Anjum et al., Reference Anjum, Doucet and Holmes2009; Hastie et al., Reference Hastie, Tibshirani and Friedman2009; Ma et al., Reference Ma, Huang, Xie and Yi2012; Schapire & Freund, Reference Schapire and Freund2012). It is appropriate for cancer genomic data as individual genes usually have weak effects, but combined together, they may have strong effects. NSBoost is a variable selection approach and thus can have better interpretability than dimension reduction approaches. Compared with thresholding regularization, it has a better defined statistical framework. Compared with penalization, it may have lower computational cost.
(a) Rationale
With NSBoost, marker selection is achieved in two steps. This two-step strategy shares a similar spirit with that in Ma et al. (Reference Ma, Song and Huang2007). With WGCNA, genes can be separated into non-overlapping modules (note that the proposed approach is also applicable to network construction methods with overlapping modules). In the first step, each module is analysed separately. Genes within different modules tend to have different biological functions. Thus, it is sensible to analyse each module separately in the sense that different biological functionalities should be considered separately. On the other hand, genes within the same modules never have identical biological functions. Thus, we propose conducting within-module selection and search for genes that are associated with cancer prognosis within a group of functionally related genes. For a specific module, this step of selection can not only remove noises but also lead to the construction of a super marker, which is a linear combination of selected genes and can represent effects of all genes within this module. The introduction of super marker shares a similar spirit with that in Ma et al. (Reference Ma, Kosorok, Huang and Dai2011). In the second step, we consider the joint effects of all super markers and hence all modules. In whole-genome studies, it is reasonable to expect that only a subset of modules is cancer associated. It is thus necessary to conduct the second step of selection and discriminate cancer-associated modules from noises. With the proposed two-step approach, we may identify which modules are cancer-associated as well as which genes are cancer-associated within selected modules.
In both steps, marker selection is achieved using a sparse boosting approach. In high-dimensional data analysis, boosting may be preferred because of its low-computational cost, flexibility and satisfactory empirical performance. With ordinary boosting, when the stopping rule is properly chosen, the resulted strong learner may enjoy a certain degree of sparsity, and so marker selection can be achieved. This can be seen from Dettling & Buhlmann (Reference Dettling and Buhlmann2003) and follow-up studies as well as our numerical study. However, recent studies (Buhlmann & Yu, Reference Buhlmann and Yu2006; Huang et al., Reference Huang, Huang, Shia and Ma2011b) suggest that with high-dimensional data, ordinary boosting may not be ‘sparse enough’. That is, it may identify a considerable number of false positives. The sparse boosting approach adopted here has been motivated by Buhlmann & Yu (Reference Buhlmann and Yu2006). In particular, the objective function used for boosting and stopping has two terms. The first term measures goodness-of-fit, which is the same as ordinary boosting. The second, additional term measures model complexity. In particular, we adopt a Bayesian information criterion (BIC) for model complexity measure. As ordinary boosting only considers goodness-of-fit, it may introduce noisy variables (false positives) that happen to be able to slightly improve goodness-of-fit. With sparse boosting, the introduction of the model complexity measure can lead to sparser models and hence reduce the number of false positives. On the negative side, sparse boosting can be computationally more expensive than ordinary boosting as the model complexity measure and hence the whole objective function is not differentiable and cannot be minimized using gradient-based approaches. The sparse boosting approach adopted in this study differs from those in Buhlmann & Yu (Reference Buhlmann and Yu2006) and Huang et al. (Reference Huang, Huang, Shia and Ma2011b). Particularly, previous studies focus on continuous and categorical data, whereas we analyse censored survival data, which can be more complicated. The adopted BIC has been more commonly adopted as a model complexity measure than the MDL. In addition, by conducting multi-step sparse boosting, the proposed approach can effectively accommodate the network module structure. The detailed algorithm is as follows.
(b) Algorithm
We first rearrange gene expressions so that β=(β1′, …, βm′)′, where βm is the length S(m) vector of regression coefficients for all genes within module m. Denote βjm as the jth component of βm and X (i)*m as the component of X (i)* that corresponds to βm.
Step I: Within-module boosting
For m=1, …, M, consider the objective function ![]() , which is l(β) evaluated only on genes within the mth module. This is equivalent to the objective function obtained from fitting an AFT model using only the mth module.
, which is l(β) evaluated only on genes within the mth module. This is equivalent to the objective function obtained from fitting an AFT model using only the mth module.
(a) Initialization. Set k=0 and βm[k]=0 (component-wise).
(b) Fit and update. k=k+1. Compute
. Compute Update for s≠ ŝ and where v is the step size. As suggested in Buhlmann & Yu (Reference Buhlmann and Yu2006) and references therein, the choice of v is not critical as long as it is small. In our numerical study, we set v=0.1. In numerical study, we have experimented with a few other step size values and reached almost identical results.(c) Iteration. Repeat step (b) for K iterations.
(d) Stopping. At iteration k, compute the objective function
Estimate the stopping iteration by For subject i, define its module m ‘super marker’ as
Step II: Module-wise boosting
Consider the objective function ![]() where
where ![]() and τ=(τ1, …, τM)′ is the unknown regression coefficient. That is, in the least squares objective function, we use the super markers, which represent the effects of all genes within the same modules, to replace the original gene expressions.
and τ=(τ1, …, τM)′ is the unknown regression coefficient. That is, in the least squares objective function, we use the super markers, which represent the effects of all genes within the same modules, to replace the original gene expressions.
(a) Initialization. Set k=0 and τ[k ]=0 (component-wise).
(b) Fit and update k=k+1. Compute
. Compute . Update for s≠ ŝ and where v=0.1 is the step size.(c) Iteration. Repeat Step (b) for K iterations.
(d) Stopping. At iteration k, compute the objective function
. Estimate the stopping iteration by
![]() is the resulted strong learner for Y (i)*. Genes and modules with nonzero regression coefficients in the strong learner are identified as associated with cancer.
is the resulted strong learner for Y (i)*. Genes and modules with nonzero regression coefficients in the strong learner are identified as associated with cancer.
(c) Parameter path
Parameter path, which is the graphical presentation of the estimates as a function of number of iterations, may provide further insights into NSBoost. Consider the simulation setting corresponding to row 1 of Table 1. For a better view, we simplify the simulation setting and consider four modules with four genes per module. The first two modules are cancer associated, within which there are two cancer-associated genes. Thus, among the 16 simulated genes, four are associated with cancer. For comparison, we also study Network Boosting (NBoost, details described in Section 3). For a randomly generated dataset, the parameter paths are shown in Figs 1 (NSBoost) and 2 (NBoost), respectively.
Parameter path of NSBoost: estimates as a function of number of iterations. (a) The four panels correspond to four modules in Step 1 of boosting. (b) The panel corresponds to four super markers in Step 2 of boosting. Vertical lines correspond to the selected number of iterations.

Parameter path of NBoost: estimates as a function of number of iterations. (a) The four panels correspond to four modules in Step 1 of boosting. (b) The panel corresponds to four super markers in Step 2 of boosting. Vertical lines correspond to the selected number of iterations.

Simulation study: median (sd) of the number of identified genes (T) and true positives (TP) computed over 200 replicates. Under each scenario, the first (second) row contains the summary statistics for gene (module) identification. Correlation structure: auto-regressive (auto), banded, and compound symmetry (comp)

Within each module, the parameter paths of NSBoost are similar to those of other regularized variable selection approaches (Hastie et al., Reference Hastie, Tibshirani and Friedman2009). By considering model complexity in boosting, the NSBoost parameter paths are ‘smoother’ than their NBoost counterparts. NBoost does not consider model complexity in boosting and thus may have a risk of false positives. For example, in the top right panel of Fig. 2a, NBoost has one false positive, while NSBoost does not. Our limited numerical study suggests that, in the within-module boosting step, NSBoost may identify ‘signals’ even with purely noisy modules. Thus, the module-level boosting is conducted, which can effectively remove noisy modules as a whole (Fig. 1b). With a combination of the two boosting steps, NSBoost can be sparser than NBoost at both within-module level and module level. We note that the parameter paths are presented for a small dataset and are only meant to provide a graphical presentation. More meaningful comparisons with larger datasets are presented in Sections 3 and 4.
3. Simulation
We conduct simulation to better gauge properties of the proposed approach. In each simulated dataset, there are 100 subjects. We simulate 50 gene clusters with 20 genes in each cluster. Gene expressions have marginally standard normal distributions. Genes within different clusters have independent expressions. For genes within the same clusters, their expressions have the following correlation structures: (1) auto-regressive correlation, where expressions of genes j and k have correlation coefficient ρ|j−k|. ρ=0·3 or 0·7, corresponding to weak and strong correlations; (2) banded correlation, where expressions of genes j and k have correlation coefficient max(0,1−|j−k|ρ). ρ=0·2 or 0·33; and (3) compound symmetry, where expressions of genes j and k have correlation coefficient ρ when j≠k, ρ=0·3 or 0·7. With each simulated dataset, we generate network modules using WGCNA. We find that when the within-cluster correlation is strong, the resulted modules tend to be correlated with the simulated clusters. On the other hand, when the within-cluster correlation is weak, there are considerable discrepancies between the WGCNA modules and simulated clusters. We consider two scenarios for the prognosis-associated genes. Within each of the first four (or two) modules, the first five genes are associated with survival. There are thus a total of 20 (or 10) cancer-associated genes, and the rest are noises. For cancer-associated genes, we generate their regression coefficients from Unif[0·5, 1·5]. Thus, some genes have large effects, and others have moderate to small effects. For a subject, we generate the logarithm of survival time from the AFT model with intercept equal to zero. The logarithm of censoring time is independently generated from a normal distribution with variance one. We adjust the mean of the censoring distribution by trial and error so that the average censoring rate is about 40%. To better gauge performance of the proposed approach, we also consider the following alternatives:
1. Enet (elastic net) (Zou & Hastie, Reference Zou and Hastie2005), which is a penalization approach and has been extensively used in the analysis of gene expression data.
2. Boost, which is an ordinary boosting approach and takes goodness-of-fit as the only criterion for choosing weaker learners. A BIC similar to that with NSBoost is adopted for stopping.
3. SBoost, which is a sparse boosting approach and considers goodness-of-fit as well as model complexity measured using a BIC in boosting and stopping.
4. NBoost, which is a network boosting approach and has a two-step algorithm similar to that with the proposed approach. The difference is that in boosting only goodness-of-fit is considered when choosing weaker learners.
Among the four alternative approaches, the first three ignore the network structure and treat all gene effects as interchangeable. The NBoost approach respects the network structure, however, puts less emphasis on sparsity. We are aware that a large number of approaches can be used to analyse the simulated data. The above four approaches are chosen for comparison, as Enet is one of the most extensively used penalization approaches and particularly includes Lasso and ridge penalization as special cases and, as the Boost, SBoost and NBoost approaches have boosting frameworks closest to that of NSBoost.
Summary statistics, including medians and standard deviations, based on 200 replicates are presented in Table 1. We can see that the Enet and Boost approaches can identify all of the true positives. However, under some scenarios, they may identify a considerable number of false positives. SBoost, which considers model complexity in boosting but ignores the network structure, is ‘overly sparse’ by having a considerable number of false negatives. Without accounting for model complexity in boosting, NBoost identifies a large number of false positives. Under all simulated scenarios, NSBoost has the best performance in terms of module and gene identification accuracy. It is capable of identifying the majority or all of the true positives while having a small number of false positives. We have also experimented with a few other simulation settings and reached similar conclusions.
4. Data analysis
We collect four cancer prognosis studies with gene expression measurements. Brief descriptions are provided in Table 2 and below. We refer to the original publications for more details.
Description of datasets. Gene: number of genes profiled
D1. Breast cancer is the second leading cause of cancer death among women in the United States. Sorlie et al. (Reference Sorlie, Perou, Tibshirani, Aas, Geisler, Johnsen, Hastie, Eisen, Rijn van de, Jeffrey, Thorsen, Quist, Matese, Brown, Botstein, Eystein Lonning and Borresen-Dale2001) conducted a gene expression profiling study, investigating whether it was feasible to classify breast carcinomas based on gene expression patterns. cDNA profiling of 85 samples was conducted, showing that breast cancer could be classified into a basal epithelial-like group, an ERBB2-overexpressing group, and a normal breast-like group. Among the 85 samples, 58 had survival information available and will be analysed in this study.
D2. Despite major progress in treatment, the ability to predict metastasis of breast tumours remains limited. Huang et al. (Reference Huang, Cheng, Dressman, Pittman, Tsou, Horng, Bild, Iversen, Liao, Chen, West, Nevins and Huang2003) reported a study investigating metastatic states and relapses in breast cancer patients. Affymetrix genechips were used for the profiling of 71 samples. Both D1 and D2 are on breast cancer prognosis. However, as suggested in multiple publications great heterogeneity may exist across studies, we choose to analyse D1 and D2 separately.
D3. Diffuse large B-cell lymphoma (DLBCL) is a cancer of the B-cell. It accounts for ~40% of all non-Hodgkin lymphoma (NHL) cases. A DLBCL gene expression study was reported in Rosenwald et al. (Reference Rosenwald, Wright, Chan, Connors, Campo, Fisher, Gascoyne, Muller-Hermelink, Smeland, Giltnane, Hurt, Zhao, Averett, Yang, Wilson, Jaffe, Simon, Klausner, Powell, Duffey, Longo, Greiner, Weisenburger, Sanger, Dave, Lynch, Vose, Armitage, Montserrat, Lopez-Guillermo, Grogan, Miller, LeBlanc, Ott, Kvaloy, Delabie, Holte, Krajci, Stokke and Staudt2002). This study retrospectively collected tumour biopsy specimens and clinical data for 240 patients with untreated DLBCL. The median follow up was 2·8 years, with 138 observed deaths. Lymphochip cDNA microarray was used to measure the expressions of 7399 genes.
D4. Mantle cell lymphoma (MCL) accounts for ~8% of all NHLs. Rosenwald et al. (Reference Rosenwald, Wright, Wiestner, Chan, Connors, Campo, Gascoyne, Grogan, Muller-Hermelink, Smeland, Chiorazzi, Giltnane, Hurt, Zhao, Averett, Henrickson, Yang, Powell, Wilson, Jaffe, Simon, Klausner, Montserrat, Bosch, Greiner, Weisenburger, Sanger, Dave, Lynch, Vose, Armitage, Fisher, Miller, LeBlanc, Ott, Kvaloy, Holte, Delabie and Staudt2003) reported a gene expression study of MCL survival. Among 101 untreated patients with no history of previous lymphoma, 92 were classified as having MCL based on morphologic and immunophenotypic criteria. Survival times of 64 patients were available, and the rest were censored. The median survival time was 2·8 years. Lymphochip DNA microarrays were used to quantify mRNA expressions in the lymphoma samples. Gene expression data on 8810 cDNA elements were available.
Among the four studies, one used Affymetrix and three used cDNA for profiling. We process the datasets as follows. We conduct normalization using the lowess approach for cDNA data and the robust multi-array (RMA) approach for Affymetrix data. Missing measurements are imputed using the K-nearest neighbours approach. Affymetrix gene expression measurements are log 2 transformed. We select the 500 genes with the largest variances for downstream analysis. Here, the pre-screening may serve multiple purposes. First in cancer gene expression studies, usually genes with higher variations are of more interest. Second, it is expected that the number of cancer prognosis-associated genes is far smaller than 500. Pre-screening may remove genes that are highly unlikely to be cancer-associated and significantly reduce computational cost. More importantly, as described above, the WGCNA approach involves estimating covariance matrices. Pre-screening may significantly reduce the dimensionality of such matrices and improve estimation accuracy. Note that the number of screened genes can be somewhat subjective. In the pre-screening literature, there is still a lack of guideline on how many genes should be screened. With the selected genes, we normalize their expressions to have median zero and variance one.
With datasets D1–D4, the WGCNA approach constructs 5, 4, 6 and 6 modules, respectively. For dataset D4, we show the module construction result in Fig. A.1 (Appendix I). Results for other datasets are available with the authors.
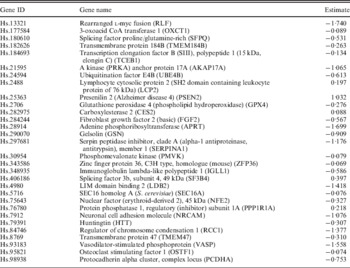
We apply the NSBoost approach. The identified genes and corresponding estimates are provided in Appendix II. Searching PubMed suggests that some of the identified genes have been suggested as cancer markers in published studies. Detailed interpretations of the identified genes are provided in Appendix III. Note that here we investigate the implications of identified genes individually. With the proposed approach, we conduct selection at the module level as well as the individual gene level. Thus, gene level interpretation is meaningful. In addition, research that links network modules to specific biological functions is extremely limited. As there is no strong correspondence between network modules and pathways, pathway analysis may not be very sensible. Evaluation of the biological implications deserves more investigation in future research.
(i) Analysis with alternative approaches
We apply the four alternative approaches described in the Simulation section. Summary analysis results for all approaches are presented in Table 3. By conducting the module-level sparse boosting and hence encouraging sparsity at the module level, NSBoost identifies the smallest number of modules, which may lead to more focused hypotheses for downstream analysis. Genes identified by NSBoost differ significantly from those identified using Enet, Boost and SBoost. For example for dataset D1, the numbers of overlapped genes are 4, 5 and 3, respectively. The sets of genes identified by NBoost and NSBoost are more similar, which is as expected, as both approaches use boosting for marker selection and account for the module structure. For example for dataset D1, the number of overlapped genes is 23. Although discussions in Appendix III show that the NSBoost identified genes are biologically meaningful, with our limited understanding of cancer genomics, we are unable to determine whether they are ‘more meaningful’ than the other sets of identified genes. As an alternative, we examine the prediction performance of different approaches, which proceeds as follows: (1) randomly split data into a training set and a testing set with sizes 3:1; (2) analyse the training data and identify markers. A natural by-product of the proposed approach is a prediction model; (3) make prediction for subjects in the testing set. The predictive model can lead to a predicted risk score X′β for each subject. Dichotomize the risk scores at the median and create two risk groups. Compute the logrank statistic, which measures the survival difference between the two groups; (4) to avoid an extreme partition, repeat steps (1)–(3) 100 times, and compute the average logrank statistic. Table 3 shows that with the four analysed datasets, NSBoost has the largest logrank statistics and hence the best performance in separating subjects into groups with different survival risks.
Data analysis results
Gene, number of genes identified; Overlap, number of genes overlapped with NSBoost; Module, number of modules identified; logrank, prediction logrank statistic.
5. Discussion
In cancer genomic studies, an important goal is to identify markers associated with prognosis. There exists inherent coordination among genes, and network provides an effective way of describing such coordination. In this study, we adopt the weighted gene co-expression network and develop a two-step sparse boosting approach to account for the network structure in cancer marker selection. The proposed approach is intuitively reasonable. Simulation and data analysis demonstrate its satisfactory performance.
As shown in multiple published studies, network modules may have important biological implications. The proposed approach respects the network module structure and can be more informative than alternatives that ignore such structure. Another advantage of the proposed approach is its computational affordability. As can be seen from the algorithm, only simple calculations are involved. In the within-module boosting, the number of genes per module can be much smaller than the total number of genes. In addition, this step can be carried out in a parallel manner. Thus, the first step of boosting has computational cost much smaller than that of ordinary boosting with all genes. With WGCNA, the number of modules (and hence super markers) is usually not large. Numerical studies in Ma et al. (Reference Ma, Shi, Li, Yi and Shia2010b, Reference Ma, Kosorok, Huang and Dai2011) suggest less than 20. Thus, the computational cost of the second step of boosting is almost negligible. The proposed approach also has the advantage that its applicability is relatively ‘independent’ of the model setup and network construction procedure. It is applicable to other survival models and other types of data, for example diagnosis studies with categorical response variables and generalized linear models, with very minor modifications.
As described in Section 1, there are multiple ways of describing the interplay among genes. To the best of our knowledge, there is a lack of definitive evidence on the relative performance of different network construction procedures. Our analysis shows that with WGCNA, the proposed NSBoost may improve cancer marker selection. It is possible that in practical data analysis, adopting other network construction methods can further improve prediction and selection. As the focus of this study is on the development of NSBoost, a more comprehensive examination of its performance under different networks is beyond our scope. We adopt the AFT model to describe gene effects on survival. Compared with alternatives such as the Cox model, this model may have more lucid interpretations and lower computational cost. Model diagnostics is not conducted, as there is a lack of diagnostic tools for survival analysis with high-dimensional gene expression data. The satisfactory prediction performance may partly support the validity of this model. NSBoost can effectively account for the ‘module-gene’ two-level hierarchical structure, which is not the complete information contained in a network. WGCNA and other networks contain other information, for example the connectedness measure between any two genes within the same modules. It may be possible to extend the proposed approach and accommodate the connectedness measure in marker selection. However, as discussed above, with n=d, the uniform estimation consistency of d(d−1)/2 connectedness measures is questionable. In contrast, the module structure can be much more reliable. Thus, we focus on the module structure in our research. The simulation settings considered in this study are simpler than what is encountered in practical data analysis. We intentionally choose such settings as they may favour simple approaches such as Enet and Boost. In data analysis, we conclude that NSBoost may be preferred as it identifies a smaller number of modules and genes and has better prediction performance. Analysis of independent validation studies may be needed to fully confirm performance of NSBoost and identified markers.
We thank the editor and referees for careful review and insightful comments. This study was supported by awards DMS-0904181 from NSF, CA142774 and CA165923 from NIH, USA and Fujian Social Science Fund (2011C042), China.
Appendix I
Module construction result for dataset D4.

Appendix II. Details on the identified genes and their estimates for dataset D1–D4
Data D1
Data D2
Data D3
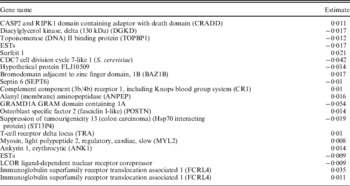
Data D4

Appendix III. Biological implications of the identified genes
D1. Among the identified genes, gene TTC35 is one of the identified breast cancer markers according to G2SBC (http://www.itb.cnr.it/breastcancer/php/browse.php). Gene FAM69A encodes a member of the FAM69 family of cysteine-rich type II transmembrane proteins. It has been implied in the development of multiple sclerosis and ovarian cancer, suggesting that it may play an essential role in cancer development. It is also involved in the development of mental disorders. Gene IRX5 encodes a member of the iroquois homeobox gene family, which are involved in several embryonic developmental processes. Studies with knockout mice lacking this gene show that it is required for retinal cone bipolar cell differentiation, and that it negatively regulates potassium channel gene expression in the heart to ensure coordinated cardiac repolarization. Gene WFDC2 encodes a protein that is a member of the WFDC domain family. This gene is expressed in pulmonary epithelial cells and is also found to be expressed in ovarian cancer, which shares multiple genetic markers with breast cancer. Gene PRAME encodes an antigen that is predominantly expressed in multiple cancer tissues such as melanomas and that is recognized by cytolytic T-lymphocytes. It is not expressed in normal tissues, except testis. Gene INSL4 encodes the insulin-like 4 (INSL4) protein, a member of the insulin superfamily. Its involvement in breast cancer development is proposed in Burger et al. (Reference Burger, Kemming, Helms, Feldmann, Matuschek, Bocker and Brandt2005). Gene Adenosine A2b receptor (ADORA2B) is overexpressed in cancer tissues under a hypoxic state, promoting cancer cell growth (Ma et al., Reference Ma, Kondo, Nakazawa, Niu, Mochizuki, Kawasaki, Yamane and Katoh2010a). Gene LGALS3 encodes a member of the galectin family of carbohydrate binding proteins. This protein plays a role in numerous cellular functions including apoptosis, innate immunity, cell adhesion and T-cell regulation. Gene CYP4B1 encodes a member of the cytochrome P450 superfamily of enzymes. In rodents, the homologous protein has been shown to metabolize certain carcinogens. Gene VEGFA is a member of the PDGF/VEGF growth factor family and encodes a protein that is often found as a disulphide-linked homodimer. This protein is a glycosylated mitogen that specifically acts on endothelial cells and has various effects, including mediating increased vascular permeability, inducing angiogenesis, vasculogenesis and endothelial cell growth, promoting cell migration and inhibiting apoptosis. Published studies have suggested gene SATB1 as a marker for breast cancer, gastric cancer and non-small cell lung cancer. The protein encoded by gene SLC20A1 is a sodium-phosphate symporter that absorbs phosphate from interstitial fluid for use in cellular functions such as metabolism, signal transduction and nucleic acid and lipid synthesis. The encoded protein is also a retroviral receptor, causing human cells to be susceptible to infection by gibbon ape leukaemia virus, simian sarcoma-associated virus, feline leukaemia virus subgroup B, and 10A1 murine leukaemia virus. The protein encoded by gene STAT4 is a member of the STAT family of transcription factors. In response to cytokines and growth factors, STAT family members are phosphorylated by the receptor-associated kinases, and then form homo- or heterodimers that translocate to the cell nucleus where they act as transcription activators. Gene angio-associated migratory cell protein (AAMP) is found to be expressed strongly in endothelial cells, cytotrophoblasts and poorly differentiated colon adenocarcinoma cells found in lymphatics. Gene IL-6 encodes a cytokine that functions in inflammation and the maturation of B-cells. The functioning of this gene is implicated in a wide variety of inflammation-associated disease states, including susceptibility to diabetes mellitus and systemic juvenile rheumatoid arthritis. Gene FAT1 is an orthologue of the Drosophila fat gene, which encodes a tumour suppressor essential for controlling cell proliferation. Its product functions as an adhesion molecule and/or signalling receptor, and is likely to be important in developmental processes and cell communication. Proteins of the matrix metalloproteinase (MMP) family are involved in the breakdown of extracellular matrix (ECM) in normal physiological processes, such as embryonic development, reproduction and tissue remodelling, as well as in disease processes, such as arthritis and metastasis. The protein encoded by gene CP is a metalloprotein that binds most of the copper in plasma and is involved in the peroxidation of Fe(II)transferrin to Fe(III) transferrin. Mutations in this gene cause aceruloplasminemia, which results in iron accumulation and tissue damage. The protein encoded by gene PCM1 is a component of centriolar satellites, which are electron dense granules scattered around centrosomes. Chromosomal aberrations involving this gene are associated with papillary thyroid carcinomas and a variety of haematological malignancies, including atypical chronic myeloid leukaemia and T-cell lymphoma, suggesting that this gene plays an essential role in cancer development.
D2. Gene RLF is widely expressed in foetal and adult tissues, suggesting that it has a general role in transcriptional regulation. It encodes a Zn-15 related zinc finger protein and plays a role in deregulating the tightly controlled expression of the L-myc oncogene. Gene OXCT1 encodes a member of the 3-oxoacid CoA-transferase gene family. The encoded protein is a homodimeric mitochondrial matrix enzyme that plays a central role in extrahepatic ketone body catabolism by catalysing the reversible transfer of coenzyme A from succinyl-CoA to acetoacetate. Gene TMEM184B is one of the breast cancer markers identified by Bonnefoi et al. (Reference Bonnefoi, Potti, Delorenzi, Mauriac, Campone, Tubiana-Hulin, Petit, Rouanet, Jassem, Blot, Becette, Farmer, Andre, Acharya, Mukherjee, Cameron, Bergh, Nevins and Iggo2007). Gene TCEB1 encodes the protein elongin C, which is a subunit of the transcription factor B (SIII) complex. It belongs to the KEGG pathway in cancer, organism-specific biosystem. The modification of proteins with ubiquitin is an important cellular mechanism for targeting abnormal or short-lived proteins for degradation. Gene UBE4B is the strongest candidate in the neuroblastoma tumour suppressor genes. Gene PSEN2 is one of the confirmed Alzheimer's disease (AD) susceptibility genes. A negative correlation between the occurrence of AD and cancer has been observed. Gene CES2 encodes a member of the carboxylesterase large family. The protein encoded by this gene is the major intestinal enzyme and functions in intestine drug clearance. It has been identified as a cancer marker in Cai et al. (Reference Cai, Tang, Guo, An, Wang and Zheng2009). The protein encoded by gene FGF2 is a member of the fibroblast growth factor (FGF) family. FGF family members bind heparin and possess broad mitogenic and angiogenic activities. This protein has been implicated in diverse biological processes, such as limb and nervous system development, wound healing, and tumour growth. The GSN encoded calcium-regulated protein functions in both assembly and disassembly of actin filaments. Defects in this gene are a cause of familial amyloidosis Finnish type (FAF). The protein encoded by gene SERPINA1 is secreted and is a serine protease inhibitor whose targets include elastase, plasmin, thrombin, trypsin, chymotrypsin and plasminogen activator. Defects of this gene are associated with the development of breast cancer and lung cancer. Gene ZFP36 has been implied in the development of colon cancer, head and neck squamous cell carcinoma, tissue inflammation, cervical cancer and colorectal cancer, indicating its generic role in cancer development. The protein encoded by the LDB2 gene is capable of binding to a variety of transcription factors and is likely to function at enhancers to bring together diverse transcription factors and form higher order activation complexes or to block formation of such complexes (Jurata & Gill, Reference Jurata and Gill1997). The fact that LIM domain-binding factors are likely to be involved in the coordination of the transcriptional activity of many diverse factors may implicate them in human phenotypes characterized by multiple affected sites. Cell adhesion molecules (CAMs) are members of the mmunoglobulin superfamily. This gene encodes a neuronal CAM with multiple immunoglobulin-like C2-type domains and fibronectin type-III domains. This ankyrin-binding protein is involved in neuron–neuron adhesion and promotes directional signalling during axonal cone growth. This gene is also expressed in non-neural tissues and may play a general role in cell–cell communication via signalling from its intracellular domain to the actin cytoskeleton during directional cell migration. Vasodilator-stimulated phosphoprotein (VASP) is associated with filamentous actin formation and likely plays a widespread role in cell adhesion and motility. VASP may also be involved in the intracellular signalling pathways that regulate integrin-ECM interactions. VASP is regulated by the cyclic nucleotide-dependent kinases PKA and PKG. The protocadherin alpha gene cluster is one of three related clusters tandemly linked on chromosome five. These neural adhesion proteins most likely play a critical role in the establishment and function of specific cell–cell connections.
D3. The protein encoded by gene CRADD is a death domain (CARD/DD)-containing protein and has been shown to induce cell apoptosis. Through its CARD domain, this protein interacts with, and thus recruits, caspase 2/ICH1 to the cell death signal transduction complex that includes tumour necrosis factor receptor 1 (TNFR1A), RIPK1/RIP kinase and numbers of other CARD domain-containing proteins. Gene DGKD encodes a cytoplasmic enzyme that phosphorylates diacylglycerol to produce phosphatidic acid. Diacylglycerol and phosphatidic acid are two lipids that act as second messengers in signalling cascades. Their cellular concentrations are regulated by the encoded protein, and so it is thought to play an important role in cellular signal transduction. The TopBP1 protein includes eight BRCT domains (originally identified in BRCA1) and has homology with BRCA1 over the carboxyl terminal half of the protein. Gene CDC7 encodes a cell division cycle protein with kinase activity that is critical for the G1/S transition. The yeast homologue is also essential for initiation of DNA replication as cell division occurs. Overexpression of this gene product may be associated with neoplastic transformation for some tumours. Gene BAZ1B encodes a member of the bromodomain protein family. It is expressed in multiple tumour tissues, including adrenal tumour, breast tumour, cervical tumour, chondrosarcoma, head and neck tumour, leukaemia, lymphoma, prostate cancer and several others. Gene CR1 is a member of the receptors of complement activation (RCA) family and is located in the ‘cluster RCA’ region of chromosome 1. The gene encodes a monomeric single-pass type I membrane glycoprotein. The protein mediates cellular binding to particles and immune complexes that have activated complement. Decreases in expression of this protein and/or mutations in its gene have been associated with gallbladder carcinomas, mesangiocapillary glomerulonephritis, systemic lupus erythematosus and sarcoidosis. Gene ANPEP has been identified as a marker for lung cancer and prostate cancer. In the small intestine aminopeptidase N plays a role in the final digestion of peptides generated from hydrolysis of proteins by gastric and pancreatic proteases. Gene POSTN is involved in the development of gastric cancer and pancreatic cancer. Gene MYL2 encodes the regulatory light chain associated with cardiac myosin beta (or slow) heavy chain. Ca+ triggers the phosphorylation of regulatory light chain that in turn triggers contraction. Ankyrins are a family of proteins that link the integral membrane proteins to the underlying spectrin-actin cytoskeleton and play key roles in activities such as cell motility, activation, proliferation, contact and the maintenance of specialized membrane domains. Gene FCRL4 encodes a member of the immunoglobulin receptor superfamily and is one of several Fc receptor-like glycoproteins clustered on the long arm of chromosome 1. This protein may play a role in the function of memory B-cells in the epithelia. Aberrations in the chromosomal region encoding this gene are associated with non-Hodgkin lymphoma and multiple myeloma.
D4. Gene IFIT1B is identified as a lymphoma susceptibility marker in Gaiser et al. (Reference Gaiser, Thorns, Merz, Noack, Feller and Lange2002). Gene SHC1 encodes three main isoforms that differ in activities and subcellular location. Although all three are adapter proteins in signal transduction pathways, the longest (p66Shc) may be involved in regulating life span and the effects of reactive oxygen species. The other two isoforms, p52Shc and p46Shc, link activated receptor tyrosine kinases to the Ras pathway by recruitment of the GRB2/SOS complex. Gene SATB1 has been identified as a marker for breast cancer, gastric cancer and non-small cell lung cancer, suggesting its fundamental role in cancer development. Gene NRAS is an N-ras oncogene encoding a membrane protein that shuttles between the Golgi apparatus and the plasma membrane. Mutations in this gene have been associated with somatic rectal cancer, follicular thyroid cancer, autoimmune lymphoproliferative syndrome, Noonan syndrome and juvenile myelomonocytic leukaemia. The protein encoded by gene ID2 belongs to the inhibitor of DNA binding family, members of which are transcriptional regulators that contain a helix-loop-helix (HLH) domain but not a basic domain. This protein may play a role in negatively regulating cell differentiation. Gene CCL19 is one of several CC cytokine genes clustered on the p-arm of chromosome 9. Cytokines are a family of secreted proteins involved in immunoregulatory and inflammatory processes. The CC cytokines are proteins characterized by two adjacent cysteines. The cytokine encoded by this gene may play a role in normal lymphocyte recirculation and homing. It also plays an important role in trafficking of T-cells in thymus, and in T-cell and B-cell migration to secondary lymphoid organs. Gene PTGS2 encodes the inducible isozyme. It is regulated by specific stimulatory events, suggesting that it is responsible for the prostanoid biosynthesis involved in inflammation and mitogenesis. Gene TIMP3 belongs to the TIMP gene family. The proteins encoded by this gene family are inhibitors of the MMPs, a group of peptidases involved in degradation of the ECM. It has been implied in the development of multiple cancers, including for example colorectal cancer, head and neck cancer and breast cancer. Gene HHEX encodes a member of the homeobox family of transcription factors, many of which are involved in developmental processes. Gene ZNF592 plays a role in a complex developmental pathway and the regulation of genes involved in cerebellar development. Gene SH3KBP1 encodes an adapter protein that contains three N-terminal Src homology domains, a proline-rich region and a C-terminal coiled-coil domain. The encoded protein facilitates protein–protein interactions and has been implicated in numerous cellular processes including apoptosis, cytoskeletal rearrangement, cell adhesion and in the regulation of clathrin-dependent endocytosis.


