


1 Introduction
The study of extreme states of matter at high temperature and high pressure is interesting for many fields: from planetology and astrophysics to material science and inertial fusion. Usually such high energy density (HED) states are accessible by using high-energy lasers with ns-duration, in particular through compression produced by laser-driven shock waves[ Reference Batani, Batani, He and Shigemori 1 – Reference Wang, Zhang, Jiang, Duan, Zhang, Li, Yang, Liu, Li, Sun, Liu and Wang 4 ].
Alternatively, HED states of matter can be created by using short-pulse (fs) high-intensity laser beams by isochoric heating of matter, that is, thanks to the fact that these lasers can deposit their energy on a time scale faster than the time needed for hydrodynamic expansion. This allows creating matter at solid density (or quasi solid density) and very high temperatures (eV to 100 eV)[ Reference Schönlein, Boutoux, Pikuz, Antonelli, Batani, Debayle, Franz, Giuffrida, Honrubia, Jacoby, Khaghani, Neumayer, Rosmej, Sakaki, Santos and Sauteray 5 – Reference Roth, Alber, Bagnoud, Brown, Clarke, Daido, Fernandez, Flippo, Gaillard, Gauthier, Glenzer, Gregori, Günther, Harres, Heathcote, Kritcher, Kugland, LePape, Li, Makita, Mithen, Niemann, Nürnberg, Offermann, Otten, Pelka, Riley, Schaumann, Schollmeier, Schütrumpf, Tampo, Tauschwitz and Tauschwitz 7 ]. It is also well known that short-pulse high-intensity lasers produce very high radiation pressures[ Reference Macchi, Veghini, Liseykina and Pegoraro 8 , Reference Kim, Pae, Choi, Lee, Kim, Singhal, Sung, Lee, Lee, Nickles, Jeong, Kim and Nam 9 ].
Here we propose a different approach to generate and study HED states using short-pulse high-intensity lasers, namely the generation of shock waves by thermal pressure and the study of their propagation (which can take place on ns-time scales and can rely on diagnostics approaches developed for ‘conventional’ shock experiments).
In the case of fs-laser irradiation, due to the very short pulse duration the pressure is not maintained, and the generated shock has therefore the characteristics of a ‘blast wave’, that is, a thin shock front that decreases its pressure while traveling in the material. Blast waves are relevant to many physical phenomena: nuclear explosions, astrophysics (i.e., supernovae explosions) and hydrodynamics. For this reason, several studies have been already conducted, mainly in gases, by using short-pulse high-intensity lasers[ Reference Moore, Symes and Smith 10 – Reference Yoh and Kim 12 ]. Blast waves were also observed in solids by Budil et al. [ Reference Budil, Gold, Estabrook, Remington, Kane, Bell, Pennington, Brown, Hatchett, Koch, Key and Perry 13 ] using a higher energy laser (‘Petawatt’ at Livermore), even if the mechanism of pressure generation was not studied in detail in this paper. Our previous works on blast waves in solids[ Reference Santos, Vauzour, Touati, Gremillet, Feugeas, Ceccotti, Bouillaud, Deneuville, Floquet, Fourment, Hadj-Bachir, Hulin, Morace, Nicolaï, d'Oliveira, Reau, Samaké, Tcherbakoff, Tikhonchuk, Veltcheva and Batani 14 , Reference Jakubowska, Batani, Feugeas, Forestier-Colleoni, Hulin, Nicolaï, Santos, Flacco, Vauzour and Malka 15 ] tried to elucidate the mechanism of shock generation, showing that it is driven by the energy deposition from hot electrons (HEs) created during the interaction of the target with the laser beam, inducing temperature and pressure gradients in the target, and inducing compression waves traveling at different velocities (according to local temperature). The coalescence of such compression waves induces the generation of the shock.
However, in these works the HE source and its effects on target heating and expansion were not directly measured. In this paper, we extend previous works to a new range of laser and target parameters and we present an extensive experimental characterization of the blast wave generation and its transport through the target, corroborated by particle-in-cell (PIC), hybrid Vlasov–Fokker–Planck (VFP) and radiation hydrodynamic simulations.
2 Experimental setup
In the experiment, we used the laser beam provided by the VEGA-2 laser system at Centro de Láseres Pulsados (CLPU) in Salamanca. This is a Ti:Sa system delivering 3 J of laser energy on target at λ = 810 nm in a pulse duration of 30 fs. The laser was incident on target at an angle of 10°. The beam was defocused to provide a focal spot of 20–24 μm full width at half maximum (FWHM) corresponding, taking into account the angle of incidence, to a laser intensity on target of about (2–3) × 1019 W/cm2. The laser contrast was between 3 × 10⁻¹⁰ and 10–9, providing a pedestal intensity of the order of 1010 W/cm2.
The laser system can operate at 10 Hz, although this repetition frequency was not used in the experiments. Anyway, in order to allow for a higher shot rate without the need for breaking the vacuum after each shot to replace the target, we used a target holder hosting up to 100 targets. Positioning of the targets in target chamber center (TCC) was guaranteed by an automatic procedure after a pre-alignment of each target/target holder assembly performed after putting the chamber under vacuum.
Flat foil targets (of lateral size 50 mm × 50 mm) were used in the experiments: Al of thickness 6, 10, 25, 30, 50 and 70 μm and polypropylene of thickness 5 and 10 μm with 200 nm Al flash coating to prevent shinethrough. A thin layer (2 μm
 $\pm$
0.2 μm) of Ti was deposited on the rear side of some targets[
16
] in order for better performance of a Kirkpatrick–Baez (KB) microscope looking at the rear side of the target (its sensitivity was optimized at photon energies close to Ti K-α). Unfortunately, such targets did not provide a good reflectivity in the visible region so we could not simultaneously use other diagnostics (i.e., the Doppler velocimetry diagnostics described later).
$\pm$
0.2 μm) of Ti was deposited on the rear side of some targets[
16
] in order for better performance of a Kirkpatrick–Baez (KB) microscope looking at the rear side of the target (its sensitivity was optimized at photon energies close to Ti K-α). Unfortunately, such targets did not provide a good reflectivity in the visible region so we could not simultaneously use other diagnostics (i.e., the Doppler velocimetry diagnostics described later).
3 Diagnostics
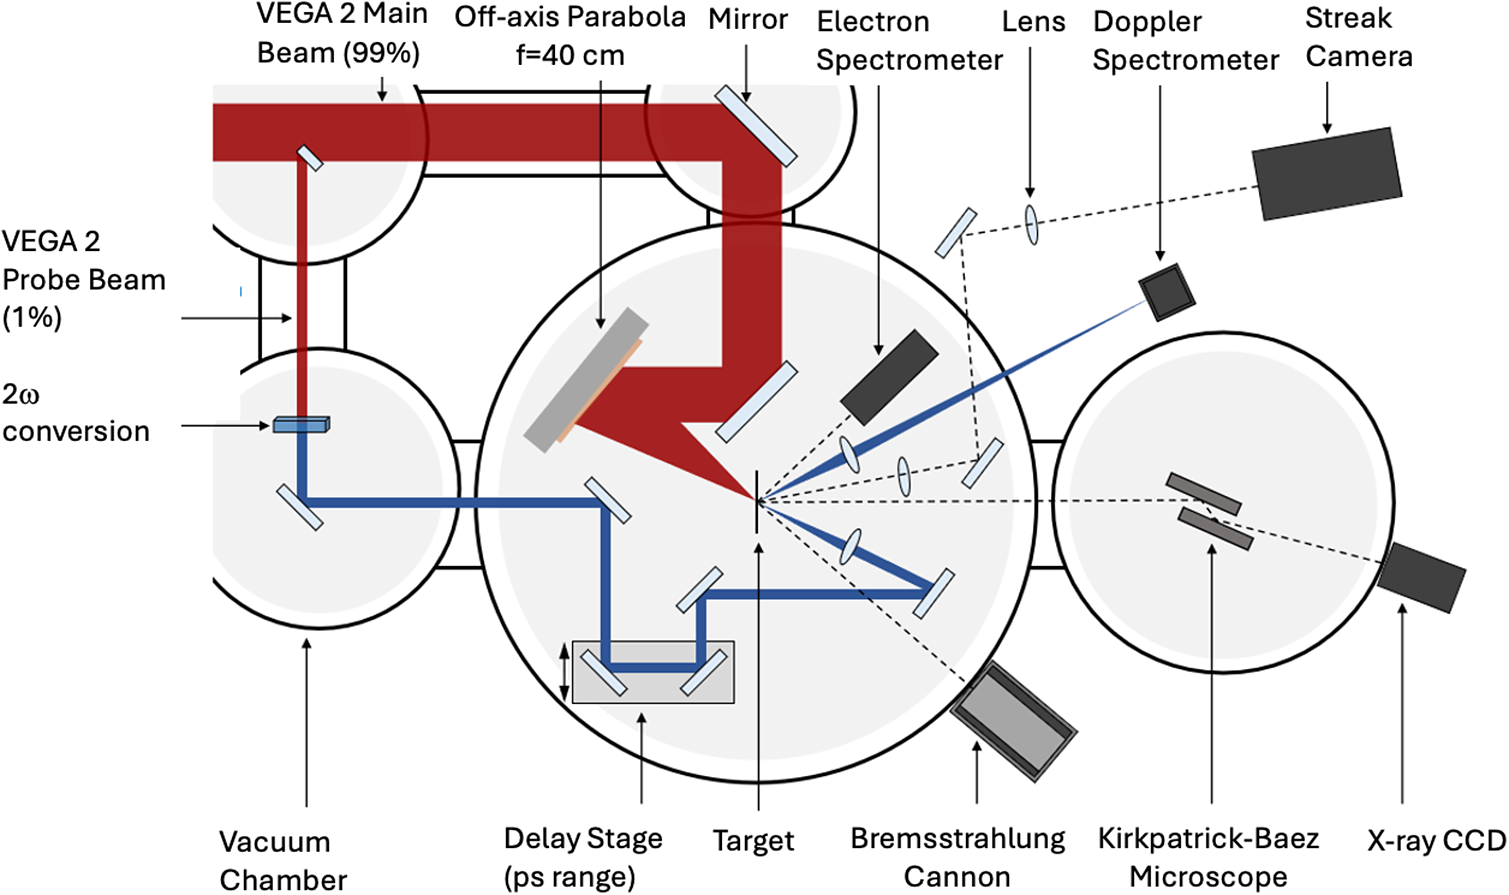
Several diagnostics were used in the experiment, as shown in Figure 1. These can be divided into two groups, as follows.
-
1. Diagnostics to characterize the HE source generated by the interaction of the main beam with the targets, as follows.
-
- An electron spectrometer (ES), placed at 40° to the Vega laser axis. It includes an 80 mm collimator with a 1 mm diameter entrance hole followed by body with 77 mm length and 84 mm lateral size using a 0.2 T magnet producing a static magnetic field. Imaging plates were used as detectors[ Reference Boutoux, Rabhi, Batani, Binet, Ducret, Jakubowska, Nègre, Reverdin and Thfoin 17 ].
-
- A KB microscope (described in detail by Zeraouli et al. [ Reference Zeraouli, Gatti, Longman, Pérez-Hernández, Arana, Batani, Jakubowska, Volpe, Roso and Fedosejevs 18 ]), measuring the K-α X-ray emission from the target rear-side region crossed by HEs, and optimized for Ti K-α emission at
 $h\nu$
= 4.065 keV. In the present experiment the magnification was M = 1 and the detector used was a Greateyes X-ray charge-coupled device (CCD).
$h\nu$
= 4.065 keV. In the present experiment the magnification was M = 1 and the detector used was a Greateyes X-ray charge-coupled device (CCD). -
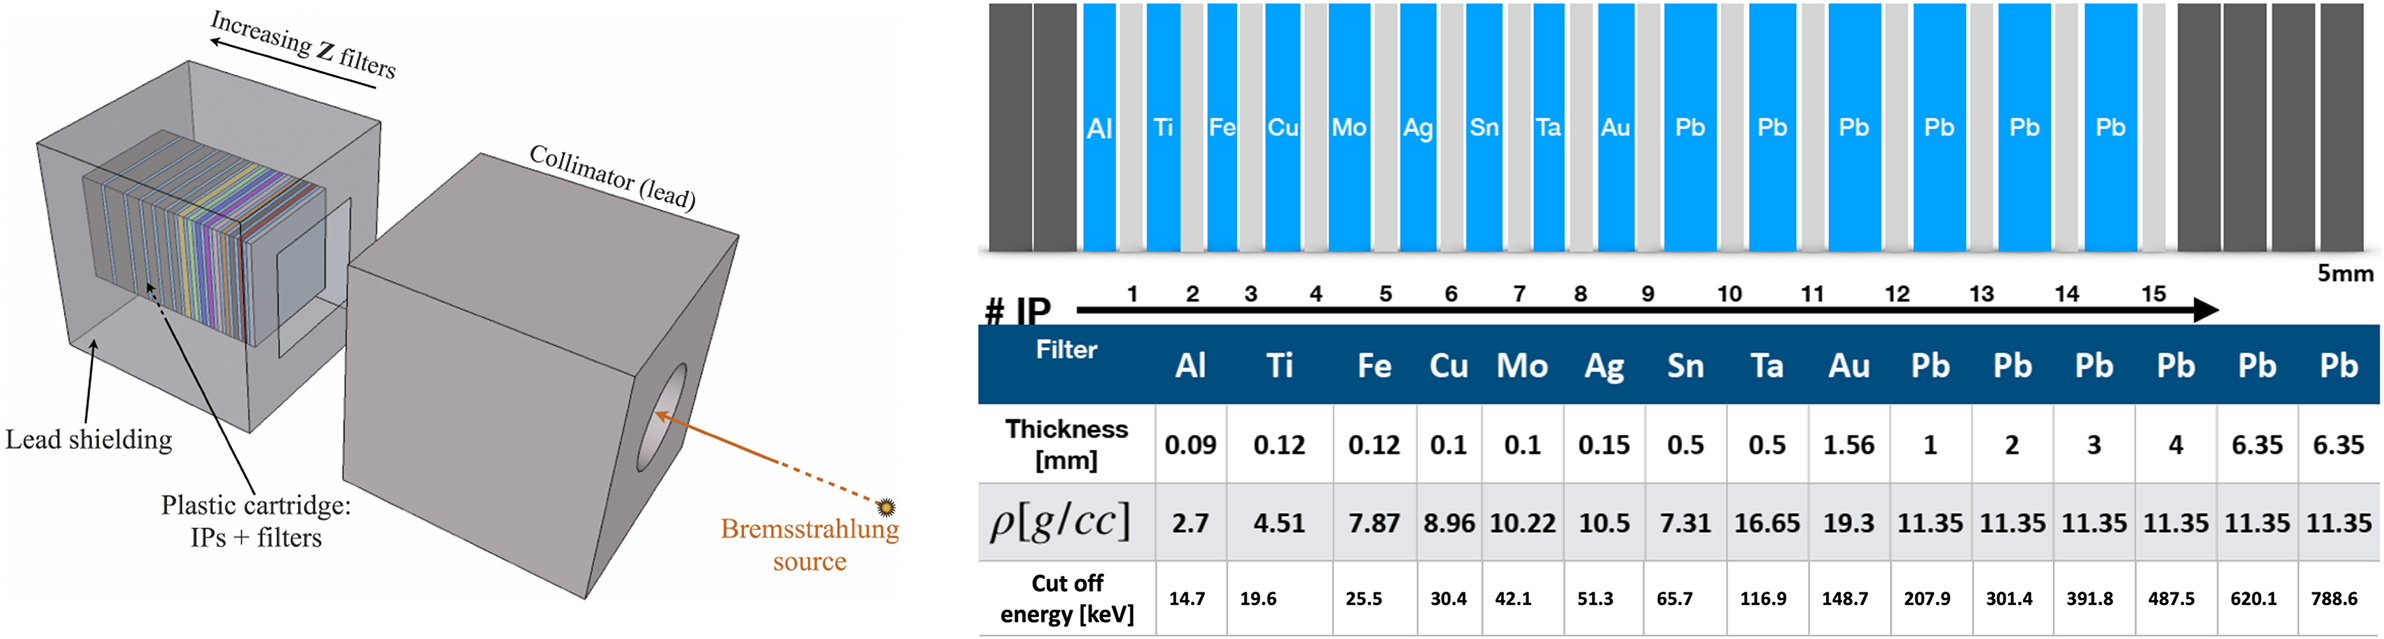
- A bremsstrahlung cannon (BSC)[ Reference Rhee, Nam, Peebles, Sawada, Wei, Vaisseau, Sasaki, Giuffrida, Hulin, Vauzour, Santos, Batani, Mclean, Patel, Li, Yuan, Zhang, Zhong, Fu, Hua, Li, Zhang, Zhu, Kim, Jeon, Jeong, Choi, Lee, Sung, Lee and Nam 19 ] to characterize the hard X-ray spectrum emitted from the targets due to the collisions of HEs with atoms. The BSC was placed outside the interaction chamber looking at the rear side of the target through a 100 μm thick mylar window with a viewing angle of 25° with respect to the laser axis. It was made by a 12.4 cm lead collimator and a stack of 15 imaging plates (type MS[ Reference Boutoux, Batani, Burgy, Ducret, Forestier-Colleoni, Hulin, Rabhi, Duval, Lecherbourg, Reverdin, Jakubowska, Szabo, Bastiani-Ceccotti, Consoli, Curcio, De Angelis, Ingenito, Baggio and Raffestin 20 ]) separated by filters of different material and thickness, again placed inside a thick lead shielding (see Figure 2) of ≈13 cm. The head of the collimator was placed at 16.6 cm from the mylar window (i.e., at 76.6 cm from the target taking into account the 60 cm radius of the interaction chamber). A magnet of 0.4 T prevented electrons with energies up to 100 MeV from entering the BSC.
Figure 1 Scheme of the experimental setup and diagnostics used in the experiment.
Figure 2 Scheme of the BSC and the filter stack used in the experiment. The table on the right shows the cut-off energy for each imaging plate (IP), that is, the X-ray photon energy below which the IP is practically insensitive. This is calculated taking into account the sensitivity of the IP (according to Boutoux et al. [ Reference Boutoux, Batani, Burgy, Ducret, Forestier-Colleoni, Hulin, Rabhi, Duval, Lecherbourg, Reverdin, Jakubowska, Szabo, Bastiani-Ceccotti, Consoli, Curcio, De Angelis, Ingenito, Baggio and Raffestin 20 ]) and the transmission of all filters and the IP placed before them.
-
-
2. Diagnostics aiming at studying the hydrodynamics induced in the target. These included the following.
-
- A classical shock chronometry diagnostic based on a streak camera, a Hamamatsu C7700, with an S20 photocathode looking at the rear side of the target and collecting target self-emission[ Reference Koenig, Faral, Boudenne, Batani, Bossi and Benuzzi 21 ]. The target rear side was imaged onto the streak camera slit with a magnification M = 10 using an optical system with three achromatic doublets. Light was collected with an angle of 15° with respect to the target normal. The optical transition radiation (OTR) is centered at the harmonics of the laser light. Therefore, an interferometric narrowband (notch) filter was placed in front of the streak camera to block the fundamental laser wavelength at
$\approx$
800 nm and its second harmonic (2ω at
$\approx$
400 nm). This was either a filter centered at 540 nm or one centered at 570 nm, both with a bandwidth of 50 nm. -
- A Doppler velocimetry diagnostic[ Reference Jana, Lad, West, Trickey, Underwood, Ved, Robinson, Pasley and Kumar 22 – Reference Adak, Blackman, Chatterjee, Singh, Lad, Brijesh, Robinson, Pasley and Kumar 24 ]. This used a probe beam obtained by converting a part of the VEGA-2 laser beam to the second harmonic (λ = 405 nm). This was then sent through a delay line to the target rear side. Reflected light was sent to a high-resolution visible spectrometer (resolution 0.03 nm, i.e., λ/Δλ = 13,500) measuring the Doppler shift induced by the motion of the target rear side. The delay line allowed one to probe times between –10 and + 100 ps with respect to the arrival of the main laser pulse on the target. The probe beam spot on the target rear side was 70 μm FWHM, and therefore this is the region on the target rear side that determines the measured value of the Doppler shift.
-


These two diagnostics are complementary because Doppler velocimetry measures target motion at very early times with high temporal resolution (the duration of the beam converted to 2ω was 75 fs), while shock chronometry allowed one to observe it on a longer time scale (up to 10 ns after laser irradiation) with lower time resolution (of the order of ±20 ps, as determined by the streak camera time window, typically 10 ns, and streak camera slit size, typically 30 μm).
4 Experimental results
4.1 Shock chronometry
Figure 3 shows the typical breakout signal and its lineout. We observed that, for a fixed target type and laser irradiation conditions, the measured signal was very reproducible from shot to shot. Therefore, we could average different results in order to reduce the noise. For instance, the image in Figure 3 is the results of averaging six streak camera images obtained for shots in identical conditions.
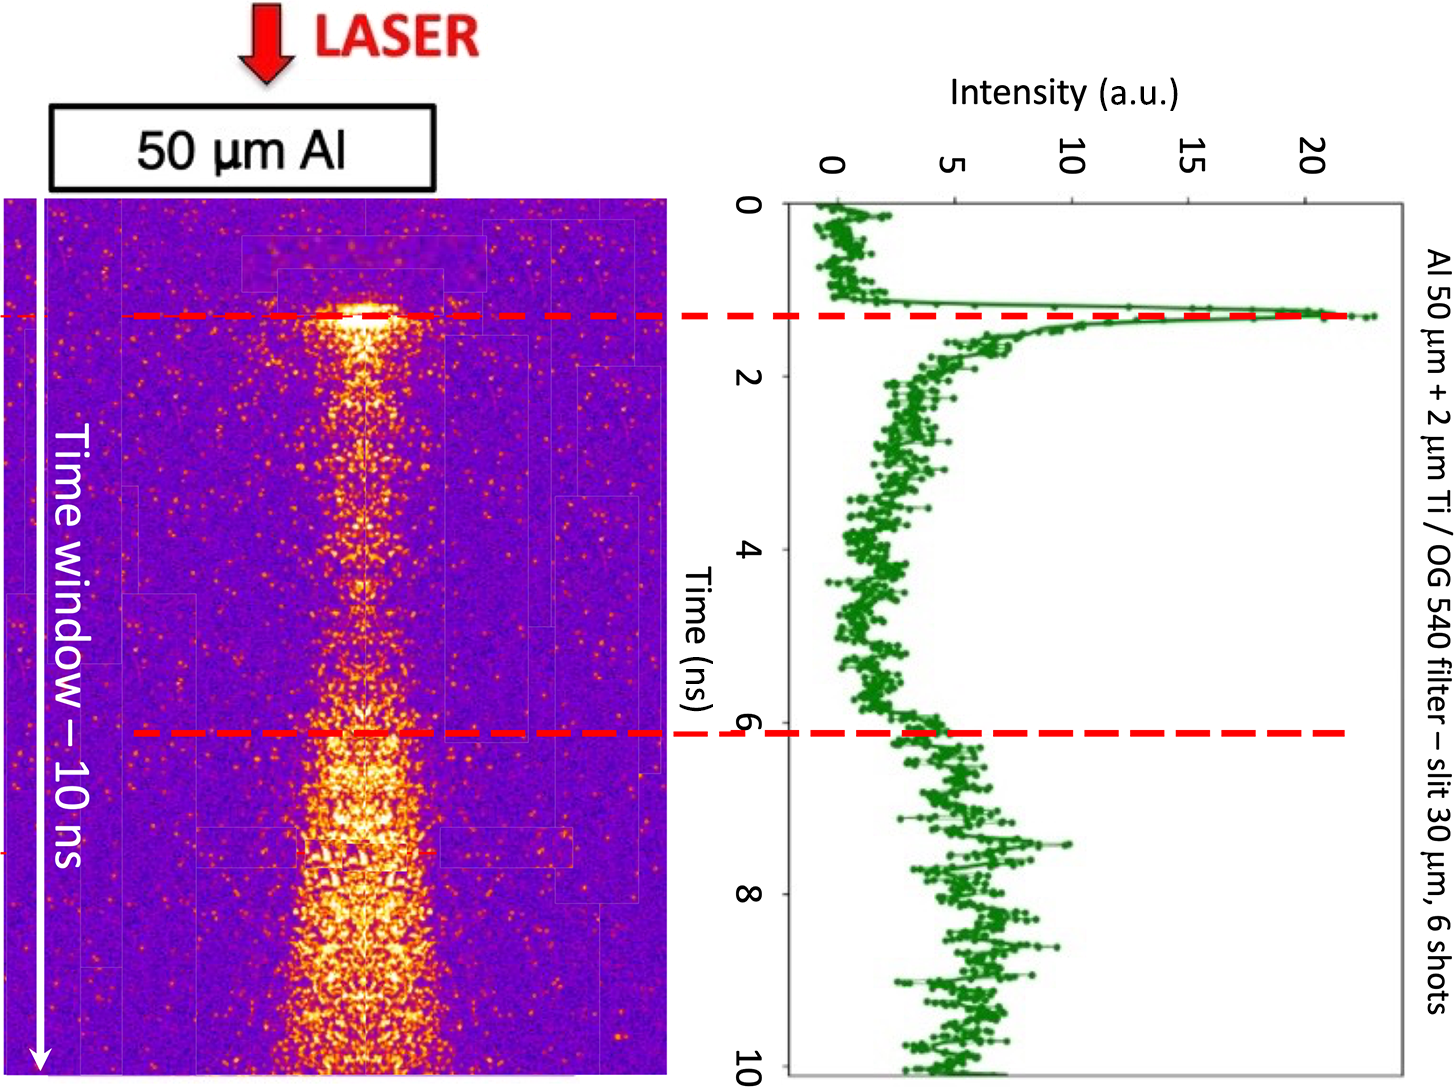
Figure 3 Self-emission signal recorded for foils of 50 μm Al + 2 μm Ti on the target rear side with an OG540 nm filter: (left) typical streak camera image (time window 10 ns) and (right) lineout of the signal (obtained from the average of six shots done in identical conditions).
As observed in previous experiments[ Reference Santos, Vauzour, Touati, Gremillet, Feugeas, Ceccotti, Bouillaud, Deneuville, Floquet, Fourment, Hadj-Bachir, Hulin, Morace, Nicolaï, d'Oliveira, Reau, Samaké, Tcherbakoff, Tikhonchuk, Veltcheva and Batani 14 , Reference Jakubowska, Batani, Feugeas, Forestier-Colleoni, Hulin, Nicolaï, Santos, Flacco, Vauzour and Malka 15 ], the recorded signal is characterized by three different phases. Firstly, we observe a rapid and bright emission peak (of duration determined by the streak camera temporal resolution). This is followed by a rapid decay and finally by a slower and longer increase of emissivity. The interpretation already given in previous works of such behavior is that the first emission is due to the fast arrival of HEs on the target rear side (considering the diagnostic resolution this is practically simultaneous to the laser arrival since some HEs need a time of less than 0.3 ps to cross even the thicker targets used in our experiment). Such HEs induce a significant heating of the target rear side, inducing thermal emission. They also produce emission due to the mechanism of OTR[ Reference Baton, Santos, Amiranoff, Popescu, Gremillet, Koenig, Martinolli, Guilbaud, Rousseaux, Le Gloahec, Hall, Batani, Perelli, Scianitti and Cowan 25 , Reference Popescu, Baton, Amiranoff, Rousseaux, Le Gloahec, Santos, Gremillet, Koenig, Martinolli, Hall, Adam, Heron and Batani 26 ]; however, in our conditions this is not dominant due to the low energy of the fast electrons produced at intensities of a couple of times 1019 W/cm2 and also due to the fact that OTR is centered at the harmonics of the irradiation laser light that was cut out by the filters before the streak camera. The subsequent decay is due to (adiabatic) expansion and cooling of the target. Finally, the later emission rise is due to the arrival of the blast wave generated in the target and the consequent heating of matter.
By increasing the target thickness, we see that the later emission is more and more delayed, coherent with the fact that the blast wave needs more time to cross the target. Figure 4 shows the ‘shock breakout time’ as measured at the half-rise of the later emission as a function of target thickness (only results obtained in Al targets are shown in this figure for consistency).
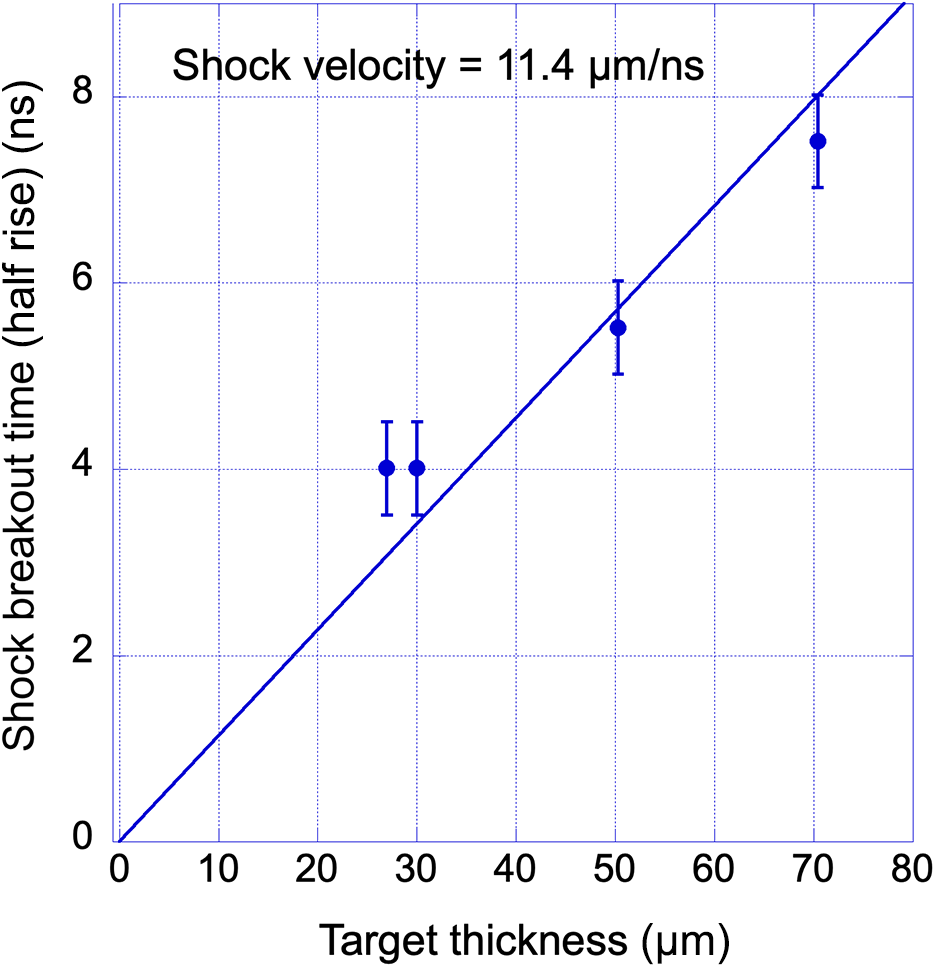
Figure 4 ‘Shock breakout time’ as measured at the half-rise of the later emission as a function of target thickness for Al targets only and linear interpolation.
The linear interpolation of data in Figure 4 provides a velocity of
 $\approx$
11.4 km/s. This is larger than the sound velocity in cold Al at normal density (c
s = 6.4 km/s), showing that the disturbance travels at supersonic velocity and suggesting indeed the presence of a shock wave. As we will see later, this is just the ‘apparent’ velocity since it has been calculated by assuming a constant target thickness. In reality, in our experiment the target is severely preheated and expands rapidly, and therefore the thickness increases with time which means that the real shock velocity is larger than the value just calculated.
$\approx$
11.4 km/s. This is larger than the sound velocity in cold Al at normal density (c
s = 6.4 km/s), showing that the disturbance travels at supersonic velocity and suggesting indeed the presence of a shock wave. As we will see later, this is just the ‘apparent’ velocity since it has been calculated by assuming a constant target thickness. In reality, in our experiment the target is severely preheated and expands rapidly, and therefore the thickness increases with time which means that the real shock velocity is larger than the value just calculated.
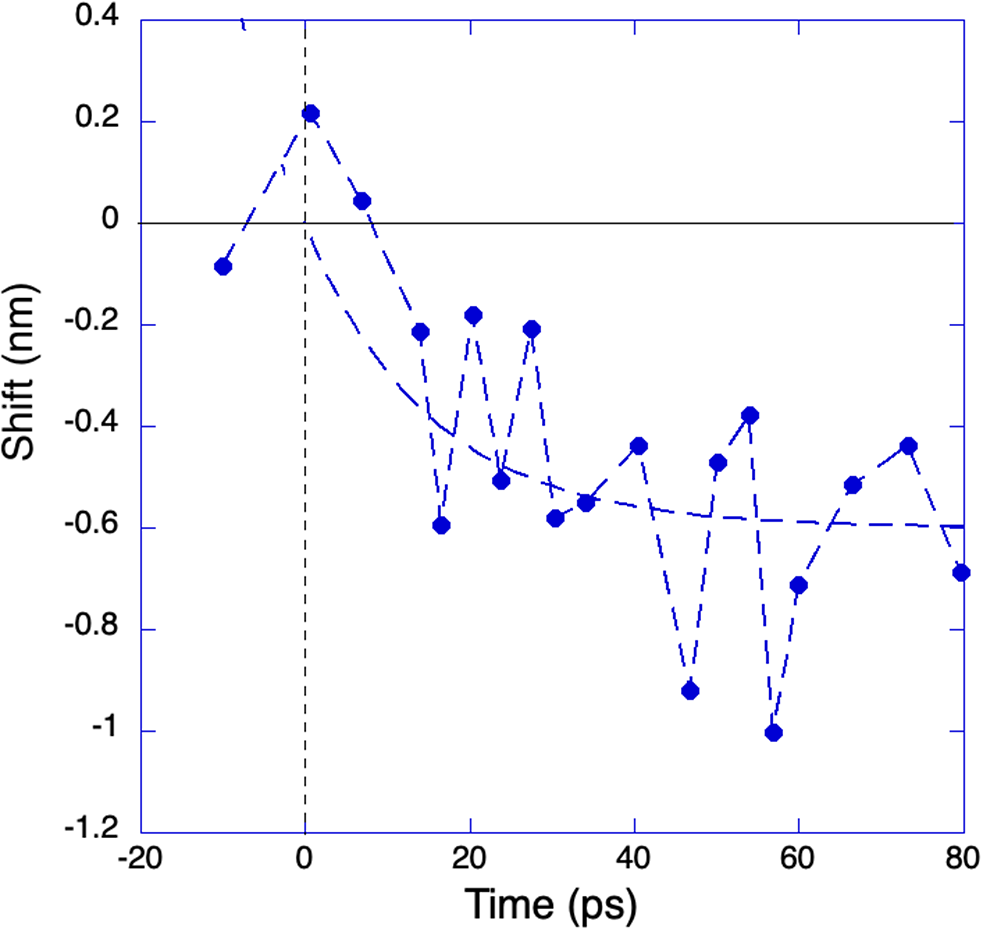
Figure 5 Measured Doppler shift versus time delay for a 30 μm Al target. The dashed line is a guide for the eyes.
4.2 Doppler velocimetry
Figure 5 shows a typical result of Doppler shift versus time obtained for a 30 μm Al target. The graph is obtained shot-by-shot by adjusting the probe beam delay and changing the target (this being destroyed at each laser shot). Despite each point in the graph being the average of three shots performed in the same nominal conditions, we observe large fluctuations in results. In this case, the average Doppler shift at times of more than 20 ps is Δλ ≈ 0.6 nm, or Δλ/λ ≈ 1.5
 $\times$
10–3. If we apply the usual formula for Doppler shift (Δλ/λ = 2v/c), this corresponds to a velocity v
$\times$
10–3. If we apply the usual formula for Doppler shift (Δλ/λ = 2v/c), this corresponds to a velocity v
 $\approx$
2.2
$\approx$
2.2
 $\times$
107 cm/s. The Doppler shift was also measured for 6 and 20 μm Al foils, essentially providing Doppler shift values within the same order of magnitude (within error bars).
$\times$
107 cm/s. The Doppler shift was also measured for 6 and 20 μm Al foils, essentially providing Doppler shift values within the same order of magnitude (within error bars).
4.3 Electron spectrometer
ES data were obtained with Al foils of thicknesses of 10 and 25 μm. No significant difference was seen between the two. In both cases we observe a two-temperature electron distribution function. If we use exponential functions to interpolate the data, we find a lower temperature of the order of 270 keV and a high-energy tail of the order of 1.4 MeV with 85% of HEs contained in the lower-energy exponential distribution (see Figure 6).
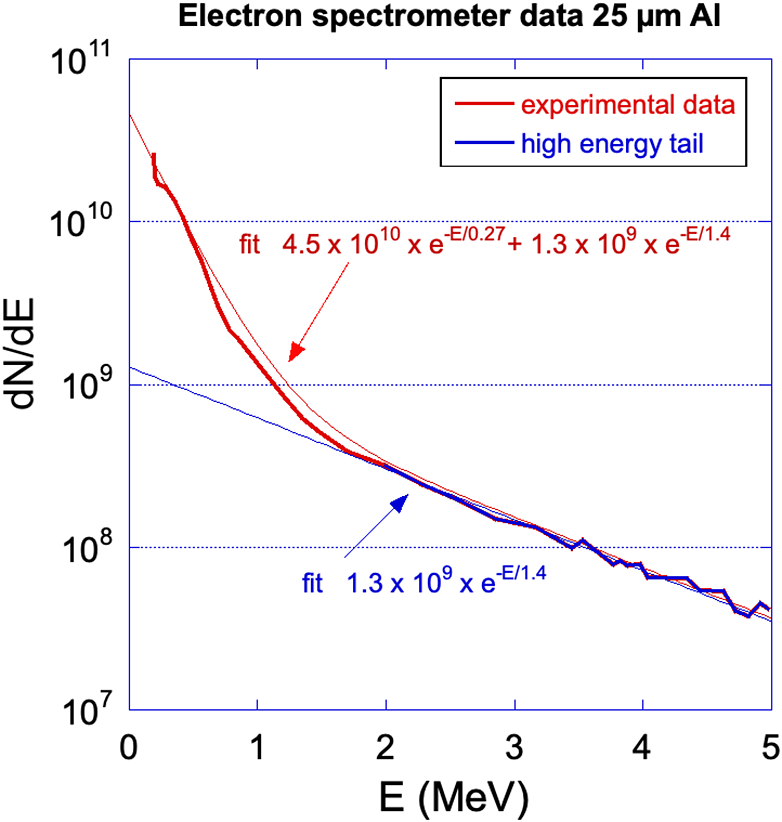
Figure 6 Results from the electron spectrometer for a 25 μm Al foil target (with 2 μm Ti).
We notice that the value of 1.4 MeV is in fair agreement with Wilks’ ponderomotive scaling[ Reference Wilks, Kruer, Tabak and Langdon 27 ]:
 $$\begin{align}{T}_{\mathrm{hot}}=511\; \mathrm{keV}\;\left[{\left(1+0.073\;{I}_{17}{\lambda}_{\mu\mathrm{m}}^2\right)}^{1/2}-1\right]\approx 1470\; \mathrm{keV}, \end{align}$$
where
 ${I}_{17}$
is the laser intensity in units of 1017 W/cm2.
${I}_{17}$
is the laser intensity in units of 1017 W/cm2.
4.4 Bremsstrahlung cannon
The signal recorded on the BSC for single laser shots was too weak to provide a reliable analysis. Therefore, we accumulated 10–15 shots on each imaging plate stack, using the same kind of targets. The signal was quite reproducible: samples obtained from series of shots with the same targets showed small variations.
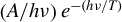
It is well known that the bremsstrahlung emission from an infinite, uniform and isotropic plasma with Maxwellian distribution of electrons at temperature T is characterized by a power emission (W/cm3) that is exponential with a slope given by exp(–hν/T), where hν is the photon energy and T corresponds to the electron temperature[ Reference Hutchinson 28 ]. This corresponds to a photon distribution function of the following type:
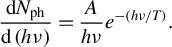 $$\begin{align}\frac{\mathrm{d}{N}_{\mathrm{ph}}}{\mathrm{d}\left( h\nu \right)}=\frac{A}{h\nu}{e}^{-\left( h\nu /T\right)}.\end{align}$$
We used such distribution to analyze our BSC data, even if of course this must be considered only as a first-order approximation for the case of a finite-size target, and especially when several layers of different materials are present. In order to avoid the divergence at low photon energies, we considered a low-energy cut-off at
 $h\nu$
= 10 keV. Indeed, this has no consequence on the analysis, since photons with lower energy are stopped by the first filters and cannot enter the BSC. Figure 7 shows the signal (in MeV/sr) deposited in each IP of the BSC for Al targets of thickness 25 μm together with the interpolation obtained with the above distribution function. The energy deposited in each IP is calculated using a semi-analytical approach that considers the absorption of each filter and the sensitivity of the IP. The best interpolation corresponds to T = 361.6 keV and A = 7.8
$h\nu$
= 10 keV. Indeed, this has no consequence on the analysis, since photons with lower energy are stopped by the first filters and cannot enter the BSC. Figure 7 shows the signal (in MeV/sr) deposited in each IP of the BSC for Al targets of thickness 25 μm together with the interpolation obtained with the above distribution function. The energy deposited in each IP is calculated using a semi-analytical approach that considers the absorption of each filter and the sensitivity of the IP. The best interpolation corresponds to T = 361.6 keV and A = 7.8
 $\times$
108 [Ph/sr].
$\times$
108 [Ph/sr].
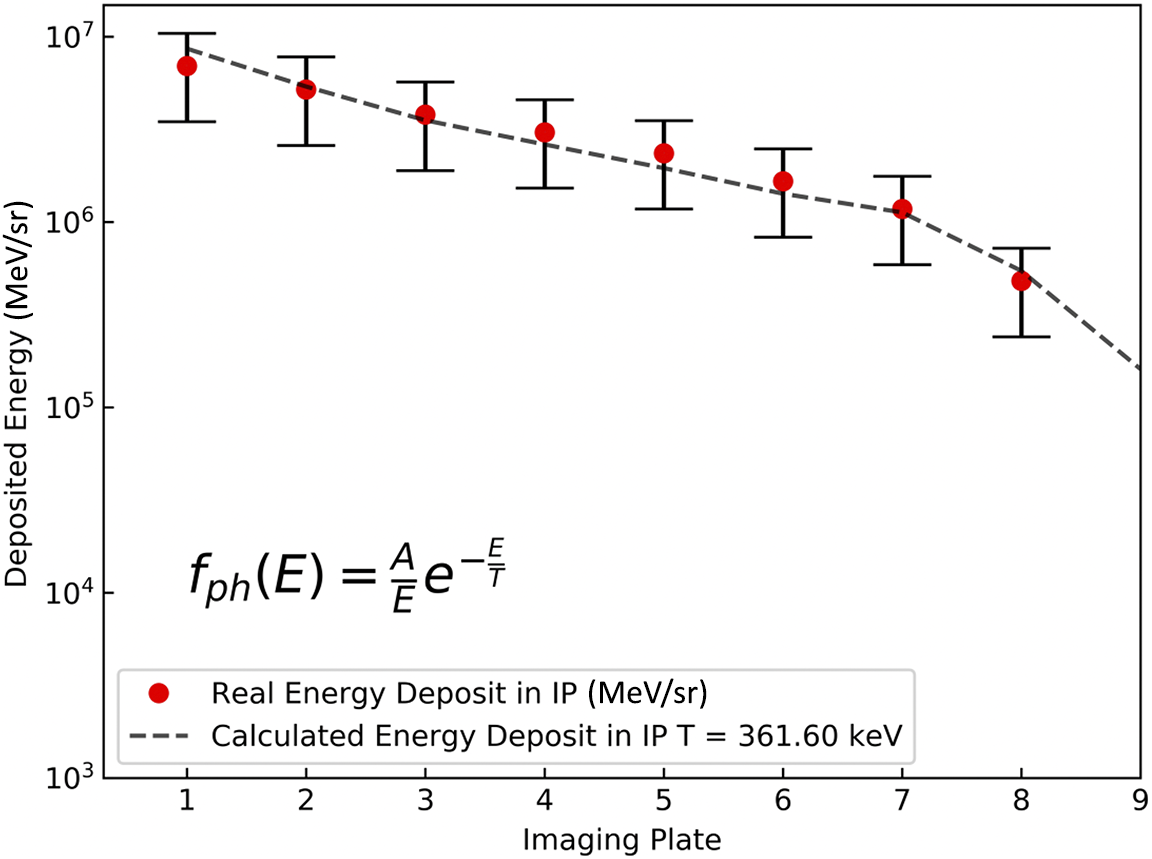
Figure 7 Results from the BSC and interpolation using the formula in the figure for the photon distribution.
The parameter
 $A$
is obviously related to the total number of emitted X-ray bremsstrahlung photons, and this can be directly put in relation to the number of HEs producing bremsstrahlung emission by calculating the HE density in the target volume:
$A$
is obviously related to the total number of emitted X-ray bremsstrahlung photons, and this can be directly put in relation to the number of HEs producing bremsstrahlung emission by calculating the HE density in the target volume:
 $$\begin{align}{P}_{\mathrm{Br}}=1.69\times {10}^{-32}{N}_{\mathrm{e}}{T}_{\mathrm{e}}^{1/2}\sum \left[{Z}^2N(Z)\right]\;\mathrm{W}/\mathrm{c}{\mathrm{m}}^3.\end{align}$$
The issue related to the analysis of BSC data is that, although the best couple of parameters (
 $A,T$
) can easily be found by minimizing errors, in reality there is a large set of nearby parameters that can acceptably reproduce the BSC data. This is discussed in detail by Tentori et al.
[
Reference Tentori, Colaitis, Theobald, Casner, Raffestin, Ruocco, Trela, Le Bel, Anderson, Wei, Henderson, Peebles, Scott, Baton, Pikuz, Betti, Khan, Woolsey, Zhang and Batani
29
].
$A,T$
) can easily be found by minimizing errors, in reality there is a large set of nearby parameters that can acceptably reproduce the BSC data. This is discussed in detail by Tentori et al.
[
Reference Tentori, Colaitis, Theobald, Casner, Raffestin, Ruocco, Trela, Le Bel, Anderson, Wei, Henderson, Peebles, Scott, Baton, Pikuz, Betti, Khan, Woolsey, Zhang and Batani
29
].
We introduce the reduced
 ${\chi}^2$
:
${\chi}^2$
:
 $$\begin{align}{\chi}^2=\frac{1}{\nu}\sum \limits_{k=1}^{N_{\mathrm{ip}}}\frac{{\left[{E}_{\mathrm{t}}(k)-{E}_{\mathrm{exp}}(k)\right]}^2}{\sigma_{\mathrm{exp}}^2(k)}.\end{align}$$
Here
 ${N}_{\mathrm{ip}}$
is the number of imaging plates,
${N}_{\mathrm{ip}}$
is the number of imaging plates,
 ${E}_{\mathrm{t}}(k)$
is the calculated deposited energy in the
${E}_{\mathrm{t}}(k)$
is the calculated deposited energy in the
 $k$
th IP (for a given couple of parameters
$k$
th IP (for a given couple of parameters
 $A$
and
$A$
and
 $T$
),
$T$
),
 ${E}_{\mathrm{exp}}(k)$
is the experimental one,
${E}_{\mathrm{exp}}(k)$
is the experimental one,
 $\nu$
is the number of degrees of freedom (here
$\nu$
is the number of degrees of freedom (here
 $\nu$
= 2) and
$\nu$
= 2) and
 ${\sigma}_{\mathrm{exp}}^2(k)$
is the variance of the experimental value. Here the experimental error was quite large (
${\sigma}_{\mathrm{exp}}^2(k)$
is the variance of the experimental value. Here the experimental error was quite large (
 $\approx$
50%) because the BSC was outside the chamber and quite far from the target. Therefore, the signal on the IPs was weak (only
$\approx$
50%) because the BSC was outside the chamber and quite far from the target. Therefore, the signal on the IPs was weak (only
 $\approx$
mPSL) and the standard deviation on the signal through the IPs was of the order of magnitude of the signal itself. With this, there is a large ensemble of possible values for the parameters
$\approx$
mPSL) and the standard deviation on the signal through the IPs was of the order of magnitude of the signal itself. With this, there is a large ensemble of possible values for the parameters
 $A$
and
$A$
and
 $T$
that lead to
$T$
that lead to
 ${\chi}^2$
→ 1. This is shown in Figure 8.
${\chi}^2$
→ 1. This is shown in Figure 8.
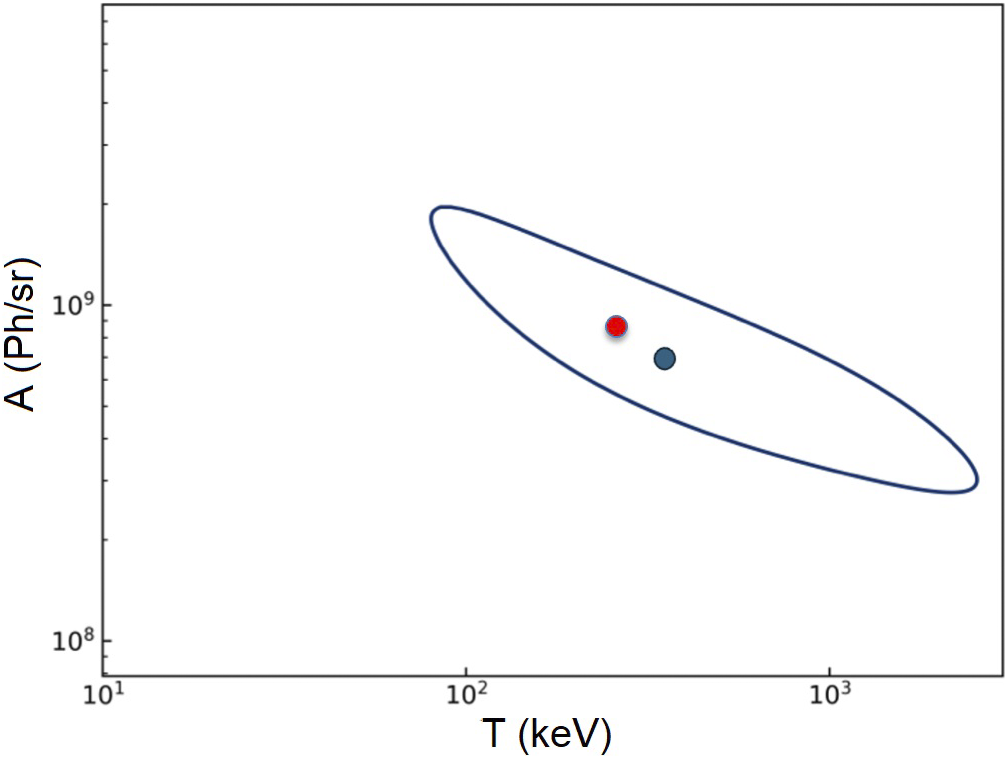
Figure 8 Contours of parameters (
 $A,T$
) leading to a reduced χ2 = 1 in the analysis of data from the BSC obtained with a 25 μm target. The blue and red points correspond respectively to the best fit of BSC data (T = 361.6 keV and A = 7.8 × 10⁸) and to the use of the HE distribution from the ES (where A = 1.7 × 10⁹ and T = 270 keV).
$A,T$
) leading to a reduced χ2 = 1 in the analysis of data from the BSC obtained with a 25 μm target. The blue and red points correspond respectively to the best fit of BSC data (T = 361.6 keV and A = 7.8 × 10⁸) and to the use of the HE distribution from the ES (where A = 1.7 × 10⁹ and T = 270 keV).
In other words, this means that although the BSC diagnostic provides useful information about hard X-ray emission, when used alone it does not sufficiently constrain the distribution and the parameters (
 $A,T$
). In order to avoid such ambiguity, we have therefore chosen another approach, that is, we checked whether the HE distribution function experimentally determined with the ES is compatible with the BSC data.
$A,T$
). In order to avoid such ambiguity, we have therefore chosen another approach, that is, we checked whether the HE distribution function experimentally determined with the ES is compatible with the BSC data.
In order to do this, we have run Monte Carlo simulations using the code Geant4[
30
] in two steps. Firstly, the HE distribution has been injected in a simulation box reproducing the target and the emission of X-ray photons has been calculated. This is shown in Figure 9 (left) and it can be interpolated well with the function
 $\left(A/ h\nu \right){e}^{-\left( h\nu /T\right)}$
, where A = 1.7
$\left(A/ h\nu \right){e}^{-\left( h\nu /T\right)}$
, where A = 1.7
 $\times$
109 and T = 130 keV.
$\times$
109 and T = 130 keV.
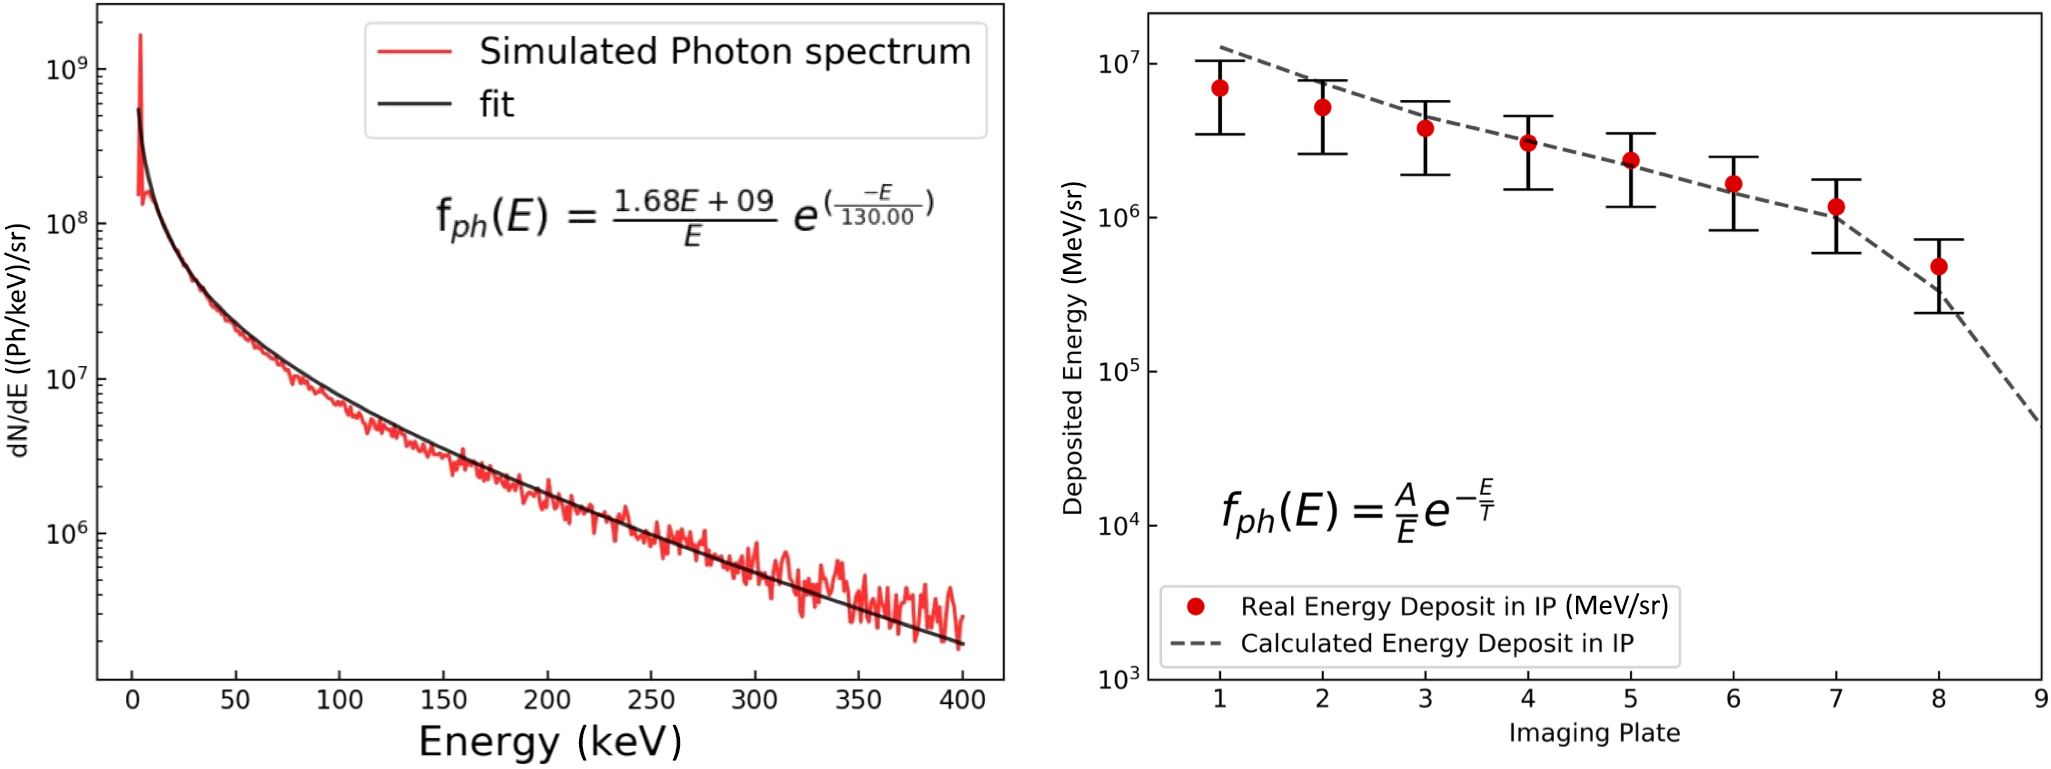
Figure 9 (Left) Photon distribution obtained from Geant4 by injecting the two-temperature hot electron distribution measured with the electron spectrometer in the target (Al 25 μm) and calculating the produced bremsstrahlung emission. (Right) Calculation of BSC data with the photon distribution shown on the left.
Secondly, such X-ray photon distribution has been injected in a simulation box reproducing the BSC and the energy deposited in each IP has been calculated. The advantage of such a procedure is that in this way not only do we take into account filter absorption and IP sensitivity but also secondary processes, for example, the generation of secondary electrons by X-ray photons and their propagation and energy deposition within the BSC. Figure 9 (right) shows the results of such a procedure.
We see that the two-temperature HE distribution function measured with the ES allows one to reproduce the BSC data within reasonable error bars. So, in conclusion, considering the large errors and the low level of the signal, the BSC data agree with the results from the ES.
One should, however, be also aware of the limitations of such a procedure.
Firstly, the ES measures the distribution of HEs that are able to escape the target. Due to the self-generated electromagnetic field, most HEs cannot escape from the target into vacuum. This means that a priori the distribution of HEs inside the target (generating bremsstrahlung radiation) can be different from the distribution of HEs measured outside. Relating the two would imply modeling the electric field (for instance, as done by Schönlein et al. [ Reference Schönlein, Boutoux, Pikuz, Antonelli, Batani, Debayle, Franz, Giuffrida, Honrubia, Jacoby, Khaghani, Neumayer, Rosmej, Sakaki, Santos and Sauteray 5 ]), but we considered that this is outside the scope of the present paper given the compatibility of the measured HE distribution with the BSC data (as shown in Figure 9).
Secondly, one should also be aware that Monte Carlo codes like Geant4 allow one to simulate HE propagation in cold non-ionized matter, but they do not allow a description of the plasma state (in this respect we refer to the discussion contained in Refs. [Reference Tentori, Colaitis and Batani31,Reference Tentori, Colaitis and Batani32] and in the model developed there). Finally, the complex phenomena related to HE propagation, the generation of the strong electric and magnetic field and the presence of a return current from the background electrons in the material, are not taken into account.
4.5 Kirkpatrick–Baez microscope
The final missing element for characterizing the HE source is the divergence of the HE beam. Figure 10 shows an example of the typical K-α image (as already used by Stephens et al. [ Reference Stephens, Snavely, Aglitskiy, Amiranoff, Andersen, Batani, Baton, Cowan, Freeman, Hall, Hatchett, Hill, Key, King, Koch, Koenig, MacKinnon, Lancaster, Martinolli, Norreys, Perelli-Cippo, Le Gloahec, Rousseaux, Santos and Scianitti 33 ]) obtained with the KB microscope for an Al target with a Ti layer and the measured size as a function of target thickness. We see that the size of the rear-side region emitting X-rays is only weakly dependent on the target thickness. The dashed line corresponds to linear fit to experimental points.
The half-cone divergence
 $\Theta$
of the electron beam in the target can be estimated by assuming that the size of the HE source on the target front side is of the order of the laser focal spot. Then, referring to a 70 μm target:
$\Theta$
of the electron beam in the target can be estimated by assuming that the size of the HE source on the target front side is of the order of the laser focal spot. Then, referring to a 70 μm target:
 $$\begin{align}\mathrm{tan}\Theta \approx \frac{350-24}{2\times 70}=2.3\kern0.96em \Longrightarrow \Theta \approx 70{}^{\circ}.\end{align}$$
This is not too far from the estimation (
 $\Theta \approx 60{}^{\circ}$
) that can be obtained using the formula given by Green et al.
[
Reference Green, Ovchinnikov, Evans, Akli, Azechi, Beg, Bellei, Freeman, Habara, Heathcote, Key, King, Lancaster, Lopes, Ma, MacKinnon, Markey, McPhee, Najmudin, Nilson, Onofrei, Stephens, Takeda, Tanaka, Theobald, Tanimoto, Waugh, Van Woerkom, Woolsey, Zepf, Davies and Norreys
34
].
$\Theta \approx 60{}^{\circ}$
) that can be obtained using the formula given by Green et al.
[
Reference Green, Ovchinnikov, Evans, Akli, Azechi, Beg, Bellei, Freeman, Habara, Heathcote, Key, King, Lancaster, Lopes, Ma, MacKinnon, Markey, McPhee, Najmudin, Nilson, Onofrei, Stephens, Takeda, Tanaka, Theobald, Tanimoto, Waugh, Van Woerkom, Woolsey, Zepf, Davies and Norreys
34
].

Figure 10 (Left) K-α X-ray image. Image of the target rear side obtained with the KB microscope for a 30 μm Al target with a Ti final layer. (Right) Variation of measured K-α spot size with target foil thickness (Al targets only).
5 Numerical simulations
In order to reproduce our experimental data, we needed to implement a simulation chain using different codes:
-
(i) we used the radiation hydrodynamic code FLASH[ Reference Dubey, Antypas, Calder, Daley, Fryxell, Gallagher, Lamb, Lee, Olson, Reid, Rich, Ricker, Riley, Rosner, Siegel, Taylor, Weide, Timmes, Vladimirova and ZuHone 35 ] to simulate the formation of a pre-plasma due to the pre-pulse of the VEGA laser;
-
(ii) we used the PIC code SMILEI[ Reference Derouillat, Beck, Pérez, Vinci, Chiaramello, Grassi, Flé, Bouchard, Plotnikov, Aunai, Dargent, Riconda and Grech 36 ] to simulate the interaction of the main laser pulse with such pre-plasma and the generation of HEs;
-
(iii) we used the hybrid code AMORE[ Reference Touati, Feugeas, Nicolaï, Santos, Gremillet and Tikhonchuk 37 ] to simulate the propagation of HEs in the target and calculate the temperature profile created by energy deposition from HEs;
-
(iv) we used the radiation hydrodynamic code CHIC[ Reference Maire, Abgrall, Breil and Ovadia 38 ] to simulate the dynamics of the blast wave in the target and the expansion of the target due to the initial temperature profile created in the target.
Steps (i) and (ii) were meant to provide an additional validation of the HE source as determined experimentally. Step (iv) was meant to reproduce the results of shock chronometry and Doppler velocimetry using the initial temperature profile calculated in step (iii) as the initial condition of the hydrodynamics simulations.
5.1 Characterization of pre-plasma
In order to evaluate the extension and the parameters of the pre-plasma produced by the laser pedestal, we performed simulations using the code FLASH (a multi-physics bi-temperature monofluid plasma hydrodynamic Eulerian code). We used two-dimensional (2D) cylindrical geometry simulations and adopted a 10 ns long Gaussian laser pulse normally incident on target (thereby neglecting the 10° angle of incidence of the laser on target). We used the Ionmix tabulated multi-group opacities and equation of states (EOS) together with the Lee–More ion/electron equilibration time and conductivities that are provided by the FLASH code. We checked the aluminum EOS and multi-group opacities (ionization state, ion and electron pressure, internal energy and Rosseland opacities) by comparing the simulation results with the more resolved EOS and multi-group opacities obtained using PROPACEOS[ Reference MacFarlane, Golovkin, Woodruff and Quant 39 ] and the results were very similar.
The shock generated by the ASE laser pre-pulse, at intensity
 $\approx 4$
 $\times$
1011 W/cm2, has a maximum pressure of the order of 100 kbar (in fair agreement with known scaling laws[
Reference Lindl
40
]) and propagates inside the target inducing a compression of
$\times$
1011 W/cm2, has a maximum pressure of the order of 100 kbar (in fair agreement with known scaling laws[
Reference Lindl
40
]) and propagates inside the target inducing a compression of
 $\approx 4\times$
and breaking out on the rear side of a 20 μm Al target at t
$\approx 4\times$
and breaking out on the rear side of a 20 μm Al target at t
 $\approx$
8 ns. This excludes the possibility that the observed signal in Figure 3 is due to the breakout of the pedestal-induced shock. Indeed, this would break out about 6 ns after the observed signal (at t
$\approx$
8 ns. This excludes the possibility that the observed signal in Figure 3 is due to the breakout of the pedestal-induced shock. Indeed, this would break out about 6 ns after the observed signal (at t
 $\approx$
2 ns for 20 μm, as shown in Figure 4).
$\approx$
2 ns for 20 μm, as shown in Figure 4).
Therefore, the signal observed by the self-emission diagnostics cannot be ascribed to the laser prepulse. On the other hand, the interaction with the prepulse does modify the density and temperature profile in the target and should then be taken into account for the calculation of fast electron transport and energy deposition in the target.
FLASH results were used to calculate pre-plasma properties as initial conditions for PIC simulations of ultra-intense, short-pulse laser–plasma interaction, that is, to calculate the characteristics of the fast electron source. The simulations show that a pre-plasma is rapidly formed, with a density gradient length about the laser wavelength
 ${L}_{\mathrm{grad}}\sim \lambda$
= 800 nm, and whose front is expanding in vacuum at a velocity about 100 μm/ns (Figure 11). These pre-plasma conditions were then used to initialize the PIC simulation performed to deduce the distribution function of electrons accelerated by the main laser pulse inside the aluminum solid target.
${L}_{\mathrm{grad}}\sim \lambda$
= 800 nm, and whose front is expanding in vacuum at a velocity about 100 μm/ns (Figure 11). These pre-plasma conditions were then used to initialize the PIC simulation performed to deduce the distribution function of electrons accelerated by the main laser pulse inside the aluminum solid target.

Figure 11 Interaction of the laser prepulse with a 20 μm Al foil target. The laser is a 10 ns long Gaussian laser pulse of 5.89 μm FWHM and power P = 1.1 × 10⁵ W. (Left) 2D density profile in log scale at time t = 5.05 ns. (Right) Density profile along the laser axis (r = 0) showing that the shock has roughly crossed half of the target thickness (the initial target front side position corresponds to z = 30 μm).
5.2 Characterization of the hot electron source
A series of simulations was performed to reproduce and validate the data obtained in the experimental characterization of the HE source. In order to allow for a reasonable computational time while accounting for the large pre-formed pre-plasma, simulations were performed in 1D-3V geometry with the PIC code SMILEI[
Reference Derouillat, Beck, Pérez, Vinci, Chiaramello, Grassi, Flé, Bouchard, Plotnikov, Aunai, Dargent, Riconda and Grech
36
]. In the PIC simulation, the laser pulse is normally incident on the target. The target is composed of pure aluminum with an initial ion density of
 ${n}_{\mathrm{i}}$
= 6
${n}_{\mathrm{i}}$
= 6
 $\times$
1022 cm−3 = 34.35
$\times$
1022 cm−3 = 34.35
 ${n}_{\mathrm{c}}$
, where
${n}_{\mathrm{c}}$
, where
 ${n}_{\mathrm{c}}$
is the critical density for
${n}_{\mathrm{c}}$
is the critical density for
 $\lambda =0.8\;\mu \mathrm{m}$
, with a thickness of d = 3 μm. The target is assumed to be initially in the plasma state, cold and fully ionized with an electron density
$\lambda =0.8\;\mu \mathrm{m}$
, with a thickness of d = 3 μm. The target is assumed to be initially in the plasma state, cold and fully ionized with an electron density
 ${n}_{\mathrm{e}}$
= 13
${n}_{\mathrm{e}}$
= 13
 ${n}_{\mathrm{i}}$
, four macro-ions per cell and 13
${n}_{\mathrm{i}}$
, four macro-ions per cell and 13
 $\times$
4 macro-electrons per cell, thus imposing the local electrical neutrality. A pre-plasma with density
$\times$
4 macro-electrons per cell, thus imposing the local electrical neutrality. A pre-plasma with density
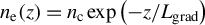 ${n}_{\mathrm{e}}(z)={n}_{\mathrm{c}}\exp \left(-z/{L}_{\mathrm{grad}}\right)$
with a density gradient length of
${n}_{\mathrm{e}}(z)={n}_{\mathrm{c}}\exp \left(-z/{L}_{\mathrm{grad}}\right)$
with a density gradient length of
 ${L}_{\mathrm{grad}}\sim \lambda$
= 800 nm, in agreement with the radiation hydrodynamic simulation, is also initialized from
${L}_{\mathrm{grad}}\sim \lambda$
= 800 nm, in agreement with the radiation hydrodynamic simulation, is also initialized from
 ${n}_{\mathrm{e}}$
 $=0.1{n}_{\mathrm{c}}$
up to
$=0.1{n}_{\mathrm{c}}$
up to
 ${n}_{\mathrm{e}}$
 $={n}_{\mathrm{c}}$
at the target front location
$={n}_{\mathrm{c}}$
at the target front location
 $z=0$
. The cell size is 10 times smaller than the main target plasma skin depth in each direction,
$z=0$
. The cell size is 10 times smaller than the main target plasma skin depth in each direction,
 $\Delta r=\Delta z=0.1\times c/{\omega}_{\mathrm{p}}$
. A time step
$\Delta r=\Delta z=0.1\times c/{\omega}_{\mathrm{p}}$
. A time step
 $\Delta t=0.9\Delta z$
/c, has been chosen according to the Courant–Friedrichs–Lewy stability criterion of the Yee solver used to compute Maxwell equations. The second-order B-spline macro-particle shape has been used to deposit the electrical charge of macro-particles onto the spatial grid, the second-order Esirkepov scheme has been used to deduce the electrical charge density and the second-order B-spline field interpolation functions have been used to deduce the electromagnetic fields at macro-particle center locations. A five-pass binomial filter has been applied to the current density in order to mitigate spatial aliasing. Finally, an absorbing boundary condition in the laser pulse propagation direction has been considered for a one-dimensional (1D) spatial simulation box of
$\Delta t=0.9\Delta z$
/c, has been chosen according to the Courant–Friedrichs–Lewy stability criterion of the Yee solver used to compute Maxwell equations. The second-order B-spline macro-particle shape has been used to deposit the electrical charge of macro-particles onto the spatial grid, the second-order Esirkepov scheme has been used to deduce the electrical charge density and the second-order B-spline field interpolation functions have been used to deduce the electromagnetic fields at macro-particle center locations. A five-pass binomial filter has been applied to the current density in order to mitigate spatial aliasing. Finally, an absorbing boundary condition in the laser pulse propagation direction has been considered for a one-dimensional (1D) spatial simulation box of
 ${L}_z$
 $\sim$
30 μm. Unlike in the experiment, the laser beam was assumed to be normally incident on the target.
$\sim$
30 μm. Unlike in the experiment, the laser beam was assumed to be normally incident on the target.
In agreement with the experimental data, the time averaged kinetic energy spectrum of accelerated electrons entering inside the target at 1 μm depth exhibits a bi-temperature shape similar to the one deduced from the ES, but with an HE tail temperature of 8 MeV. The calculated conversion efficiency from laser energy to HEs is
 $\eta \approx 50\%$
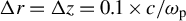
at the end of the main laser pulse. The time averaged angular distribution of the accelerated electrons is shown in Figure 12 and corresponds to a divergence of
$\eta \approx 50\%$
at the end of the main laser pulse. The time averaged angular distribution of the accelerated electrons is shown in Figure 12 and corresponds to a divergence of
 $\Theta \approx 60{}^{\circ}$
.
$\Theta \approx 60{}^{\circ}$
.
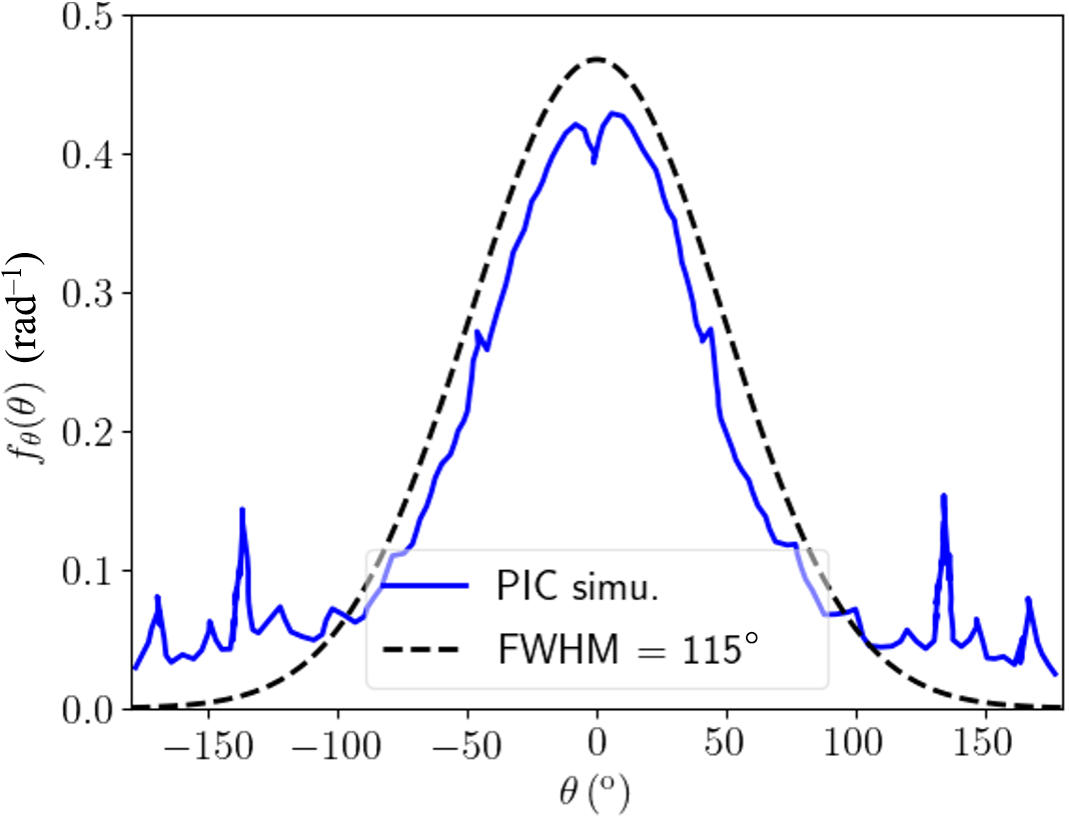
Figure 12 Time averaged angular distribution of accelerated electrons obtained from SMILEI simulations.
The simulations results are in fair agreement with the analytical estimates. As already seen (Section 4.3), the pondermotive scaling predictions are in fair agreement with what are measured using the ES. As for the angular divergence and the conversion efficiency, we used the formulas of Green et al. [ Reference Stephens, Snavely, Aglitskiy, Amiranoff, Andersen, Batani, Baton, Cowan, Freeman, Hall, Hatchett, Hill, Key, King, Koch, Koenig, MacKinnon, Lancaster, Martinolli, Norreys, Perelli-Cippo, Le Gloahec, Rousseaux, Santos and Scianitti 33 ] and Davies[ Reference Davies 41 ]:
 $$\begin{align}&{\theta}_{1/2}=1{5}^{{}^{\circ}}+3{0}^{{}^{\circ}}{\log}_{10}\left(\frac{I_{\mathrm{L}}}{10^{18}\ \mathrm{W}/\mathrm{c}{\mathrm{m}}^2}\right), \end{align}$$
$$\begin{align} &\eta ={\left(\frac{I_{\mathrm{L}}{\lambda}_{\mathrm{L}}^2}{I_0{\lambda}_0^2}\right)}^{\alpha },\nonumber \\&\quad\left\{\begin{array}{@{}c}{I}_0{\lambda}_0^2=3.37\times {10}^{20}\ (\mathrm{W}/\mathrm{c}{\mathrm{m}}^2)\ {\mu \mathrm{m}}^2,\ \alpha =0.1958\left(\frac{n_{\mathrm{e}}}{\lambda_{\mathrm{L}}\nabla {n}_{\mathrm{e}}}\sim 1\right),\\ {}{I}_0{\lambda}_0^2=4.30\times {10}^{21}\ (\mathrm{W}/\mathrm{c}{\mathrm{m}}^2)\ {\mu \mathrm{m}}^2,\ \alpha =0.2661\left(\frac{n_{\mathrm{e}}}{\lambda_{\mathrm{L}}\nabla {n}_{\mathrm{e}}}\ll 1\right).\end{array}\right.\end{align}$$
$$\begin{align}&{\theta}_{1/2}=1{5}^{{}^{\circ}}+3{0}^{{}^{\circ}}{\log}_{10}\left(\frac{I_{\mathrm{L}}}{10^{18}\ \mathrm{W}/\mathrm{c}{\mathrm{m}}^2}\right), \end{align}$$
$$\begin{align} &\eta ={\left(\frac{I_{\mathrm{L}}{\lambda}_{\mathrm{L}}^2}{I_0{\lambda}_0^2}\right)}^{\alpha },\nonumber \\&\quad\left\{\begin{array}{@{}c}{I}_0{\lambda}_0^2=3.37\times {10}^{20}\ (\mathrm{W}/\mathrm{c}{\mathrm{m}}^2)\ {\mu \mathrm{m}}^2,\ \alpha =0.1958\left(\frac{n_{\mathrm{e}}}{\lambda_{\mathrm{L}}\nabla {n}_{\mathrm{e}}}\sim 1\right),\\ {}{I}_0{\lambda}_0^2=4.30\times {10}^{21}\ (\mathrm{W}/\mathrm{c}{\mathrm{m}}^2)\ {\mu \mathrm{m}}^2,\ \alpha =0.2661\left(\frac{n_{\mathrm{e}}}{\lambda_{\mathrm{L}}\nabla {n}_{\mathrm{e}}}\ll 1\right).\end{array}\right.\end{align}$$
which, for a peak intensity
 $\approx$
3 × 10¹⁹ W/cm2, provides
$\approx$
3 × 10¹⁹ W/cm2, provides
 $\Theta \approx 60{}^{\circ}$
(against
$\Theta \approx 60{}^{\circ}$
(against
 $\Theta \approx 70{}^{\circ}$
inferred from KB measurements and 60° from PIC simulations) and
$\Theta \approx 70{}^{\circ}$
inferred from KB measurements and 60° from PIC simulations) and
 $\eta \approx 57\%$
(against 50% from simulations).
$\eta \approx 57\%$
(against 50% from simulations).
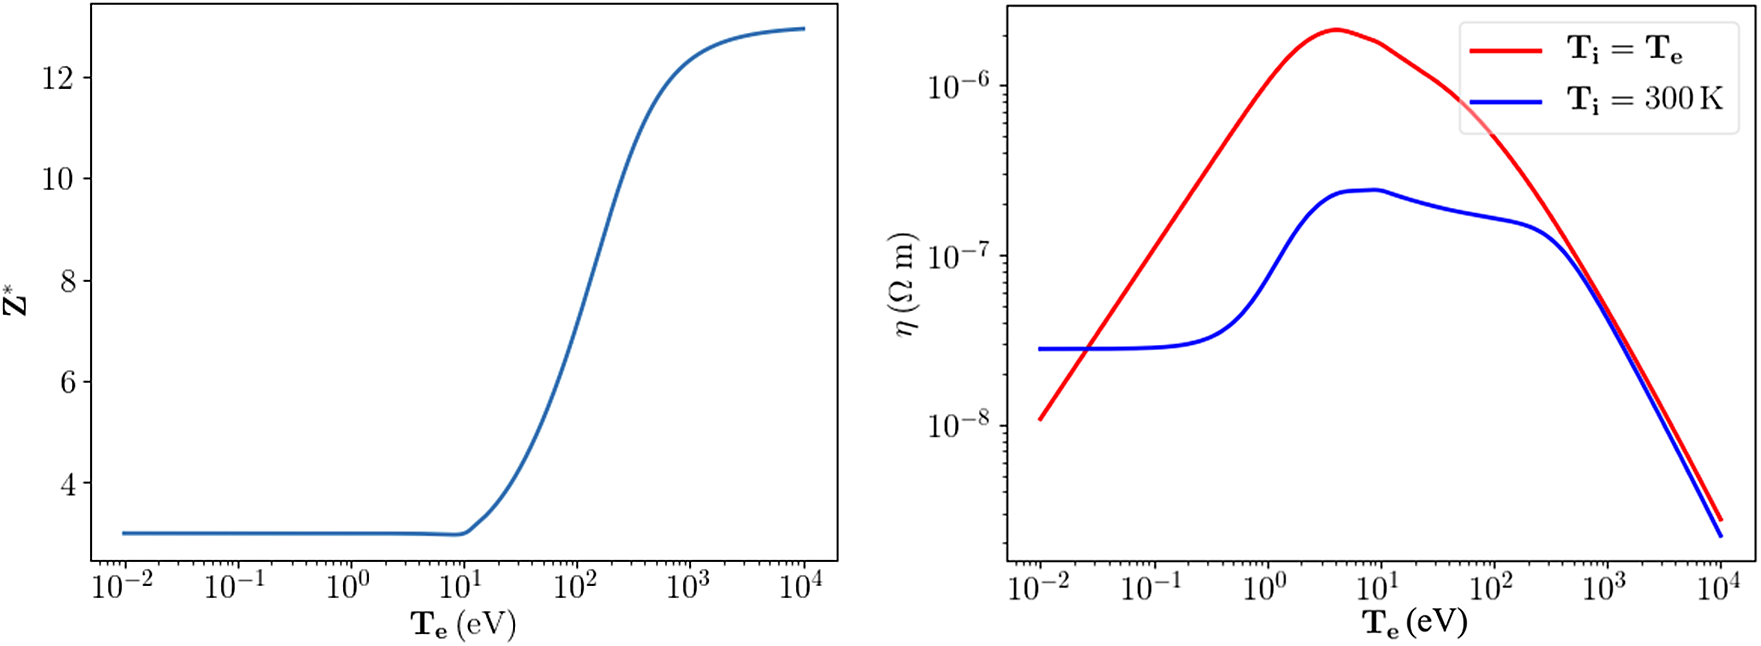
Figure 13 Ionization degree (left) and electrical resistivity (right) of Al versus temperature at solid-state density, as used in the code AMORE.

Figure 14 Hybrid simulations showing the heating of the target as a function of time, due to the propagation of the fast electron beam in a 70-μm thick Al target. Hot electron recirculation at the target rear side is taken into account. At 400 fs we clearly see the presence of a second heating front coming back into the target.
5.3 Hot electron energy deposition and initial temperature profile in the target
PIC codes do not allow for simulating correctly the transport of the electrons inside the target. Indeed, the target is not initially in the plasma state but rather in the solid state and, depending on the deposit, its phase goes from the solid state to the plasma state, passing through liquid and warm dense matter states. In addition, the PIC method does not account correctly for collisions, which are a key factor to model correctly the ohmic heating of the target by the induced electron return current, and the collisional losses of laser-accelerated electrons. Therefore, the propagation of fast electrons and energy deposition in the Al target have been simulated using a hybrid VFP code[ Reference Touati, Feugeas, Nicolaï, Santos, Gremillet and Tikhonchuk 37 ]. This takes into account the realistic behavior of the aluminum material versus temperature and density[ Reference Eidmann, Meyer-ter-Vehn, Schlegel and Hüller 42 ]. For instance, Figure 13 shows the ionization degree of Al and the resistivity as calculated and used in simulations.
Figure 14 shows the heating in the bulk of the material due to the propagation of the fast electron beam in a 70-μm thick Al target. The front of the fast electron beam travels at velocity c
[
Reference Gremillet, Amiranoff, Baton, Gauthier, Koenig, Martinolli, Pisani, Bonnaud, Lebourg, Rousseaux, Toupin, Antonicci, Batani, Bernardinello, Hall, Scott, Norreys, Bandulet and Pépin
43
], and reaches the target rear side at time
 $t=d/c=70\;\mu \mathrm{m}/\left(3\times {10}^{10}\ \mathrm{cm}/\mathrm{s}\right)\approx 250\; \mathrm{fs}.$
After that time electrons recirculate into the target. At 400 fs we clearly see the presence of a second heating front coming back into the target. This reaches the target front side at
$t=d/c=70\;\mu \mathrm{m}/\left(3\times {10}^{10}\ \mathrm{cm}/\mathrm{s}\right)\approx 250\; \mathrm{fs}.$
After that time electrons recirculate into the target. At 400 fs we clearly see the presence of a second heating front coming back into the target. This reaches the target front side at
 $t\approx 500\;\mathrm{fs}$
. Figure 14 also shows that indeed most fast electrons, that is, the HE energy transport, travel at lower velocity.
$t\approx 500\;\mathrm{fs}$
. Figure 14 also shows that indeed most fast electrons, that is, the HE energy transport, travel at lower velocity.
In these simulations we used the experimental energy distribution compatible with the ES and BSC data (Figure 6) with
 $\Theta \approx 60{}^{\circ}$
and
$\Theta \approx 60{}^{\circ}$
and
 $\eta \approx$
50%, as explained in the end of the previous section.
$\eta \approx$
50%, as explained in the end of the previous section.
Figure 15 shows the temperature profile in the target at the end of the simulation
 $t\approx 600\;\mathrm{fs}$
. Close to the target rear side the recirculation of HEs partially balances the forward HE current, thereby reducing the need for a return current from background electrons in the material. Since such an ohmic return current is mainly responsible for target heating (through the resistive Joule effect), this implies a slight reduction of target heating, as shown in the small drop of temperature at the target rear side.
$t\approx 600\;\mathrm{fs}$
. Close to the target rear side the recirculation of HEs partially balances the forward HE current, thereby reducing the need for a return current from background electrons in the material. Since such an ohmic return current is mainly responsible for target heating (through the resistive Joule effect), this implies a slight reduction of target heating, as shown in the small drop of temperature at the target rear side.

Figure 15 Temperature profile in a 70 μm Al target following HE energy deposition.

Figure 16 Pressure evolution in a 30 μm Al target as a function of time (CHIC simulations). 2D plots taken respectively at 0.05, 0.45, 1.5, 2.5, 3.5 and 5 ns.
5.4 Hydrodynamics simulation of target expansion and blast wave dynamics
The temperature profile of Figure 15 is used as input for the hydrodynamic simulations performed using the hydrocode CHIC[ Reference Maire, Abgrall, Breil and Ovadia 38 ]. Figure 16 shows the results of hydrodynamics and pressure evolution for a 30 μm thick Al target at different times.
It clearly shows two simultaneously occurring phenomena: (i) the generation and propagation of the strong pressure wave and (ii) the expansion of the target rear side following the HE induced preheating (from Figure 15 we see that the temperature at the rear side of this thinner target of 30 μm is
 $\approx$
60 eV).
$\approx$
60 eV).
As seen from these simulations, the shock and above all the deformation of the target induced by preheating are quite non-planar. Indeed, this implies that the signal collected by the streak camera of the streak optical pyrometry (SOP – with low spatial resolution) is a spatial average of thermal emission from the target rear side. This explains the fact that the later emission rise in the SOP images, due to the arrival of the blast wave, is not characterized by a rapid and sharp increase of emissivity (as is common in laser-driven shock experiments, e.g., Koenig et al. [ Reference Koenig, Faral, Boudenne, Batani, Bossi and Benuzzi 21 ]), but is gradually increasing with time. Indeed, different regions of the shock front will break out at different times. In addition, due to the strong expansion induced by preheating, especially close to the target central axis, matter ahead of the shock front is in the plasma state and at a density rather lower than the initial solid density, thereby allowing the emission of the shock front to leak through and reach the SOP before the shock actually reaches the (expanded) target rear side.
We also see that the initial energy deposition produces a very large pressure (initially
 $\approx$
200 Mbar). Such a high-pressure wave has the characteristic of a blast wave, that is, a spatially thin shock front, as is clear from Figures 16(b)–16(d). As the blast wave propagates in matter, it gradually reduces its intensity. In Figure 16(b) the maximum pressure has already reduced to 65 Mbar and in Figure 16(c) to 48 Mbar.
$\approx$
200 Mbar). Such a high-pressure wave has the characteristic of a blast wave, that is, a spatially thin shock front, as is clear from Figures 16(b)–16(d). As the blast wave propagates in matter, it gradually reduces its intensity. In Figure 16(b) the maximum pressure has already reduced to 65 Mbar and in Figure 16(c) to 48 Mbar.
At the same time the figures show the effects of target expansion produced by the preheating from the HE energy deposition. The expansion of the target before the passage of the blast front produces a complex shock dynamic. The decrease in density contributes to producing a rapid decrease in pressure. In a decreasing density profile, a maintained shock will accelerate since P scales as ρ1/2, as can be obtained by applying the impedance mismatch principle[ Reference Teyssier, Ryutov and Remington 44 , Reference Batani, Balducci, Nazarov, Löwer, Hall, Koenig, Faral, Benuzzi and Temporal 45 ]. In our case, however, the pressure is not maintained causing, in contrast, a deceleration of the shock. This results in a shock velocity that is approximately constant (as already reported by Jakubowska et al. [ Reference Jakubowska, Batani, Feugeas, Forestier-Colleoni, Hulin, Nicolaï, Santos, Flacco, Vauzour and Malka 15 ]).
Also, we see that due to target decompression the blast wave structure is finally lost along the axis, bringing a more uniform and lower pressure front (Figures 16(e) and 16(f)). This is clear in Figure 17, which shows the pressure profiles on the axis at different times. In contrast to Figure 16 we see that the blast wave structure is maintained out of axis, which brings a sort of cylindrical high-pressure wave radially expanding inside the target accompanied by a strong rarefaction at the center (i.e., on axis).
Figure 17 Pressure profile in a 30 μm Al target along the central axis (r = 0) as a function of time.
5.5 Rear-side expansion and comparison with Doppler velocimetry
At this point, Doppler velocimetry is a key element of the experiment since it should measure the motion of the rear side of the target at early times due to the heating-induced expansion. This should be coherent with the value of temperature on the target rear side obtained from simulations.
The typical expansion velocity of a heated material is to the sound velocity, which in practical units reads as follows:
 $$\begin{align}{c}_{\mathrm{s}}\left(\mathrm{cm}/\mathrm{s}\right)=9.8\times {10}^5\;{\left(\frac{\gamma {Z}^{\ast }T\;\left(\mathrm{eV}\right)}{\mu}\right)}^{1/2},\end{align}$$
where
 ${Z}^{\ast }$
is the ionization degree of the material,
${Z}^{\ast }$
is the ionization degree of the material,
 $\mu$
is its mass number and
$\mu$
is its mass number and
 $\gamma$
is the adiabatic constant.
$\gamma$
is the adiabatic constant.
Figure 5 shows an average Doppler shift Δλ ≈ 0.6 nm. If we use the formula Δλ/λ = 2v/c, this corresponds to a velocity v
 $\approx$
2.2
$\approx$
2.2
 $\times$
107 cm/s. If we take this to be the sound velocity corresponding to an adiabatic expansion, we will get temperatures of the order of 500 eV, which are clearly not compatible with our other experimental results and all the analyses we have presented until now.
$\times$
107 cm/s. If we take this to be the sound velocity corresponding to an adiabatic expansion, we will get temperatures of the order of 500 eV, which are clearly not compatible with our other experimental results and all the analyses we have presented until now.
There are two aspects that explain this difference.
The first reason is the fact that the temperatures reached at very early times on target rear side (
 $T\ge 10\;\mathrm{eV}$
) are indeed sufficient to vaporize the material, producing plasma expansion. In the resulting plasma density profile, the incoming probe laser beam will be reflected at the critical density (
$T\ge 10\;\mathrm{eV}$
) are indeed sufficient to vaporize the material, producing plasma expansion. In the resulting plasma density profile, the incoming probe laser beam will be reflected at the critical density (
 ${n}_{\mathrm{c}}=6.7\times {10}^{21}\ {\mathrm{cm}}^{-3}$
for
${n}_{\mathrm{c}}=6.7\times {10}^{21}\ {\mathrm{cm}}^{-3}$
for
 $\lambda =405\;\mathrm{nm}$
), which is about two orders of magnitude smaller than the electronic density of solid-state Al (
$\lambda =405\;\mathrm{nm}$
), which is about two orders of magnitude smaller than the electronic density of solid-state Al (
 ${n}_{\mathrm{s}}\approx$
 $7.8\times {10}^{24}\ {\mathrm{cm}}^{-3}$
). If we assume, just as an example, an exponential self-similar plasma profile[
Reference Max, McKee and Mead
46
]:
$7.8\times {10}^{24}\ {\mathrm{cm}}^{-3}$
). If we assume, just as an example, an exponential self-similar plasma profile[
Reference Max, McKee and Mead
46
]:
 $$\begin{align}{n}_{\mathrm{e}}\left(z,t\right)={n}_{\mathrm{s}}\;\exp \left(-\frac{z}{c_{\mathrm{s}}t}\right),\kern1.08em v\left(z,t\right)={c}_{\mathrm{s}}+\frac{z}{t},\end{align}$$
and we solve for the velocity
 $v$
of a plasma layer with given density
$v$
of a plasma layer with given density
 ${n}_{\mathrm{e}}$
, then we find the following:
${n}_{\mathrm{e}}$
, then we find the following:
 $$\begin{align}v\left({n}_{\mathrm{e}}\right)={c}_{\mathrm{s}}\left(1-\mathit{\ln}\left(\frac{n_{\mathrm{e}}}{n_{\mathrm{s}}}\right)\right),\end{align}$$
in the reference frame of the solid density layer. Therefore, we see that
 $v\left({n}_{\mathrm{c}}\right)$
can be a factor of 4–6 larger than the sound velocity of the solid material (depending on its ionization degree). In reality this must be considered only as a rough estimation because it assumes a self-similar expansion, which might be only partially reflecting the reality.
$v\left({n}_{\mathrm{c}}\right)$
can be a factor of 4–6 larger than the sound velocity of the solid material (depending on its ionization degree). In reality this must be considered only as a rough estimation because it assumes a self-similar expansion, which might be only partially reflecting the reality.
The second reason is that indeed in the case of an expanding plasma, the Doppler shift has two contributions. The first one is connected with the motion of the turning point for the laser probe (i.e., the critical surface) and the other is relative to the flow of mass through this surface and therefore to the ablation rate. This conclusion was first derived in the pioneering work of Dewandre et al. [ Reference Dewandre, Albritton and Williams 47 ]. This was used in several other works[ Reference Young, Baldis and Estabrook 48 – Reference Labaune, Fabre, Michard and Briand 53 ]. Finally, for the case of normal incidence of a laser beam on target, the shift can be written as follows[ Reference Young, Baldis and Estabrook 48 ]:
 $$\begin{align}\frac{\Delta \lambda }{\lambda}=2\frac{c_{\mathrm{s}}}{c}\;\left(1-M\right),\end{align}$$
where
 $M$
is the Mach number corresponding to the motion of the critical surface (
$M$
is the Mach number corresponding to the motion of the critical surface (
 $M={V}_{\mathrm{c}}/{c}_{\mathrm{s}})$
and
$M={V}_{\mathrm{c}}/{c}_{\mathrm{s}})$
and
 ${c}_{\mathrm{s}}$
is the sound velocity corresponding to the flux of matter through the critical surface. In Ref. [Reference Young, Baldis and Estabrook48] the shift was measured on the target front side in experiments with plasmas produced with ns-lasers where the motion of the critical surface is towards the inside of the target and the flow of plasma is in the opposite direction. The first motion then produces a red shift while the plasma flow produces a blue shift, and the authors observed that in their experimental conditions, the red shift produced by the motion of the critical surface dominated the blue shift produced by plasma motion.
${c}_{\mathrm{s}}$
is the sound velocity corresponding to the flux of matter through the critical surface. In Ref. [Reference Young, Baldis and Estabrook48] the shift was measured on the target front side in experiments with plasmas produced with ns-lasers where the motion of the critical surface is towards the inside of the target and the flow of plasma is in the opposite direction. The first motion then produces a red shift while the plasma flow produces a blue shift, and the authors observed that in their experimental conditions, the red shift produced by the motion of the critical surface dominated the blue shift produced by plasma motion.
In our case instead the motion of the critical surface is in the direction of the laser beam, that is,
 $M<0$
in the formula
$\Delta \lambda/\lambda= 2(1-M)c_{\mathrm{s}}/c$
, and the two contributions add together to produce a larger blue shift.
$M<0$
in the formula
$\Delta \lambda/\lambda= 2(1-M)c_{\mathrm{s}}/c$
, and the two contributions add together to produce a larger blue shift.
Figure 18 shows the results of hydrodynamic simulations carried out with the code MULTI[
Reference Ramis, Schmalz and Meyer-Ter-Vehn
54
], showing the rear-side expansion of a 30 μm Al foil during the 100 ps following an instantaneous isochoric heating (as obtained from simulations of fast electron energy deposition). At zero-time, the foil is at solid density and the temperature follows the graph of Figure 15, giving a target rear-side temperature of
 $\approx$
60 eV. For Al, this corresponds to an ionization degree
$\approx$
60 eV. For Al, this corresponds to an ionization degree
 ${Z}^{\ast}\approx 6{-}7$
, and a sound velocity
${Z}^{\ast}\approx 6{-}7$
, and a sound velocity
 ${c}_{\mathrm{s}}\approx$
5
${c}_{\mathrm{s}}\approx$
5
 $\times$
106 cm/s. In the simulation, this is indeed the velocity at which the solid density layer moves backward inside the material due to plasma erosion (dashed line on the bottom left of Figure 18). The other dashed line shows the trajectory of the critical surface with a velocity
$\times$
106 cm/s. In the simulation, this is indeed the velocity at which the solid density layer moves backward inside the material due to plasma erosion (dashed line on the bottom left of Figure 18). The other dashed line shows the trajectory of the critical surface with a velocity
 $\approx$
9
$\approx$
9
 $\times$
106 cm/s. In the reference frame of the solid surface this becomes
$\times$
106 cm/s. In the reference frame of the solid surface this becomes
 $\approx$
1.4
$\approx$
1.4
 $\times$
107 cm/s since the solid density layer is moving in the opposite direction. This shows an amplification factor in velocity of the order of three, which is indeed not too far from the estimation obtained from the simple self-similar model.
$\times$
107 cm/s since the solid density layer is moving in the opposite direction. This shows an amplification factor in velocity of the order of three, which is indeed not too far from the estimation obtained from the simple self-similar model.
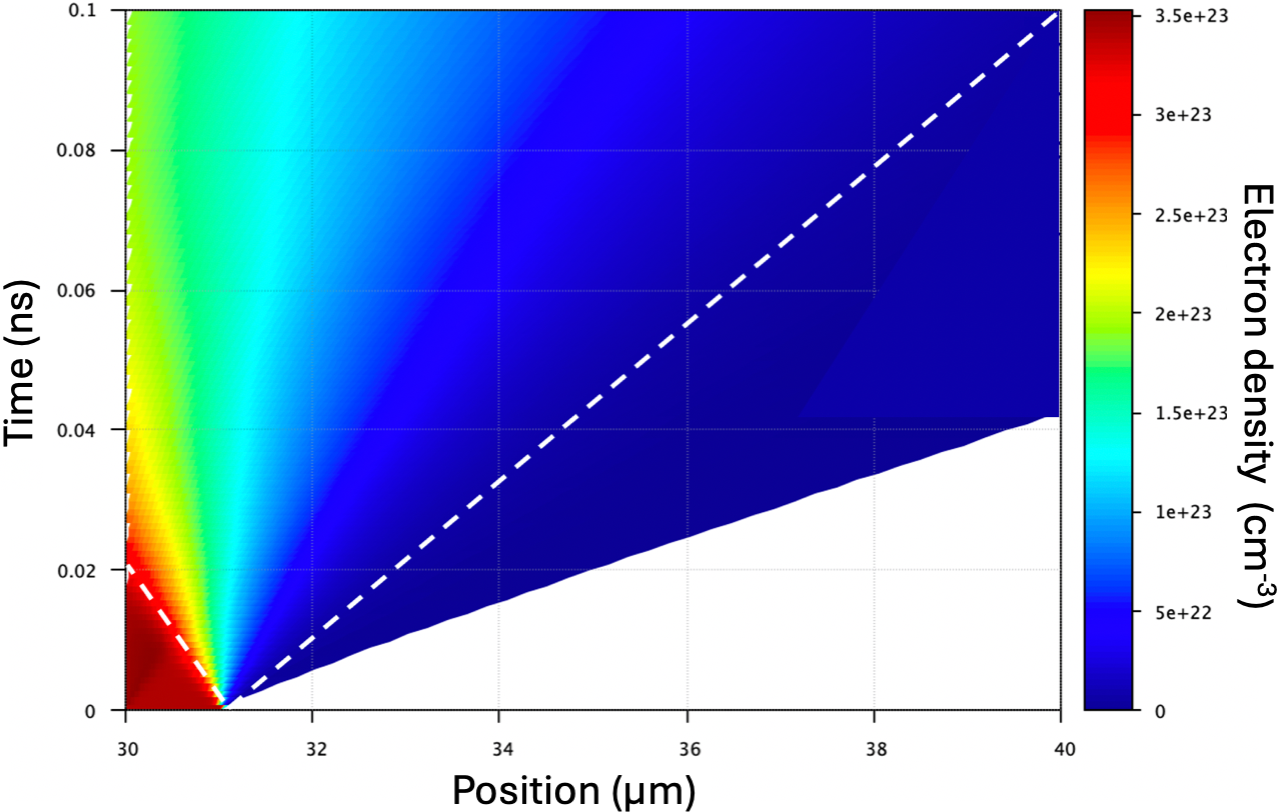
Figure 18 MULTI simulation of rear-side expansion of a 30 μm Al foil following an instantaneous isochoric heating producing a target rear-side temperature of
 $\approx$
60 eV. The left-hand bottom dashed line shows the trajectory of the solid density layer moving backward inside the material with velocity
$\approx$
60 eV. The left-hand bottom dashed line shows the trajectory of the solid density layer moving backward inside the material with velocity
 ${c}_{\mathrm{s}}\approx$
5
${c}_{\mathrm{s}}\approx$
5
 $\times$
106 cm/s. The right-hand dashed line shows the trajectory of the critical surface with velocity of
$\times$
106 cm/s. The right-hand dashed line shows the trajectory of the critical surface with velocity of
 $\approx$
9
$\approx$
9
 $\times$
106 cm/s.
$\times$
106 cm/s.
Finally, the critical surface velocity (9
 $\times$
106 cm/s) provides a shift:
$\times$
106 cm/s) provides a shift:
 $$\begin{align}\frac{\Delta \lambda }{\lambda}=2\frac{c_{\mathrm{s}}}{c}\;\left(1-M\right)=2\frac{c_{\mathrm{s}}}{c}\;\left(1-\frac{V_{\mathrm{c}}}{c_{\mathrm{s}}}\right)=2\frac{c_{\mathrm{s}}-{V}_{\mathrm{c}}}{c}\approx {10}^{-3},\end{align}$$
taking into account that
 ${V}_{\mathrm{c}}$
and
${V}_{\mathrm{c}}$
and
 ${c}_{\mathrm{s}}$
have different signs. This is quite close to the experimentally observed Doppler shift Δλ/λ ≈ 1.5
${c}_{\mathrm{s}}$
have different signs. This is quite close to the experimentally observed Doppler shift Δλ/λ ≈ 1.5
 $\times$
10–3.
$\times$
10–3.
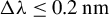
6 Red shift at very early times
Figure 5 shows a red shift in the reflected light at very early times,
 $\Delta \lambda \le 0.2\;\mathrm{nm}$
for t ≤ 10 ps. Although this shift is small and probably compatible with experimental error bars, there are indeed reasons to physically justify it in relation to the changes of the refractive index of the target rear side as the temperature of the aluminum increases. It is indeed well known that the light reflected from a metal undergoes a phase shift
$\Delta \lambda \le 0.2\;\mathrm{nm}$
for t ≤ 10 ps. Although this shift is small and probably compatible with experimental error bars, there are indeed reasons to physically justify it in relation to the changes of the refractive index of the target rear side as the temperature of the aluminum increases. It is indeed well known that the light reflected from a metal undergoes a phase shift
 ${\delta}_{\mathrm{r}}$
, which can be calculated starting from the complex refractive index of the material (i.e., from the dielectric function
${\delta}_{\mathrm{r}}$
, which can be calculated starting from the complex refractive index of the material (i.e., from the dielectric function
 $\epsilon )$
using Fresnel’s reflection coefficient[
Reference Landsberg
55
].
$\epsilon )$
using Fresnel’s reflection coefficient[
Reference Landsberg
55
].
The dielectric constant of a metal in the near-visible region can be expressed as follows:
 $$\begin{align}\epsilon ={\epsilon}_{\mathrm{r}}+{i\epsilon}_{\mathrm{i}}=\left|\epsilon \right|{e}^{i\theta}=1+\frac{i{\omega}_{\mathrm{p}}^2}{\omega \left({\nu}_{\mathrm{ei}}- i\omega \right)},\end{align}$$
where
 ${\nu}_{\mathrm{ei}}$
is the collision frequency and
${\nu}_{\mathrm{ei}}$
is the collision frequency and
 ${\omega}_{\mathrm{p}}$
the plasma frequency of the metal. In the non-collisional case (
${\omega}_{\mathrm{p}}$
the plasma frequency of the metal. In the non-collisional case (
 ${\nu}_{\mathrm{ei}}=0$
) we get the usual dielectric constant of an ideal plasma.
${\nu}_{\mathrm{ei}}=0$
) we get the usual dielectric constant of an ideal plasma.
By separation of the real and imaginary parts, we get the following:
 $$\begin{align}{\epsilon}_{\mathrm{r}}=1-\frac{\omega_{\mathrm{p}}^2}{{\nu}_{\mathrm{e}\mathrm{i}}^2+{\omega}^2},\kern3.599998em {\epsilon}_{\mathrm{i}}=\frac{\omega_{\mathrm{p}}^2{\nu}_{\mathrm{e}\mathrm{i}}}{\omega ({\nu}_{\mathrm{e}\mathrm{i}}^2+{\omega}^2)}. \end{align}$$
The refractive index is then as follows:
 $$\begin{align}n=\sqrt{\left|\epsilon \right|}{e}^{i\theta /2}=\sqrt{\left|\epsilon \right|}\;\cos \theta /2+i\sqrt{\left|\epsilon \right|}\;\sin \theta /2,\end{align}$$
and the reflectivity coefficient given by Fresnel’s relation for 0° incidence is as follows:
 $$\begin{align}R=\frac{1-n}{1+n}=\frac{\left(1-\sqrt{\left|\epsilon \right|}\;\cos \theta /2\right)+i\sqrt{\left|\epsilon \right|}\;\sin \theta /2}{\left(1+\sqrt{\left|\epsilon \right|}\;\cos \theta /2\right)+i\sqrt{\left|\epsilon \right|}\;\sin \theta /2}=\left|R\right|{e}^{i{\delta}_{\mathrm{r}}}.\end{align}$$
Let us notice that in our conditions, always
 ${\omega}_{\mathrm{p}}$
>
${\omega}_{\mathrm{p}}$
>
 $\omega$
while
$\omega$
while
 ${\nu}_{\mathrm{ei}}$
becomes larger than
${\nu}_{\mathrm{ei}}$
becomes larger than
 $\omega$
for T
$\omega$
for T
 $\approx$
1 eV. The graph shows the dephasing
$\approx$
1 eV. The graph shows the dephasing
 ${\delta}_{\mathrm{r}}$
for an aluminum plasma at constant solid density (i.e., making the approximation of fast ‘isochoric’ heating) as a function of temperature, assuming T
e = T
i. The quantities that depend on temperature here are the collision frequency
${\delta}_{\mathrm{r}}$
for an aluminum plasma at constant solid density (i.e., making the approximation of fast ‘isochoric’ heating) as a function of temperature, assuming T
e = T
i. The quantities that depend on temperature here are the collision frequency
 ${\nu}_{\mathrm{ei}}$
, for which we used the value given by Lee and More[
Reference Lee and More
56
], and the plasma frequency
${\nu}_{\mathrm{ei}}$
, for which we used the value given by Lee and More[
Reference Lee and More
56
], and the plasma frequency
 ${\omega}_{\mathrm{p}}$
. Here, for T = 0,
${\omega}_{\mathrm{p}}$
. Here, for T = 0,
 ${\omega}_{\mathrm{p}}$
takes into account the ‘free’ electrons in the conduction band (i.e., Z
* = 3 for Al) but it will increase when T increases (up to Z
* = 13). In order to perform a simple calculation, we have used the ionization formula by Colombant and Tonon[
Reference Colombant and Tonon
57
]:
${\omega}_{\mathrm{p}}$
takes into account the ‘free’ electrons in the conduction band (i.e., Z
* = 3 for Al) but it will increase when T increases (up to Z
* = 13). In order to perform a simple calculation, we have used the ionization formula by Colombant and Tonon[
Reference Colombant and Tonon
57
]:
 $$\begin{align}{Z}^{\ast }(T)=\frac{2}{3}{(AT)}^{1/3},\end{align}$$
where A is the atomic mass of the element (A = 27 for Al), and we have limited this formula by Z * = 3 at low temperatures and Z * = 13 at high temperatures.
From Figure 19 we see that at T = 0 our simple model fails to describe the real phase shift for the reflection on an Al surface, which is about 16° = 0.28 rad. This is probably due to an imprecise description of the collision frequency at low temperature, or other phenomena not included in this simple model and affecting reflection. In the range T
 $\approx$
40–60 eV, the model predicts shifts of
$\approx$
40–60 eV, the model predicts shifts of
 ${\delta}_{\mathrm{r}}\approx 50{}^{\circ}\approx$
0.9 rad. So, the difference in phase shift due to preheating of the Al rear side is
${\delta}_{\mathrm{r}}\approx 50{}^{\circ}\approx$
0.9 rad. So, the difference in phase shift due to preheating of the Al rear side is
 ${\delta \Delta}_{\mathrm{r}}\approx$
0.6 rad.
${\delta \Delta}_{\mathrm{r}}\approx$
0.6 rad.
Figure 19 Ionization degree and collision frequency in solid-state aluminum isochorically heated to a temperature T at solid-state density (2.7 g/cm3) and the resulting behavior of the phase shift (δr) in reflection of an electromagnetic wave (400 nm) at normal incidence on the surface.
The reflected phase is
 $\phi ={\phi}_{\mathrm{o}}+{\delta}_{\mathrm{r}}=\omega t={\omega}_{\mathrm{o}}t+\Delta \omega\;t,$
where
$\phi ={\phi}_{\mathrm{o}}+{\delta}_{\mathrm{r}}=\omega t={\omega}_{\mathrm{o}}t+\Delta \omega\;t,$
where
 ${\phi}_{\mathrm{o}}$
and
${\phi}_{\mathrm{o}}$
and
 ${\omega}_{\mathrm{o}}$
are the unperturbed laser phase and laser angular frequency, and
${\omega}_{\mathrm{o}}$
are the unperturbed laser phase and laser angular frequency, and
 $\omega$
and
$\omega$
and
 $\Delta \omega$
are the instantaneous frequency and the change in frequency, respectively. Then we have the following:
$\Delta \omega$
are the instantaneous frequency and the change in frequency, respectively. Then we have the following:
 $$\begin{align}\Delta \omega =\frac{\partial }{\partial t}{\delta}_{\mathrm{r}}.\end{align}$$
The shift in wavelength is given by the following:
 $$\begin{align}{\lambda}_{\mathrm{o}}+\Delta \lambda =\frac{2\pi c}{\omega_{\mathrm{o}}+\Delta \omega }.\end{align}$$
This is
 $$\begin{align}\Delta \lambda =\frac{2\pi c}{\omega_{\mathrm{o}}+\Delta \omega }-{\lambda}_{\mathrm{o}}=\frac{2\pi c}{\omega_{\mathrm{o}}+\Delta \omega }-\frac{2\pi c}{\omega_{\mathrm{o}}}\approx -\frac{2\pi c}{{\omega_{\mathrm{o}}}^2}\Delta \omega\end{align}$$
for small values of
 $\Delta \lambda$
and
$\Delta \lambda$
and
 $\Delta \omega$
(indeed
$\Delta \omega$
(indeed
 $\omega$
increases when
$\omega$
increases when
 $\lambda$
decreases). In the experiment
$\lambda$
decreases). In the experiment
 $\lambda \approx 400\;\mathrm{nm}$
and
$\lambda \approx 400\;\mathrm{nm}$
and
 $\Delta \lambda \approx 0.2\;\mathrm{nm}$
(at initial times), so the approximation holds.
$\Delta \lambda \approx 0.2\;\mathrm{nm}$
(at initial times), so the approximation holds.
In conclusion, we have the following:
 $$\begin{align}\Delta \lambda =-\frac{2\pi c}{{\omega_{\mathrm{o}}}^2}\Delta \omega =-\frac{2\pi c}{{\omega_{\mathrm{o}}}^2}\frac{\partial }{\partial t}{\delta}_{\mathrm{r}}.\end{align}$$
Now let us assume that due to the effects induced by HEs, the rear side of the target changes its temperature from 0 to 40 eV in a time
 $\Delta t$
. The change in wavelength would be as follows:
$\Delta t$
. The change in wavelength would be as follows:
 $$\begin{align}\Delta \lambda =-\frac{\lambda_{\mathrm{o}}}{\omega_{\mathrm{o}}}\frac{\partial }{\partial t}{\delta}_{\mathrm{r}}\approx -\frac{\lambda_{\mathrm{o}}}{\omega_{\mathrm{o}}}\frac{{\Delta \delta}_{\mathrm{r}}}{\Delta t}.\end{align}$$
Since
 ${\Delta \delta}_{\mathrm{r}}\approx$
0.6 rad,
${\Delta \delta}_{\mathrm{r}}\approx$
0.6 rad,
 ${\omega}_{\mathrm{o}}\approx 4.7\times {10}^{15}$
and
${\omega}_{\mathrm{o}}\approx 4.7\times {10}^{15}$
and
 ${\lambda}_{\mathrm{o}}$
= 400 nm, the heating time
${\lambda}_{\mathrm{o}}$
= 400 nm, the heating time
 $\Delta t$
needed to justify a shift of
$\Delta t$
needed to justify a shift of
 $\Delta \lambda \approx 0.2\;\mathrm{nm}$
would be less than 1 ps, which seems compatible with our experimental results.
$\Delta \lambda \approx 0.2\;\mathrm{nm}$
would be less than 1 ps, which seems compatible with our experimental results.
7 Conclusions
In this paper we have provided a full experimental and theoretical study of the generation of a blast wave in a solid target and of its optical properties: light emission as measured by the shock chronometry diagnostic and reflectivity as measured by Doppler velocimetry diagnostic. We also accurately characterized the HE source. A chain of detailed numerical simulations has allowed one to reproduce the characteristics of the HE source, and from this calculate a temperature profile inside the targets that provided the initial conditions in hydrodynamic simulation codes, allowing us to explain all observed optical experimental results.
We show that the temperature gradient generated in matter, by using a short-pulse high-intensity laser, can create blast waves with initial very strong pressures (≥100 Mbar) but also that these rapidly decrease to less than or equal to 1 Mbar at breakout.
The propagation dynamics of the blast wave is complex due to the competition with target expansion due to preheating. This brings an almost constant velocity of the blast wave. Also due to target decompression, the blast wave structure is lost along the axis and the pressure becomes lower and more uniform.
If we compare these results to those previously described by Jakubowska et al. [ Reference Jakubowska, Batani, Feugeas, Forestier-Colleoni, Hulin, Nicolaï, Santos, Flacco, Vauzour and Malka 15 ], we see that the initial pressures generated by HE deposition were larger at Laboratoire d'Optique Appliquée (LOA) (according to the simulation results, which reproduced the shock breakout data).
The main difference between the two experiments is due to the fact that at LOA the interaction produced fewer electrons at larger energy (the estimated temperature was about 1.9 MeV against 270 keV for the bulk of HEs in the present experiment). Also, the focal spot at LOA (i.e., the initial size of the HE source) was smaller, the diameter being only 4.3 μm. These facts combined to give a steeper temperature profile in the target (see Figure 4 in Ref. [Reference Jakubowska, Batani, Feugeas, Forestier-Colleoni, Hulin, Nicolaï, Santos, Flacco, Vauzour and Malka15]) with a rear-side temperature for a 60 μm Al target of only
 $\approx \mathrm{eV},$
against 20 eV in the present experiment. The steeper temperature gradient is more effective in producing a strong blast wave. This confirms the crucial role of the temperature gradient in the generation of the blast wave.
$\approx \mathrm{eV},$
against 20 eV in the present experiment. The steeper temperature gradient is more effective in producing a strong blast wave. This confirms the crucial role of the temperature gradient in the generation of the blast wave.
Also, in the LOA experiment the preheating was smaller and hence also the target rarefaction, which implies that in the present experiment the blast wave structure is ‘smoothed’ more quickly.
In conclusion, we have shown how by using relatively small, short-pulse high-intensity lasers it is possible to produce very strong pressures in the target and create HED states of matter that are fully characterized and confirmed by hydrodynamics calculations. This may open interesting perspectives in HED physics and also for laboratory astrophysics, since blast waves play an important role in several astrophysical phenomena.
Acknowledgements
This work has been carried out within the framework of the EUROfusion Consortium, funded by the European Union via the Euratom Research and Training Programme (Grant Agreement No. 101052200 – EUROfusion). Views and opinions expressed are however those of the author(s) only and do not necessarily reflect those of the European Union or the European Commission. Neither the European Union nor the European Commission can be held responsible for them. The involved teams have operated within the framework of the Enabling Research Project: ENR-IFE.01.CEA ‘Advancing shock ignition for direct-drive inertial fusion’.
GRK acknowledges partial support from a J. C. Bose Fellowship grant (JBR/2020/000039) from the Science and Engineering Board (SERB), Government of India.
ADL acknowledges partial support from the Infosys-TIFR Leading Edge Research Grant (Cycle 2).
Finally, we thank the Laser, Radioprotection, Engineering, TIC areas and Management divisions of the CLPU for their valuable support.


 Open access