


1. Introduction
The goal of inertial confinement fusion (ICF)[Reference Nuckolls, Wood, Thiessen and Zimmerman1–Reference Lindl3] is to implode a spherical target to achieve high compression of a cryogenic deuterium–tritium (DT) fuel layer and high temperature in the central hot spot to trigger ignition and produce significant thermonuclear energy gain. Hydrodynamic instabilities (including Rayleigh–Taylor and Richtmyer–Meshkov instabilities) and mix play a central role in the performance degradation of spherical implosions in ICF[Reference Atzeni and Meyer-ter-Vehn2, Reference Lindl3]. In recent high-compression experiments at the National Ignition Facility (NIF)[Reference Moses, Boyd, Remington, Keane and Al-Ayat4], the highest fuel areal densities ( ${\it\rho}R$) were achieved in implosions with ignition-relevant implosion velocities[Reference Edwards, Patel, Lindl, Atherton, Glenzer, Haan, Kilkenny, Landen, Moses, Nikroo, Petrasso, Sangster, Springer, Batha, Benedetti, Bernstein, Betti, Bleuel, Boehly, Bradley, Caggiano, Callahan, Celliers, Cerjan, Chen, Clark, Collins, Dewald, Divol, Dixit, Döppner, Edgell, Fair, Farrell, Fortner, Frenje, Gatu Johnson, Giraldez, Glebov, Grim, Hammel, Hamza, Harding, Hatchett, Hein, Herrmann, Hicks, Hinkel, Hoppe, Hsing, Izumi, Jacoby, Jones, Kalantar, Kauffman, Kline, Knauer, Koch, Kozioziemski, Kyrala, LaFortune, Le Pape, Leeper, Lerche, Ma, MacGowan, MacKinnon, Macphee, Mapoles, Marinak, Mauldin, McKenty, Meezan, Michel, Milovich, Moody, Moran, Munro, Olson, Opachich, Pak, Parham, Park, Ralph, Regan, Remington, Rinderknecht, Robey, Rosen, Ross, Salmonson, Sater, Schneider, Séguin, Sepke, Shaughnessy, Smalyuk, Spears, Stoeckl, Stoeffl, Suter, Thomas, Tommasini, Town, Weber, Wegner, Widman, Wilke, Wilson, Yeamans and Zylstra5, Reference Smalyuk, Döppner, Kline, Ma, Park, Atherton, Benedetti, Bionta, Bleuel, Bond, Bradley, Caggiano, Callahan, Casey, Celliers, Cerjan, Clark, Dewald, Dixit, Edgell, Frenje, Gatu-Johnson, Glebov, Glenn, Grim, Haan, Hammel, Hartouni, Hatarik, Hatchett, Hicks, Hsing, Izumi, Jones, Key, Khan, Kilkenny, Knauer, Kyrala, Landen, Le Pape, MacGowan, Mackinnon, MacPhee, McNaney, Meezan, Moody, Moore, Moran, Pak, Parham, Patel, Petrasso, Ralph, Regan, Remington, Robey, Ross, Spears, Springer, Suter, Tommasini, Town, Weber, Widmann, Lindl, Edwards, Glenzer and Moses6]. These key performance parameters were close to the goal of the ignition point design[Reference Haan, Lindl, Callahan, Clark, Salmonson, Hammel, Atherton, Cook, Edwards, Glenzer, Hamza, Hatchett, Herrmann, Hinkel, Ho, Huang, Jones, Kline, Kyrala, Landen, Macgowan, Marinak, Meyerhofer, Milovich, Moreno, Moses, Munro, Nikroo, Olson, Peterson, Pollaine, Ralph, Robey, Spears, Springer, Suter, Thomas, Town, Vesey, Weber, Wilkens and Wilson7], but the neutron yields were significantly reduced from expectations[Reference Edwards, Patel, Lindl, Atherton, Glenzer, Haan, Kilkenny, Landen, Moses, Nikroo, Petrasso, Sangster, Springer, Batha, Benedetti, Bernstein, Betti, Bleuel, Boehly, Bradley, Caggiano, Callahan, Celliers, Cerjan, Chen, Clark, Collins, Dewald, Divol, Dixit, Döppner, Edgell, Fair, Farrell, Fortner, Frenje, Gatu Johnson, Giraldez, Glebov, Grim, Hammel, Hamza, Harding, Hatchett, Hein, Herrmann, Hicks, Hinkel, Hoppe, Hsing, Izumi, Jacoby, Jones, Kalantar, Kauffman, Kline, Knauer, Koch, Kozioziemski, Kyrala, LaFortune, Le Pape, Leeper, Lerche, Ma, MacGowan, MacKinnon, Macphee, Mapoles, Marinak, Mauldin, McKenty, Meezan, Michel, Milovich, Moody, Moran, Munro, Olson, Opachich, Pak, Parham, Park, Ralph, Regan, Remington, Rinderknecht, Robey, Rosen, Ross, Salmonson, Sater, Schneider, Séguin, Sepke, Shaughnessy, Smalyuk, Spears, Stoeckl, Stoeffl, Suter, Thomas, Tommasini, Town, Weber, Wegner, Widman, Wilke, Wilson, Yeamans and Zylstra5, Reference Smalyuk, Döppner, Kline, Ma, Park, Atherton, Benedetti, Bionta, Bleuel, Bond, Bradley, Caggiano, Callahan, Casey, Celliers, Cerjan, Clark, Dewald, Dixit, Edgell, Frenje, Gatu-Johnson, Glebov, Glenn, Grim, Haan, Hammel, Hartouni, Hatarik, Hatchett, Hicks, Hsing, Izumi, Jones, Key, Khan, Kilkenny, Knauer, Kyrala, Landen, Le Pape, MacGowan, Mackinnon, MacPhee, McNaney, Meezan, Moody, Moore, Moran, Pak, Parham, Patel, Petrasso, Ralph, Regan, Remington, Robey, Ross, Spears, Springer, Suter, Tommasini, Town, Weber, Widmann, Lindl, Edwards, Glenzer and Moses6]. At the lowest yields, hydrodynamic instability growth had been large enough to mix ablator material into the hot spot, quenching the temperature by radiative cooling temperatures in these high-compression layered DT implosions[Reference Regan, Epstein, Hammel, Suter, Scott, Barrios, Bradley, Callahan, Cerjan, Collins, Dixit, Döppner, Edwards, Farley, Fournier, Glenn, Glenzer, Golovkin, Haan, Hamza, Hicks, Izumi, Jones, Kilkenny, Kline, Kyrala, Landen, Ma, MacFarlane, MacKinnon, Mancini, McCrory, Meezan, Meyerhofer, Nikroo, Park, Ralph, Remington, Sangster, Smalyuk, Springer and Town8, Reference Ma, Weber, Izumi, Springer, Patel, Key, Atherton, Benedetti, Bradley, Callahan, Celliers, Cerjan, Dewald, Dixit, Döppner, Edgell, Glenn, Grim, Haan, Hammel, Hicks, Hsing, Jones, Khan, Kilkenny, Kline, Kyrala, Landen, Le Pape, MacGowan, Mackinnon, MacPhee, Meezan, Moody, Pak, Parham, Park, Ralph, Regan, Remington, Robey, Ross, Spears, Smalyuk, Suter, Tommasini, Town, Lindl, Edwards, Glenzer and Moses9]. Several experimental platforms are thus being developed to measure and understand various aspects of instability growth and mix in ignition-relevant conditions at NIF. Recent experiments with the Hydrodynamic Growth Radiography (HGR) platform were used to study instability growth using large-amplitude, two-dimensional (2D) pre-imposed modulations[Reference Smalyuk, Casey, Clark, Edwards, Haan, Hamza, Hoover, Hsing, Hurricane, Kilkenny, Kroll, Landen, Moore, Nikroo, Pak, Peterson, Raman, Remington, Robey, Weber and Widmann10]. One of the key elements of the ICF programme at NIF is the development of the capability to measure instability growth of native 3D roughness that is present on the capsule surface as well as any residual 3D nonuniformities in the bulk of the shell. This paper describes the first experiments in which the 2D HGR platform was used to make measurements with 3D surface modulations in the acceleration phase of these implosions. The measurement of 3D modulations is more challenging than the measurement of large-amplitude 2D modulations. It requires a high signal-to-noise imaging system. This paper shows that a technique employing averaging of multiple pinhole images can provide an adequate signal-to noise ratio to measure ‘native-roughness’ modulations at ignition-relevant conditions at NIF.
The experimental configuration is described in Section 2. The details of image processing used in the experiments and simulations are shown in Sections 3 and 4, respectively. The discussion on experimental results is presented in Section 5 and the conclusions are presented in Section 6.
2. Experimental configuration
Figure 1 shows the experimental configuration used in the experiments. The configuration includes a Au hohlraum, a plastic (CH) capsule, a Au cone and an iron backlighter. It is very similar to the HGR platform used in earlier experiments to measure instability growth factors during inward capsule acceleration at NIF[Reference Smalyuk, Casey, Clark, Edwards, Haan, Hamza, Hoover, Hsing, Hurricane, Kilkenny, Kroll, Landen, Moore, Nikroo, Pak, Peterson, Raman, Remington, Robey, Weber and Widmann10]. The differences include the backlighter material (iron versus the previous vanadium or scandium) and a larger diagnostic window ( $850~{\rm\mu}\text{m}$ by
  $950~{\rm\mu}\text{m}$) made of high-density carbon (HDC) placed at the hohlraum wall. An additional
  $600\text{-}{\rm\mu}\text{m}$ square,
  $100\text{-}{\rm\mu}\text{m}$ thick Au aperture was placed at the HDC window to provide the optimum field of view for maximizing the number of gated images recorded and hence the photon statistics.

Figure 1. Experimental configuration schematically showing the target including Au hohlraum, CH capsule, Au cone and the iron backlighter. The gold cone provided a possibility for the backlighter x-rays to pass through a single wall of the shell.
The experiments were conducted with laser drives and conditions similar to those used in high-compression layered DT implosions (with ‘low-foot’ drive)[Reference Smalyuk, Döppner, Kline, Ma, Park, Atherton, Benedetti, Bionta, Bleuel, Bond, Bradley, Caggiano, Callahan, Casey, Celliers, Cerjan, Clark, Dewald, Dixit, Edgell, Frenje, Gatu-Johnson, Glebov, Glenn, Grim, Haan, Hammel, Hartouni, Hatarik, Hatchett, Hicks, Hsing, Izumi, Jones, Key, Khan, Kilkenny, Knauer, Kyrala, Landen, Le Pape, MacGowan, Mackinnon, MacPhee, McNaney, Meezan, Moody, Moore, Moran, Pak, Parham, Patel, Petrasso, Ralph, Regan, Remington, Robey, Ross, Spears, Springer, Suter, Tommasini, Town, Weber, Widmann, Lindl, Edwards, Glenzer and Moses6]. They were designed to test the acceleration phase hydrodynamic growth predictions used to model these DT layered implosions which achieved fuel areal densities of  ${\sim}1.2~\text{g}/\text{cm}^{2}$, peak fuel velocities of
  ${\sim}320{-}330~\text{km}/\text{s}$ and peak radiation temperatures of
  ${\sim}300~\text{eV}$[Reference Smalyuk, Döppner, Kline, Ma, Park, Atherton, Benedetti, Bionta, Bleuel, Bond, Bradley, Caggiano, Callahan, Casey, Celliers, Cerjan, Clark, Dewald, Dixit, Edgell, Frenje, Gatu-Johnson, Glebov, Glenn, Grim, Haan, Hammel, Hartouni, Hatarik, Hatchett, Hicks, Hsing, Izumi, Jones, Key, Khan, Kilkenny, Knauer, Kyrala, Landen, Le Pape, MacGowan, Mackinnon, MacPhee, McNaney, Meezan, Moody, Moore, Moran, Pak, Parham, Patel, Petrasso, Ralph, Regan, Remington, Robey, Ross, Spears, Springer, Suter, Tommasini, Town, Weber, Widmann, Lindl, Edwards, Glenzer and Moses6]. The nominal
  $209\text{-}{\rm\mu}\text{m}$ thick CH capsules with nominal
  $1120\text{-}{\rm\mu}\text{m}$ outer radii had the same Si-doped layers as used in the previous DT layered implosions and previously published in Ref. [Reference Smalyuk, Döppner, Kline, Ma, Park, Atherton, Benedetti, Bionta, Bleuel, Bond, Bradley, Caggiano, Callahan, Casey, Celliers, Cerjan, Clark, Dewald, Dixit, Edgell, Frenje, Gatu-Johnson, Glebov, Glenn, Grim, Haan, Hammel, Hartouni, Hatarik, Hatchett, Hicks, Hsing, Izumi, Jones, Key, Khan, Kilkenny, Knauer, Kyrala, Landen, Le Pape, MacGowan, Mackinnon, MacPhee, McNaney, Meezan, Moody, Moore, Moran, Pak, Parham, Patel, Petrasso, Ralph, Regan, Remington, Robey, Ross, Spears, Springer, Suter, Tommasini, Town, Weber, Widmann, Lindl, Edwards, Glenzer and Moses6]. These capsules used an extra
  $20\text{-}{\rm\mu}\text{m}$ thick CH layer to replace the
  $69\text{-}{\rm\mu}\text{m}$ thick DT ice layer, thus maintaining the same shell mass as in the layered DT implosions. Figure 2 shows the initial measured power spectrum of the capsule outer-surface roughness as a function of the mode number compared with the NIF specification used for the previous layered DT implosions. The initial surface roughness power (shown by the solid curve) was increased
  ${\sim}10$ times (corresponding to an r.m.s. amplitude increase of 3 to 4 times). This is compared with nominal capsule specifications (shown by the dashed curve) in the most relevant mode number range from
  ${\sim}10$ to 100. This makes measurements more sensitive for the initial technique qualification while still remaining in the relevant regime to study instability growth under ignition-relevant conditions.
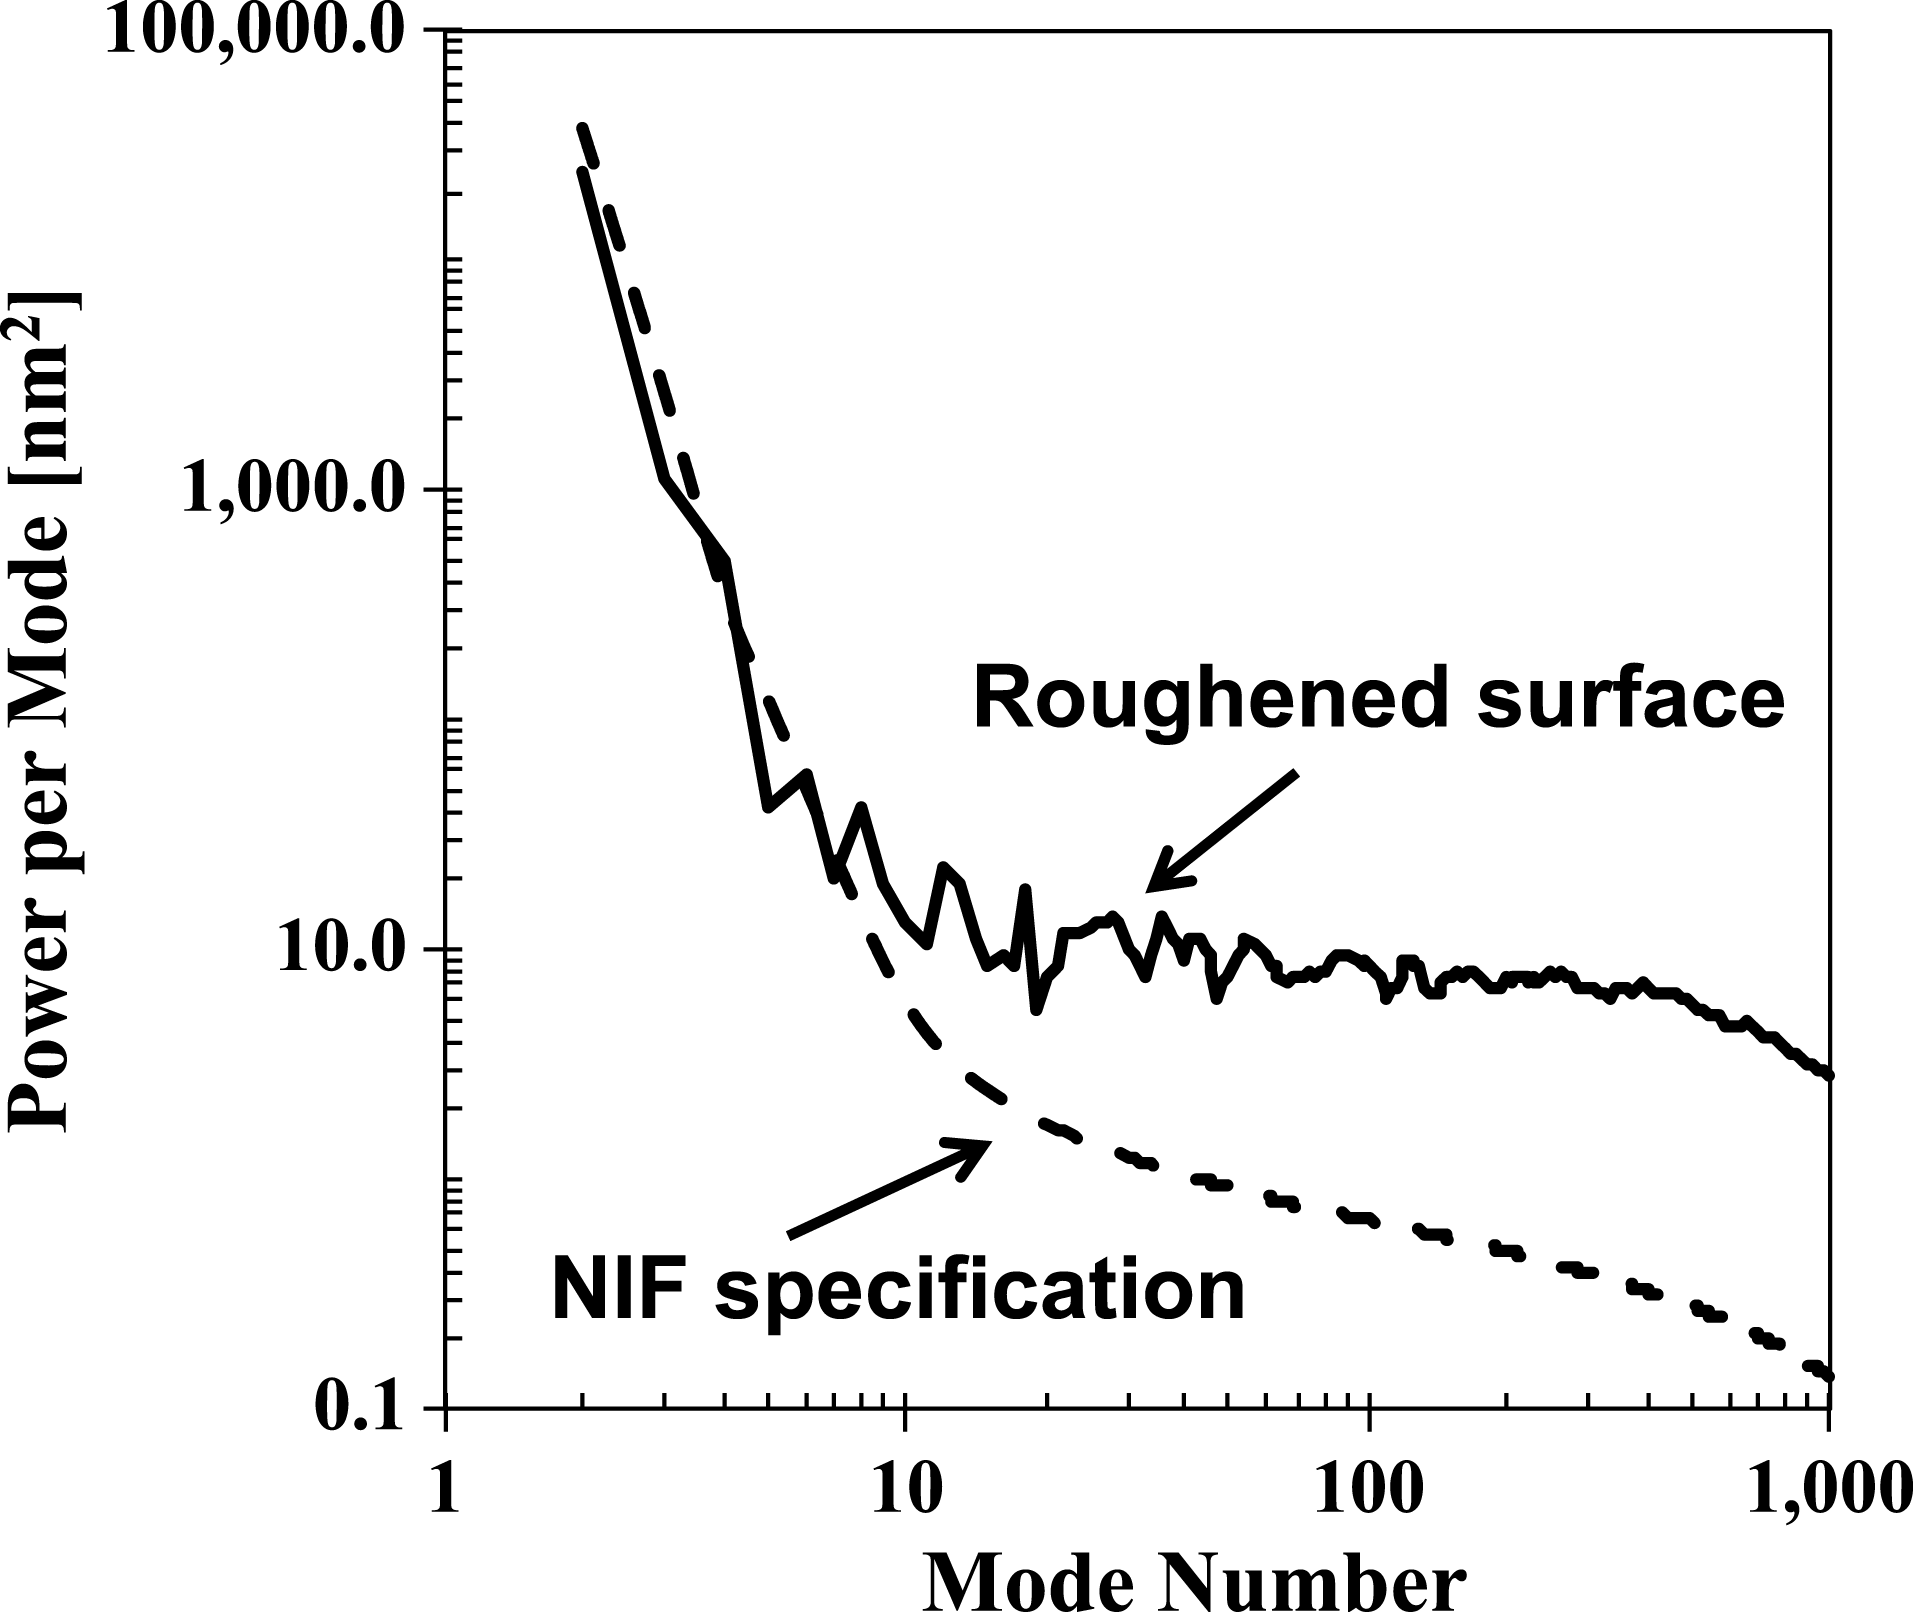
Figure 2. Power spectra of the measured capsule outer-surface roughness (solid curve) compared with the NIF outer-surface specifications (dashed curve).
The experiments were driven by a temporally shaped, 21-ns long laser pulse with a peak power of  ${\sim}350~\text{TW}$ and a total laser energy of 1.3 MJ (shown in Figure 3) using 184 beams of the NIF laser system. An additional eight overlapped beams were used to illuminate a
  $10\text{-}{\rm\mu}\text{m}$ thick iron backlighter foil at a peak laser intensity of
 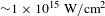 ${\sim}1\times 10^{15}~\text{W}/\text{cm}^{2}$. The modulation growth was measured with through-foil x-ray radiography[Reference Smalyuk, Hu, Hager, Delettrez, Meyerhofer, Sangster and Shvarts11] using
  ${\sim}6.7~\text{keV}$ x-rays generated by the iron backlighter, which was located 12 mm from the target center[Reference Smalyuk, Casey, Clark, Edwards, Haan, Hamza, Hoover, Hsing, Hurricane, Kilkenny, Kroll, Landen, Moore, Nikroo, Pak, Peterson, Raman, Remington, Robey, Weber and Widmann10]. X-ray images of growing capsule modulations were formed using
  $20\text{-}{\rm\mu}\text{m}$ diameter pinholes located 80 mm from the capsule. The images were captured using a framing camera[Reference Glenn, Benedetti, Bradley, Hammel, Izumi, Khan, Kyrala, Ma, Milovich, Pak, Smalyuk, Tommasini and Town12] located 650 mm from the target center, giving a magnification of
  ${\sim}8$ for the imaging system. The temporal resolution of the framing camera was
  ${\sim}100~\text{ps}$, while the spatial resolution of the pinhole images was
  ${\sim}20~{\rm\mu}\text{m}$. The x-ray filters used in these experiments included
  $58\text{-}{\rm\mu}\text{m}$ thick polycarbonate and
  $12.5\text{-}{\rm\mu}\text{m}$ thick iron filters. The measurements were conducted for convergence ratios up to
  ${\sim}2.4$, where the shell radius was decreased from the initial
  $1120~{\rm\mu}\text{m}$ down to
  ${\sim}470~{\rm\mu}\text{m}$ in the implosions.

Figure 3. The laser (‘low-foot’) pulse shape used in the experiments for hohlraum drive with a peak power of  ${\sim}350~\text{TW}$ and total energy of
  ${\sim}1.3~\text{MJ}$.
3. Experimental images
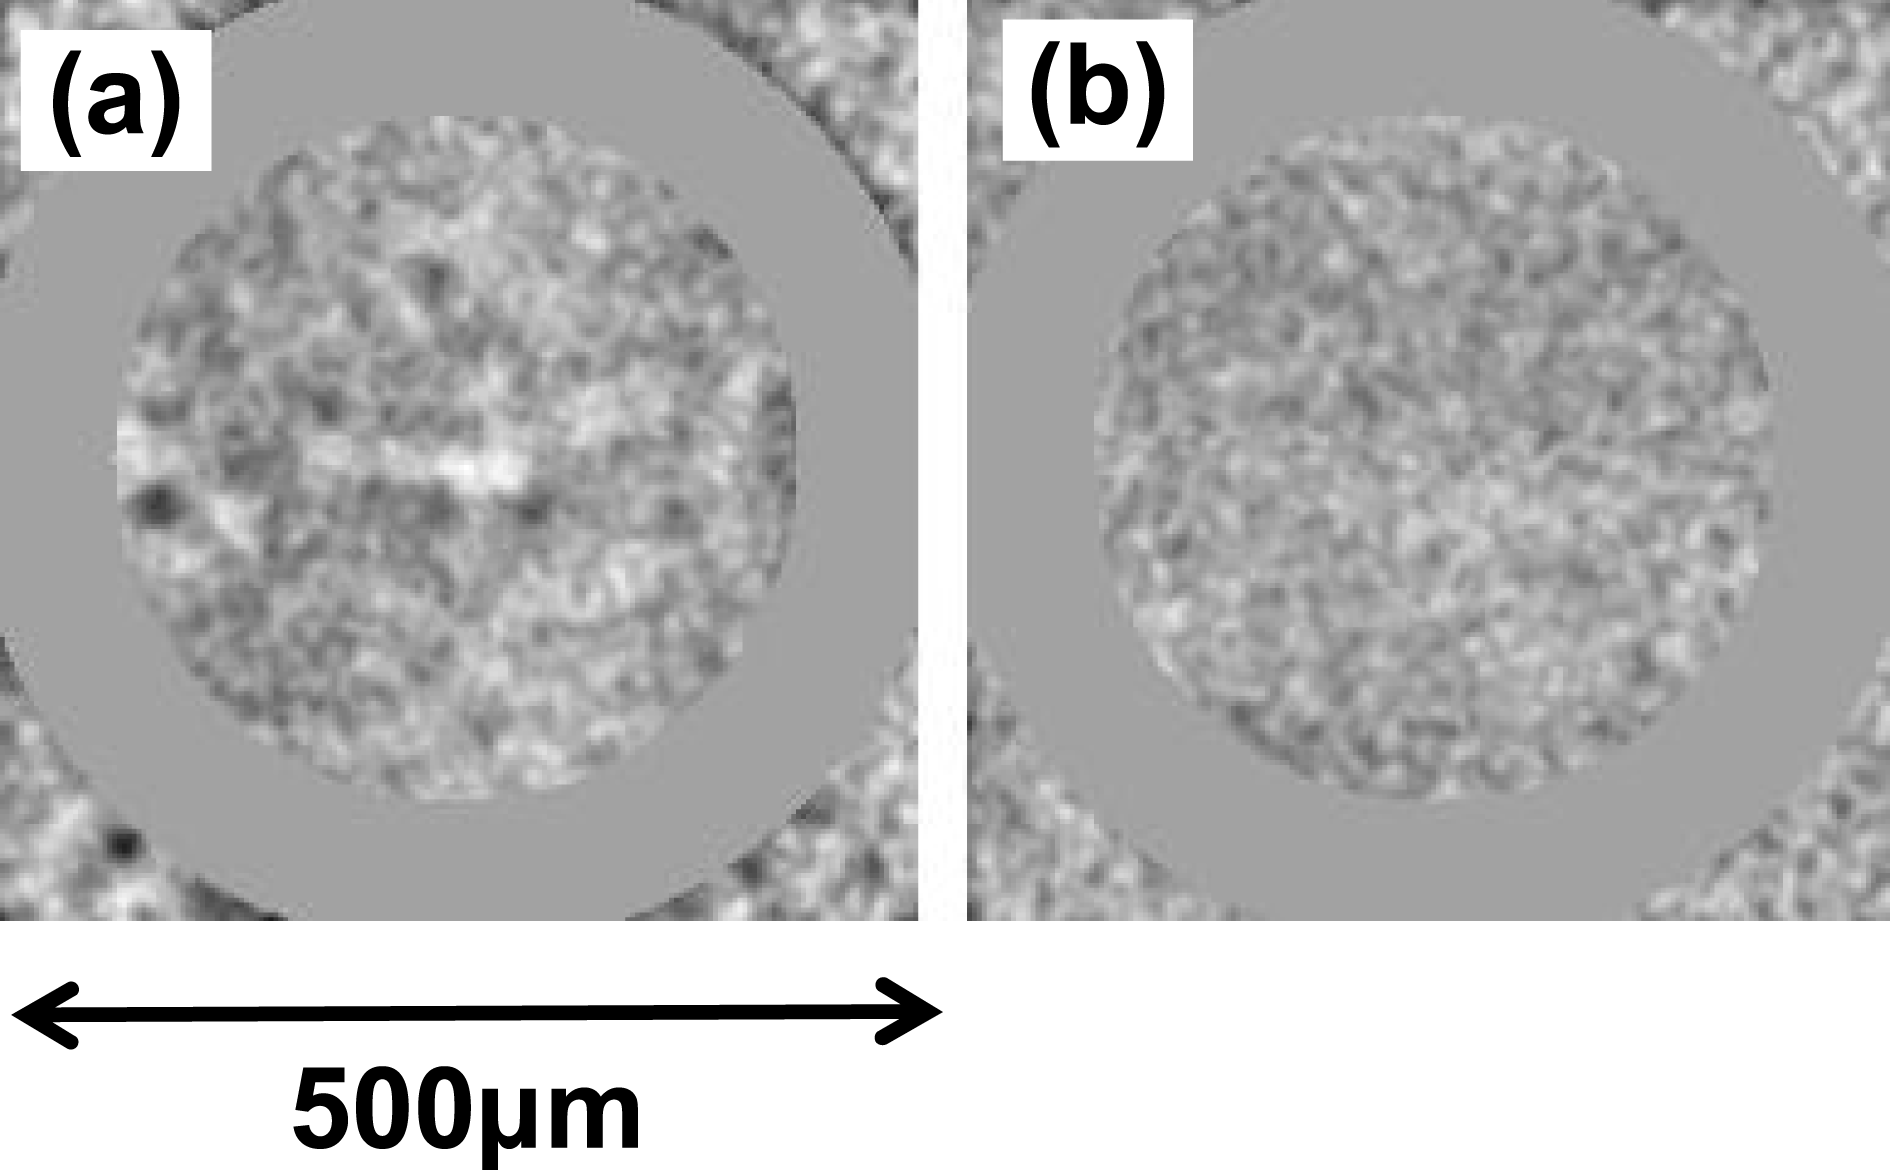
Figures 4(a) and 4(b) show measured optical-depth (OD) modulations of the capsule x-ray radiographs captured on a framing camera. OD variations (used in the analysis below) were obtained by taking the natural logarithm of the framing-camera image transmission intensities after x-ray backgrounds were subtracted. The image in Figure 4(a) represents an average of eight independent OD modulation images captured during a  ${\sim}240~\text{ps}$ temporal range. The image of Figure 4(b) represents an average of seven other independent OD modulation images in the same temporal range. The effect of motional blurring was compensated by scaling images to the same shell radius before the overlap[Reference Field, Rygg, Barrios, Benedetti, Döppner, Izumi, Jones, Khan, Ma, Nagel, Pak, Tommasini, Bradley and Town13]. The average of Figures 4(a) and 4(b) is shown in Figure 4(c), representing the image of the signal and noise, while the difference of Figures 4(a) and 4(b) divided by a factor of 2 is shown in Figure 4(d), representing the image of the noise. One can see the same circular ‘rings’ (used for the image alignment) and 3D modulations in both Figures 4(a) and 4(b), indicating that these features correspond to capsule modulations, not noise. The details of the noise analysis are presented in Ref. [Reference Smalyuk, Yaakobi, Delettrez, Marshall and Meyerhofer14]. The noise image in Figure 4(d) is much smoother than the image of the signal and noise in Figure 4(c), again indicating that the pronounced ‘ring’ and 3D features represent capsule modulations. This is quantitatively demonstrated in Figure 5

Figure 4. Measured capsule x-ray radiographs captured on a framing camera at a radius of  $R=470~{\rm\mu}\text{m}$. Images (a) and (b) represent independent image OD modulations obtained by averaging over eight and seven independent images, respectively. Image (c) shows the OD signal and noise obtained by averaging of images (a) and (b), while image (d) shows the OD image of noise obtained using a subtraction of images (a) and (b).

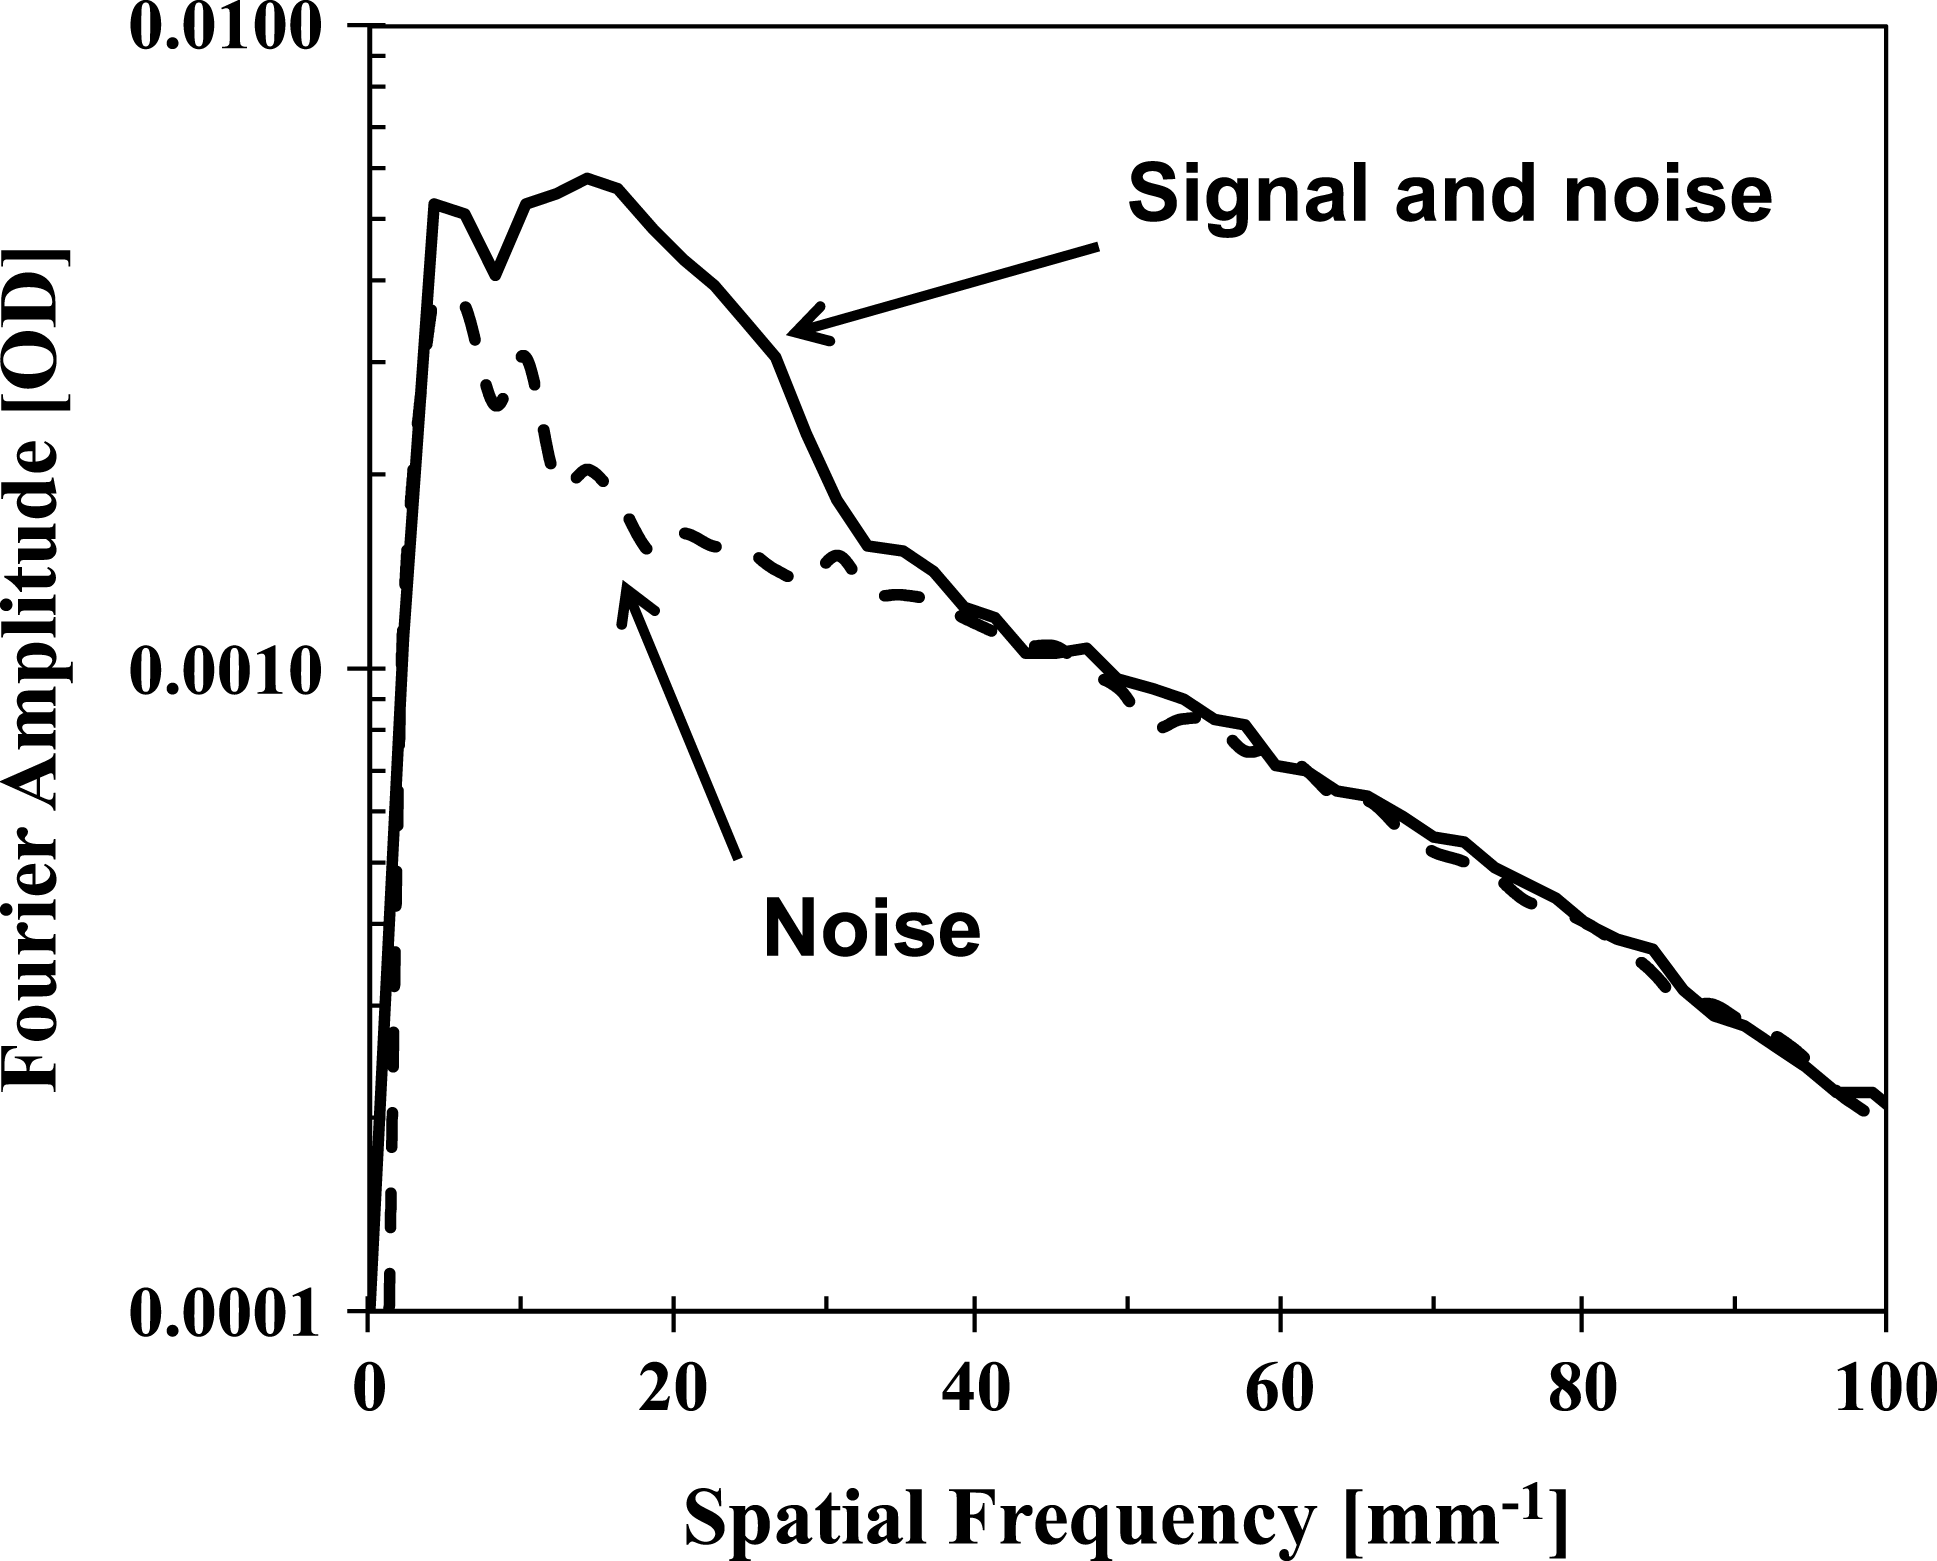
by showing the OD Fourier spectrum of the signal plus noise (from the image in Figure 4(c)) compared with the OD Fourier spectrum of the noise (from the image in Figure 4(d)). The Fourier spectra were obtained by azimuthally averaging 2D Fourier images in the spatial frequency domain. As one can see in Figure 5, the modulation signal is above the noise level in a spatial frequency range up to  ${\sim}40~\text{mm}^{-1}$, corresponding to the shortest spatial wavelength of
  ${\sim}25~{\rm\mu}\text{m}$.
4. Simulated images
The experiments were modeled using the same methodology as the 3D simulations described in Ref. [Reference Clark, Marinak, Weber, Eder, Haan, Hammel, Hinkel, Jones, Milovich, Patel, Robey, Salmonson, Sepke and Thomas15]. Figure 6 presents results of three-dimensional (3D) HYDRA simulations[Reference Clark, Marinak, Weber, Eder, Haan, Hammel, Hinkel, Jones, Milovich, Patel, Robey, Salmonson, Sepke and Thomas15] using the measured spectrum for initial conditions (shown in Figure 2). The conditions used in the simulations were similar to those typically used to simulate the performance of layered DT implosions, which resolve a maximum mode number of 100[Reference Clark, Marinak, Weber, Eder, Haan, Hammel, Hinkel, Jones, Milovich, Patel, Robey, Salmonson, Sepke and Thomas15]. Mode 100 corresponds to a spatial frequency of  ${\sim}40~\text{mm}^{-1}$ in Figure 5. Figure 6(a) shows the simulated OD image at the same radius of
  $470~{\rm\mu}\text{m}$ as the measured results. Figure 6(b) shows the same image including the effects of spatial blurring due to the finite spatial resolution of the imaging system. Two light ‘dots’ (or divots) at the left and right edges of each simulated image represent the spatial ‘fiducials’, which were used to determine the capsule convergence. The divots were both
  $40\text{-}{\rm\mu}\text{m}$ wide, with peak-to-valley amplitudes of 260 nm, and had shapes of the super-Gaussians of order 20. The spatial blurring includes the spatial resolution of the pinhole camera and the framing camera. Figure 7 shows the calculated (at an x-ray energy of 6.7 keV) optical transfer function (OTF) of the
  $20~{\rm\mu}\text{m}$ pinhole camera (solid curve)[Reference Smalyuk, Boehly, Iwan, Kessler, Knauer, Marshall, Meyerhofer, Stoeckl, Yaakobi and Bradley16] and the measured OTF of the framing camera (dashed curve)[Reference Glenn, Benedetti, Bradley, Hammel, Izumi, Khan, Kyrala, Ma, Milovich, Pak, Smalyuk, Tommasini and Town12]. One would multiply the two curves to obtain the OTF of both the pinhole camera and the framing camera. The additional blurring effect of the
  $60~{\rm\mu}\text{m}$ scanning aperture of the densitometer[Reference Smalyuk, Boehly, Iwan, Kessler, Knauer, Marshall, Meyerhofer, Stoeckl, Yaakobi and Bradley16], used to scan the film of the framing camera, was also included.

Figure 6. Simulated capsule OD modulations at radius of  $R=470~{\rm\mu}\text{m}$ without the effects of spatial resolution (a) and including the blurring by the spatial resolution of the imaging system (b).

Figure 7. The calculated lineout of the OTF of the  $20~{\rm\mu}\text{m}$ pinhole camera (solid line) using experimental geometrical parameters with 6.7 keV x-rays and the measured lineout of the OTF of the framing camera (dashed curve) including the effects of the experimental magnification of 8.
Figure 8 shows the OD Fourier spectra of the simulated images without (solid curve) and including (dashed curve) the effects of spatial resolution. It shows that the predicted modulation signal is peaked at a spatial frequency of  ${\sim}20~\text{mm}^{-1}$ (corresponding to a wavelength of
  ${\sim}50~{\rm\mu}\text{m}$) and decreases above a spatial frequency of
  $50~\text{mm}^{-1}$ (corresponding to a wavelength of
  ${\sim}20~{\rm\mu}\text{m}$). The spatial blurring reduces the amplitudes, especially those above a spatial frequency of
  ${\sim}10~\text{mm}^{-1}$, with a cutoff at a spatial frequency of
  ${\sim}50~\text{mm}^{-1}$. The highest mode 100 in the simulations corresponds to a spatial frequency of
  ${\sim}40~\text{mm}^{-1}$ in Figure 8. The simulated spectrum without spatial blurring extends above the spatial frequency of
  ${\sim}40~\text{mm}^{-1}$ due to effects of the imaging geometry. As the parallel beam of backlighter x-rays passes through the spherically curved shell, the features in the backlit image will look sharper (i.e., foreshortened) at the image edges, effectively generating modulations at higher spatial frequencies. Since the experimental radiographs included a circular ‘ring’, it was important to exclude it for a fair comparison with the simulations, which did not include this feature. Figure 9 shows the same images as presented in Figures 4(c) and 4(d) but with the area around the circular ‘ring’ blocked for further analysis. Figure 10 shows a comparison of the measured data with the simulations. The measured Fourier spectrum including the ‘ring’ is shown by the thick solid curve. The dashed curve shows the Fourier spectrum excluding the ‘ring’. It is compared with the simulated spectrum shown by the thin solid curve. One can see that the exclusion of the ‘ring’ feature reduced the measured modulation signal by
  ${\sim}30\%$ at the peak of the spectrum. The measured peak modulation level (dashed curve) at a spatial frequency of
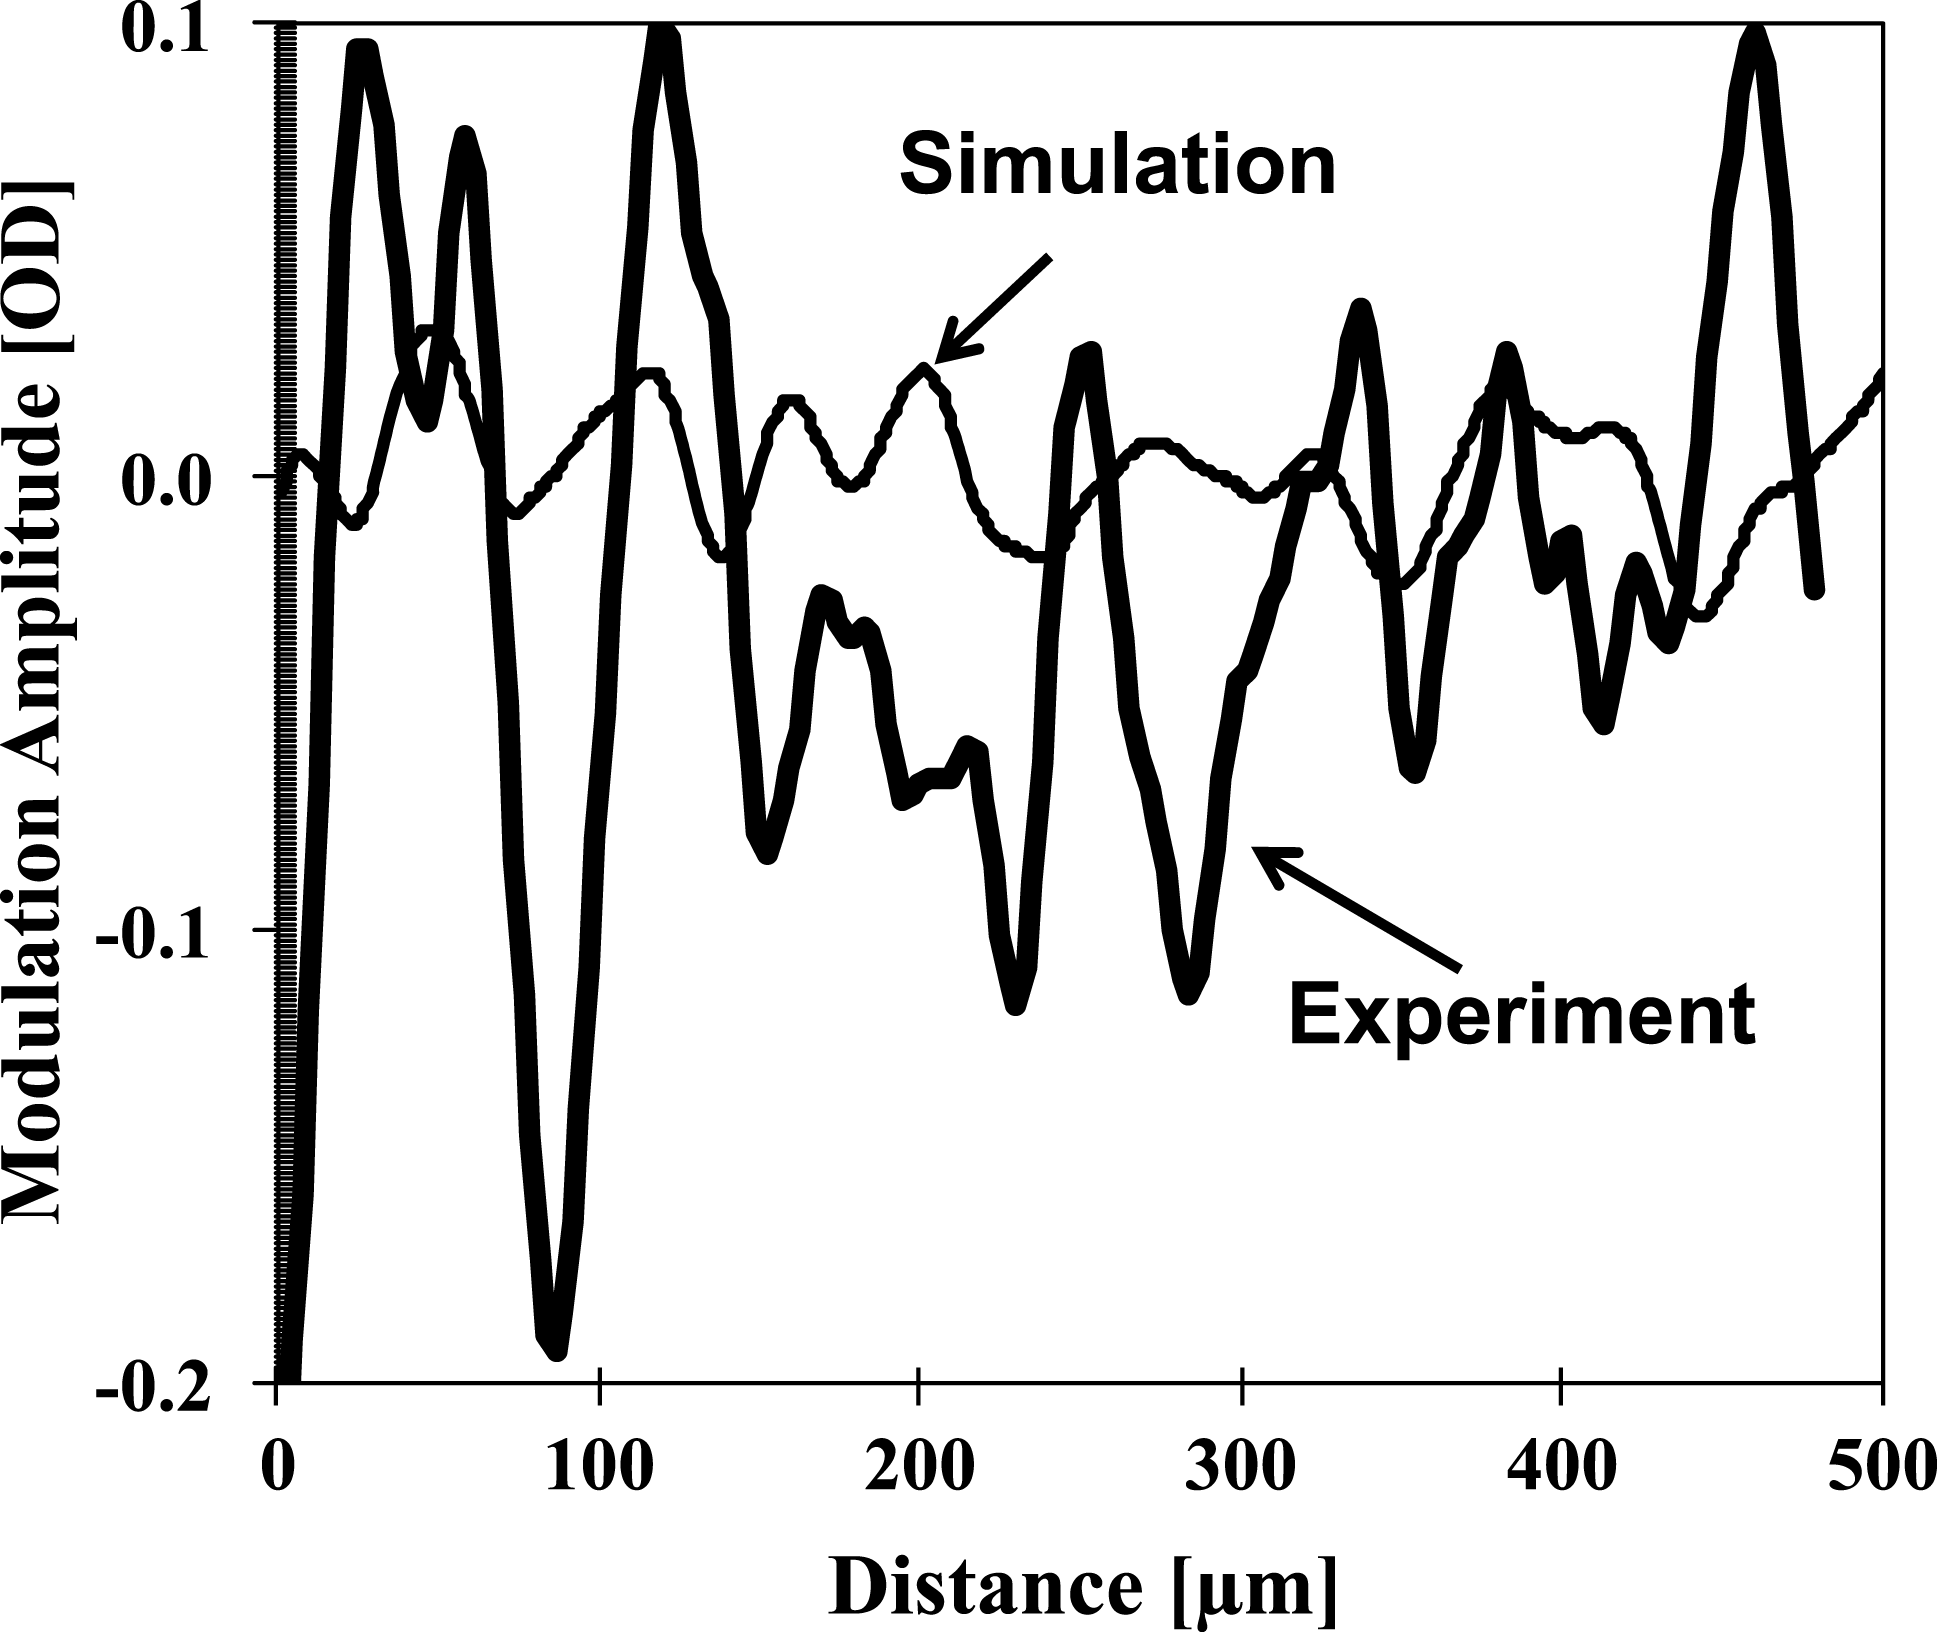
  ${\sim}20~\text{mm}^{-1}$ is approximately three times higher than the peak of the simulated spectrum (thin solid curve). This discrepancy may be a very important clue in improving our understanding of the performance of layered DT implosions conducted during the National Ignition Campaign (NIC)[Reference Smalyuk, Döppner, Kline, Ma, Park, Atherton, Benedetti, Bionta, Bleuel, Bond, Bradley, Caggiano, Callahan, Casey, Celliers, Cerjan, Clark, Dewald, Dixit, Edgell, Frenje, Gatu-Johnson, Glebov, Glenn, Grim, Haan, Hammel, Hartouni, Hatarik, Hatchett, Hicks, Hsing, Izumi, Jones, Key, Khan, Kilkenny, Knauer, Kyrala, Landen, Le Pape, MacGowan, Mackinnon, MacPhee, McNaney, Meezan, Moody, Moore, Moran, Pak, Parham, Patel, Petrasso, Ralph, Regan, Remington, Robey, Ross, Spears, Springer, Suter, Tommasini, Town, Weber, Widmann, Lindl, Edwards, Glenzer and Moses6–Reference Regan, Epstein, Hammel, Suter, Scott, Barrios, Bradley, Callahan, Cerjan, Collins, Dixit, Döppner, Edwards, Farley, Fournier, Glenn, Glenzer, Golovkin, Haan, Hamza, Hicks, Izumi, Jones, Kilkenny, Kline, Kyrala, Landen, Ma, MacFarlane, MacKinnon, Mancini, McCrory, Meezan, Meyerhofer, Nikroo, Park, Ralph, Remington, Sangster, Smalyuk, Springer and Town8]. The difference between simulated and measured optical lineouts is also shown in Figure 11. The simulated lineout was taken from Figure 6(a) in the horizontal direction near the central part of the image, while the measured lineout was taken from Figure 4(c) in the same part as the simulated lineout. The experimental lineout was averaged over a spatial width of
  $20~{\rm\mu}\text{m}$ in a perpendicular direction based on the
  $20~{\rm\mu}\text{m}$ spatial resolution of the system. One can notice that the typical spatial width of the simulated modulations is approximately 40–
 $50~{\rm\mu}\text{m}$, similar to the typical spatial width in the measured data, while the modulation amplitudes in the experiment are significantly higher. The sizes and amplitudes of the modulation features are pretty uniform across the image in the simulations, while they vary in the data, showing that the difference is the modulation morphology in the experiment compared with the simulations.


Figure 10. Measured Fourier amplitudes of OD modulations without the mask (thick solid curve) and with the mask (dashed curve) compared with the simulated OD modulations (thin solid curve).
5. Discussion
In the high-compression experiments performed during the NIC[Reference Smalyuk, Döppner, Kline, Ma, Park, Atherton, Benedetti, Bionta, Bleuel, Bond, Bradley, Caggiano, Callahan, Casey, Celliers, Cerjan, Clark, Dewald, Dixit, Edgell, Frenje, Gatu-Johnson, Glebov, Glenn, Grim, Haan, Hammel, Hartouni, Hatarik, Hatchett, Hicks, Hsing, Izumi, Jones, Key, Khan, Kilkenny, Knauer, Kyrala, Landen, Le Pape, MacGowan, Mackinnon, MacPhee, McNaney, Meezan, Moody, Moore, Moran, Pak, Parham, Patel, Petrasso, Ralph, Regan, Remington, Robey, Ross, Spears, Springer, Suter, Tommasini, Town, Weber, Widmann, Lindl, Edwards, Glenzer and Moses6], a maximum fuel areal density of  ${\sim}1.2~\text{g}/\text{cm}^{2}$ was achieved with an ignition-relevant fuel velocity of
  ${\sim}320{-}330~\text{km}/\text{s}$[Reference Smalyuk, Döppner, Kline, Ma, Park, Atherton, Benedetti, Bionta, Bleuel, Bond, Bradley, Caggiano, Callahan, Casey, Celliers, Cerjan, Clark, Dewald, Dixit, Edgell, Frenje, Gatu-Johnson, Glebov, Glenn, Grim, Haan, Hammel, Hartouni, Hatarik, Hatchett, Hicks, Hsing, Izumi, Jones, Key, Khan, Kilkenny, Knauer, Kyrala, Landen, Le Pape, MacGowan, Mackinnon, MacPhee, McNaney, Meezan, Moody, Moore, Moran, Pak, Parham, Patel, Petrasso, Ralph, Regan, Remington, Robey, Ross, Spears, Springer, Suter, Tommasini, Town, Weber, Widmann, Lindl, Edwards, Glenzer and Moses6]. While these two key performance parameters were close to the ignition goals, the neutron yield was significantly lower than that predicted[Reference Clark, Hinkel, Eder, Jones, Haan, Hammel, Marinak, Milovich, Robey, Suter and Town17]. Original multi-dimensional simulations of layered DT high-compression implosions intended to capture performance degradation due to instabilities and hohlraum drive asymmetries overpredicted the measured yields by factors of
  ${\sim}5$ to
  ${\sim}30$[Reference Clark, Hinkel, Eder, Jones, Haan, Hammel, Marinak, Milovich, Robey, Suter and Town17]. 2D simulations with large multipliers (up to
  ${\sim}5\times$) on the capsule surface roughness were able to bring the simulated yields down to the measured levels[Reference Regan, Epstein, Hammel, Suter, Scott, Barrios, Bradley, Callahan, Cerjan, Collins, Dixit, Döppner, Edwards, Farley, Fournier, Glenn, Glenzer, Golovkin, Haan, Hamza, Hicks, Izumi, Jones, Kilkenny, Kline, Kyrala, Landen, Ma, MacFarlane, MacKinnon, Mancini, McCrory, Meezan, Meyerhofer, Nikroo, Park, Ralph, Remington, Sangster, Smalyuk, Springer and Town8, Reference Clark, Hinkel, Eder, Jones, Haan, Hammel, Marinak, Milovich, Robey, Suter and Town17]. This suggested the hypothesis that either the instability growth factors or the initial modulation seeds were larger than in the simulations.
Recent HGR experiments directly measured the growth factors of large-amplitude 2D pre-imposed modulations at the ablation front[Reference Smalyuk, Casey, Clark, Edwards, Haan, Hamza, Hoover, Hsing, Hurricane, Kilkenny, Kroll, Landen, Moore, Nikroo, Pak, Peterson, Raman, Remington, Robey, Weber and Widmann10]. Good agreement between the simulations and the experiments indicated that the instability growth factors were modeled well for the most unstable modulations at the ablation front. These results suggested that the instability growth of the more challenging 3D surface-roughness modulations may not be modeled properly, or that other initial modulation seeds (in the bulk of the capsule, for example) were not properly included in the modeling[Reference Smalyuk, Casey, Clark, Edwards, Haan, Hamza, Hoover, Hsing, Hurricane, Kilkenny, Kroll, Landen, Moore, Nikroo, Pak, Peterson, Raman, Remington, Robey, Weber and Widmann10]. The present experiments indicate that the measured 3D modulations are larger than in the simulations. A possible explanation for this observation is that the simulated growth is reduced due to the finite spatial resolution of the 3D simulations. With this limited spatial resolution, nonlinear coupling from the shorter modes to longer modes can be suppressed, further reducing the growth in the simulations. In addition, since these simulations were performed, it has been found that the 3D simulations underpredicted the ablation front instability growth by roughly a factor of 1.7. Computer memory limitations and the long run times for 3D simulations currently necessitate using much reduced resolution in the solution of the multi-group radiation transport equations in these simulations. This reduced resolution results in the simulations underpredicting the growth by  ${\sim}1.7$ when compared with better-resolved 2D simulations[Reference Smalyuk, Weber, Casey, Clark, Field, Haan, Hammel, Hamza, Hoover, Landen, Nikroo, Robey and Weber18].
Another recent hypothesis suggested that increased levels of oxygen contamination in the bulk of the capsule, together with oxygen spatial nonuniformities, could significantly increase the modulation growth[Reference Haan, Huang, Johnson, Stadermann, Baxamusa, Bhandarkar, Clark, Smalyuk and Robey19]. Some measured 3D modulations, such as the ‘ring’ feature in Figure 4, do not originate from the outer-surface modulations, but come from some other seeds, possibly from the modulations in the bulk of the capsule. The observation of such a feature is consistent with the hypothesis that spatially nonuniform oxygen contamination in the bulk of the capsule could seed significant modulation growth[Reference Haan, Huang, Johnson, Stadermann, Baxamusa, Bhandarkar, Clark, Smalyuk and Robey19]. Oxygen absorption is increased by exposure to UV or visible light[Reference Haan, Huang, Johnson, Stadermann, Baxamusa, Bhandarkar, Clark, Smalyuk and Robey19]. The targets used for layered DT implosions routinely experience UV and visible light during handling and assembly procedures, and modulations in exposure are very likely. Coherent features like the ‘ring’ could very plausibly arise from differential exposure to light or UV. Experiments to study this hypothesis are being planned in the near future.
In addition, x-ray radiography experiments using the same (‘native’) surface roughness as typically used in the capsules for layered DT implosion are being planned, following the first experiments described in this paper. Some other possible seeds for instability growth, such as radiation asymmetry[Reference Scott, Clark, Bradley, Callahan, Edwards, Haan, Marinak, Town, Norreys and Suter20], dust grains and other localized defects, and effects of the membrane (‘tent’) used to support the capsule[Reference Landen, Benedetti, Bleuel, Boehly, Bradley, Caggiano, Callahan, Celliers, Cerjan, Clark, Collins, Dewald, Dixit, Döppner, Edgell, Eggert, Farley, Frenje, Glebov, Glenn, Glenzer, Haan, Hamza, Hammel, Haynam, Hammer, Heeter, Herrmann, Hicks, Hinkel, Izumi, Gatu Johnson, Jones, Kalantar, Kauffman, Kilkenny, Kline, Knauer, Koch, Kyrala, LaFortune, Ma, Mackinnon, Macphee, Mapoles, Milovich, Moody, Meezan, Michel, Moore, Munro, Nikroo, Olson, Opachich, Pak, Parham, Patel, Park, Petrasso, Ralph, Regan, Remington, Rinderknecht, Robey, Rosen, Ross, Salmonson, Sangster, Schneider, Smalyuk, Spears, Springer, Suter, Thomas, Town, Weber, Wegner, Wilson, Widmann, Yeamans, Zylstra, Edwards, Lindl, Atherton, Hsing, MacGowan, Van Wonterghem and Moses21–Reference Nagel, Haan, Rygg, Barrios, Benedetti, Bradley, Field, Hammel, Izumi, Jones, Khan, Ma, Pak, Tommasini and Town23] were not fully included or were underestimated in the simulations. The resultant elevated modulations could cause stronger performance degradation at peak compression, as suggested in recent simulations[Reference Weber, Casey, Pino, Rowley, Smalyuk, Spears and Tipton24]. In order to explain past results and inform future designs, predictions of hydrodynamic instability growth need to be tested and validated by experiments.
6. Conclusions
Hydrodynamic instability growth of 3D surface-roughness modulations was studied in spherical implosions at the NIF. The initial amplitudes were increased by a factor of four, compared with standard specifications, in order to increase the signal-to-noise ratio and to qualify a technique for measuring 3D modulations. The instability growth measurements were performed using x-ray through-foil radiography. Averaging over 15 similar images significantly increased the signal-to-noise ratio, making possible a comparison with 3D simulations. The measured modulation levels at a capsule convergence ratio of  ${\sim}2.4$, representing most of the acceleration phase, were
  ${\sim}3$ times larger than the simulated levels. Several hypotheses were discussed to explain the results, including increased instability growth due to modulations of the oxygen content in the bulk of the capsule. Future experiments will be focused on measurements with standard or ‘native-roughness’ capsules identical to those used in layered DT implosions as well as experiments with deliberately imposed oxygen spatial modulations.
Acknowledgements
This work was performed under the auspices of the U.S. Department of Energy by Lawrence Livermore National Laboratory under Contract DE-AC52-07NA27344.


 Open access