


1 Introduction
Laser–plasma accelerators have attracted significant interest over the last few decades[Reference Tajima and Dawson1–Reference Faure, Glinec, Pukhov, Kiselev, Gordienko, Lefebvre, Rousseau, Burgy and Malka4] due to their high acceleration gradients and beam currents[Reference Li, Li, Huang, Tao, Li, Zhao, Ma, Guo, Wang, Chen, Hafz, Zhang and Chen5]; they not only enable GeV electron[Reference Gonsalves, Nakamura, Daniels, Benedetti, Pieronek, de Raadt, Steinke, Bin, Bulanov, van Tilborg, Geddes, Schroeder, Tóth, Esarey, Swanson, Fan-Chiang, Bagdasarov, Bobrova, Gasilov, Korn and Sasorov6] and hundred-MeV ion[Reference Macchi, Borghesi and Passoni7] accelerators to be reduced to a length scale of centimeters, but also can drive secondary radiation[Reference Rousse, Phuoc, Shah, Pukhov, Lefebvre, Malka, Kiselev, Burgy, Rousseau, Umstadter and Hulin8–Reference Yan, Fruhling, Golovin, Haden, Luo, Zhang, Zhao, Zhang, Liu, Chen, Chen, Banerjee and Umstadter10] and particle sources[Reference Ditmire, Zweiback, Yanovsky, Cowan, Hays and Wharton11–Reference Pomerantz, McCary, Meadows, Arefiev, Bernstein, Chester, Cortez, Donovan, Dyer, Gaul, Hamilton, Kuk, Lestrade, Wang, Ditmire and Hegelich14] with ultra-high brightness/flux. For example, laser–plasma accelerating electrons/ions can induce photofission[Reference Feng, Fu, Li, Zhang, Wang, Li, Zhu, Tan, Mirzaie, Zhang and Chen15], spallation[Reference Martinez, Chen, Bolanos, Blanchot, Boutoux, Cayzac, Courtois, Davoine, Duval, Horny, Lantuejoul, Le Deroff, Masson-Laborde, Sary, Vauzour, Smets, Gremillet and Fuchs16] and fusion[Reference Roth, Jung, Falk, Guler, Deppert, Devlin, Favalli, Fernandez, Gautier, Geissel, Haight, Hamilton, Hegelich, Johnson, Merrill, Schaumann, Schoenberg, Schollmeier, Shimada, Taddeucci, Tybo and Wagner13] reactions, and generate a fast neutron source[Reference Pomerantz, McCary, Meadows, Arefiev, Bernstein, Chester, Cortez, Donovan, Dyer, Gaul, Hamilton, Kuk, Lestrade, Wang, Ditmire and Hegelich14]. Because of the uncharged property of neutrons, they have different properties from charged particles or electromagnetic radiation when interacting with matter, which can result in obtaining complementary information. In recent decades, neutron sources have been widely used in many fields, such as nuclear physics[Reference Feshbach and Sheldon17], biology[Reference Krueger, Meuse, Majkrzak, Dura, Berk, Tarek and Plant18], archaeology[Reference Kardjilov, Fiori, Giunta, Hilger, Rustichelli, Strobl, Banhart and Triolo19] and medical science[Reference Biochemistry20].
Compared with traditional spallation[Reference Wang, Liang, Yin, Yu, He, Tao, Zhu, Jia and Zhang21–Reference Takada, Haga, Teshigawara, Aso, Meigo, Kogawa, Naoe, Wakui, Ooi, Harada and Futakawa23] and fusion neutron source[Reference Kuteev, Goncharov, Sergeev and Khripunov24–Reference Knaster, Ibarra, Abal, Abou-Sena, Arbeiter, Arranz, Arroyo, Bargallo, Beauvais, Bernardi, Casal, Carmona, Chauvin, Comunian, Delferriere, Delgado, Diaz-Arocas, Fischer, Frisoni, Garcia, Garin, Gobin, Gouat, Groeschel, Heidinger, Ida, Kondo, Kikuchi, Kubo, Le Tonqueze, Leysen, Mas, Massaut, Matsumoto, Micciche, Mittwollen, Mora, Mota, Nghiem, Nitti, Nishiyama, Ogando, O’hira, Oliver, Orsini, Perez, Perez, Pinna, Pisent, Podadera, Porfiri, Pruneri, Queral, Rapisarda, Roman, Shingala, Soldaini, Sugimoto, Theile, Tian, Umeno, Uriot, Wakai, Watanabe, Weber, Yamamoto and Yokomine26], a laser–plasma accelerator driving a neutron source has some advantages, such as being compact[Reference Mirfayzi, Alejo, Ahmed, Raspino, Ansell, Wilson, Armstrong, Butler, Clarke, Higginson, Kelleher, Murphy, Notley, Rusby, Schooneveld, Borghesi, McKenna, Rhodes, Neely, Brenner and Kar27] and having an ultra-short pulse duration[Reference Pomerantz, McCary, Meadows, Arefiev, Bernstein, Chester, Cortez, Donovan, Dyer, Gaul, Hamilton, Kuk, Lestrade, Wang, Ditmire and Hegelich14] and an ultra-high peak flux[Reference Roth, Jung, Falk, Guler, Deppert, Devlin, Favalli, Fernandez, Gautier, Geissel, Haight, Hamilton, Hegelich, Johnson, Merrill, Schaumann, Schoenberg, Schollmeier, Shimada, Taddeucci, Tybo and Wagner13, Reference Alejo, Krygier, Ahmed, Morrison, Clarke, Fuchs, Green, Green, Jung, Kleinschmidt, Najmudin, Nakamura, Norreys, Notley, Oliver, Roth, Vassura, Zepf, Borghesi, Freeman and Kar28]. This novel neutron source has great potential to further improve the quality of fast neutron resonance radiography (FNRR)[Reference Overley29–Reference Ooi, Teshigawara, Kai, Harada, Maekawa, Futakawa, Hashimoto, Segawa, Kureta, Tremsin, Kamiyama and Kiyanagi32] and fast neutron absorption spectroscopy (FNAS)[Reference Hau, Niedermayr, Drury, Burger, Bell and Friedrich33]. In laser-based neutron experiments, great efforts have been made to realize a high repetition rate, high flux and high yield neutron source[Reference Hohenberger, Meezan, Riedel, Kabadi, Forrest, Aghaian, Cappelli, Farrell, Glenzer, Heeter, Heredia, Landen, Mackinnon, Petrasso, Shuldberg, Treffert and Hsing34–Reference Jung, Yin, Gautier, Wu, Letzring, Dromey, Shah, Palaniyappan, Shimada, Johnson, Schreiber, Habs, Fernandez, Hegelich and Albright36]. A high yield and a collimated neutron source ( ${10}^{10}$ n/sr) can be generated via nuclear fusion and (p, n) reactions by high-energy protons and deuterium ions deposited in a secondary target (named the Pitcher Catcher scheme)[Reference Roth, Jung, Falk, Guler, Deppert, Devlin, Favalli, Fernandez, Gautier, Geissel, Haight, Hamilton, Hegelich, Johnson, Merrill, Schaumann, Schoenberg, Schollmeier, Shimada, Taddeucci, Tybo and Wagner13], but the neutron source has a long duration caused by the ion beam duration stretching when bombarding on the Catcher target[Reference Mirfayzi, Yogo, Lan, Ishimoto, Iwamoto, Negata, Nakai, Arikawa, Abe, Golovin, Honoki, Mori, Okamoto, Shokita, Neely, Fujioka, Mima, Nishimura, Kar and Kodama37]. To optimize the neutron pulse duration, a new scheme was proposed to generate large charge energetic electron beams via a petawatt laser irradiating ultra-thin plastic targets[Reference Pomerantz, McCary, Meadows, Arefiev, Bernstein, Chester, Cortez, Donovan, Dyer, Gaul, Hamilton, Kuk, Lestrade, Wang, Ditmire and Hegelich14]. In this way, the neutron source driven by the energetic electron beam has a shorter pulse duration ( $\sim$100 ps), high yield ( ${\sim} {10}^9$ n/shot) and higher peak flux ( ${>}\,{10}^{18}$ $\textrm{n}/(\textrm{cm}^{2}\cdot \textrm{s})$). However, the electron beam accelerated from the thin plastic target has a large divergence angle ( $\sim {40}^{\circ }$), which results in the neutron source size being larger than 1 cm. In laser–plasma wakefield acceleration (LWFA), the electron beam has the advantages of a low divergence angle[Reference Brunetti, Shanks, Manahan, Islam, Ersfeld, Anania, Cipiccia, Issac, Raj, Vieux, Welsh, Wiggins and Jaroszynski38], femtosecond beam duration[Reference Mahieu, Jourdain, Phuoc, Dorchies, Goddet, Lifschitz, Renaudin and Lecherbourg39], high stability[Reference Maier, Delbos, Eichner, Hubner, Jalas, Jeppe, Jolly, Kirchen, Leroux, Messner, Schnepp, Trunk, Walker, Werle and Winkler40], etc. This femtosecond collimated electron beam has also been utilized to generate neutron sources with an ultra-short duration (100s ps)[Reference Jiao, Shaw, Wang, Wang, Tsai, Poth, Pomerantz, Labun, Toncian, Downer and Hegelich41], but the source size ( $\sim$5 mm) and neutron yield ( ${10}^6$ n/shot) still need to be optimized. In addition, another table-top neutron source has a micro-source size ( $\sim$hundreds of μm) via (D, D) fusion reaction driven by a laser cluster Coulomb explosion[Reference Ditmire, Zweiback, Yanovsky, Cowan, Hays and Wharton11], but this source has a quasi-mono-energetic spectrum (2.45 MeV) and low yield ( $\sim {10}^6$ n/shot), which are not conducive to applications of FNRR and FNAS.
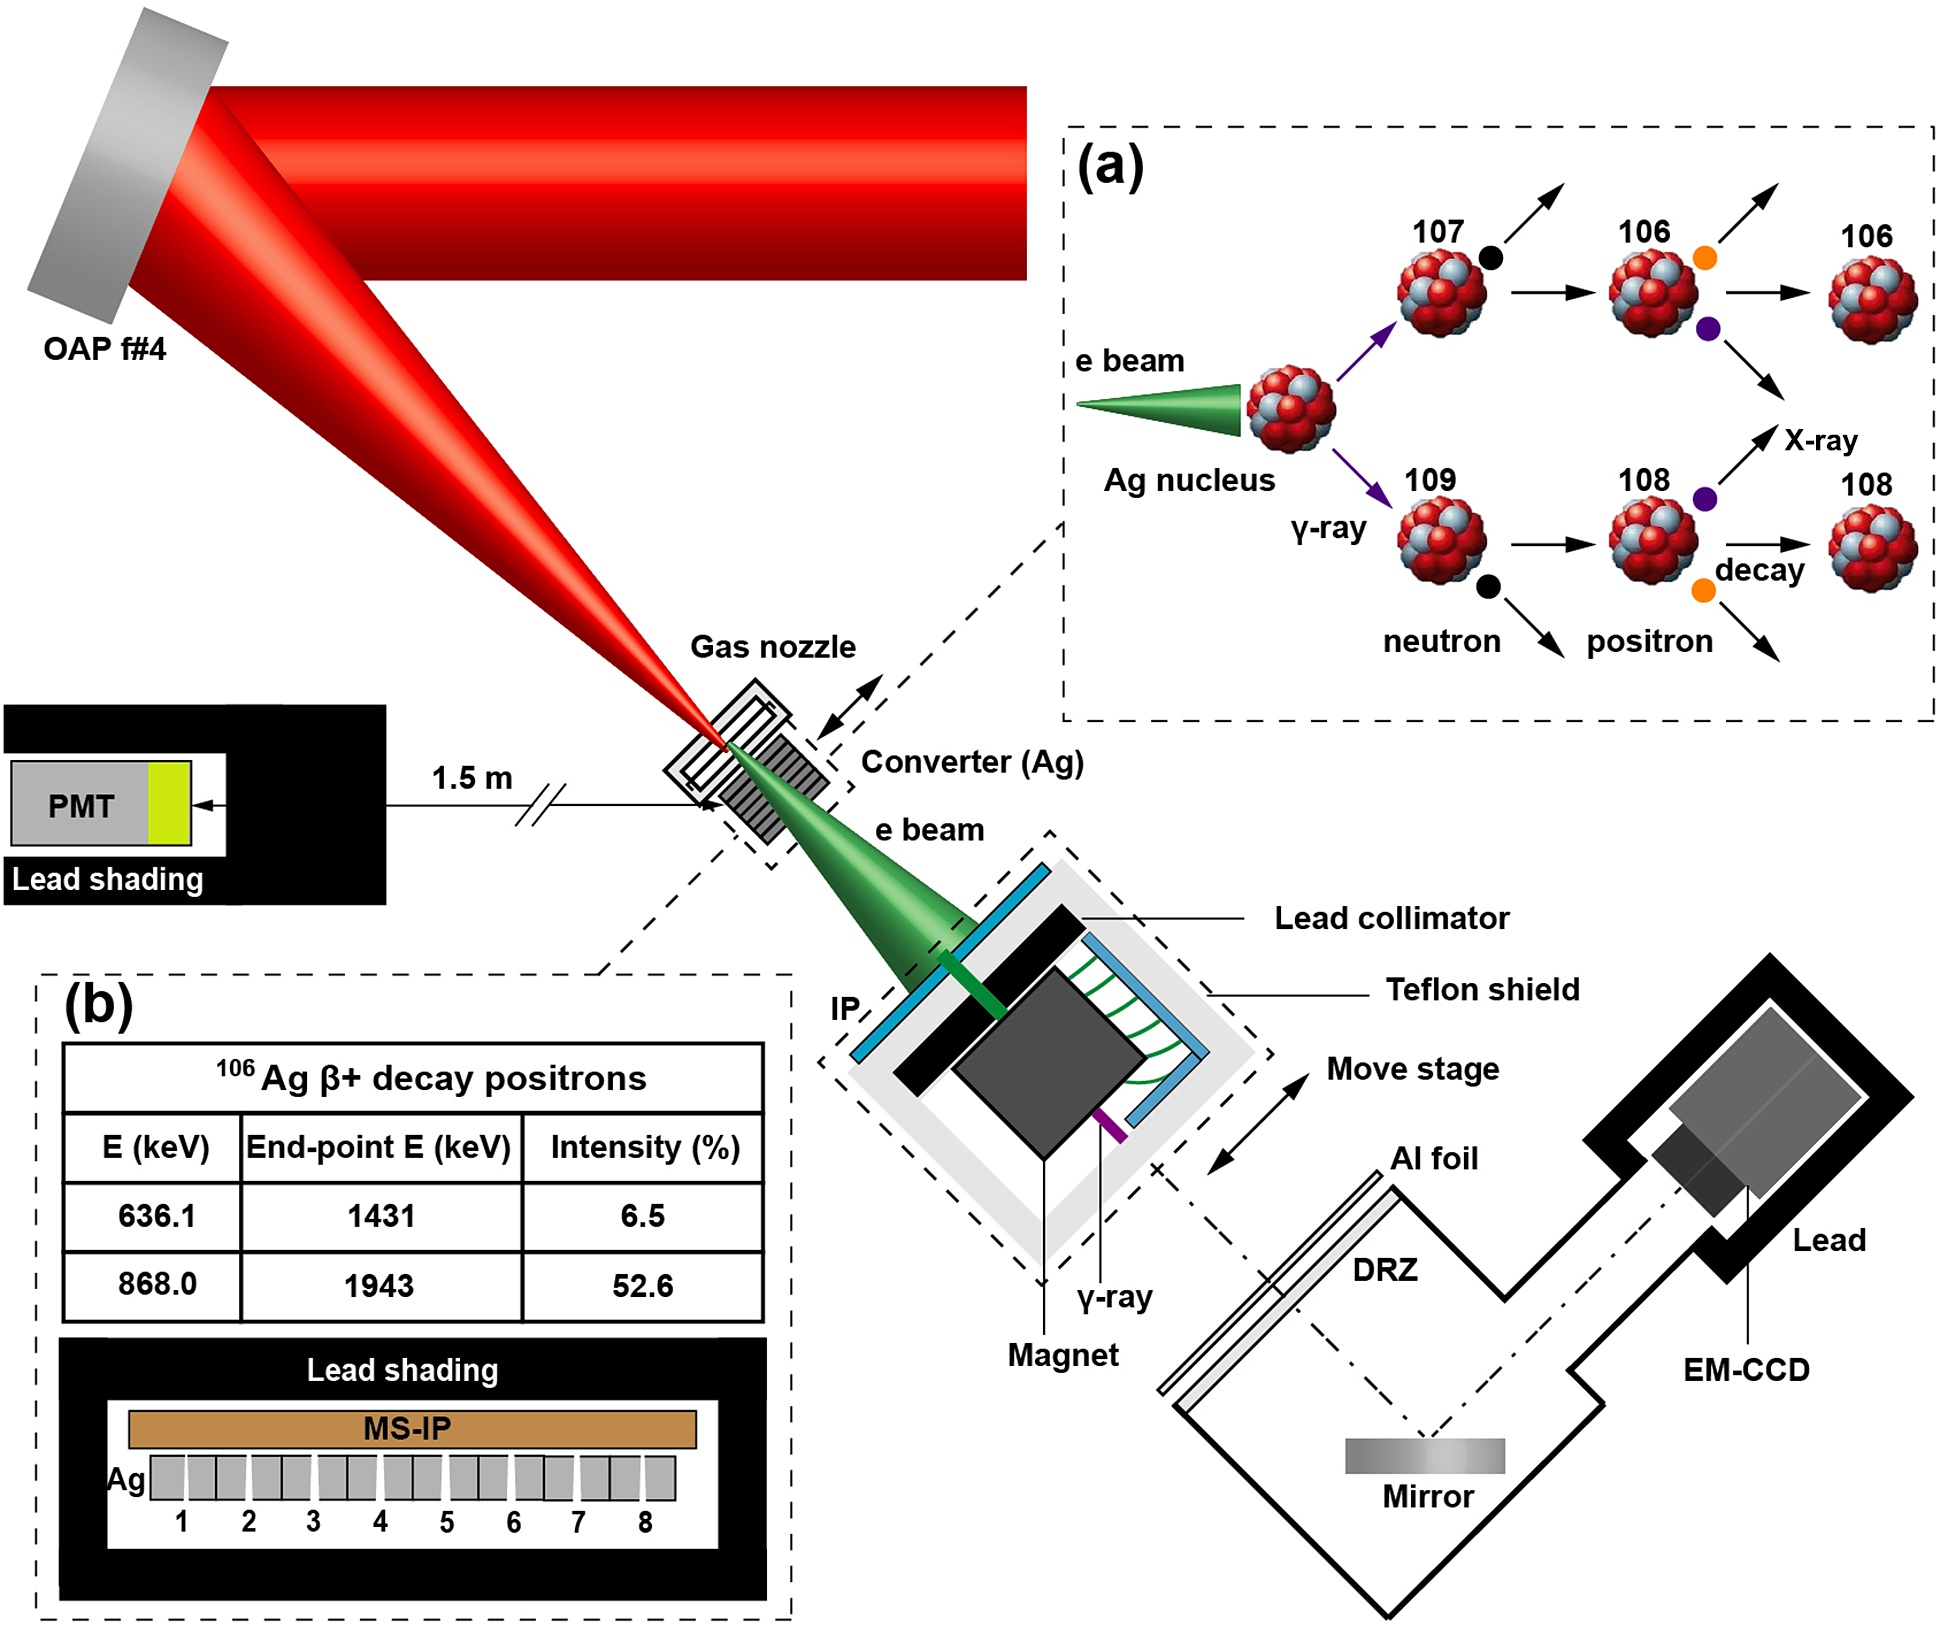
Figure 1 Experimental setup. (a) Schematic diagram of photo-nuclear reactions for  ${}^{107}$Ag and ${}^{109}$Ag atoms. (b) ${}^{106}$Ag decay products, and schematic diagram of the measurement of neutron source spatial distribution.
In this work, we proposed a method to measure the spatial intensity distribution of the neutron source, and demonstrated experimentally the optimization of the neutron source size and pulse duration via a large charge collimated electron beam from an LWFA driving photofission reactions. A micro-size, ultra-short pulsed fast neutron source is obtained by optimizing the thin metal converter position to the gas nozzle. This optimized neutron source is of great value to improve the imaging spatial resolution of FNRR and to realize finer FNAS.
2 Experimental setup
The experiment was performed at the Laboratory for Laser Plasma in Shanghai Jiao Tong University using the 100 TW laser system and a Ti:sapphire laser with the central wavelength of 800 nm. In the experiment, the system delivered 3 J p-polarized pulses with duration of 45 fs (full width at half maximum, FWHM). The experimental setup is shown in Figure 1. The laser beam was focused by an f/4 off-axis parabolic mirror, and the intensity in the focal plane was close to Gaussian distribution with a radius  ${w}_0\sim 3.8\ \unicode{x3bc}$m containing about 38% of the total laser power, that is, approximately 27 TW. Thus, the vacuum-focused laser intensity can reach up to $5.8\times {10}^{19}$ W/cm ${}^2$, and the corresponding normalized vector potential ${a}_0$ is 4.9. The gas target was formed by using a 1.2 mm $\times$ 10 mm supersonic gas jet, which can provide well-defined uniform nitrogen gas density profiles in the range from $3\times {10}^{17}$ to $2\times {10}^{19}$ cm ${}^{-3}$ by changing the gas stagnation pressure[Reference Feng, Li, Wang, Li, Zhu, Tan, Geng, Liu and Chen42], based on the hydrodynamic calculations reported by Hosokai[Reference Hosokai43]. The electron beam bombards the DRZ phosphor screen (Gd2O2S:Tb), emitting fluorescence, which is detected by a 16-bit EM-CCD camera to get an electron beam spot image (the DRZ phosphor screen is covered with 14 μm thickness Al film to block stray light). When the magnet is moved in, the electron beam angular distribution is recorded by a 20 cm $\times$ 20 cm SR-type image plate (IP), which is covered by a 200 μm thickness Cu filter to block low-energy electrons ( ${E}_{\mathrm{k}}<$1 MeV). The electron beam charge is calculated as follows: firstly, the IP is scanned by a Typhoon-7000 IP reader with the setup parameters of PMT 500 V, resolution 50 μm and L5; then the IP signal, that is, the gray value, is converted into a PSL value by using the formula $\textrm{PSL}={\left(\frac{\textrm{gray}}{2^{16}-1}\right)}^2{\left(\frac{R_{\unicode{x3bc} \mathrm{m}}}{100}\right)}^2h(V){10}^{L/2\kern2pt}$ [Reference Williams, Maddox, Chen, Kojima and Millecchia44]; finally, the total charge for ${E}_{\mathrm{k}}>$1 MeV is calculated according to the response sensitivity of the IP, and the response sensitivity is approximately 0.007PSL/electron, which is nearly flat between 1 and 40 MeV[Reference Tanaka, Yabuuchi, Sato, Kodama, Kitagawa, Takahashi, Ikeda, Honda and Okuda45]. Moreover, the signal attenuation rate of 25% is also taken into account[Reference Tanaka, Yabuuchi, Sato, Kodama, Kitagawa, Takahashi, Ikeda, Honda and Okuda45], due to which the fading time is about 8 min, which is the time of the IP being taken out from the vacuum chamber.
A stack of silver (Ag) plates with a total thickness of 1.6 cm was placed at the downstream of the gas jet. When the electron beam bombards the Ag target, the generated bremsstrahlung  $\unicode{x3b3}$-rays would further induce photofission ( $\unicode{x3b3}$, xn) reactions in the Ag target, as shown in Figure 1(a). Ag has two natural isotopes, ${}^{107}$Ag and ${}^{109}$Ag, with abundances of 51.8% and 48.2%, respectively. After the photofission reactions, the residual nuclei of ${}^{107}$Ag and ${}^{109}$Ag would be located at the nuclear ground state (radionuclides, ${}^{106}$Ag and ${}^{108}$Ag) and the nuclear excited state (isomers, ${}^{106\mathrm{m}}$Ag and ${}^{108\mathrm{m}}$Ag). Because the original generation position of neutrons is the same as the position of the residual product of Ag nuclei, the distribution of residual products can reflect the neutron source distribution. The radionuclides ${}^{106}$Ag and ${}^{108}$Ag have relatively shorter half-lives of about 23.9 and 2.4 min, respectively, and they will release K-shell X-rays ( $\sim$21 keV) via internal conversion and positrons (from hundreds of keV to $\sim$2 MeV) via ${\unicode{x3b2}}^{+}$ decay[46]. However, the half-lives of isomers ${}^{106\mathrm{m}}$Ag and ${}^{108\mathrm{m}}$Ag are about 8.28 days and 438 years, respectively, which are difficult for acquiring neutron distribution in a short time. Here, we utilized the positrons and the K-shell X-rays from ${}^{106}$Ag to diagnose neutron source distribution, because its half-life of 23.9 min is a little longer than the time of approximately 8 min for taking out the Ag converter from the vacuum chamber, and the products of ${}^{108}$Ag remained a little after nearly four half-lives. An MS-type IP was placed tightly on converters to measure the decay events distribution for 10 min, as shown in Figure 1(b), then this IP was scanned by a Typhoon-7000 IP reader with resolution of 25 μm.
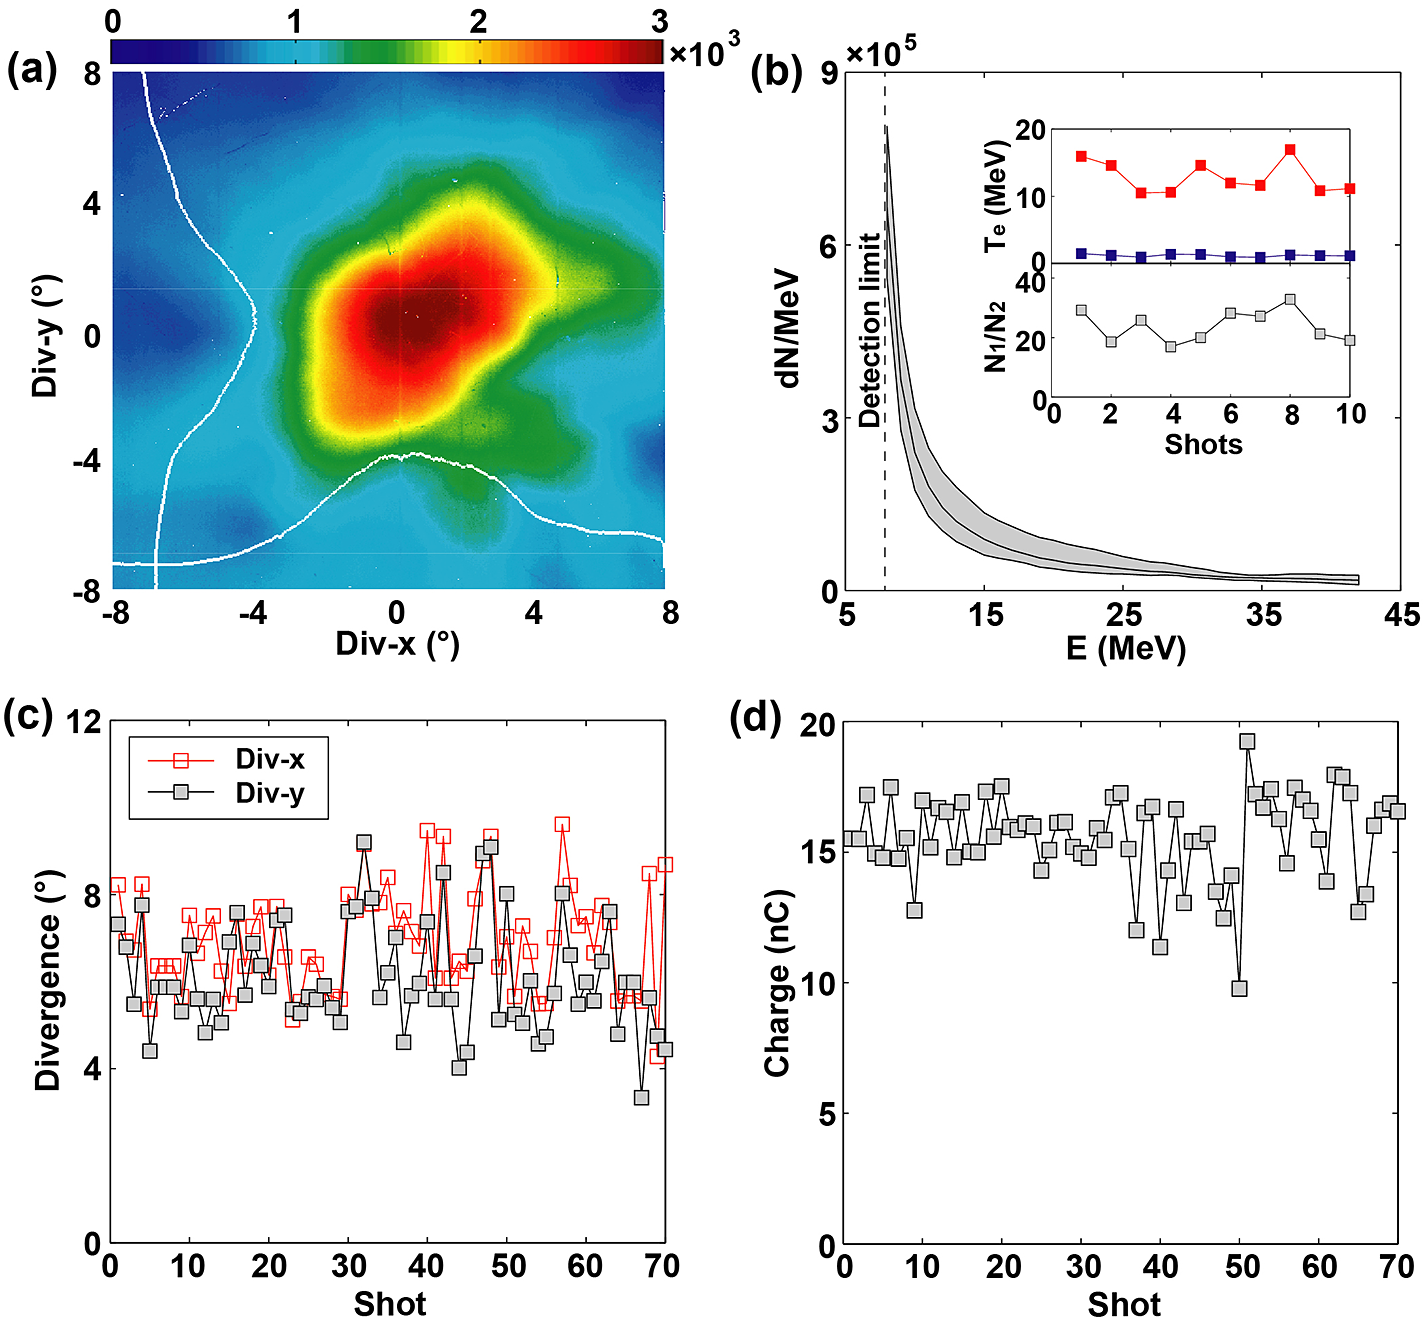
Figure 2 Experimental results of the electron beam at plasma density of 3.68 $\times {10}^{19}$ cm ${}^{-3}$. (a) Electron beam angular distribution (PSL value). (b) Electron beam energy spectrum of 10 continuous shots. (c) Electron beam divergence angle of 70 continuous shots. (d) Electron beam charge.
3 Results of laser–plasma wakefield acceleration electron beams
In order to generate a large charge and collimated energetic electron beam, we scan the nitrogen gas density. Due to the plasma bubble radius  $R=\frac{2c\sqrt{a_0}}{\omega_{\mathrm{pe}}}$ and the laser self-focusing power ${P}_{\mathrm{c}}\simeq 17\frac{n_{\mathrm{c}}}{n_{\mathrm{e}}}\left[ \textrm{GW}\right]$, where ${\omega}_{\mathrm{pe}}=\sqrt{4\pi {n}_{\mathrm{e}}{e}^2/{m}_{\mathrm{e}}}$ is the plasma frequency and ${n}_{\mathrm{c}}$ is the critical density, a higher density plasma is usually required to match the small laser focal spot ( ${w}_0\sim R$) for maintaining laser intensity and overcoming quick defocus[Reference Lu, Tzoufras, Joshi, Tsung, Mori, Vieira, Fonseca and Silva47]. Because the 27 TW tightly focused laser pulse is difficult to self-focus in low-density plasma, when the plasma density increases to $3.68\times {10}^{19}$ cm ${}^{-3}$ corresponding to ${P}_{\mathrm{c}}$ = 8 TW, the optimized electron beam charge could be up to approximately 20 nC and the divergence angle just approximately ${6}^{\circ }$ (Figures 2(a) and 2(d)). The electron beam energy spectra of 10 continuous shots are shown in Figure 2(b). They are fitted by using double temperature ${T}_{\mathrm{e}1}$ = 1.19 $\pm$ 0.19 MeV, ${T}_{\mathrm{e}2}$ = 12.88 $\pm$ 2.41 MeV, and the ratio of the total number of electrons at the two temperatures is ${N}_1/{N}_2$ = 23.90 $\pm$ 5.42, where the error represents the standard deviation. The electron beam divergence angle of 70 continuous shots is shown in Figure 2(c), where the divergence angles in the x and y directions are 7.0 ${}^{\circ}\,{\pm}\,$1.2 ${}^{\circ }$ and 6.1 ${}^{\circ}\,{\pm}\,$1.3 ${}^{\circ }$, respectively. Moreover, the electron beam charges are shown in Figure 2(d), in which the average charge is 15.59 $\pm$ 1.68 nC. We have found that a large number of electrons are ionization injected[Reference Pak, Marsh, Martins, Lu, Mori and Joshi48] into over 10 plasma bubbles, which means that the total beam charge can be increased about 10 times higher than the usual LWFAs; for details see Ref. [Reference Feng, Li, Tan, Wang, Li, Zhang, Meng, Ge, Liu, Yan, Fu, Chen and Zhang49].

Figure 3 Experimental results of neutron source spatial distribution. (a) Positron distributions of eight-piece silver plates. (b) Deduced neutron source on-axis distribution from the first silver plate. (c) Variation of neutron source size and positron charge with silver converter depth.

Figure 4 Optimized results of neutron source size. (a) Positron distribution comes from the front side of the Ag converter with 500 μm thickness. (b) Positron distribution comes from the back side. (c) Neutron time of flight spectrum. (d) Neutron energy spectrum.
4 Results of micro-source-size neutrons
4.1 Spatial distribution of the neutron source
In order to acquire the neutron source spatial intensity distribution, the optimized electron beam (Figure 2) is utilized to bombard the Ag stack, which is composed of eight-piece 200 μm silver plates and is placed 5 mm away from the rear edge of the gas nozzle. After the stack is irradiated by 20 electron beams at shooting repetition rate of 0.025 Hz, these Ag plates become activated via photofission reaction. The spatial distribution of the neutron source is deduced by measuring the distribution of activated products  ${}^{106}$Ag in eight pieces of silver plates. Due to the branch ratios of ${\unicode{x3b2}}^{+}$ decay and internal conversion being 59.1% and 24.4%, respectively, and the sensitivity of the MS-type IP to the positrons being about one order of magnitude higher than that to the K-shell X-rays[Reference Meadowcroft, Bentley and Stott50, Reference Chen, Back, Bartal, Beg, Eder, Link, MacPhee, Ping, Song, Throop and Woerkom51], almost all signals recorded on the IP are positrons.
The distributions of positrons in the eight Ag plates are shown in Figure 3(a), and these pictures are lined up from top to bottom along the electron beam propagation direction. According to the positron distribution on an Ag plate, the transverse distribution of the neutrons can be deduced, for example, see Figure 3(b), which is from Figure 3(a) P1. Therefore, the transverse size distribution of the neutron source at different depths can be reconstructed by positron distributions on different Ag plates, as shown in Figure 3(c). The neutron source transversal size increases quickly to approximately 3 mm (FWHM) due to the electron beam diverging in the converter within 600 μm depth, and then it decreases to approximately 1 mm due to the lower energy electrons quickly depositing in the converter and the higher energy wakefield electrons having smaller divergence[Reference Li, Li, Huang, Tao, Li, Zhao, Ma, Guo, Wang, Chen, Hafz, Zhang and Chen5]. Moreover, according to the positron charges from different Ag plates, the neutron source longitudinal distribution can be reconstructed as shown in Figure 3(c) (red line) . Due to the positrons being accumulated from one piece of activated  ${}^{106}$Ag plate, the longitudinal resolution for the neutron source is approximately equal to 200 μm. The neutron yield is increased to maximum at depth of 400 μm, and then it decreases gradually. In addition, the neutron source length (FWHM) can be estimated at about 700 μm from the neutron longitudinal distribution.

Figure 5 Energy resolutions for different neutron pulse durations: (a) 1 ns; (b) 36 ps.
4.2 Optimization of the neutron source size
The neutron source obtained with the above parameters of the converter has a transversal size of less than 3 mm (FWHM) and a longitudinal length of approximately 700 μm (FWHM). To further optimize the neutron source size, a thinner (500 μm) Ag converter is placed closer to the edge of the gas nozzle without affecting the process of the LWFA. The positron distributions measured from the front and back sides of the converter are shown in Figures 4(a) and 4(b), respectively. The optimized neutron transversal source size is less than 500 μm in FWHM, which fits well with the Gaussian distribution. The transversal size from the front side is slightly smaller than from the back. Moreover, the positron intensity measured from the back side is about 1.5 times higher than that from the front side, and thus the longitudinal source size can be approximately regarded as the target thickness (500 μm).
In order to acquire the pulsed neutron source duration and yield, a plastic scintillator detector is utilized to measure the neutron time of flight (TOF) spectrum, which is shown in Figure 4(c), and its experimental layout is shown in Figure 1. Due to the  $\unicode{x3b3}$-ray flash from the electron beam bremsstrahlung being too strong, lead bricks are piled up around the detector to prevent the neutron signal from flooding in the $\unicode{x3b3}$-ray afterglow of the scintillator. Considering the exponential decay of the long tail of the first dip in Figure 4(c)[Reference Zhang, Zhao, Yuan, Fu, Bao, Chen, He, Hou, Li, Li, Li, Liao, Rhee, Sun, Xu, Zhao, Zhu, Zhu, Zhang and Zhang52], the energy spectrum of the neutrons is as shown in Figure 4(d). The photofission neutron energy is mainly located in the range from hundreds keV to several MeV, which belongs to the category of a fast neutron source. Because of the large difference in the velocity of neutrons, the pulse duration of these fast neutrons would stretch after propagating a distance. The neutron pulse duration can be estimated by equation[35] $\Delta t=73\cdot d\left[\mathrm{mm}\right]\cdot \left(\frac{1}{\sqrt{E_{\mathrm{nl}}\left[\mathrm{MeV}\right]}}-\frac{1}{\sqrt{E_{\mathrm{nh}}\left[\mathrm{MeV}\right]}}\right)$[ps], where d is the propagation distance (or the converter thickness), and ${E}_{\mathrm{nl}}$ and ${E}_{\mathrm{nh}}$ are the neutron kinetic energy of the low and high velocity in this pulse, respectively. Therefore, the neutron original pulse duration is about 18.6 ps (FWHM) (for ${E}_{\mathrm{nl}}$ = 0.40 MeV, ${E}_{\mathrm{nh}}$ = 2.83 MeV), and the full pulse duration is about 36.0 ps (for ${E}_{\mathrm{nl}}$ = 0.40 MeV, ${E}_{\mathrm{nh}}$ = 2.83 MeV). The neutron yield has also been roughly estimated from the TOF spectrum. The scintillator detector has been calibrated by a Cf ${}^{252}$ fission source, and 1 ns $\cdot$V corresponds to about 20 neutrons. The area of the neutron signal is 5.38 ns $\cdot$V; thus approximately 107 neutrons have hit the detector. The detector has a surface area of 0.01 m ${}^2$, and it is placed 1.5 m away from the neutron source. Considering the neutron source is uniformly distributed at a 4 $\pi$ solid angle, its total yield is approximately $3.0\times {10}^5$ per shot.
5 Discussion
FNRR and FNAS have been widely used in security[Reference Overley, Chmelik, Rasmussen, Schofield and Lefevre53], industry[Reference Takenaka, Asano, Fujii, Mizubata and Yoshii54], special medical materials[Reference Fink, Micklich, Yule, Humm, Sagalovsky and Martin55], etc. FNRR is an imaging method that exploits the characteristic cross-section structures of different isotopes in the energy range of fast neutrons. When an inspected object is irradiated and it contains elements that possess sharp cross-section resonances, the transmitted FNAS will exhibit dips and peaks at specific energies that can reveal the elemental compositions and their distributions[Reference Vartsky, Mor, Goldberg, Bar, Feldman, Dangendorf, Tittelmeier, Weierganz, Bromberger and Breskinc31, Reference Ooi, Teshigawara, Kai, Harada, Maekawa, Futakawa, Hashimoto, Segawa, Kureta, Tremsin, Kamiyama and Kiyanagi32]. However, because of the fast neutron transversal source size, for example, spallation neutron source (mm–cm)[Reference Wang, Liang, Yin, Yu, He, Tao, Zhu, Jia and Zhang21], and the neutron source being based on a linear accelerator (~mm)[Reference Kuteev, Goncharov, Sergeev and Khripunov24, Reference Li, Zhang, Lin, Fang, Gu and Zhang56], the fast neutron radiography spatial resolution is usually limited to approximately of the order of mm. Here, the micro-size fast neutron source driven by the LWFA could improve the spatial resolution to hundreds of μm. More significantly, the pulse duration of the LWFA-based fast neutron is ultra-short and can be less than 100 ps, which has the potential to improve the state of the art of energy resolution ( $\textrm{ER}$) of FNAS by an order of magnitude.
The energy resolution of FNAS is usually determined by three facts, namely the detector timing resolution, detection distance and neutron pulse duration. At present, the scintillator BaF ${}_2$:Y crystal[Reference Chen, Zhang, Zhu, Du, Wang, Sun and Li57, Reference Gundacker, Pots, Nepomnyashchikh, Radzhabov, Shendrik, Omelkov, Kirm, Acerbi, Capasso, Paternoster, Mazzi, Gola, Chen and Auffray58] has realized a luminescence process with rise time of approximately 30 ps and decay time of approximately hundreds of ps, and it can distinguish the arrival time of radiation (i.e., timing resolution) within approximately 12 ps, which is sufficient for a 36 ps pulsed neutron source. Therefore, here we mainly discuss the effects of detection distance and neutron pulse duration on the energy resolution of FNAS, with the results shown in Figure 5. The farther the detection distance, the higher the energy resolution, for example, for the case of 1 MeV energy and 1 ns duration ( $\textrm{ER}$ = 27.5, 5.6, 1.4 keV @ 1, 5, 20 m). In addition, the higher the neutron energy, the lower the energy resolution, for example, for the case of 5 m and 1 ns ( $\textrm{ER}$ = 10.1, 52.8, 114.8 keV @ 0.5, 1.5, 2.5 MeV). However, it is still too difficult for a traditional fast neutron source with 1 ns pulse duration to acquire FNAS, which can exhibit the finer structure of some resonance absorption peaks[Reference Pomerantz, McCary, Meadows, Arefiev, Bernstein, Chester, Cortez, Donovan, Dyer, Gaul, Hamilton, Kuk, Lestrade, Wang, Ditmire and Hegelich14, Reference Ott, Vogel, Fernandez, Gautier, Mitura, Roth, Schoenberg, Menelle and Alba-Simionesco59]. For example, there is a resonance peak of ${}^{16}$O at approximately 1.65 MeV with typical FWHM of about 5 keV, which is from the theoretical calculation[60]. Fortunately, the LWFA-based neutron source (36 ps duration) has a great advantage in the accurate measurement of this kind of narrow absorption cross-section, because the $\textrm{ER}$ can reach approximately 100 eV @ 1.65 MeV and 20 m. Although the yield of the ultra-short pulsed fast neutron source based on LWFA is less than 10 ${}^6$ per shot, it is also feasible to acquire fine FNAS by accumulating enough shots, for example, hundreds of shots.
6 Conclusion
In summary, we have presented a method for generating a micro-size ultra-short pulsed neutron source via laser wakefield acceleration electron beam bombarding a thin metal converter, and also a method for measuring this neutron source spatial distribution by using the positrons emitted from the activated silver stack converter. A large charge of approximately 20 nC, tens of MeV, collimated electron beam has been produced via a tightly focused approximately 100 TW laser pulse transversely matched in dense plasma. Then, an ultra-short ( $\sim$36 ps) fast neutron source with small source size ( $\sim$500 μm) has been acquired by utilizing this intense electron beam to irradiate a thin silver converter. We have also investigated the application potential of this ultra-short neutron source in FNAS, and found it can optimize the current energy resolution dozens of times. This kind of LWFA based on a table-top neutron source is of great value to acquire fine FNAS experimental data, which is important to demonstrate the present theoretical model. Moreover, the micro-size ultra-short fast neutron source can play an important role in improving the spatial resolution and imaging contrast of FNRR.
Acknowledgements
This work was supported by the Science Challenge Project (No. TZ2018005), the National Natural Science Foundation of China (Nos. 11875191, 11991073, 11890710, and 11721404), the Strategic Priority Research Program of the CAS (Nos. XDB1602 and XDA01020304), the Key Program of CAS (Nos. XDA01020304 and XDB17030500), and the National Key R&D Program of China (No. 2017YFA0403301).


 Open access