
The elimination of child soldiering has been an international cause célèbre for fifteen years, after a 1996 United Nations (UN) report galvanized advocacy and action.Footnote 1 In this time, the UN and other international organizations have strived to build and enforce a new set of international norms, standards, and laws against the conscription or enlistment of children.Footnote 2 They have been remarkably successful. To take two high-profile examples, child recruitment is the main charge against Thomas Lubanga in the International Criminal Court's first case, and it is a central charge in the Special Court of Sierra Leone's pursuit of Liberian ex-president Charles Taylor.
International organizations have gone further, negotiating with and cajoling armed forces, and naming and shaming governments. Peacekeeping operations now include child rights training and protection in their missions.Footnote 3 Western governments have also restricted aid to governments who recruit children. Collectively, these efforts seem to have been successful in reducing state recruitment. The UN body charged with protecting the rights of children in conflict has negotiated, or begun a transition path, with every state accused of enlisting children.Footnote 4
International organizations also count many successes among nonstate groups. Yet child soldiering persists among insurgents, terror groups, and other armed forces. Between 2004 and 2007 alone, armed groups in twenty-one countries recruited children.Footnote 5 At present, children continue to be recruited in a familiar list of fragile states and territories, including Afghanistan, Iraq, eastern Congo, South Sudan, Darfur, and Somalia.Footnote 6 New conflicts in 2011 brought worrying reports of new child recruitment, including Ivory Coast and Libya.
Scholars of international relations study emergent norms such as that against child recruitment, and the forces that drive transnational advocacy networks to adopt them.Footnote 7 We use new theory and data to suggest how these norms might be enforced and aims achieved. Clearly third parties can limit recruitment (of children and adults) by helping to prevent conflict in the first place, or by achieving durable settlements, and it is here most scholarship has focused.Footnote 8 But assuming states and international organizations cannot eliminate warfare entirely, how might they mitigate recruitment, especially child soldiering?
Any answer requires a theory of why armed groups recruit children in the first place. To illuminate the problem and solutions, this article adapts theories of industrial organization to rebellious groups and explores new qualitative and survey evidence from Uganda, plus cross-national evidence on child soldiering. We have four aims: (1) to highlight the systematic links between competing theories; (2) identify the core incentives for groups to recruit children; (3) weigh which mechanisms dominate in practice; and (4) reexamine what policies can reduce conflict, coercion, and child soldiering. The results illustrate how important it is for advocates, policymakers, and military leaders (domestic or international) to understand the internal logic of armed groups—between leaders and recruits, and leaders and civilians—when setting policy, and suggest new approaches for norm enforcement and counterinsurgency.
But first, what exactly are we to explain? It is perhaps unsurprising that military forces routinely use children as servants, scouts, and support. Many forces, however, recruit large numbers of children as fighters, and these child recruits can be shockingly young and numerous. Consider the twelve armed groups for which survey data are available, in Liberia, Sierra Leone, Colombia, and Uganda.Footnote 9 In half of the groups, at least 20 percent of recruits were age fourteen or younger (the definition of a child for purposes of a war crime) and at least 40 percent of recruits were age seventeen or younger (the definition of a child in much international human rights law). In three of the twelve groups, children aged seventeen or younger were the majority of fighters.
This pattern is puzzling. If we compare a twenty-one-year-old and a thirteen-year-old, for example, the adult generally possesses superior strength, weight-bearing ability, reasoning, and judgment. In any conflict that involves sustained fights, large amounts of ammunition, mobile units, or foot travel over significant distances (that is, most rural insurgencies) children and adolescents are likely inferior at the required tasks. Children, it can be argued, are able to carry the increasingly light automatic weapons used in modern war.Footnote 10 But, with lower weight and smaller stature, young children have difficulty handling recoil, and shooting accurately.Footnote 11 So why do some armed groups systematically prefer children over adults, while others do the opposite?
Advocates and academics have also observed that recruits, especially child recruits, are often threatened, abducted, and abused.Footnote 12 Indeed, new data on African rebel groups, presented in this study, suggest that coercion and child recruitment go hand in hand: all groups that forcibly recruit also employ child soldiers, on average two to three times as many as groups that do not forcibly recruit. Thus this study also investigates under what circumstances recruitment is coercive, and why coercion is often directed at children.
Several explanations are especially influential, almost canonical. One, noted above, stresses the worldwide proliferation of light automatic weapons. Another highlights the sheer abundance of young recruits, as overpopulation has made children a cheap, limitless, and renewable resource.Footnote 13 Correct or not, these explanations do little to explain the variation since 1980 or 1990, or (more importantly) variation across armed groups exposed to the same demographic and technological trends.
Another canonical account stresses the brutality and irrationality of “new wars,” especially in reports on Africa.Footnote 14 Child soldiers, the story goes, are a manifestation of the growing barbarity of war. We argue, however, that barbaric acts are not necessarily illogical ones. Too many armed groups recruit large numbers of adolescents for long periods of time for irrationality to be a full or satisfactory explanation. We look instead for the logic in child coercion, and find method in the madness.
Recruitment, especially coercion, requires us to understand the incentives of the rebel leader as well as the recruit. We start from the notion that rebel leaders are minimally rational—that is, calculating, self-interested, and maximizing—and ask under what circumstances child recruitment and coercion will be optimal strategies. One answer is obvious: children will be recruited if they are more effective fighters than we suppose. Scholars commonly argue that children lack the fortitude to fight.Footnote 15 Nevertheless, scattered accounts, including testimony from rebel officers, attest to children's bravery, stamina, and stealth.Footnote 16 If children are as effective at fighting as adults then, given the disproportionate number of young people in poor countries, we should not be surprised to find a disproportionate number in armed groups.
We find relatively little evidence for this view. Our interviews and data from the Lord's Resistance Army (LRA) in Uganda suggest that children take longer to train and are less likely to be made fighters, at least until they grow older. Our theoretical framework, moreover, suggests that if children are as able as adults then they should be rewarded rather than coerced. Yet we observe the opposite association.
Instead, the evidence favors an alternative argument: children are easier to mislead and indoctrinate, cheaper to retain, and more responsive to coercive methods. Journalists, advocates, and academics have voiced dozens of arguments along these lines. Many note that remuneration will be lower if children have relatively poor civilian employment and educational opportunities.Footnote 17 Others suggest that children are more willing to fight for nonpecuniary rewards such as honor and duty, revenge, a sense of purpose, or protection.Footnote 18 Finally, some argue the young are more malleable, adaptable, and obedient; hence they are easily indoctrinated and deceived, and so simpler to control and retain.Footnote 19 Developmental psychology provides some support for these claims: lab experiments suggest that adolescent social and brain development may lead them to be more conformist and easily influenced.Footnote 20
This article begins by systematizing these disparate accounts into a principal-agent model with imperfect information, with rebel leaders as the principal and a civilian as the agent. In order to capture the main theories of child and coercive recruitment, our model departs from standard models in several ways: we allow punishments to be used as an incentive; we allow for the possibility that a rebel leader can “indoctrinate” recruits, so that they have a lower disutility of fighting; and we allow for the possibility that the principal can shape a recruit's expectations through misinformation.
A formal model is useful for a few reasons. Most of all, it is helpful to see that seemingly disparate explanations of child soldiering are actually different facets of a single unified model. This gives us and future researchers a useful way to simulate and understand armed organization and recruitment. It also facilitates tests of some mechanisms over others. We do not model all possible explanations for child recruitment (or recruitment in general) but hope that our model becomes a point of departure for further theorizing on armed organization and action.Footnote 21
Our model also yields several crucial insights and predictions. First, so long as children are less able guerillas than adults, child recruitment is never optimal under basic principal-agent assumptions; we need at least one “nonstandard” assumption to hold true: children must be easier to indoctrinate, or they must have a lower outside option, for example, because they are more easily misled or have a lower probability of successful escape. Second, punishment or coercive recruitment is more likely when recruits have poor outside options and coercion is “cheap”—as when there is little civilian support to lose, or foreign powers insensitive to human rights violations fund the movement, or when militaries fail to protect civilians.Footnote 22 Finally, we see that these margins—relative ease of manipulation, difficulty of escape, cheapness of coercion, and poverty of outside options—are not only crucial, but also mutually reinforcing.
These mechanisms and margins are plausible in theory, but which, if any, are important in practice? The second half of the article explores new empirical evidence on child soldiering and tries to weigh which of the mechanisms are most influential in reality. We mainly draw on a case study and new micro-level data in Uganda, where the LRA forcibly recruited thousands of youth and plied them with threats and violence to make them stay. The evidence suggests that child recruits were less able than adult ones, so superior ability is not a driving force of child soldiering in this case. Rather, the Uganda data and interviews suggest that children were retained because they were more easily indoctrinated and misinformed than adults, and had more difficulty escaping—with ease of indoctrination being especially influential.
Finally, we look across conflicts, developing a new database of African rebel groups and running “cross-rebel regressions.” Cross-rebel analysis is in its infancy, most of all because of the scarcity of data, and so we treat our findings as provisional, to be expanded in future research. But initial data from a random sample of groups display two relationships consistent with our model. First, where we observe child recruitment we also tend to observe forcible recruitment (one of the most easily measured forms of coercion). Second, forced child recruitment is most common when punishment is cheap.
Both the theory and empirics suggest several new strategies to counter insurgency and discourage child recruitment, including the importance of relative reintegration opportunities (for children versus adults), and also a more novel strategy: counterpropaganda and escape training. International policy has been mainly concentrated on a single margin: increasing the cost and risk to rebel leaders of committing war crimes. We show that this approach is effective but probably not sufficient, and that there are other margins being ignored, such as the ability to counter the indoctrination and misinformation strategies that rebels employ. Several grassroots innovations in Uganda exemplify these new approaches and could be replicated and scaled internationally. They succeeded because they understood local incentives and conditions, and recognized that recruitment is a strategic interaction between rebel leaders and civilians, that leaders respond to incentives, and that victims have agency and can be empowered—important lessons, we argue, for international policymaking and advocacy in general.
Modeling Child and Coercive Recruitment
Theoretical Approach
For simplicity, we focus on a rebel leader's marginal recruitment decision and the strategic interaction between the leader and the potential recruit, taking a principal-agent approach. Previously, civil war scholars tended to concentrate on the citizen's voluntary decision to fight, and the collective action problem therein: why do citizens engage in risky fighting when they could stand back and still enjoy the fruits of victory?Footnote 23 While crucial to our understanding of popular revolts, the approach has limitations: it does not help us explain forced recruitment; it focuses on the citizens' decision to participate but ignores their decision to exert effort; and it does not address the leader's ability to choose recruits and incentivize performance.
To model both illicit organizations and the recruitment of children, we extend and simplify two moral hazard models proposed by Chwe and Gates.Footnote 24 Our motivation is simple: by understanding this strategic interaction, one can better plan counteraction and predict the consequences of policy.
While economists have long studied coercion, slavery, and indentured labor, the strategic logic of coercion was largely ignored. Recently, however, researchers have applied principal-agent theory to understand coercive contracts. Feudal lords and slave-owners, for instance, may use their territorial and institutional control, and monopoly on violence, to reduce the reservation utilities of serfs and slaves (their payoffs to escape), making it optimal to stay.Footnote 25 Likewise, Chwe examines child workers in England's Industrial Revolution. He notes that children were more likely to be beaten than adults, and asks under what circumstances contracts will employ pain as an incentive. Using a principal-agent model, Chwe shows that the optimal contract will provide money rather than pain when a worker's reservation utility is high; otherwise those workers will run away. Children, who had poor outside options, would suffer punishment and still participate.
These models have three drawbacks in the context of rebellion. First, they focus on how principals use punishment to lower the “outside” options of their agents. This simplification makes sense when the principals—industrialist, lord, or slave-owner—has the state on their side and can exert some control over the payoffs of agents that are not directly overseen by the principals. Illicit organizations, however, such as rebel groups, seldom control territory or institutions; they have power only over incentives and expectations within the organization. Second, these models treat agents as fully rational and informed. This assumption may be reasonable when modeling adults and employment, but we are hesitant to assume the same of children. Third, these models do not allow for the difficulty or costliness of coercion to vary, as might occur through institutional and technological change, or through domestic and international advocacy and action.
We develop a model that brings coercion into the “inside” option, so that violence is used as an incentive. We allow ability, ease of manipulation, and reservation utilities to vary by type (in this case, children and adults). We also include a parameter that represents the costliness of war crimes—in our case, the use of coercion and punishment in recruitment—which could in principle vary across time and place.
Structure and Equilibrium of the Model
A rebel leader can choose between two kinds of agents—children and adults—who can have different abilities. We focus the narrative and our data analysis on battlefield tasks, such as fights and raids, where the use of children is most puzzling. For a given task, leaders choose both the type of agent they want and the optimal incentive to offer (rewards or punishments). Given this incentive, the agent chooses whether to exert effort. Both the agent's effort and ability affect the success of that task. But the leader observes only whether the task was successful or not, and not the agent's effort. The leader thus faces a moral hazard problem.
To model “indoctrination,” we allow the disutility of effort to be lower for children than adults (in that they can be pushed to value the same goals as the rebel leader). Also, to allow for the fact that children's outside opportunities may differ from that of adults, we endogenize reservation utility, allowing it to vary by age. Both extensions, we will see, are central to the child soldiering story. Indeed, many of the theories of child soldiering discussed in the introduction can be located in this partial equilibrium model. To keep matters straightforward, we ignore the general equilibrium effects (for example, endogenous wages in the nonrebel economy) and the role of the opposing force (the government counterinsurgency), leaving both for future research. New research has begun to look at labor supply and demand for children in war, and this agenda is an important complement to the micro-level analysis here.Footnote 26
Specifically, we consider a strategic interaction between a rebel leader and a recruit of type θ (which captures the recruit's effectiveness as a soldier) where the recruit can be either an adult with θ = 1 or a child with θ = y. We assume that 0 < y ≤ 1, implying that a child can be as able as or less able than an adult.
The leader has to make two choices: (1) whether to recruit a child or an adult, and (2) what rewards or punishments are given to the recruit once a “good” or “bad” outcome has been obtained for the leader. The leader chooses u G, which the recruit receives if the leader achieves the “good” outcome, and u B, which the recruit receives after a “bad” outcome. Both u G and u B can be positive (a reward) or negative (a punishment). Simultaneously providing costly punishments and rewards for the same outcome is never optimal.Footnote 27
The recruit chooses an effort level a ∈ [0,1]. The “good” outcome G for the leader (for example, a victory on the battlefield, or a successful raid) obtains with probability θa, which is increasing in (unobserved) effort and the recruit's type. The “bad” outcome B occurs with probability 1 − θa. Expected utility for the recruit is the expected reward/punishment minus the disutility of effort:
 $$
\theta au_G + (1 - \theta a)u_B - \theta ^n a^2
$$
$$
\theta au_G + (1 - \theta a)u_B - \theta ^n a^2
$$where the cost of effort takes a quadratic form, and n ≥ 0 is an “indoctrination” parameter that, for n > 0, implies that a child can be indoctrinated to provide effort at a lower cost than an adult.Footnote 28 We normalize the leader's payoff from the “good” outcome to 1 and from a “bad” outcome to 0, and assume that the leader's cost of rewards and punishments is also quadratic. We do not explicitly assume a budget constraint, but the normalization of the leader's payoff from the preferred outcome implies a bound on the leader's ability to absorb costs (that is, the leader never incurs costs greater than 1).
The leader's expected utility is simply the expected value of each outcome minus the cost of rewards/punishments:
 $$
\theta a(1 - u_G^2 ) + (1 - \theta a)( - \hat ku_B^2 ),{\rm where }\hat k = \left\{ {\matrix{
k \hfill & {{\rm if }u_B < 0} \hfill \cr
1 \hfill & {{\rm otherwise}} \hfill \cr
} } \right.
$$
$$
\theta a(1 - u_G^2 ) + (1 - \theta a)( - \hat ku_B^2 ),{\rm where }\hat k = \left\{ {\matrix{
k \hfill & {{\rm if }u_B < 0} \hfill \cr
1 \hfill & {{\rm otherwise}} \hfill \cr
} } \right.
$$The parameter k ≤ 1 is crucial and captures the extent to which punishment (u B < 0) is cheaper to provide than rewards—for example, because of changing technologies of punishment, international pressures (or, conversely, neglect), and the domestic constraints that populations or institutions place on rebel leaders.Footnote 29
Recruits determine their optimal effort a by equalizing their marginal cost and marginal benefit of effort, known as the incentive compatibility constraint,
 $$
u_G - u_B = 2\theta ^{n - 1} a
$$
$$
u_G - u_B = 2\theta ^{n - 1} a
$$and by checking if minimal (a = 0) or maximal (a = 1) effort are optimal.
We also assume that a participation constraint has to be met for recruits in order for them to be retained by the rebel group at all. Recruits' utility has to be at least as high as their reservation value u(θ):
 $$
\theta au_G + (1 - \theta a)u_B - \theta ^n a^2 \ge \underline u
$$
$$
\theta au_G + (1 - \theta a)u_B - \theta ^n a^2 \ge \underline u
$$where u ∈ ℝ.Footnote 30 We abbreviate u(θ = 1) = u H and u(θ = y) = u L and let u L ≤ u H. Here the recruit's outside option captures earnings that a recruit could obtain in the nonrebel economy (including aid), the probability that a recruit can escape successfully, and misinformation about the outside world propagated by the rebel leader.
The leader's problem is to choose the recruit's type, incentives, and (indirectly) agent effort, subject to the incentive compatibility and participation constraints in equations (3) and (4). We assume that the leader can choose to refrain from recruitment entirely and obtain a payoff of 0, and we assume that the leader prefers this strategy over others that yield the same utility. We also assume that the leader makes a correct forecast of the cost of punishment. We illustrate the solution and comparative statics graphically here, with a full solution and proof available online.Footnote 31
Comparative Statics in Equilibrium
Minimum conditions for child soldiering
If a child recruit is just as able as an adult, the model is trivial to solve: rebel leaders will be indifferent between the two, recruit either, and offer the same incentives. However, as we discuss in the introduction and the empirical section below, there is little evidence for this view. Children appear to carry several disadvantages in warfare, especially mobile insurgencies, and the LRA treatment and evaluation of children is consistent with this. Likewise, rebel leaders appear to systematically recruit and reward children differently than adults. In particular, children are more likely to be coerced. We do not dismiss the possibility of equally able children, as there are some tactics and some conflicts where children possess advantages or parity (for instance, lookouts and messengers in urban insurgencies or gangs). We concentrate, however, on the case where children are less able than adults, and then consider variation in ability y (for instance, what happens as children get older, or are used in tasks or conflicts where they are relatively more effective).
A key insight of the model is that, if children's ability is less than that of adults, one of two conditions has to be met for child soldiering to be optimal: either leaders must be able to indoctrinate children so that they contribute effort at a relatively lower cost, or the reservation value for children is lower than that for adults and this ease of retention compensates for a child's relative lack of ability.
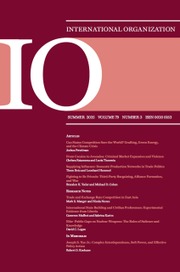
To see this, observe that child soldiering is never optimal if neither of these conditions is met. Figure 1 plots the leader's expected utility against the ability level of any potential child recruit. We display the leader's utility for low (k = .05) and high (k = 1) costs of punishment, where a higher k could be consistent with domestic or international penalties for war crimes. The figure indicates that the leader prefers to recruit an adult for any possible level of children's productivity (with the exception of the upper bound y = 1, at which point children and adults are indistinguishable). This is true even in a domestic or international environment that fails to make war crimes costly.
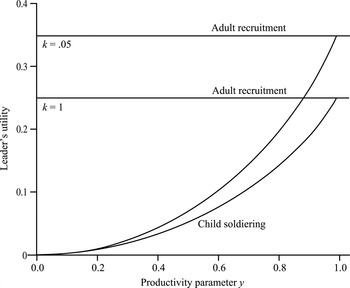
FIGURE 1. Leader's utility, by recruit type and punishment cost
Note: Graph assumes no indoctrination (n = 0) and no difference in reservation values (u H = u L = −0.2).
Role of indoctrination
Next, we consider the case where the leader can indoctrinate children (n > 0). Figure 2 plots the leader's utility for different child ability levels, but we set the indoctrination parameter n on the horizontal axis. For positive n, children can engage in rebel activities at a relatively lower cost of effort than adults. As n gets large, child soldiering becomes the leader's optimal strategy. The ability to indoctrinate less able recruits can turn them into attractive targets for recruitment.
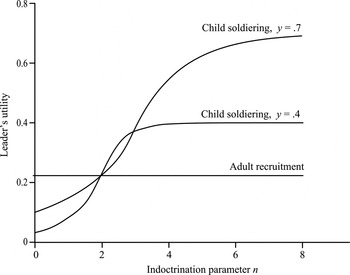
FIGURE 2. Leader's utility when indoctrination is effective
Note: Graph for k = 1 and u L = u H = 0.
The relationship between the ability to indoctrinate and child soldiering is strengthened if punishment becomes cheap (that is, is not penalized). Figure 3 plots the leader's utility against indoctrination parameter n, as before, but for different values of k and different values of child ability y. Child soldiering becomes optimal at the points at which the curved lines intersect the horizontal line (the leader's payoff from recruiting an adult).

FIGURE 3. The effectiveness of indoctrination as punishment becomes cheap
Note: Graph for u H = 0, u L = −0.2
Intuitively, the more able children are or the more child-friendly the task (that is, higher y), the more child soldiering. Child ability is not simply a function of physiology but can also be influenced by technology. For instance, we could view the invention or increased availability of light automatic weaponry in the late twentieth century as causing an upward shift in y.
If children are sufficiently effective fighters and the leader can inflict punishment at low cost, then even small amounts of indoctrination can translate into child soldiering. By bringing a child's values and effort in line with the rebel leader's objectives (modeled here by a lower disutility of effort), indoctrination makes it easier for the rebel leader to satisfy both the incentive compatibility and the participation constraints.
Relative outside options
We can also consider the case where adults and children have different outside options, which can lead to child soldering even if the leader is unable to indoctrinate recruits at all. Figure 4 plots the leader's utility against the distance in reservation values between adults and children.
FIGURE 4. Leader's utility when adult-child reservation values differ
Note: Graph for n = 0, k = 1, u H = 0.3, u L = (0.3 − value on x-axis).
A difference in outside options could correspond to a real difference in opportunities, such as differential education and employment opportunities for adolescents versus adults, but also different reintegration programs, or different abilities to reintegrate into the community and family. These differences could also be perceived—for instance, if children are more easily misled about their outside prospects than adults. As we move along the horizontal axis of Figure 4, children are more and more easily retained in comparison to adults because of a greater difference in real and perceived outside options. At the point at which the two plotted lines cross, the ease with which a child's exit from the rebel group can be deterred outweighs the child's lower ability relative to an adult recruit.
Note that cheap punishment—such as an absence of international or domestic penalties—compounds this effect and decreases the size of the gap between reservation values that is necessary for child soldiering to be an optimal strategy for the rebel leader. Figure 5 illustrates this result and repeats the previous graph for different values of k and different values of y. For sufficiently low k, child soldiering becomes the leader's preferred strategy when it would not be the case otherwise.

FIGURE 5. The impact of differing reservation utilities as punishment becomes cheap
Note: Graph for n = 0, k = 1, u H = 0.3, u L = (0.3− value on x-axis).
The model implies that advocates and policymakers must pay close attention to the relative opportunities for adults versus children, not merely absolute opportunities. If adult employment or wages grow faster than those for adolescents, or if school reconstruction lags, or if (as has sometimes been the case) demobilization programs are more generous to adults, then policymakers could unwittingly increase the incentives for rebels to shift to younger recruits. As we show, policymakers may also be able to do more to shift perceived options than commonly believed, adding a new policy lever.
Coercion and child recruitment go hand in hand
Finally, the model demonstrates that coercion is visited upon child soldiers to a greater extent than adult recruits. To see the intuition for this result, note that if child soldiering is possible, then cheap punishment will make it more likely, as suggested above. But this leads to a situation in which the leader's costs for a child soldier tend to generate more punishment than the leader's costs for an adult soldier, with the consequence that the rebel leader motivates child soldiers more than adults by threatening (and imposing) punishment.
To summarize, we expect child soldiering to be the result of the ease with which children can be indoctrinated by rebel leaders and children's (often manipulated) perception that they have poor outside options. A reduction in the cost that rebel leaders pay for punishing their recruits exacerbates any trend toward child soldiering.
We can extend the logic of the model and offer plausible conjectures about other factors that we do not take into account explicitly. For example, we could incorporate popular ideological support for the rebel group among adults as a reduction in the cost of effort for an adult recruit. This would mitigate the effects of indoctrination and reduce the likelihood of child soldiering. We highlight the indoctrination of children and the ease with which they can be retained not because these are the only determinants of child soldiering amenable to game-theoretic analysis, but because they offer a particularly compelling account of empirical patterns discussed below.
Empirical Strategy
The theoretical framework hinges on several crucial assumptions, each with a relatively weak and anecdotal base of evidence. One is that child fighters are usually less able than adult fighters. A second is that children are more susceptible to manipulation. A third is that coercive recruitment varies with the costliness of punishment. Data on labor coercion and child recruitment are rare, which is one reason why nearly all of the theoretical literature discussed here has remained theoretical, motivated mainly by historical narratives and cases. One of the few quantitative studies shows that security forces in refugee camps diminish child recruitment, suggesting that rebel leaders respond to incentives, but leaves open why they sought children at all.Footnote 32
This article uses new data and three main empirical strategies to establish the reasonableness of these assumptions and the overall framework. First, we intensively study the case of one rebel group, the LRA, one of the most notorious child recruiters. We use dozens of interviews with former LRA recruits along with a representative survey of survivors to examine leader motivations as well as recruitment, command, and control strategies.
Second, we use the unusual nature of LRA forced recruitment—a uniform, coercive strategy of abduction and violence imposed nearly at random to youth of different ages—to assess the reasonableness of the “ease of manipulation” assumption at the center of the theory, as well as which forms of manipulation were especially effective and why. Our survey of LRA survivors collects self-reported measures of each of these mechanisms—belief in LRA ideology, disinformation received, and escape experiences—and compares responses by age of abduction.
Finally, a handful of the model's predictions are cross-national, helping to predict what types of groups and environments will lead to child soldiering. At least two determinants should vary across conflicts and groups: the cost of punishment, and reservation utilities for the average child and adult. We focus on the former, measuring the factors that influence cost of punishment across rebel groups, and look for correlations with child and coercive recruitment.
Case Study: Child Recruitment in Northern Uganda
Background
The LRA has fought a low-scale guerrilla war against the government of Uganda since 1988. The rebels have been led by Joseph Kony, a spirit medium of the Acholi tribe. They have sought a spiritual cleansing of the nation and a return to the political dominance that northern tribes enjoyed for the two decades following independence.Footnote 33
Civilian support for the LRA was meager from the start, even among Kony's fellow Acholi. Initially, Kony pulled together a few hundred hardened fighters, the remnants of other rebel groups. Unpopular and poorly equipped, these fighters raided the homesteads of their co-ethnics for food, medicine, and recruits, where small roving bands forcibly recruited youth in nighttime raids on rural homes. From 1988 to 1994, the LRA stole several thousand youth.
With few natural resources, and declining popular support, the rebellion might have died out were it not for the government of Sudan, which in 1994 began providing the LRA with arms and territory on which to build bases. Khartoum's aim was to destabilize northern Uganda in retaliation for President Yoweri Museveni's support for southern Sudanese rebels (the Sudan People's Liberation Army).
Khartoum's support invigorated the LRA, and attacks and abductions escalated. Tens of thousands of Ugandan youth, mainly adolescent males, were abducted after 1994. Young women were also taken to become fighters, servants, and wives.Footnote 34 The vast majority of abductees, roughly 82 percent, eventually escaped and survived. A few hundred abductees are thought to remain in the bush—less than 1 percent of the estimated 60,000 to 80,000 abductees.Footnote 35 The rest, tragically, are presumed perished.
LRA activity peaked in 2002 when the Ugandan army drove the LRA from Sudan into Uganda, and intense fighting continued through 2004. Defeat suffered since that time has kept the LRA small and on the move, principally in the eastern Democratic Republic of the Congo (DRC) and once again in southern Sudan. They ceased abduction in Uganda by 2005.
The LRA is sometimes held up as the archetypal barbaric, apolitical rebel force of Africa's so-called new wars. Close observers of the LRA, however, see the method in Kony's madness.Footnote 36 While LRA tactics were undoubtedly distorted by spiritual beliefs and ideology, our evidence testifies to the strategic logic of LRA coercion and child recruitment.
Data
We conducted qualitative interviews with more than 100 former abductees, twenty community and clan leaders, and twenty-five commanders from the Ugandan armed forces and the LRA over ten months in 2005–2007. Among the LRA, our subjects were foot soldiers and midranking officers, including junior commanders, catechists, spies, “wives,” bodyguards, and even accountants. Interview subjects were contacted through key informants, such as village leaders, and are not necessarily representative of all rebels. Returned senior commanders were not interviewed because their colleagues had recently been indicted by the International Criminal Court and we believed their testimony would be compromised as a result.
We also conducted a population survey in concert with a nongovernmental organization (NGO), a psychologist, and human rights scholars. A first survey, in 2005, targeted males born in the Districts of Kitgum and Pader between 1975 and 1991, and a second round in 2007 interviewed the same cohort of females. The survey collected self-reported, retrospective information on war and abduction experiences, as well as current well-being.
To minimize attrition from migration and mortality, we selected respondents retrospectively, from a sample frame of youth living in the region before escalation of the war. We randomly sampled 1,162 households in eight clusters, using the earliest sample frame available: UN World Food Programme lists compiled in 2002. Of the random sample of households, 88 percent were found. Enumerators worked with household heads to develop a roster of all youth living in the household in 1996, a year easily recalled as the date of the first election since 1980. Using these rosters, 881 surviving males were randomly selected and interviewed in 2005–2006 and 857 females were selected in 2007. Former abductees were oversampled in both cases.
More than a third of target respondents had moved since 1996, and enumerators tracked them to their current locale. Seven hundred forty-one males and 619 females were found, including 688 abductees. Thus there are two sources of attrition. A first is mortality (including not returning from abduction, which in nearly all cases implies death): 29 percent of male abductees and 12 percent of female ones perished since 1996. The second is failure to locate migrants: we tracked but were unable to locate 9.4 percent of male abductees and 18.3 percent of female abductees. Female absenteeism is higher because of migration for marriage, the return from displacement that began in 2006, and the time elapsed since the 2005 rosters.
The second column of Table 1 lists key summary statistics for the major incentives, roles, attitudes, length of stay, and manner of departure reported by formerly abducted youth. The numbers in subsequent columns are the subject of figures or listed in Table 1 and employed in the regression analysis.
TABLE 1. Self-reported abduction experiences in the LRA

Note: Robust standard errors in parentheses.
*** p < .01;
** p < .05;
* p < .1.
1. Abduction is unit of analysis. Excludes released abductees.
2. Data available for males only.
3. Omits abductions less than two weeks.
LRA Recruitment, Command, and Control
Forced recruitment by the LRA was large-scale and indiscriminate. Rural Acholi households live in scattered rural homesteads at some distance from their neighbors. Typically, abduction parties of ten to fifteen guerrillas would swing down from their Sudanese bases to conduct military missions several weeks in length, raiding homesteads in their path for loot and recruits. Roughly two in five males and one in five females of age fourteen to thirty report they were abducted for at least an hour. abduction length ranged from no more than a day to ten years, averaging roughly nine months for males and females, including multiple abductions (Table 1).Footnote 37 The LRA would begin training abductees as fighters within a few weeks of abduction, including firearms training. Those who had not escaped within the first two weeks were entrusted with their own weapon after an average of 3.5 months.
The LRA focused on abducting young adolescents. Figure 6 illustrates the distribution of age at the time of recruitment. Three times as many fourteen-year-olds were abducted than nine-year-olds or twenty-three-year-olds. The preference for adolescent boys holds true even after adjusting for the disproportionate number of young people in the population; a fourteen-year-old youth in the study population had a 5 percent average chance of abduction—twice the risk faced by those of age nine or twenty-three.
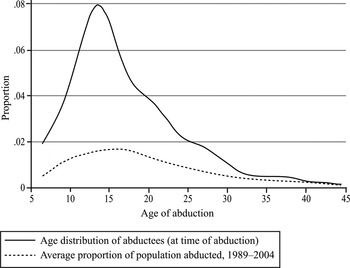
FIGURE 6. Distribution of age at the time of abduction in the LRA
Note: Data include absentee youth and youth who have since died or did not return from abduction. Multiple abductions are included. The proportion of the population abducted by age is calculated by dividing the number of youth abucted at each age in each year by the total number of youth in the population of that age in that year, and calculating the running-mean over all years via symmetric nearest-neighbor smoothing (bandwith = 0.5).
The focus on adolescents is more pronounced once we account for release. LRA raiding parties commonly abducted all able-bodied members of a household to carry looted goods, but were often under explicit instructions from Kony to release children under age eleven and adults older than their mid twenties, once loot was delivered safely. Fifteen percent of abductees were released in the first two weeks of abduction. Figure 7 displays a running mean, by age of abduction, of the deviation from the average probability of release (adjusted for location and abduction year). Release is highest for children under age ten, dips sharply for adolescents, and is rising in age thereafter.

FIGURE 7. Probability of being released in the first month of abduction, by age of abduction
Note: The solid line is a running-mean calculated via symmetric nearest-neighbor smoothing with a bandwidth of one. The dotted lines represent the 95% confidence interval. Data do not include absentee or nonsurviving youth. Multiple abductions enter individually.
The impoverished LRA seldom provided material incentives. Just 5 percent report they were ever rewarded materially (Table 1), almost always meagerly, and mainly through extra rations. Money or loot was rarely given, even to officers. Such rewards were promised upon victory, however. “They used to tell us,” said one abductee, “that if we fight and overthrow the government then we would get wealth, and even the young soldiers would get high ranks.” Many long-term abductees appear to have been convinced, at least for a time, of these future gains. As we discuss, the gradual realization that no gains would come would lead many to abandon the group at a later date.
Violence and the threat of punishment were the main instruments of control in the LRA, and even short abductions involved exposure to significant brutality. Real and threatened death and injury were among the primary means of dissuading escape and motivating performance. “In the bush,” explained one youth abducted for two years, “you do things out of fear.” Fifty-four percent of abductees were severely beaten (versus 12 percent of nonabductees) and 24 percent report being attacked with a weapon (versus 3 percent of nonabductees). Beatings or death were the punishment for attempted escape, a sentence other abductees were often forced to carry out with weapons. Fifty-five percent of abducted youth report that abductees were “often” or “sometimes” forced to beat or kill new arrivals.
Initiation sometimes involved the forced commission of violence; 26 percent of abductees were forced to harm or kill a civilian, and 23 percent were forced to desecrate dead bodies—a deeply held taboo. One two-year abductee described a sadly typical event in the first weeks of his abduction: “During training, 22 of us were told to beat a man to death. But after hitting him twice each, we were told to leave him. He was almost dead. [Later] … we were all told to pinch the ear of the dead man and skip over him.” In the worst cases, these victims were not strangers. Twelve percent of abductees report being forced to kill a family member or close friend (forced to harm family in Table 1). Such extreme violence served to break down abductees' psychological defenses and desensitize them to violence. More importantly, it bound them to the group, by raising the specter of family and community rejection if they were to flee.
Other forms of misinformation were used to promote fear and loyalty. Abductees were told that, if they escaped, rebels would return and kill them or their family. Youth forced to kill were also told that they would be exiled from their home communities. Another example comes from the LRA's reaction to the Ugandan government's offer of amnesty to all but the most senior LRA officers (first extended in 2000). In response, interviews suggest that Kony immediately banned the possession of radios by his troops and kept amnesty a closely held secret, even from officers. Abductees who had heard of amnesty were told that it was a ruse and that any who escaped would be killed by the army.
The LRA also limited escape opportunities by moving the abductee as far as possible from home. More than half of abductees were tied in their first days of capture, and the first day's march would deliberately backtrack and disorient. Abductees were taken to the bases in Sudan as quickly as possible, where escape was nearly impossible because of the distances, disorientation, and the hostile SPLA.
Spiritual practices were also central to motivating recruits—an explicit attempt to create new social bonds and loyalty based on a shared cosmology (as well as fear). Kony created a cult of mystery and spiritual power that few Acholi question even now. Those with whom we spoke disagreed not on whether Kony possesses spiritual power, but rather whether these spirits are good or bad, and whether they could be overcome. These purported powers were used to instill fear, awe, and loyalty. A spiritual initiation ceremony, typically featuring prayers and anointment with oil and prayers, was reported by the vast majority of those taken two weeks or longer.
The LRA was highly structured, with detailed spiritual restrictions on personal conduct (for example, eating, drinking, and bathing) and on military practices. These restrictions were couched in spiritual terms and were typically designed to establish fear and a new identity. One abductee in our sample explained that, “In the bush we were not allowed to take alcohol or even smoke, and we were cleansed with water. This cleansing was meant to make you one of the group members. After cleansing it's believed that your relationship with anyone from your family was no more, such that when you meet them, and you are asked to kill them, you must do it because you are now someone new and have no relatives.”
Kony was also feared and respected as a prophet. Three long-term bodyguards to Kony, whom we interviewed, described a catalog of prophesies foretold and coming to pass. They also described displays of power, such as the ability to vanish. Through the power of the spirits Kony was also perceived to be omnipresent and able to track down escapees by the smell of the holy oil with which they were anointed.
While spiritual messages and initiation were common, so were political propaganda and the promise of material rewards. The importance of overthrowing the government was most commonly reported in our data, followed by incitement over crimes committed by Museveni and promises of government positions, both of which could heighten recruits' efforts without an increase in tangible incentives. Forty-nine percent reported they received propaganda. Threats (such as the violence described above) were essentially universal, and 50 percent reported they received threats and not propaganda.
Together, this spiritual, political, and material propaganda were often effective. Thirty-one percent say they once felt allegiance to lra (or Kony), 11 percent admitted there was a time they felt like they wanted to stay with the LRA, 5 percent that they felt safer in the lra, and 6 percent admitted that they aspired to become a commander, or wanted to command. Of those abducted more than two months, those figures rise to 63, 26, and 16 percent. According to a two-year abductee, “I became like a real soldier. I was spying for them … There you do things just for survival. I started staying like any of them but I knew in the back of my mind I was just doing it for survival. But for a point I forgot the survival and became a part of them. I was abducting and stealing just like them.”
Such “forgetting” and shift in identity was commonly reported. In some cases this was associated with Kony's spiritual powers. According to one informant, “In the bush, there is something that confused people. There is a certain type of holy oil which they put on you. It confused you and you could never think of home.” An extreme example is that 7 percent report they believed they were magically protected from harm by Kony's powers, such as immunity from bullets—a common statement made by Kony and one of the purported reasons for anointment with his holy oil.
Accounts of allegiance and forgetting suggest that LRA discipline, religion, and propaganda did not simply change individual incentives, but fundamentally altered the beliefs and values of recruits. Such indoctrination, misinformation, and identity manipulation has been widely remarked upon in social psychology and military sociology.
For those who remain with the LRA for long periods of time, the decision to escape is usually associated with a moment of “awakening.” “When I grew up,” explained one young man, “I saw that everything Kony said was false. If it were really true then the government could have been overthrown. And here the people he abducted before me had all escaped. This made me think of escaping, which I finally did.”
Some of these stories reflect a realization that the promised benefits would not be received: “We would ambush and carry things,” said another young man, “but then I wouldn't benefit. It was the leaders who benefited. Then I thought I should escape because I had not gone on my own but had been abducted.” Another long-term abductee explained that, “When I was just abducted I was optimistic that we would win this war because the commanders kept on telling us that we would overthrow the government soon. But after seeing what atrocities these rebels were doing, like killing many civilians, looting and continuous fighting without any success, I realized the rebels are wasting time and we'll not overthrow the government. This made me think about escape, which I eventually did, and came back home.”
Why Children? Estimation Strategy
LRA recruitment closely resembles our theoretical framework. Violence is employed as an incentive for performance, with threats of severe punishment for dereliction or desertion. Rebel commanders also use violence to lower reservation utility, but not necessarily through the threat of force. Rather, they force abductees to commit criminal acts and convince them (incorrectly) that they face nothing but punishment, death, or exile on the outside. Commanders try to shape expectations rather than reality. This coercive strategy came cheaply; with no civilian support to lose, and material backing coming from one of the regimes least sensitive to human rights (Sudan), the LRA faced little penalty for its abductions and abuses. Finally, indoctrination and misinformation were central to LRA retention, and seem to have been successful in a substantial number of cases—enough to give the LRA a force of some thousands of relatively dedicated fighters by 2001.
What these averages do not explain is the overwhelming abduction of young adolescents so evident in Figures 6 and 7. Our model suggests several reasons that children may be more attractive, especially higher susceptibility to indoctrination and misinformation, and more difficulty in escape. It also predicts the greater use of threats and lower rewards. We conduct “cross-age comparisons” of the self-reported actions, attitudes, and experiences of abductees.
Graphically, we examine nonparametric regressions of a self-reported attitude or experience over age of abduction. We calculate a running-mean via nearest-neighbor smoothing with unit bandwidth.Footnote 38 We also look for linear relationships with weighted least squares regressions. To account for changes in rebel practice over time, space, and gender, we include abduction year indicators and gender-specific indicators for location of birth.
In most rebel groups, such cross-age comparisons would be biased by differential selection into the rebel group: the more willing or susceptible would self-select into the group, or be selected or screened by commanders. The characteristics that drive selection may be correlated with age (indeed, that is the entire basis for our model of child recruitment), biasing the coefficient on abduction age. LRA recruitment, however, was largely indiscriminate, and nearly indistinguishable from random. Abduction party leaders reported that the only criterion for abduction was the demand to release young children and adults. Indeed, abduction by the LRA is indistinguishable from random abduction after accounting for year and location of birth. No other pre-abduction household trait is associated with a higher risk of abduction, whether household wealth, education levels, or orphaning. In logit regressions of abduction on prewar household traits the coefficients on wealth, education, occupation, and orphaning are small and not statistically significant.Footnote 39 In contrast, these same characteristics predict survey respondents' participation in a government militia. Only household size predicts abduction by the LRA: large households were slightly less likely to be raided, perhaps because they were harder to control by a small band of fighters. Nevertheless, to account for any unobserved selection into abduction, we include pre-abduction covariates such as household assets and parents' occupation, education, and death.
Two other potential sources of bias are systematic measurement error and selective mortality. We are especially concerned about underreporting of measures such as loyalty or violence committed. So long as any systematic error is uncorrelated with abduction age, however, that measurement error will be cancelled out in cross-age comparisons. Only measurement error that varies with age of abduction will cause bias. Bias from mortality is unknown, but the most plausible forms of selection (for example, children are less-skilled fighters, and the less skilled are more likely to die) understate cross-age differences.
Results
Results are summarized in Figures 8 through 10 and Table 1. Panel A of Table 1 estimates the linear relationship between abduction age and experiences, and Panel B estimates the quadratic relationship.
Coercive Incentives
Not only was the LRA more likely to forcibly recruit adolescents than adults, but once recruited, younger recruits received more punishments and fewer positive inducements. Virtually no recruits received actual rewards other than extra rations, and we see no correlation (linear or quadratic) between being ever rewarded and age of recruitment (see Table 1, row 2). However, older abductees were more likely to report positive inducements in the form of promises and propaganda: either promises of riches or positions upon victory, or appeals to ethnic dominance.Footnote 40 The probability they received propaganda rises 1.4 percentage points with each year of age (row 3), from an average of 42 percent among those age eleven to thirteen to 79 percent among those age twenty-four to twenty-six.
Threats were universal, but younger abductees were more likely to report they received threats but no propaganda (row 4). Children were also more likely to be forced to commit acts that would reduce their real and perceived outside options. Being forced to harm family fell by 0.9 percentage points per year of age while being forced to desecrate dead fell by 0.7 percentage points per year (Table 1, rows 5 and 6). These are large declines relative to the average incidences, 12 and 23 percent, respectively. These patterns echo the relationship between child recruitment and coercion predicted by the model.
Effectiveness as Fighters
While fighting effectiveness is difficult to measure, the interview and survey evidence suggests that children were less able on the battlefield than older adolescents and adults. For instance, in interviews, junior commanders and long-term abductees emphasized that children under age twelve were extremely loyal and could be useful servants, but were not effective fighters.
The data are consistent with these claims. Abductees were regularly given arms for practice and training as soon as two or three weeks after abduction. But being given a gun to “sleep with” or being allowed to keep own gun, was the main indication of becoming a regular fighter. Young children were nearly half as likely to have been given and allowed to keep a gun as adolescents aged fifteen to seventeen (Figure 8). In addition to being more likely to receive guns, older adolescents and adults also received guns sooner than younger adolescents and children. Leaders waited longest to give abductees younger than age twelve a gun: male youth of age eight to nine took roughly ten months to receive a gun, compared to four months for youth of age eleven to thirteen and 1.8 months for those of age twenty-four to twenty-six (Figure 8). Regressions using an age quadratic suggest that these nonlinear relationships are statistically significant (Table 1, rows 7 and 8).

FIGURE 8. How do rebel leaders employ abductees of different ages?
Note: See Figure 7 for explanation of solid and dotted lines.
Finally, adolescents were more likely than children and adults to report that commanders considered them dependable fighters (row 9). Dependability in this context was a euphemism for trustworthiness—a commander's belief that an abductee would reliably carry out orders and not attempt escape. Self-reported dependability peaks at age fifteen to nineteen and is lowest among younger children and older adults.
While not conclusive evidence of low ability, these patterns are consistent with younger children being trusted but less effective fighters, and adults being able but untrustworthy and difficult to manipulate. This tradeoff leaves adolescents as commanders' fighters of choice, a finding reinforced by evidence on the relative ease of manipulation.
Ease of Escape, Misinformation, and Indoctrination
Figure 9 illustrates why rebel leaders can coerce children to a greater extent than adults: younger abductees stay longer before attempting escape. abduction length falls steeply in abduction age, from a year at ages eleven to thirteen to 4.5 months by ages twenty-four to twenty-six. Abduction length falls by 0.72 months for every year of age (Table 1, row 1). Judging by the quadratic terms, the relationship is steepest in pre-adolescence and tapers off afterward.

FIGURE 9. Average length of abduction by age of abduction
Note: The solid line is a running-mean calculated via symmetric nearest-neighbor smoothing with a bandwidth of one. The dotted lines represent the 95% confidence interval. Data do not include absentee or nonsurviving youth. Multiple abductions enter individually.
Why do children stay longer with the LRA? According to one long-term abductee, “it is easy to convince a child of twelve years of anything. He will believe any promises made and does not know the difference between good and bad. But if you are mature, you know they will not overthrow the government.” Indeed, the data suggest that older abductees were less likely to report that they ever felt safer in lra, falling 0.3 percentage points with each year of age, from 6 percent at ages eleven to thirteen to 2 percent at ages twenty-four to twenty-six (Table 1, row 10). Older abductees (especially males) were also least likely to report they ever felt allegiance to lra (row 11). Allegiance fell by 0.9 percentage points with each year of age, from 34 percent at ages eleven to thirteen to 22 percent at ages twenty-four to twenty-six. We illustrate these relationships in Figure 10.

FIGURE 10. Ease of misinformation and indoctrination
Note: See Figure 7 for explanation of solid and dotted lines.
Older males were also less likely to say that they believed in Kony's spiritual claims, including that they believed they were magically protected from harm, such as bullets (row 12). This belief fell 0.5 percentage points with each year of age (significant at the 10 percent level), from 13 percent at ages eleven to thirteen to 8 percent at ages twenty-four to twenty-six. Roughly 13 percent of adolescent abductees report there was a time they wanted to stay in lra, with these rates falling steeply toward 0 on both sides, among young children and adults. Thus we see little linear relationship but a robust quadratic relationship (Table 1, row 13). An aspiration to rise in the LRA, such as wanting to command, is also inversely U-shaped in nature, 7 percent in the teenage years, falling below 5 percent among both children and adults, though the relationship does not appear to be statistically significant (row 14).
The LRA was well aware of this pattern. According to a long-time bodyguard of Kony's, “Kony used to say his soldiers are young people because the adults always escaped.” Other accounts suggest that Kony was also more suspicious of adults because they could be spies or government soldiers. Young boys were less likely to have been soldiers or spies, and perhaps for this reason, Kony's personal bodyguards were almost always selected from some of the youngest able-bodied boys, usually age thirteen or fourteen.
Turning to escape, exit from the LRA took three forms (excluding release): rescue by the Ugandan army (7 percent); escape in the heat of battle (32 percent); and running away at night or when scavenging (61 percent). Involuntary escape, such as rescue, is highest among the young and falls by 0.6 percentage points for every year of age (Table 1, row 15). Voluntary and premeditated escape, on the other hand, is least common among the young, rising by 1 percentage point with each year of age (row 16) from 49 percent at ages eleven to thirteen to 61 percent at ages twenty-four to twenty-six.
LRA officers and abductees explained that young abductees were most fearful of escape because their surroundings were less familiar and they were insufficiently cunning. According to a seven-year servant to Kony, “Old people are able to escape, but for the children it is difficult because they do not know how.” The survey asked abductees if they knew their location when they escaped. Familiarity with one's location at the time of escape is increasing in age 1.3 percentage points for each additional year (row 17), rising from 38 percent at ages eleven to thirteen to 49 percent at ages twenty-four to twenty-six.
Cross-National Evidence
Predictions
Collectively, the micro-evidence here suggest that our core theoretical assumption, on the ease of child manipulation, is an important one. But children's relative ability and ease of indoctrination are unlikely to vary substantially across time and space. Our model also suggests two main sources of cross-country variation in child recruitment that interact with ease of manipulation to produce child recruitment: the cost of punishment, and relative outside options. In the remainder of the article, we use new cross-rebel data to investigate variation in the costliness of punishment. We leave the study of relative outside options to future research (as it requires age-disaggregated microeconomic data on wages and schooling in conflict zones).
The model suggests that we should not observe child recruitment where punishment is expensive, as when groups start with and depend on high initial levels of civilian or diaspora support, or face international penalties or prosecution. Similarly, rebel groups with low levels of initial civilian support and resource bases that are unresponsive to crimes (such as those with natural resource bases or indifferent foreign donors) should be more likely to employ coercion and children.
Forcible recruitment is the most easily measured form of coercion. We develop new data on forced and child recruitment, by rebel group, and compare the prevalence of forced child recruitment by sources of material support: civilian support, foreign governments, and natural resources.
Such cross-rebel statistical analysis is plagued by a number of challenges. First, information on rebel recruitment and resources is scarce, scattered, and inconsistent, and so our data (as with all cross-national data on Africa) should be treated with circumspection. Second, we observe only groups that have been minimally successful in organizing and sustaining a movement, so observability is likely correlated with both recruitment strategy and resource base. Thus cross-rebel regressions must be used with caution. Nevertheless, this group-level analysis is more novel and more insightful than the usual cross-country analysis, and presents a rare large-sample means of testing theories about rebel organization and behavior.
Data and Measurement
To maximize data quality and depth, we gathered data on a random sample of African rebel groups. We sampled at the conflict level (allowing multiple conflicts per country) using all conflicts in sub-Saharan Africa, 1980–2004, reported by the Uppsala Conflict Data Program and Peace Research Institute Oslo (UCDP/PRIO).Footnote 41 We sampled fourteen of forty-two conflicts, stratifying the sample by the number of conflicts reported in a country. Within each, we collected information on all nonstate actors listed by UCDP/PRIO, excluding coups: forty groups from a total of 124. The sample includes groups from Burkina Faso, Cote d'Ivoire, Democratic Republic of Congo, Ethiopia, Gambia, Guinea-Bissau, Mali, Nigeria, Senegal, Somalia, South Africa, and Uganda. We select a sample to investigate in order to make the best use of resources and be able to investigate groups in depth qualitatively—in essence, trade quality of data for quantity, especially given the difficulty of obtaining information on smaller groups. Developing data on a full sample of armed groups will be an important area for future research, and indeed a handful are in progress.Footnote 42
A team of student researchers used reports, academic literature, and news archives to develop group-specific narratives on key variables: method and age of recruitment, remuneration type, and resource base (material and social, internal and external). Academic experts on each group were then contacted to complete and validate information.
Data on child and forced recruitment is scattered and inexact. We coded the percentage of recruits under 18 by classifying groups into one of five bins: 0–5, 5–19, 20–39, 40–59, or 60–80 percent. We use the midpoint of each bin. The mean of this variable is 0.13 and the standard deviation is 0.13. We also developed an indicator for evidence that at least 20 percent of recruits experienced forced recruitment (data availability made a more precise coding impossible). We observe forced recruitment in one third of groups. We combine these two measures into an indicator for forced child recruitment, which equals 1 if more than 20 percent of recruits are believed to be coerced and more than 5 percent of recruits are under eighteen.
Note that, with the exception of the LRA, there are no representative survey data on our sample, and so all coding is subjective. Data are weakest for a third of the groups who were small, short-lived, and obscure. We create a dummy for groups active less than two years. Column 1 of Table 2 lists summary statistics.
TABLE 2. Correlates of child coercion across rebel groups

Note: Robust standard errors in parentheses.
*** p < .01;
** p < .05;
* p < .1.
Finally, we develop three indicators for initial resources: an indicator for local population support, an indicator for financial support from a foreign government, and an indicator for access to natural resource wealth (such as oil, diamonds, or other commodities). Where possible, we coded initial levels of resources, from the outset of the conflict. These data have at least two weaknesses, however. The first is that later resource use may be mistaken for initial resources (especially because the materials for many groups are quite scant). If human rights abuses or child recruitment caused groups to lose popular support early on, it is possible that experts and the literature (and hence our coding) would miss this subtlety, leaving our analysis vulnerable to reverse causation, overstating the true causal relationship between popular support and child recruitment. The second weakness is that an absence of evidence for a particular resource base results in our coding a 0. There is thus a risk that more short-lived or less studied groups have more measurement error. While we cannot correct fully for this weakness, it is one reason we include an indicator for being active at least two years.
Results
We began this study with two puzzling facts: child soldiering was not only commonplace, but also closely associated with forced recruitment. Our rebel data confirm both. Figure 11 plots the distribution of percentage of recruits under age eighteen over our forced recruitment indicator. The box represents the 25th to 75th percentile, and the triangle the median; the boxes are nonoverlapping. A regression of the percentage recruited under age eighteen on forced recruitment (not shown) yields a mean difference of 14 percentage points.Footnote 43 Here we face a problem of aggregation: it is possible that the 10 to 20 percent of children are the same 10 to 20 percent that are thought to be forcibly recruited. Given the scarcity of data it is difficult to say, and an investigation of our hypothesis and predictions will likely require further comparative case work or new, finer databases.

FIGURE 11. The distribution of child soldiering across forty rebel groups (by level of coercion employed by the group)
Note: Each box represents the 25th to the 75th percentile of the distribution. Solid circles represent groups outside this range. The median is indicated by a triangle.
We examine the role of resources in Table 2. We use a linear probability model with binary independent and dependent variables, giving the coefficients a simple interpretation: the increase in the probability of forced child recruitment associated with a particular endowment. We consider each endowment individually (columns 2 to 4); then together (columns 5 and 6); with the LRA, a potential outlier, omitted (column 7); and, finally, allowing foreign influence to vary after the Cold War (column 8). The results provide suggestive, but not conclusive, support of our model.
Initial civilian support is associated with a twenty-one- to twenty-nine-point reduction in the probability of forced child recruitment, as predicted by the model. The result is not statistically significant, however, except when controlling for all resource bases and short-lived rebellions, and even then the relationship is significant at only the 10 percent level (column 6).
Natural resource access is associated with a six- to fourteen-point increase in the probability of forced child soldiering, also as predicted, but the effect is smaller and weaker than expected—quite substantial inverse effects are also within the (wide) confidence interval. This could be because of the diversity of natural resource wealth (some resources are not easily looted without the cooperation of local civilians).
Support from a foreign state is strongly associated with forced child recruitment, however—a thirty-eight- to forty-two-point increase, significant at the 5 percent level. These foreign sponsors are typically other African countries (only in one case, the South West Africa People's Organization in South Africa, do we have clear evidence of support from developed nations). Foreign support is diverse in nature, and can come with many conditions, but we observe few instances where a rebel group's human rights record is taken into account, especially during the Cold War. It is difficult to imagine a reason that these state sponsors would explicitly encourage forced recruitment, least of all children. We interpret the coefficient as reducing the costliness of punishment, by providing rebel groups a source of funding other than local civilians.
We hope these “cross-rebel regressions” spur further data collection and tests, given that the scope of available comparative rebel group statistics remains relatively limited.Footnote 44 In the meantime, the results suggest that unconditional foreign sponsorship was a significant force in reducing the accountability of rebel groups and the consequent costs of engaging in coercion and civilian violence.
Conclusion
International and domestic actors predicate their actions, implicitly or explicitly, on a theory of conflict. But theories of conflict typically take the existence and organization of armed groups as given, and many international relations theorists assume that armed groups are unitary actors and leave aside the question of who fights and why.Footnote 45 Those who study the origins of rebel organization, moreover, have tended to focus on the collective action problem in rebellion—that is, the participation constraint. They have paid less attention to problems in agency theory, especially incomplete information and incentive compatibility—the incentives for recruits to perform and obey. Notable exceptions include recent research that examines how geography and ideology shape rebel recruitment strategies under incomplete information.Footnote 46 Our analysis joins these studies in arguing that theories of industrial organization can add to our understanding of rebellious groups, especially systems of recruitment, command, and control, and thus shape counterinsurgency as well as policy to prevent war crimes.
Clearly, raising the cost of child recruitment is crucial, and the recent policy focus here is well deserved. Aid can be conditioned on human rights behavior. Financing from diasporas and other funders can be frozen. And the threat of prosecution is powerful. But is it sufficient? Child recruitment can still be optimal when the costliness increases, especially when children's opportunities are poor or leaders exert control over the information that reaches them. Also, prosecution is not without difficulty. The first prosecution for child soldiering, against Lubanga, has gone poorly and narrowly missed an acquittal.Footnote 47 Domestic courts in Africa have also acquitted other child recruiters for lack of a solid and well-executed case.Footnote 48 Moreover, prosecutors have no means of bringing leaders such as Kony to justice. This tool is powerful, but not all powerful.
One insight highlighted in this article is that war crimes such as forced recruitment, or inflicting punishments, is a rational and optimal strategy for motivating people who are poor in the sense of having bad alternatives. Hence children's reservation utilities are crucial—it is only because they are low in expectation that abduction and punishment are optimal. Raising real opportunities—educational and economic—should make rebel recruitment more difficult (or at least more expensive) for children and adults alike as the participation constraint becomes more difficult to satisfy. But there are dangers. First, intermediate levels of development could push the optimal age of recruitment downward if adults share in growth more than children. Second, demobilization and reintegration programs must pay attention to relative impacts on children and adults. Counterinsurgency and postconflict programs commonly do the opposite, concentrating programs on adults and leaders, and being slow to generate educational opportunities for adolescents, especially the remedial services they need to restart education.
In any case, reducing poverty and increasing access to education are long-term solutions to an urgent and immediate problem. The LRA case shows the incredible power of rebel groups to distort perceptions, especially those of children. Real opportunities may matter less than perceptions. Where child abductions continue to occur, our results suggest an unconventional intervention by domestic actors and the international community: counterpropaganda and counterabduction training.
A child's reservation utility is lower partly because the rebel leader exploits a child's lower expectations of successful escape and community acceptance. Children in the LRA were also taught to value the same objectives as the rebel leader, particularly spiritual rewards. Programs of education and counterpropaganda can counter these manipulations.
Just as Western schoolchildren perform fire drills, or learn not to speak to strangers, so should children in war zones be drilled in escape and resistance to misinformation. Just such a grassroots effort was launched by Ugandan civil society, albeit too little and too late. In 2000, organizations began to broadcast radio messages of welcome and amnesty. One rebel commander reported that, by 2004, such broadcasts led to orders to halt new abductions: widespread knowledge of amnesty and reconciliation meant that new abductees would reveal the truth and prompt mass desertion. Informal education programs also emerged. Returned youth taught younger relatives and neighbors how to escape. Experienced hunters also began to pass on traditional methods of navigation by the shape of various rock formations scattered across the region's landscape.
In retrospect, more and better education and communication earlier in the conflict could have reduced the effectiveness of LRA abduction. It is difficult to imagine the UN International Children's Emergency Fund (UNICEF) or education ministries distributing abduction-training curricula to schools. The policy would be a frank admission of their failure to protect, and politically difficult. Nevertheless, local and national authorities, international organizations, and even peacekeepers should consider preparing children for the possibility of abduction, and they should explain and help ensure that abductees are welcomed upon their return to civilian life. So long as rebel leaders face the incentives and limited costs outlined in this article, children will be recruited for insurgency and terror. In future conflicts, institutionalized mechanisms for counterpropaganda, escape training, and other countermeasures ought to be a central part of the governmental and nongovernmental response to war.


