

INTRODUCTION
Outlined in the Introduction to this special issue are a set of questions, all of which presuppose a tension between factionalism and institutionalism in China. In the former, patron–client networks are developed to further the political power of the patron, while providing a career ladder or other benefit for the client. In the latter, an increasingly rule-bound Chinese Communist Party (CCP) has tempered the power of individuals (of patrons and their clients) through the establishment of strong party institutions. Through this lens of institutional versus factional contention, regardless of where the balance between them lies, the factors driving elite politics are seen to be shared backgrounds and reciprocal cooperation. In other words, the focus of academic debate, as exemplified in this special issue, is on politics itself.
Yet an important element of any government is the promulgation of policy. Again, as clearly shown in the Introduction, Deng Xiaoping is remembered not only for his politics (in particular those surrounding the removal of Zhao Ziyang and the suppression of the civil demonstrations of 1989), but also for his policies (most notably his policy of reform and opening up). Equally, prior research has examined the political struggles between central and local governments. But beside the politics of center–region conflict, there is also a need to evaluate how policies are bargained over and implemented based on elite preferences over outcomes. In this way, a different lens can be adopted, where we look for policy coalitions rather than political factions (where coalitions are defined as a similarity of interests, rather than explicitly on similarity of experience or background). In other words, we look at policy decision making in a complementary, but still systematic, way, and we offer a bridge to link elite politics to policy outcomes.
We do this through a novel behavioral approach utilizing the KAPSARC Toolkit for Behavioral Analysis (KTAB) to simulate China's policy making as a collective decision-making process. The approach enables us to map the policy landscape systematically, identifying important stakeholders and decision makers and assessing their policy preferences and political clout. The value of the KTAB approach thus lies not only in the simulation results (its forecast), but also in the conversion of the qualitative understanding and assessments of individual subject matter experts into a transparent, quantitative simulation. The intent is to evaluate how much insight can be gained by treating Chinese decision making as guided by the mediation of a set of interest groups represented by elite actors. Of course, data obtained via interviews from experts is subjective and difficult to replicate, a charge we address later on. However, by using a replicable model, alternative datasets can be applied and the differences in outputs easily compared.
For the purposes of this article, a case study is presented to demonstrate the insight that can be obtained by using KTAB as way to study the politics of policy formation. As all models are simplifications of more complex real world phenomena, the use of several modeling approaches can often provide greater insight when they are used together to study the same (or similar) phenomena. Given the political rhetoric surrounding economic and market reform following the Third Plenum in 2013, and the more recent announcements concerning the reform of China's state-owned enterprises (SOEs), we ask the question: Will China's upstream oil and gas sector continue to be reformed and, if so, how? What we discover through the application of KTAB is that, despite the widespread rhetoric supporting reform, the advocates of reform in this example are unable to build a strong enough coalition to win the argument, and policy is thus likely to remain unchanged.
METHOD
In this article we will present an analysis of plausible outcomes of the collective decision-making processes (CMDPs)Footnote 1 China may currently be engaged in over the role of its state-owned enterprises in the upstream oil and gas sector. To carry out this analysis we used KTAB to construct a particular model of CDMPs, based on the Spatial Model of Politics (SMP). The SMP is one of the most widely accepted models of CDMPs, both technically and informally. Models similar to what we call the SMP have a robust history as applied to elections and committees (Black Reference Black1948; Ordeshook Reference Ordershook and Mueller1997). There is also a long history of applying this type of model to questions of international relations.Footnote 2 A more general application of spatial models to bargaining problems and negotiations has also been developed in various forms. The Expected Utility Model, described in Bueno de Mesquita (Reference Bueno de Mesquita1997), and the Senturion model, described in Abdollahian, et al. (Reference Abdollahian, Baranick, Efird and Kugler2006), are among the most prominent examples.
The challenge with these models has been difficulty in replication. Difficulties replicating the Expected Utility Model are detailed in Scholz et al. (Reference Scholz, Calbert and Smith2011), and other replication efforts are described in Bennett and Stam (Reference Bennett and Stam2000), Wise (Reference Wise2010), and Jesse (Reference Jesse2011). The Senturion model is proprietary, without any of the details regarding the model published, so replication is even more difficult as the mathematics of the model are not available to the public.
Replicability is central to any scientific endeavor, both in terms of the data collected and the algorithms employed in its analysis. A full technical description of the model used in this paper is presented in Wise, Lester, and Efird (Reference Wise, Lester and Efird2015a; Reference Wise, Lester and Efird2015b). The logic and equations are set out in detail to enable a thorough understanding of the approach and the model's mechanics. The latest version of the documented source code for KTAB, along with the latest set of technical papers, can be obtained at http://ktab.kapsarc.org, to enable the reader to replicate all model results. While a level of computer science skill is needed to compile and apply the software libraries, at the time of writing this article our team is engaged in developing a user interface to make the models more accessible to a wider audience.
In the sections that follow we first describe the data required for the model and discuss issues surrounding data veracity and replicability. We then provide a semi-technical description to provide the reader with an intuitive understanding of the model's mechanics before discussing the relevance of the approach to government decision-making processes in general, or the Chinese system specifically.Footnote 3
DATA
This section describes each of the data components needed for the model utilized in this paper: the actors and their preferences (their stated positions), measures of influence, salience for the issue, and finally exercised power. All data were collected in the third quarter of 2014.
THE SET OF ACTORS AND THEIR POSITIONS
The actors are all the stakeholders that contribute to the resolution of the CDMP in some way. They can be individuals or aggregates of individuals. Aggregates can be formal, such as a corporation, or informal, such as loose affiliations based on interests, for example young men sharing a love of fast cars. The constraint is that it must be possible to reasonably assume that each actor is a unitary entity, speaking with a single voice.
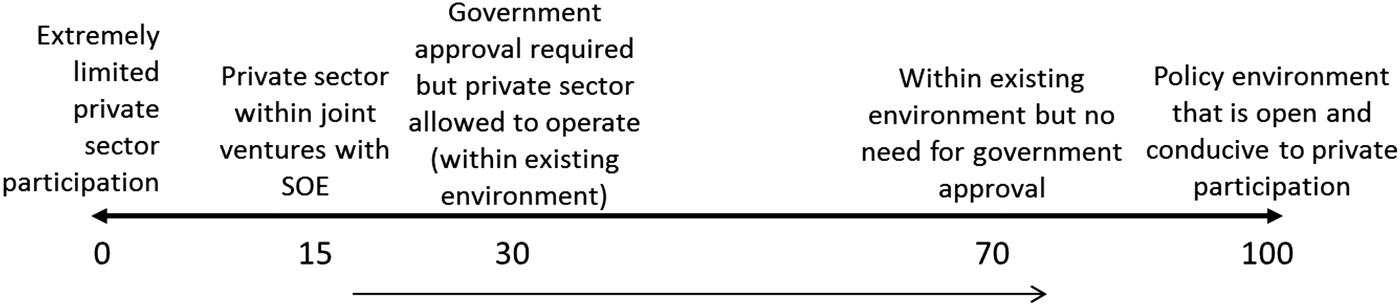
This is a way of formalizing the question by mapping out actors' possible responses and positions in the form of a linear continuum of possible positions. The extreme ends of the spectrum are associated with extreme positions. In the question of SOE reform and private participation, one end could be “extremely limited private sector participation,” the other “a policy environment that is open and conducive to private sector participation.” These extremes are then labeled as 0 and 100, converting a qualitative spectrum into a numeric one where each position is given its own score.
The spectrum is a scale where distance measures the change in consequences for the actors: the gap between positions corresponds to the difference in outcome. An implicit assumption is that all actors roughly agree on the consequences of positions. The consequences of moving from position 25 to position 50 would be roughly the same magnitude as moving from 50 to 75. We refer to this spectrum as the Practical Spectrum of Plausible Positions (PSPP). With identified actors and a defined PSPP, the Position (i.e. the advocacy) of each actor can then be mapped to the PSPP with a number between 0 and 100.
MEASURES OF INFLUENCE
Not all actors are equally powerful. Influence measures how easily the actor can shape the outcome of the CDMP, if fully motivated. This is not a measure of how likely the actor's preferred position is to win, nor is it a measure of the actor's motivation to win. It is the actor's clout, or political power, as applied to the question, assuming that the actor will bring his full resources to winning the negotiation and takes account of all his formal and informal powers.
Influence scores are linearly comparable across actors: an influence score of 60 means that the actor is twice as influential as one with 30. Influence scores are also additive: two actors in coalition, each with influence 30, could block an actor with influence 60. The combination of relativity and additivity can make influence the most cumbersome score to derive. Each actor's score needs to be calibrated against all the other actors. Again, influence is scored against a range of 0 to 100. Strictly speaking, if an actor is assigned an influence score of 0 then they have no power and would not be counted as an actor.
MEASURES OF SALIENCE
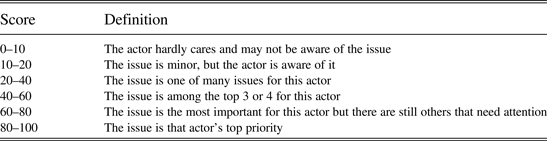
Regardless of an actor's position and their level of influence, different actors will have different levels of interest in the question. Salience answers the question of how much an actor cares about the issue in general. How motivated are they to exert influence to produce their preferred outcome, if and when the issue arises? One way to begin answering these questions starts with the observation that each actor has a portfolio of issues to which they devote their attention. Salience identifies the importance of the specific issue in that portfolio, recognizing that people have an implicit budget constraint on exerting their Influence across the portfolio. The salience scores are defined in Table 1 and range from 0 to 100.
Table 1 Definition of salience scores

The salience score is not the amount of time that an actor will devote to the negotiations, but rather their willingness to use whatever influence they have to convince others of the merits of their own preferred position. It is not their influence, merely their motivation when the issue arises. Once again, salience scores are comparable across actors: if one actor cares more about the issue than another does, that actor must have a higher salience score. As with influence, a salience score of 0 would indicate that the actor does not care about the issue, and that they should not be counted as an actor.
EXERCISED POWER
This is a derived value, calculated in the model, that combines the actor's power (influence) with how strongly they care about the issue (salience). Exercised power is the product of these two values and reveals the amount of power the actor will actually bring to bear on the issue being modeled. Note that influence, salience, and exercised power all map the actor's attitudes towards the overall issue as defined in the question, not individual alternative solutions to the question.
THE DATA SOURCES
The data used in this analysis were obtained from a series of interviews with experts from the upstream oil and gas industry in China and from think tanks based outside China. KAPSARC conducted the interviews, but its primary contribution in this analysis is the SMP simulation, built with KTAB. The authors have not incorporated their own views on the actors, in order to reduce any bias that we might otherwise introduce. The data can therefore be seen as “best-judgement”’ views of preferences, power, and salience collected through expert interviews.
As with any dataset, questions are often raised over validity. Given the hidden nature of what we are attempting to model, there are two commonly asked questions regarding the data required for KTAB. First, how can we be sure we know what decision makers actually think? The best we can do is to aggregate the views of experts with detailed knowledge of the question and the relevant actors to form a set of ‘estimates’ of their underlying characteristics. Individual readers can always query whether a particular data point is correct. However, if a range of well-informed observers all coalesce around a single set of numbers then at the very least we are picking up on widely held beliefs about the data.
Second, how can we be sure that the data are not skewed by the observation bias of the experts? Again, we cannot be certain. Experts can only provide information on the actors they follow; if that group is not representative of the relevantly influential spectrum of debate, the results of the simulation will similarly be skewed. We attempt to mitigate this by combining the knowledge of experts with a range of different focus areas and backgrounds.
The experts may or may not be correct, though they are well positioned to provide an informed judgment. At the very least, our analytical framework can deliver insight in the form of plausible policy outcomes, if the paradigm articulated by the experts, and widely held by others, is generally accurate.
The data from the various experts interviewed were combined to form a collective view of the actors and their characteristics. We start with our aggregated dataset, based on the input of all the experts, which we call our ‘baseline’ dataset, for each of the two PSPPs covered in this article. We then run various scenarios to estimate the degree of institutional inertia in the face of different positions advocated by senior politicians. Others are of course free to use KTAB to analyze the consequences of altering the initial dataset or coming up with completely new values.
MODEL
The model of the SMP used in this article, analyzes how actors exert influence to try to shape the group decision. As long as the pressure to adopt a new position exceeds the pressure to maintain the old one, the group “decision” will keep changing. When there is no longer a strong group pressure to change, the process will stop at a kind of equilibrium, or a balance of interests. It will stay there until something happens to alter the context. Of course, the context may be changing (slightly or greatly) all the time, in which case the system would be constantly chasing an equilibrium—just as in economics. KTAB can therefore be seen as a theoretical abstraction of a process that is, for those involved in the complexities of real-world interactions, both intuitive and rarely formalized.
The kinds of alternatives being considered depend on two essential aspects of bargaining; both are represented in KTAB. One essential aspect of bargaining is the Best Alternative to a Negotiated Agreement (BATNA). This gives an indication of how much one actor can offer another, or how much leverage an actor has over another. Another essential aspect of bargaining is assessing not only what option is good for oneself, but also how likely it is that other actors will support or oppose that option—and how much capability or desire they have to do so. Hence, an important aspect of negotiation is crafting proposals in such a way as to offer enough benefits to others that they support the proposal, while not compromising away everything the proposing actor wants.
The SMP bargaining model used in this article proceeds in turns (for a total of ten), starting from the initial situation presented in the data collected through the expert interviews. Within each turn, there are four phases: assessment, targeting, proposal, and resolution. The notion of turns and phases closely parallel those in Bueno de Mesquita and Newman (Reference Bueno de Mesquita, Newman and Rabushka1996) as well as in Abdollahian, et al. (Reference Abdollahian, Baranick, Efird and Kugler2006). In the KTAB formulation, these phases have been reformulated to be stochastic (not deterministic) and have also been made more consistent with standard decision theory (an explicit description of the derivations for KTAB is provided in Wise, Lester, and Efird (Reference Wise, Lester and Efird2015a and Reference Wise, Lester and Efird2015b), while the documented source code can be obtained from http://ktab.kapsarc.org).
ASSESSMENT
The purpose of the assessment phase is for each actor to estimate how likely other actors are to compromise, and how much they are willing to run risks. This is done by a process similar to revealed preferences in economics: those actors who adopt a position with higher probability of failure have revealed a higher tolerance of risk than those actors who are exposed to a lower probability of failure. The probabilities of each actor succeeding or failing are assessed by a Probabilistic Condorcet Election (PCE), explained in more detail below. The risk attitude of the i-th actor is designated R i; it is determined by a simple rescaling of the probabilities:
 $${R_i} = \displaystyle{{{P_i} - {P_{min}}} \over {{P_{max}} - {P_{min}}}}$$
Thus, if an actor's position is the one most likely to be adopted, i.e. P i = P max, then that actor is assigned a risk attitude of R i = +1, indicating strong risk aversion. As is well known from the financial world, a risk-averse actor is willing to tolerate higher risks only in order to raise their own expected outcome. If an actor's position is the least likely to be adopted, i.e. P i = P min, then that actor is assigned a risk attitude of R i = 0, indicating complete indifference to risk, or risk neutrality. Financially, a risk-averse actor would simply maximize expected return, regardless of how high or low were the risks involved. In this model, no actors are willing to lower their own expected outcome simply in order to run higher risks, i.e. none are risk-seeking and they never have R < 0.
While each of the actors is assumed to know their own risk attitude, their estimates of other actors' risk attitudes are not perfect. The particular sub-model used in this paper rests on the “anchoring and adjustment” behavior noted by Tversky and Kahneman (Reference Tversky and Kahneman1974) and Epley and Gilovich (Reference Epley and Gilovich2006). Let us designate actor i's estimate by adding a superscript. As mentioned, each actor's estimate of their own risk attitude is exactly correct:
 $$R_i^i = {R_i}$$
In this sub-model, each actor anchors their estimate at their own risk attitude, and only adjusts halfway to others:
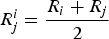 $$R_j^i = \displaystyle{{{R_i} + {R_j}} \over 2}$$
 Thus, actors do recognize that others have different risk tolerances than their own, but they tend to underestimate the difference. This is in contrast to the model described in Newman, Rabushka, and Bueno de Mesquita (Reference Newman, Rabushka and de Mesquita1985), which appears (in our notation) to have no adjustment at all:  $R_j^i = {R_i}$
TARGETING
Targeting is the most complicated phase. Each actor, i, looks at every other actor, j, to decide whether or not it would be worthwhile to try to change j's position. The fundamental purpose is to estimate the BATNA in a situation where i would try to assemble a coalition to pressure j into changing its position. When i is doing the analysis, every risk attitude, utility (u), and probability is understood to be estimated from i's perspective, i.e. to have a superscript i attached. If actor i were to try to change j's position, the probability of success would depend on the relative strength (s) of the coalition's supporting each side:Footnote 4
 $$P\left[ {i \succ j} \right] = \displaystyle{{s\left( {i:j} \right)} \over {s\left( {i:j} \right) + s\left( {\,j:i} \right)}}$$
With these probabilities in hand, and with estimates of j's attitude to risk, i can form an estimate of the expected value of a conflict to i and to j; these are the BATNA. The utility to i of winning an open conflict is the benefit from having j adopt i's position, while the disutility to i of losing is having to adopt j's position. Note that if j is highly risk-averse, its expected value of a risky conflict will be lower, offering more advantage to i. Of course, similar reasoning applies to i: if i is highly risk-averse, its expected value of a conflict will also be lower. If the expected value of a conflict to i is greater than the status quo, then j is a potential target. If there is more than one potential target, i will pick the target that offers the highest utility compared with the status quo.
The strength of the coalition supporting i and j depends on how much third parties see to gain from the conflict, and how much influence it would make sense for them to exert in this case. The most important contribution is usually from the principal actors themselves, but if there is little at stake for one of the principal actors, they may exert little influence. This can happen when one principal is very willing to compromise to avoid conflict (very risk averse) while the other is unwilling to compromise to avoid conflict (very risk tolerant).
The contribution of a third party, k, measures how much influence it is likely to exert in order to help actor i or actor j prevail. This is done by looking at a simplified subgame that analyzes a hypothetical conflict between i and j, where k has a choice over which side to support, and by how much. How much influence k is likely to exert increases with the stakes it perceives; the particular sub-model used in this article is that the influence exerted is proportional to the stakes. The stakes, in turn, depend on two factors. The first factor is the probability of each side winning or losing, depending on which k supports. The second factor is the range of outcomes for k, depending on which side it supports. Thus, there are four utilities to be assessed: k supports i and i wins, k supports i and j wins, k supports j and i wins, and k supports j and j wins. The particular sub-model used in this paper is that losers must adopt the winner's position, while winners can keep their original position. In Table 2, we denote the positions of actors by x i, x j, and x k respectively.
Table 2 Expert-based data for the Policy Space
The third party, k, faces a three-way choice between exerting effort to support i, supporting j, or abstaining from involvement. Notice that, with this sub-model, k's position is either unchanged or worsened by supporting i. Whether it is worthwhile for k to run this risk depends not only on what might be gained by shifting j's position more to k's liking but also on k's tolerance for risk (as estimated in the assessment phase). If the expected value of supporting i is greater than the status quo, then k's contribution to the coalition supporting i, s(i:j), will be positive and the contribution to s(j:i) will be zero.
If supporting i or supporting j both have lower expected value for k than the status quo, then k will abstain from supporting either side: k's contribution to s(i:j) will be zero as will the contribution to s(j:i). In this case, k's next position would not depend at all on the outcome between a hypothetical i:j contest.
Adding up all the influence exerted, either way, by the principal and third party actors, gives the strength of the coalitions, s(i:j) and s(j:i) as above. Again, all the estimates are from i's perspective.
PROPOSAL
The proposal-making phase depends on the concept of the Nash Bargaining Solution (NBS) between two players. The essence of the NBS is that it increases the utility (u) of both actors compared to the utility of the BATNA. Suppose i has identified j as the promising target. A proposed bargain is a pair of new positions for i and for j. The BATNA is a conflict, i:j, and it is the expected value as calculated above. The NBS is that B which maximizes the following product:
 $${B^i} = \mathop {\max} \limits_B \; \left[ {U_i^i \left( B \right) - U_i^i \left( {BATNA} \right)} \right] \times \left[ {U_j^i \left( B \right) - U_j^i \left( {BATNA} \right)} \right]$$
Clearly, the weaker i believes j to be, the more concessions i will demand of j. Note that this bargain is developed from i's perspective. If j is lucky, the bargain will be better for j than their own expected bargain, B j. If not, then we assume the two principals negotiate to the NBS where each actor evaluates their own utility from their own perspective:
 $${B^o} = \mathop {\max} \limits_B \; \left[ {U_i^i \left( B \right) - U_i^i \left( {BATNA} \right)} \right] \times \left[ {U_j^j \left( B \right) - U_j^j \left( {BATNA} \right)} \right]$$
In each calculation of the NBS, it is possible that there is no bargain that is better for both actors than the BATNA. As the BATNA is a conflict, the result in this case is that i proposes that both adopt i's position and j proposes that both adopt j's position. We call these the “conflict proposals.”
RESOLUTION
The fourth phase is resolution. This phase is necessitated by the fact that weak actors are likely to be targeted by several strong actors, and hence will receive multiple proposals. As only one new position can be adopted, a PCE is used to assess the likelihood of each proposal receiving sufficient support from the group to prevail over the others. A PCE simply allows us to generalize from a probabilistic distribution over two elements to one over multiple elements. Suppose actor i has just two proposals, x and y. In this case, the probability that proposal x will be enforced over proposal y is again the ratio of the coalition strengths:
 $$P\left[ {x \succ y} \right] = \displaystyle{{s\left( {x:y} \right)} \over {s\left( {x:y} \right) + s\left( {y:x} \right)}}$$
Because this phase represents not the analysis of one actor, but the interactions of multiple actors, the contribution of each actor is assessed from their own perspective. Thus, in the case of conflict proposals, the PCE simply calculates the probability of either side winning an outright contest and imposing their position on the other. In the model's stochastic approach, proposals are chosen with the probabilities dictated by the PCE.
HOW DOES THE MODEL REFLECT CHINESE DECISION MAKING?
All governments house competing voices, whether they are a transparent democracy or a closed autocracy. Differences may exist in terms of the range of voiced opinions (from broad disagreement to narrow agreement) and in the distribution of power among the voices (from an Athenian, one-man-one-vote, democracy to a more singular distribution of power such as found in dictatorships).
In almost every collective decision-making process, people cluster into interest groups with divergent preferences. The groups might be formal (political parties, industry associations, etc.) or informal (subsistence farmers, patronage networks, linguistic groups, etc.). The constituents of these groups have common interests; this can be taken as the operational definition of a group in the sense that sub-groups with strongly opposing interests should be considered as separate, opposing groups. For example, subsistence farmers might have a strong interest in subsidized water, electricity, or staple foods. A patronage network might have an interest in increased opportunities for the leading members to acquire wealth so that it can be redistributed downward. We call these groups actors.
These actors exert influence. The influence may be exerted directly, such as bloc voting by legislators, or quite indirectly, as when leaders in a non-democratic system anticipate the possibility of social unrest in the future, or of changes in support by the military, depending on their current actions.
Actors exert little effort when they perceive that there is little at stake. For example, labor unions do not expend their entire strike fund whenever there is only a small disagreement (unless that is an excuse to act on an important issue). However, when the stakes are “life or death,” it can be expected that the actors involved will exert great effort.
Actors exert influence to promote one outcome over another. For example, different patronage groups may promote different tax and trade policies. Strategically, policies will be crafted to balance two considerations. The first is self-interest: policies might be designed to bring revenue into the industries to which a patronage group is connected. The second consideration is the likelihood of success: policies might be designed to bring benefits to other groups, so as to win support from enough other groups to prevail.
Finally, actors with greater influence tend to prevail over actors with less influence. Even in consensus-based systems, some actors get more of what they want and others get less. The decisive factor is the influence actually exerted, rather than the maximum that might theoretically be exerted.
These linked ideas of actors, choices, and influence form a high-level conceptual framework similar to the framework of economics. Whatever the reader's precise opinion of the structure, workings, and dynamics of China's polity, it can certainly be argued that it fits within this framework. At the very least, it is informative to assume that such a model can capture part of the dynamics of Chinese decision making, and to compare the results to other approaches in this volume. Disagreements over the precise list of relevant actors, or their relative degrees of influence, do not invalidate the framework approach or the underlying algebra. Instead, they are debates about the quality of the input data, a subject we have already addressed.
DEFINING THE QUESTION
Critical to properly formulating the SMP is a clearly defined question. The model depends on being able to set out the actors' positions on a single linear PSPP, which maps ranked, coherent responses to a single question. The question must be framed narrowly enough such that experts can identify a clear set of actors, and give each one a position without saying “it depends …” Balanced against this is the need to keep the questions broad enough to remain of interest.
The overall topic of ‘reform of the energy sector in China’ is clearly much too broad. The energy sector is much too complicated to be encapsulated in a single response. Many of the actors that have the ability to influence a discussion on one part of the industry—say, oil and gas—are likely different from those who will influence the outcome of reforms in another, such as the nuclear or renewable sectors. Not only might the actors be different, but their positions, along with their influence and salience scores, will also likely change—as they may independently attach different priorities to different sectors. An actor with high influence in a debate regarding one segment might have much reduced influence over policy setting in another. In addition, while favoring one position with regard to one segment, such as competition in electric power generation, the actor might hold quite a different position with regard to a second, such as natural gas pipelines. Our general concern here is on the upstream oil and gas sector. In particular, we ask: “What space is there for the private sector in the upstream oil and gas sector in China?”
The expert interviews clarified that the question should be addressed in two dimensions. First, the policy dimension: What, if any, are the likely reforms of the various policies that regulate the private sector's involvement in this aspect of the energy sector? Second, the competitive dimension: If private sector penetration—regardless of stated policy—is limited by the legacy positions of the SOEs, in particular CNPC, even in segments where private industry is permitted or encouraged, what are the likely reforms that might curtail CNPC's dominance?
In the rest of this article, we analyze these two sub-questions separately. Though both refer to the role that private industry plays in Chinese energy development, they reflect different aspects of the same debate, and actors take a slightly different perspective on each. The former is more broadly focused on policy reform in China that might open up space for private industry activities in Chinese energy. The latter is more narrowly focused on the ways CNPC's specific dominance over the upstream oil and gas sector in China might be reduced. We will address the results of the simulations of these data sets using KTAB's SMP in the next two sections.
THE POLICY DIMENSION: REFORMING PRIVATE SECTOR INVOLVEMENT IN THE UPSTREAM OIL AND GAS SECTOR IN CHINA
Our analysis begins by describing the PSPP that covers the range of positions that actors might take, describing the policy reform options related to private sector involvement in the energy sector.
The two extremes for this policy spectrum are the Positions of 0 and 100. At the far left, the Position of 0 is described as a policy that provides extreme limits on private sector participation in the upstream oil and gas sector in China. At the far right, Position 100 represents a policy that is extremely open and conducive to private participation in the upstream oil and gas sector. Once again, moving from the left to the right suggests shades of gray that reflect policy environments that foster increasing openness to private participation. A Position of 15 would allow the private sector to participate so long as it is in a joint venture with a State-Owned Enterprise. A Position of 30 suggests a more ad hoc approach, where the private sector could operate in the current environment by exception, i.e. with government approval, while keeping the overall restrictions on private entry into the energy sector. A Position of 70 reflects a large political change, where the policy environment is not changed substantively but the private sector is able to participate in a limited fashion, though without government approval.
As with the data for individual actors, the position descriptions and scores along the PSPP are based on the expert interviews, and they represent a plausible understanding of policy possibilities. Depending on the exact subsector, current policy reflects something near Position 15 on the scale, but with investments in unconventional energy sources being nearer 30.
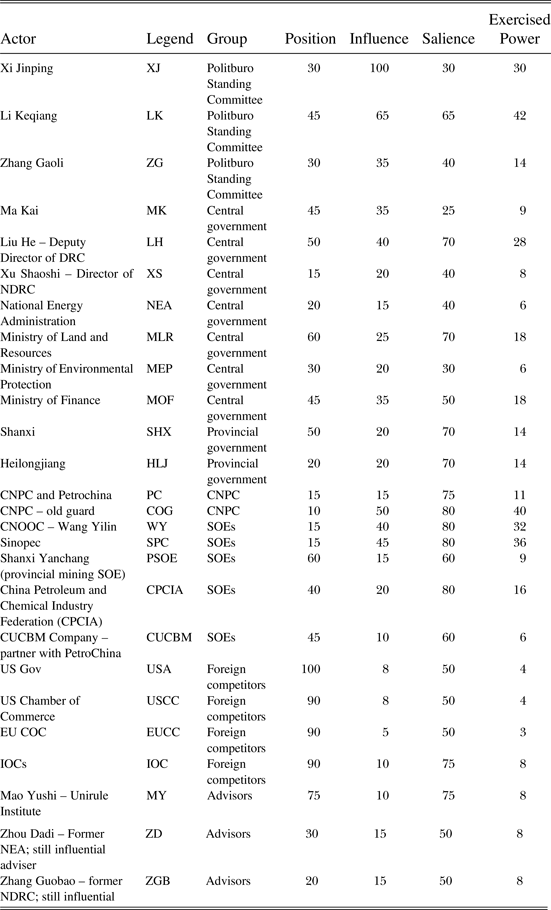
The data for the policy spectrum described in Figure 1 are presented below in Table 3. This table aggregates the values assigned to actors by the group of experts and assumes that they have identified the correct set of actors: some may have been omitted, some included when they should not have been. These caveats notwithstanding, the data represent a consensus view held by several observers of the industry. If nothing else, our analysis of these data lends insight to plausible future policy outcomes, if this shared, observed understanding is correct. Our approach provides logical and coherent outcomes derived from the paradigm presented.
FIGURE 1 Spectrum of Positions: The Policy Space
Table 3 Expert-based Data for the Competitive Space
A few comments about the data in the table. The data are based on the aggregate views of the experts consulted for this analysis. The numeric values reflect their collective judgement about the advocacy, political clout, and priority attached by each of the actors to the policy question. For example, Xi Jinping is unquestionably the most powerful actor in this decision-making process, so he has been assigned an influence score of 100. However, he has been assigned a salience score of 30 for this question. This implies that, while he is the single most powerful actor, he must allocate his political clout among a variety of different policy concerns. In the scheme of things, a salience score of 30 implies that this reform question is a much lower priority for him than at least several other issues. He pays attention to this issue, but in the judgement of our experts, he does not spend most of his time trying to push this issue to the forefront. As a consequence, his effective power is 30—he utilizes only a fraction of his influence in support of the position that he takes on this policy question. While Li Keqiang has less raw influence on this question (65), because he attaches a higher priority (reflected with a salience score of 65), his effective power is slightly higher than Xi Jinping for this issue.
Utilizing these baseline data, we use KTAB to generate a set of simulation results applying a SMP. These simulation results can be seen as a logical conclusion of the subjective data inputs. This allows us to make inferences about the broader policy reform debate, as defined by our panel of experts, that limits private company involvement in the energy sector in China. On the one hand, policies that define the role of private enterprise could remain extremely limiting, as captured on the left hand side of the scale at Position 0. On the other hand, the policy environment could be open and even conducive to private participation, as captured on the right hand side of the scale at Position 100. Rather than pointing to one particular policy that would reduce limits on private activities, or promote private sector involvement, this scale describes the broader mix of policies that create an environment that is more or less open for private industries to participate in the Chinese energy sector.
Figure 2 provides the first visualization generated with the data from our experts. This diagram, known as a Sankey diagram, allows us to observe the simulation results of all of the actors in the data set (identified in Table 3) as they shift their positions from one turn to the next. Turn 0 describes the status quo. In other words, it displays the initial condition described in Table 3. The remaining turns 1–10 present results derived purely from the KTAB simulation. Based on the interactions, and the responses of actors' calculated interactions, positions can change between turns based on the actors' perceived interests and coalition building.
FIGURE 2 Sankey Diagram of Position Changes by Turn: The Policy Space
The range of Positions from 0 to 100 are shown on a color gradient, ranging from blue to green to yellow to red, as shown in the key on the right hand side of the figure (color available in online version only). The vertical axis loosely corresponds to the color gradient in terms of physical distance, but the color shading is a more precise indication of the positional location of actors. This figure clusters actors who hold the same position (after rounding to the nearest 5) into a single weighted line, the thickness of which reflects the exercised power (the combination of the collective influence and salience) of actors holding that position in a particular turn or turns. Individual actors are marked on the left hand side of the figure with a short naming legend consistent with Table 3.
The Sankey diagram in Figure 2 represents the increase and decrease in support accruing to particular policy positions as the CDMP simulation runs through the 10 turns. All actors are making a judgement about their best response to the array of positions and influence exercised along the policy spectrum. This evolves turn-by-turn, as actors see the each other changing positions, with consequent changes in the array of position and influence. The color of the lines shows the position being advocated; the thickness of each line denotes the weight of the support. The legend translates the color of the line into numerical and qualitative policy descriptions. Where two lines merge, one actor is joining another. Where lines split, a particular position is losing a supporting actor. The simulation leads to a narrowed range of positions. These are the plausible outcomes of the CDMP.
By turn 10, the actors have converged on a narrowed range of plausible negotiated outcomes, suggesting that there is little prospect for enhancing the role of private enterprise in the energy sector. Although it is not our intention to speculate on exact reasons for the rise and fall of coalitions, it may be instructive to explain a single movement among actors. It can be seen that the first actor to adjust its position is the US Government, which jumps from a Position of 100 to just 20 in the first turn. The US Government is routinely held to be one of the strongest in the world. Why would it abdicate so swiftly and so completely? Despite its overall power, in this particular policy question its influence is severely limited. Its ability to interfere with and guide the formation of China's domestic commercial policy is highly constrained. Despite the relative importance of the issue, it is not the USA's top priority and this leads to an extremely low exercised power of 4. The USA also appears to take the most extreme initial position; it may well be that as the CDMP commences the US Government realizes the weakness and isolation of its position and adopts what it views as a most likely outcome which still ensures some progress.
Three rough groupings of actors are apparent in turn 0; these could be viewed as latent coalitions. These are: (1) two closely proximate clusters of actors in the light green to yellow gradient, roughly covering Positions 40–50; (2) a cluster of actors in the green gradient, roughly covering a Position of 30; and (3) another cluster in the blue to dark green gradient, roughly covering Positions 0–15. President Xi Jinping (XJ in the figure) anchors the middle cluster of actors, Premier Li Keqiang (LK) anchors the top cluster of actors, and CNOOC Chairman Wang Yilin (WY) anchors the lowest cluster along with the more conservative, senior managers from CNPC, who represent what we have termed the ‘old guard,’ COG.
As the simulation progresses, the set of actors that support the most limits to private sector participation, closer to a Position of 0, consolidates in its range of positions. The actors in the least restrictive cluster, starting around Position 40–50, reduce their advocacy of an enhanced role for private industry as the simulation progresses, and by the final turn support a position closer to the Xi-led grouping. Overall, the simulation suggests that there is little prospect for a policy outcome that provides more operating room for private industry in the energy sector in China. Even the foreign advocates of a greater role for private sector, such as the United States Government (US) and the international oil companies (IOC), drastically moderate their position during the simulation, perhaps reflecting a realization on their part of the limits of their own power to meaningfully impact a domestic policy decision of the Chinese.
Note in particular for Figure 2 that there are some relatively “moderate” voices within the Chinese government, such as Liu He (Deputy Director of DRC, LH in the Figure) the Ministry of Land and Resources (MLR) and the Ministry of Finance (MOF). While taking a position that is more in favor of expanding the role of private enterprise in Turn 0, by the end of the simulation they have adopted a position much closer to the final consensus. The SMP has calculated, in this case, that they have conceded the issue and will not remain advocates for greater reform. Based on the growing consensus among other powerful actors in the decision making process, these more moderate voices see no real prospect for reform and would rather be part of the final consensus than maintain support for an isolated policy position, so they join the more conservative coalition
Let us turn now to an alternative visualization of the simulation results in Figures 3 and 4. Figure 3 presents the left hand side (turn 0) of the Sankey diagram with additional information. Figure 4 presents the right hand side (turn 10) of the Sankey diagram, again with additional information, to provide a different perspective of the distribution of actor positions.
FIGURE 3 Turn 0 Distribution of Positions and Exercised Power: The Policy Space
FIGURE 4 Turn 0 Distribution of Positions and Exercised Power: The Policy Space
Figures 3 and 4 are bar charts, which display the distribution of actors' positions over the spectrum in turn 0 and turn 10 respectively. As noted previously, the turn 0 values are not generated by the KTAB model. They reflect the status quo, i.e. the data collected from the group of experts prior to any model calculations. In both these figures, the different segments within each bar represent different actors, color coded to reflect groups of similar actors: for example, a Politburo Standing Committee (PBSC) member in red, or a State-Owned Enterprise (SOE) in purple. The location of the bars on the horizontal axis indicates the position that they take. For simplicity, when actors take roughly the same position they are stacked on top of each other and rounded to the nearest interval. The height of the different segments reflects the actor's exercised power, with the overall height of the bar showing the power in support of that position from the collection of actors advocating that position. Remember that exercised power is calculated by multiplying influence and salience, so that the influence applied to the actor's position is discounted by its salience. In other words, if an actor is both very influential and cares a lot about the question (has high salience), then it will be represented by a much larger bar than an actor which has the same influence but low salience (i.e. cares less and uses less of its influence).
In Figure 3, the distribution of actors' positions, weighted by their exercised power, is dominated by two large clusters with smaller groups of actors interspersed around them. This view of the turn 0 data in Figure 2 illuminates a more nuanced distinction among the three apparent clusters of actors than was visible in the Sankey diagram.
Two members of the Politburo Standing Committee, Xi Jinping and Zhang Gaoli, occupy a position of 30, slightly in favor of the less reform-minded cluster, between two groups of actors that hold more exercised power in aggregate. Not surprisingly, State-Owned Enterprise (SOE) actors, shaded a light purple color, are skewed toward the left on this spectrum and comprise the bulk of the influence of the actors at Position 20. Members of the Politburo Standing Committee (PBSC, shaded in red in Figure 3), along with Central Government actors (shaded in green), generally take a slightly more favorable view of very moderate reforms within the existing environment. This set of actors, at the Position of 50, is to the right of President Xi's position in support of requiring government approval, but falls well short of removing the need for government approval. In reality, it is not a large difference of position. A few minor actors adopt positions favoring greater openness for private industry, but their political clout (exercised power) is limited. President Xi occupies the median position in terms of the weighted distribution of power.
Figure 4 utilizes the same type of information as in Figure 3, but this time capturing how actors' positions have changed after 10 turns of interactions. Positions evolve based on the reaction of each actor to the array of positions and influence across the policy spectrum. They are persuaded to adjust their own positions based on their changing estimate of the most successful blend of an outcome they prefer and the probability of that outcome being implemented with their support. The SMP suggests actors will settle on the new positions reflected in this figure. As in Figure 3, for simplicity, actors whose positions are very similar are rounded to the nearest ten-point interval. The consolidation of positions across the actors in the simulation is more striking in this figure than in the Sankey diagram (Figure 2). The strength of President Xi's position—where all the modelled Politburo Standing Committee members now cluster—along with a slightly more conservative cluster of actors, suggest that reformist alternatives seem quite unlikely.
The experts who provided the data for our analysis assessed Xi Jinping as the closest to a singular decision maker (in that he has the greatest power), though one could argue that in a consensus-based system like China he remains the first among many. In the baseline data set, President Xi was given a Position of 30, and the simulation indicates that this is a position to which he holds firm over the course of 10 turns.
One question that arises is whether or not senior leaders such as Xi Jinping position themselves in the center of consensus, or whether consensus forms around them. We cannot test this explicitly, but we can try to evaluate the weight of institutional inertia, and to what extent senior leaders are able to drag the consensus to their preferred position. In doing so, we are also asking whether it matters if our experts have misjudged the position of the senior decision makers. Does it make any difference? Is the ratio of influence between the senior leaders and the rest such that the individual influential voices are drowned in the backdrop of competing interests? At a very simple level we can compare the ratio of exercised power: Xi Jinping has 30, Li Keqiang, 42; the total is 400.
We can also construct a series of scenarios to evaluate these differences: setting the positions of President Xi and Premier Li to range from anywhere between 0 and 100. In other words, we can assess how the overall simulation performs if a specified actor is assumed to be less in favor of allowing private activity in the energy sector, or if he actively advocates a policy environment that is open and conducive to private activities, or anywhere in between. Figure 5 displays the range of simulation results with these varied assumptions regarding President Xi's or Premier Li's starting position.
FIGURE 5 Scenario Analysis Results for Position: The Policy Space
For each actor, 11 simulations were completed, with 10 turns each, given a starting position for each of the two senior leaders of 0, 10, 20, and so on through a position of 100. The figure displays five pieces of information for turn 10 of each of these simulations. The black tick mark indicates the senior leader's position at the end of the tenth turn of the simulation (Xi Jinping or Li Keqiang). The black, solid diamond indicates the median position of all the actors, i.e. that position which has an equal distribution of exercised power on either side of it. The outline diamond indicates the mean position of all the actors; the error bars the standard deviation. Finally, the red error bars indicate the range, from low to high, of positions for all actors in the 10th turn of the simulation. Each of the 11 simulations is displayed from left to right, with the senior leader's starting (turn 0) position increasing by 10 points along the x axis. The thin blue lines show the range of positions for all actors at turn 0.
The comparison across these scenarios suggests that the senior leaders cannot, on their own, drive consensus among the actors in the baseline simulation and that their high levels of influence do not translate into an ability to dominate the CDMP. This can be seen as an indication of the weight of political inertia. If either Xi Jinping, who is routinely held by our experts to be the most influential political leader, or Li Keqiang, the actor given the highest exercised power in our simulation, were such a driver, then the consensus would emerge around his initial position, whatever it might be. For these simulations, this is clearly not the case. The range of actor positions, indicated by the red blocks, appears to be relatively fixed over an interval between 15 and 45 by turn 10 in each of the simulations. However, in the simulations where President Xi is outside this range, he sets a new lower or upper bound. When he is either at 0 or 10 on the left hand side of the figure, the mean and median of the overall simulation do not shift—together these are good approximations of the center of exercised power for the simulation outcome—and President Xi sets the lower bound of the range of actor positions. When he has started the simulation with a position of 50 or greater, moving from the center of the figure to the right hand side, again the mean and median do not vary appreciably, and President Xi sets the upper bound of the range of actor positions. Li Keqiang also does not appear to shift the consensus and is less able to maintain an extreme position, suggesting that despite his higher exercised power he is also a partner in greater coalition building.
Xi Jinping's starting Position (30), as assigned by our experts for the baseline data, appears to be the likely ending point of the bargaining simulation, regardless of whether either of the senior leaders start at this position or not. Thus, if the baseline data identified by our experts for President Xi are correct, this suggests that either his natural instinct is aligned with the consensus on the issue or he has identified the likely locus of exercised power and has situated himself in support of this position. In the end, we do not need to know which proposition holds because his positioning does not significantly affect the outcome of the simulation, given the asymmetry of influence and the weight of institutional inertia.
Finally, we have not systematically evaluated the impact of the removal of actors from this decision-making process on the prospects for reform. The anti-corruption campaign has the side effect of reducing the number of powerful actors within CNPC as well as the larger energy sector. If this effort were to be accelerated even more, actors removed from the equation were replaced with substantially more reform-minded actors, and President Xi were to aggressively push for reform, these results may no longer hold. However, without a major reshuffling of the power dynamics among the actors who drive this decision across the policy space, the SMP indicates that President Xi cannot unilaterally drive reform on this question.
THE COMPETITIVE DIMENSION: REFORMING CNPC AS THE DOMINANT SOE IN THE UPSTREAM OIL AND GAS SECTOR IN CHINA
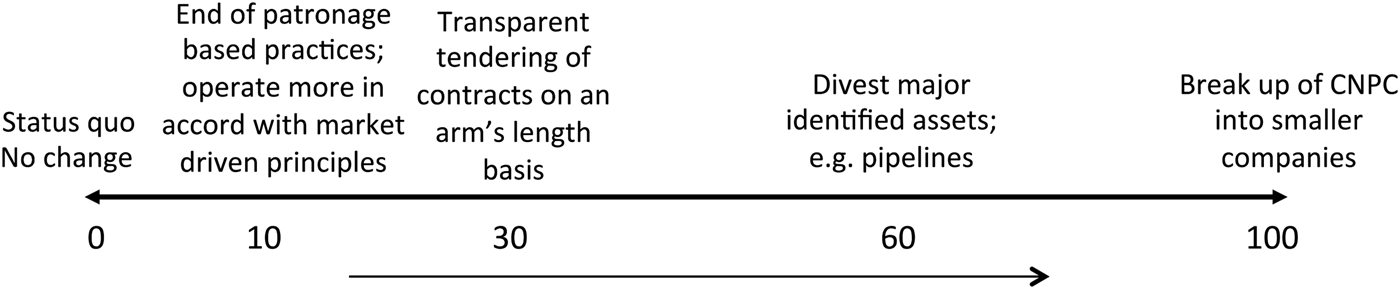
In this section we address the second question, the political debate over the competitive dimension in China. In particular, we assess the appetite for reforming CNPC as the largest SOE in the country's oil and gas sector. Once again, we start with a definition of the spectrum of possible outcomes that actors might adopt as positions. Figure 6 presents the spectrum for this second question.
FIGURE 6 Spectrum of Positions: The Competitive Space
This figure provides a range of possible outcomes that address possible methods of reducing CNPC's role in China's energy markets. Again, the position descriptions and values were identified by our experts during structured interviews. We use the data as an indication of widely held beliefs regarding the possible ongoing policy discussions.
One extreme of the array of positions represents no change, or the status quo, assigned a Position of 0. At the other extreme is the drastic act of breaking CNPC into smaller pieces, which reflects the most wide reaching and aggressive approach, assigned a Position of 100. Points in between these two extremes reflect shades of gray as we progress along the spectrum. A Position of 10 represents a more symbolic gesture, still meaningful but not expected to reduce CNPC's dominance in the sector. Advocacy of this position reflects support for the application of market-driven principles in CNPC's business practices in ways that are not fundamental to its business operations, such as a reduction or end to patronage-based practices. Farther to the right on the spectrum, a Position of 30 reflects more meaningful reforms. In this case, representative of this more substantive position is the notion of transparent tendering of service contracts, where CNPC is required to create a level playing field for bids to be won on their merits, rather than retaining favored vendors for these services. Much farther along to the right is a Position of 60, which reflects a much more substantive and meaningful change, i.e. the required divesture of major CNPC assets, such as pipelines to be run on an open access basis. Although we identify 0 as the status quo, current rhetoric hints at 10, 30, and even 60, though these more reformist positions have not been formalized or institutionalized yet.
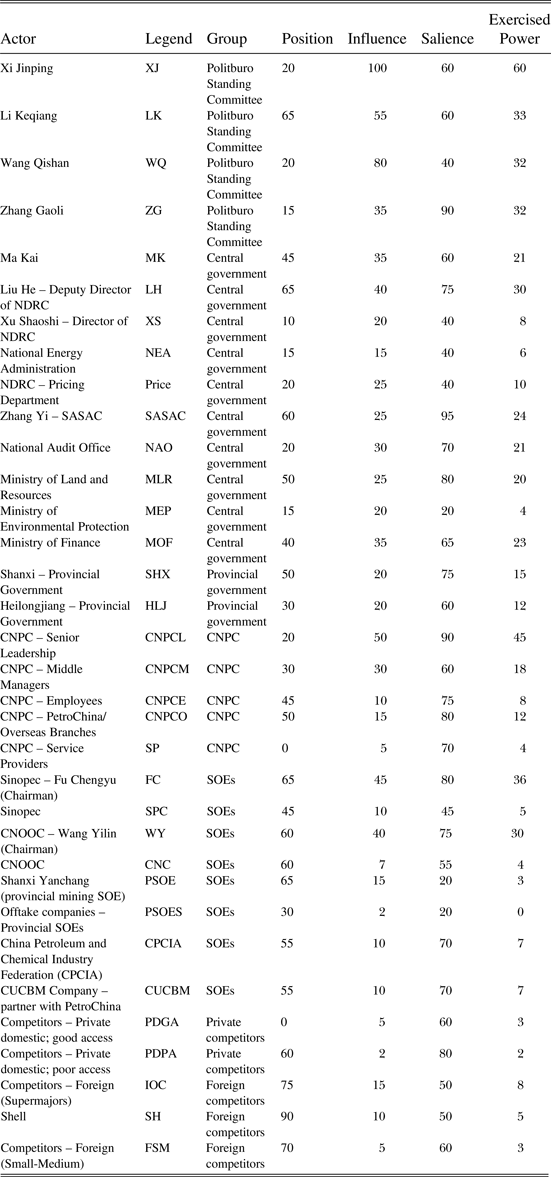
These identified points along the spectrum were an attempt by our experts to capture the range of possible advocacy and illustrative actions that would reform CNPC and reduce its span of control within China. In reality, a range of possible alternatives is implied by the points surrounding and in between these discrete options. The identified positions simply act as markers to reflect the substantive meaning of the PSPP. The same experts who provided data for the first spectrum also provided data set for this second spectrum; once again, we aggregated their individual inputs to form the baseline data set that we present in Table 4.
The Sankey diagram in Figure 7 (as in Figure 2 for the first question) captures the simulated change in positions of actors over time, along with the associated variation in cumulative exercised power that clusters around certain positions over the 10 turns of the SMP simulation. As before, the gradient colors reflect the range of potential positions for the actors. The thickness of the lines reflects the collective strength of actors' exercised power around a position over the course of the simulation. Again, individual actors are marked on the left hand side with a short naming legend, consistent with Table 4.
FIGURE 7 Sankey Diagram of Position Change by Turn: The Competitive Space
The diagram represents the increase and decrease in support accruing to particular policy positions as the CDMP simulation runs through the 10 turns. The color of lines shows the position being advocated; the thickness of each line denotes the weight of the support. The legend translates the color of the line into numerical and qualitative policy descriptions. Where two lines merge, one actor is joining another. Where lines split, a particular position is losing a supporting actor. The simulation leads to a narrowed range of positions. These are the plausible outcomes of the CDMP.
Compared with the Sankey diagram for the broader policy question reflected in Figure 2, the final range of positions in Figure 7 is much wider. This reflects a more significant, sustained disagreement over the correct answer regarding CNPC's future. The simulation results suggest that there are more highly divergent, but well-entrenched, interests at play in this CDMP as compared to the CDMP around overall policy reform. Given the more concrete effects of a corporate restructuring versus a policy update, with more immediate and clear winners and losers, this may not be a surprise.
Figure 7 makes the point that the largest block of power (in green) remains around Xi Jinping's position over the course of the simulation, and this cluster is unyielding in the face of efforts to promote greater reform at CNPC.
This is a surprising finding, given the expectations of the experts we interviewed. In general, there was a belief among our experts that reform of CNPC is forthcoming. In the context of the corruption scandals facing CNPC, and the frequent reports of the arrest of senior executives, there is an expectation that substantive reforms are imminent for the company, either as a side effect of the corruption scandals, or as a partial motivation for the removal of CNPC leadership. This is not borne out by the SMP simulation. For the other actors, there is some moderation in their position, but much disagreement remains.
Figure 8 and 9 are bar charts showing either end of the set of turns represented in Figure 7's Sankey diagram. Once more, each of the bars reflects the position of the actors on the spectrum according to the labels on the horizontal axis. The height of each actor's bar again reflects the combination of influence weighted by salience, or the exercised power of the actor. The overall figures summarize the position each actor takes, and the degree of political clout that will be applied to support the position that they take on this question.
FIGURE 8 Turn 0 Distribution of Positions and Exercised Power: The Competitive Space
FIGURE 9 Turn 10 Distribution of Positions and Exercised Power: The Competitive Space
Figure 8 shows that there is no clear consensus in favor of any position on the spectrum. Once more, for the initial state, at each position (x-axis) the cumulative exercised power of the individual agents holding that position (the stacked colored blocks, color scheme as before) is shown. The largest block of influence supports very superficial changes to CNPC's role in the Chinese energy sector. Xi Jinping, notably, and other actors all support a Position of 20. A few less influential actors support even less reform of CNPC. More reform-oriented actors do not have a consensus view on how to reform CNPC, with smaller blocks of influence distributed from a Position of 30 up to a Position of 70. All things being equal, as the leader of China, President Xi is widely viewed as the driver of any sort of change in observed outcome. His position is a useful reference point for the expected outcome in this case.
Figure 9 displays the same information as in the previous figure, but is the result of 10 turns of interactions among the actors. After 10 turns have passed, with the consequent shifts in position by individual actors taking place each turn, the SMP suggests actors will settle on the new positions reflected in this figure. Once again, for simplicity, actors whose position is very similar are rounded to the nearest interval.
As noted in Figure 9, Xi Jinping remains at a Position of 20 after 10 turns of interactions. Indeed, the set of actors in this block of influence appears to be largely unchanged. This suggests that the only reforms to CNPC, as calculated by the SMP, will be superficial. Notably, the more progressively minded actors from turn 0 have all exhibited some moderation. The realization that substantial reform is probably not possible has caused these actors to adopt a less reform-minded position over the course of the turns simulated, and so they have arranged themselves in clusters grouped around Positions of 40 and 50. This outcome would imply that there will be some meaningful reform to CNPC that would include the fair and transparent tendering of services to third parties. However, as President Xi—along with other members of the Politburo Standing Committee—will need to agree to, and potentially even drive, reforms in this context, his position is perhaps more informative. It is likely based on the model outcome, that some level of reform will occur, but the SMP suggests that the nature of reform will reflect a Position between 20 and 40.
To explore this issue further, we take a careful look at Xi Jinping's position and see to what extent he alone as leader is able to overcome the institutional inertia our experts have implied through the ratio of influence between the President and the rest. In the baseline data set, President Xi adopts a Position of 20, and the simulation indicates that this is a position to which he holds firm over the course of 10 turns. But to what extent is President Xi able to force consensus regardless of his position? After all, his exercised power is a very high 60, but against a total of 551. In asking this question we can test our experts' perceived weight of institutional inertia in China, and evaluate whether the precise Position value accorded the President by our experts actually matters for the final output.
We can test this by allowing Xi Jinping to take Positions ranging from anywhere between 0 and 100. In other words, we can assess how the overall simulation performs if the President is assumed to be less in favor of CNPC reform, or if in fact he actively advocates a breakup of CNPC, or anywhere in between.
Figure 10 displays the range of simulation results with these varied assumptions as to President Xi's starting position. The figure displays five pieces of information for turn 10 of each of these simulations. The black tick mark indicates Xi Jinping's position in the 10th turn of the simulation. The black, solid diamond indicates the median position of all the actors at the end of the simulation, i.e. that position which has an equal distribution of exercised power on either side of it. The outline diamond indicates the mean position, the error bars the standard deviation. Finally, the red block indicates the range, from low to high, of positions for all actors at turn 10 of the simulation. Each of the 11 simulations is displayed from left to right, with President Xi's starting (turn 0) position increasing by 10 points. Again, the thin blue line shows the positions of all the actors at turn 0.
FIGURE 10 Scenario Analysis Results for Position: The Competitive Space
This figure reinforces the surprising finding from the baseline simulation results. Even in the extreme case where Xi Jinping is assumed to begin the simulation by advocating a breakup of CNPC, there is not enough support for such drastic action to prevail. Indeed, no actor, including the President, ends the simulation with a Position higher than 70 in any of the simulations. The mean position, a reasonable indicator for the center of the distribution of actors and their power, varies only between 35 and 50. The median position, an alternative indicator of the center of the distribution of actors, varies over an even narrower interval. At the far right hand side of the figure, where President Xi's starting Position is assumed to begin between 70 and 100, he concludes the simulation at Positions higher than 60. However, he does not manage to persuade a group of stakeholders to support more drastic reform of CNPC and does not remain an advocate of these positions over the course of the simulation. These results reinforce the notion that the maximum reform one could expect of CNPC would be centered around the 30–50 range, as in the baseline data. The majority of political clout in the Chinese system, based on President Xi's position but not dependent on it, supports only limited reforms to CNPC's role in the energy sector in China.
CONCLUSIONS
Xi Jinping's Third Energy Revolution has begun in earnest. But it is not clear that this revolution will extend toward a new and critical role for the private sector in the energy domain. Rather, in the near term we believe that major moves toward marketization of the energy SOEs, or scaling back the influence of CNPC over the sector, are unlikely to occur because the political will to push through such changes does not exist.
In drawing conclusions from KTAB simulations, it is important to remember not only the limitations of models, but of what KTAB-style models should be used for in the first place. The model results and simulations presented here are not narratives about what individual actors, named or unnamed, will do. Instead, the analysis applies a methodology that can interpret how a set of actors will behave within a broad range of CDMPs, and provides a framework for us to understand what is plausible and what is not plausible. While the simulation does provide a forecast policy outcome, it is not therefore in this forecast alone that the model holds value. Identifying likely coalitions and gaining insight into the possible power-plays and trade-offs is another benefit, as is the value to be gained from testing competing initial assumptions about the distribution of preferences and capabilities against alternatives or resultant coalitions. We are presenting KTAB here as a bridge between quantitative and qualitative approaches to political science studies of decision making, and as a way of looking beyond the politics of factional conflict to the coalitions supporting policy formulation.
The particular values assigned by experts to the actors, even the list of actors itself, is not what is most important, though they make explicit a set of input assumptions utilized by KTAB. Nor should the simulation results for individual actors be seen as a representation of the future. Through these KTAB simulations, we have brought a structured, analytical approach to widely held beliefs about what different groups in China are really calling for, and we outline a set of logically derived conclusions. Further, we enable researchers to look beyond the politics of factions and see how coalitions can emerge, not because of client–patron relationships, but as a result of shared policy advocacy.
Of course, a follow-up question then becomes how we can disentangle independent convergent policy advocacy versus policy support stemming from faction membership. To the extent that these different methodological approaches, with their inherent assumptions about what drives policy, produce similar understanding of the phenomena, then we can be more confident in the results. A careful assessment of the differences in insight provided by disparate methodological approaches could reveal insight into the consequences of different assumptions about how decisions are made.
Contrary to the expectations of our experts—and KAPSARC's own researchers—prior to this exercise, the SMP indicates that substantive change to the oil and gas sector should not be anticipated. Despite a number of developments that have raised observers' expectations that major changes to the policy and practice of the energy sector may be imminent, the simulations suggest there is significant resistance to either adjusting the role played by CNPC or to opening up the policy dimension for private competition.
In addition, analysis of the data regarding China's senior leadership, generally believed to be the most powerful and important actors for this CDMP, as compared to the weight of institutional inertia, supports the conclusions drawn from the baseline data sets. The simulation results suggest that, even if there are errors in judgment in the inputs based on the views of our experts regarding particular actors (even the most critical ones), individual leaders will not unilaterally force consensus on a greater level of reform of CNPC's role in the sector or rolling back policies that constrain private entry into the energy sector. Short of all faction members shifting their positions as a result of a shift in the leader's opinion, the data we have collected and the KTAB simulations suggest that major reforms of this nature are implausible.