Can non-pharmaceutical interventions (NPIs), such as social distancing, reduce mortality during a pandemic? If so, do NPIs benefit public health at the expense of the economy, or can NPIs intended to contain the spread of a pandemic also reduce its economic severity?
The 1918 Flu Pandemic was the most severe influenza pandemic in U.S. history. It killed about 675,000 people in the United States, or about 0.66 percent of the population. Most deaths occurred during the second wave in the fall of 1918. In response, major U.S. cities implemented a range of NPIs. These included school, theater, and church closures, public gathering bans, quarantine of suspected cases, and restricted business hours. In this paper, we study the impact of these NPIs on both mortality and economic activity.
Our analysis proceeds in three steps. First, we study contemporary newspaper accounts of the pandemic to understand what drove the variation in speed and stringency of NPI implementations across U.S. cities. We find that an important driver of the NPIs were differences in the information available to local policymakers, which in turn is related to the geography of cities. The flu moved from east to west and thus cities further west had more time to prepare for the arrival of the virus. Our analysis further reveals that NPIs were heavily debated by public health officials, business owners, and other local actors. Beyond the geographic factors, the implementation of NPIs hence often came down to local policy preferences and political economy factors.
Second, we empirically evaluate the effects of NPIs on mortality. We use data on the timing and intensity of NPIs for 46 cities based on Markel et al. (Reference Markel, Lipman, Alexander Navarro, Sloan, Michalsen, Stern and Cetron2007), augmented with information from Berkes et al. (2020) and new hand-collected data. We find that NPIs were most successful in reducing mortality if they were both implemented sufficiently quickly after the arrival of the virus and upheld for long enough. Cities that were both fast and aggressive in implementing NPIs achieved reductions in peak influenza and pneumonia mortality of about 50 percent, thereby flattening the mortality curve. Moreover, these cities experienced a reduction in cumulative excess mortality of up to 34 percent. We observe similar results for all-cause mortality, an outcome potentially less prone to measurement errors. Overall, our findings suggest that NPIs were successful in slowing the rate of disease transmission and lowering cumulative mortality, potentially by mitigating epidemic overshoot (Bootsma and Ferguson Reference Bootsma and Ferguson2007).
Third, we ask: Is there a trade-off between NPIs that reduced mortality and economic activity? In theory, the economic effects of NPIs could be either positive or negative. All else equal, NPIs constrain social interactions and thus economic activity that relies on such interactions. However, economic activity in a pandemic is also reduced in the absence of such measures, as households reduce consumption and labor supply to lower the risk of becoming infected, and firms cut investment in response to increased uncertainty. While the direct effect of NPIs is to lower economic activity, they also mitigate the impact of the original shock: the pandemic itself. By containing the pandemic, NPIs can thus also mitigate the pandemic-related economic disruptions such as the contraction in labor supply from voluntary distancing and illness.
To study the short-term impact of NPIs on local economic activity, we construct a city-level index of business disruptions at a monthly frequency from information in Bradstreet’s, a contemporary trade journal. Our index implies that the pandemic itself was associated with an increase in business disruptions in the fall of 1918. However, comparing cities with strict and lenient NPIs, we find that the increase in business disruptions was quantitatively similar across the two sets of cities.
Further, we examine the economic impact of NPIs in the medium run using data on city-level employment and output from the Census of Manufactures. We find no evidence that cities that intervened earlier and more aggressively perform worse in the years after the pandemic. At a minimum, our estimates reject that cities with stricter NPIs experienced a large decline in employment and output in the years following the pandemic, relative to cities with lenient NPIs. Altogether, our findings suggest that, while the pandemic was associated with economic disruptions, NPIs reduced disease transmission without exacerbating the pandemic-induced downturn.
Our empirical findings are subject to the concern that policy responses are endogenous and could be correlated with shocks to mortality or economic activity. To allay this concern, we show that the results are robust to controlling for a range of potential confounders including, longitude, the timing of the flu’s arrival, city demographics, density, manufacturing employment-to-population ratio, exposure to WWI mortality and production, poverty, and air pollution.
We further support our evidence on the negative short-term impact of the pandemic on the economy by accounts in contemporary news-papers. Newspaper articles suggest that there were significant declines in output and sales across a wide range of industries due to labor shortages. Moreover, there was significant voluntary distancing due to fear of the virus. Attendance at theaters, cafes, and places of public amusement declined, while absenteeism from schools and workplaces increased markedly. These accounts help explain the limited adverse economic effects of NPIs. Demand and labor supply were depressed before NPIs were implemented and in places with less stringent NPIs, indicating that the worst economic disruptions were caused by the pandemic itself.
Notably, our review of newspaper articles reveals that some contemporaries appreciated the absence of a trade-off between moderate NPIs and the economy. When studying debates about the costs and benefits of NPIs, we find that some businesses that were directly affected by closures opposed these measures, while other business owners believed stricter NPIs would mitigate the most disruptive economic effects of the pandemic.
We emphasize caution when generalizing these results to the COVID-19 pandemic. The 1918 Flu Pandemic was significantly deadlier than COVID-19, especially for working-age individuals, and effective vaccines were not available. Thus, the economic merits of NPIs may have been greater in 1918. NPIs implemented in 1918 were also less extensive than those used during the COVID-19 outbreak. Moreover, the structure of the U.S. economy and society has evolved substantially over a century. Nevertheless, our results suggest that it is not a foregone conclusion that there is a trade-off between reducing disease transmission and stabilizing economic activity in a pandemic.
Related Literature
This study is most closely related to the literature studying the impact of NPIs in the 1918 Flu Pandemic, to which we make several contributions. First, we expand the coverage of NPI measures to a larger sample of cities with information from Berkes et al. (2020) and with newly collected data. Second, we provide new insights into the effect of NPIs on mortality. Our findings on mortality are consistent with evidence from the epidemiology literature (Markel et al. Reference Markel, Lipman, Alexander Navarro, Sloan, Michalsen, Stern and Cetron2007; Hatchett, Mecher, and Lipsitch Reference Hatchett, Mecher and Lipsitch2007), but point to larger and more robust reductions in cumulative mortality than found in other work (Clay, Lewis, and Severnini Reference Clay, Lewis and Severnini2018; Barro Reference Barro2020). An important new insight from our analysis is that the most robust reductions in mortality occurred in cities that were both timely and aggressive in implementing NPIs. Our results also extend to all-cause excess mortality, a potentially less biased measure of mortality compared to mortality explicitly attributed to influenza and pneumonia. Third, while the existing literature on NPIs during the 1918 Flu Pandemic has primarily focused on mortality outcomes, our paper also explores the economic effects of NPIs. An exception is Velde (Reference Velde2022), who finds that NPIs reduce mortality at a limited economic cost.Footnote 1 Finally, we provide extensive narrative evidence on the city-level factors that drove NPI implementation, as well as contemporary perceptions of how NPIs affected mortality, the economy, and the broader society.
More broadly, our paper is related to research on the economic impact of the 1918 Flu Pandemic and other pandemics. Velde (Reference Velde2022) presents a comprehensive account of the economic impact of the 1918 Flu Pandemic in the United States and documents that it was associated with a short and moderate recession in the aggregate. Garrett (Reference Garrett2009) finds that geographic areas with higher influenza mortality saw a relative increase in wages between the 1914 and 1919 manufacturing census years, consistent with labor shortages. Dahl, Hansen, and Jensen (Reference Dahl, Hansen and Jensen2022) find that the 1918 pandemic resulted in a V-shaped recession in Denmark. Karlsson, Nilsson, and Pichler (Reference Karlsson, Nilsson and Pichler2014) find that the 1918 pandemic led to a persistent increase in poverty rates and a reduction in the return on capital in Sweden. Barro, Ursúa, and Weng (Reference Barro, Ursúa and Weng2020) use country-level data and find that the 1918 pandemic displayed worse education and labor market outcomes in adulthood.
NPIs DURING THE 1918 FLU PANDEMIC
The 1918 Flu Pandemic spread worldwide and lasted from January 1918 through 1920. The pandemic is estimated to have caused at least 50 million deaths globally, including around 550,000 to 675,000 in the United States between September 1918 and June 1919—about 0.66 percent of the population (Johnson and Mueller 2002). Figure 1 shows the sharp spike in mortality in the United States at the time.
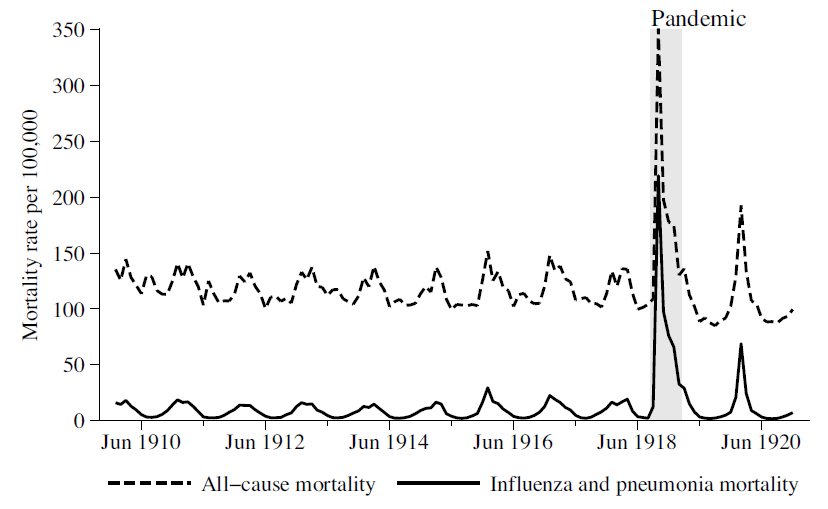
Figure 1 UNITED STATES MONTHLY DEATH RATES, 1911–1920
Notes: Statistics based on the Census Bureau “registration areas,” which by 1920 encompassed 82.3 percent of the U.S. population (Doshi Reference Doshi2008).
Sources: Death counts from the Census Bureau Mortality Statistics (1910–1920); population estimates interpolated from the Vital Statistics of the United States (1939 ed.).
In the United States, the pandemic came in three waves: spring 1918, fall 1918, and a third wave spanning from the winter of 1918–19 to the spring of 1919. The spring 1918 wave was mild. The second wave was the pandemic’s peak and was responsible for most of the deaths attributed to the pandemic in the United States, with the highest toll in October of 1918. The second wave’s increased severity is believed to have been caused by a mutation that made the virus significantly deadlier (Barry Reference Barry2004).
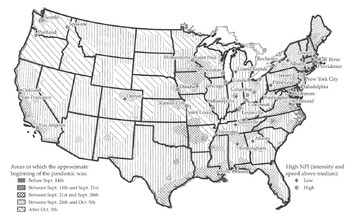
The second wave began in Boston with the first cases reported in late August 1918 (Barry Reference Barry2004). It then spread down the eastern seaboard to New York, Philadelphia, all the way to New Orleans, and around to Washington state, as shown in Figure 2, based on a map by Sydenstricker (Reference Sydenstricker1918). Meanwhile, the disease followed the rivers and railroads to the interior of the country. Mass troop movements during the closing stages of WWI contributed to the spread of the virus in the United States and around the world (Crosby Reference Crosby2003).
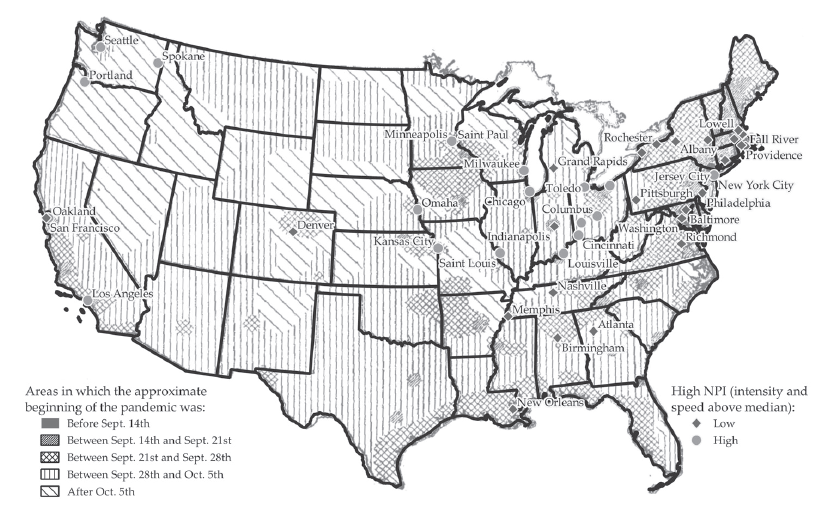
Figure 2 START DATE OF THE PANDEMIC BY REGION AND CITY CLASSIFICATION BY NPI MEASURES
Note: Cities with above-median NPI speed and intensity are labeled as High NPI, and the rest as Low NPI. Sample comprises the 46 cities with fully-available NPI information.
Sources: Map from Sydenstricker (Reference Sydenstricker1918) and georeferenced by the authors; NPI data from Markel et al. (Reference Markel, Lipman, Alexander Navarro, Sloan, Michalsen, Stern and Cetron2007), Berkes et al. (2020), and hand-collected by the authors.
In most cases, patients experienced a moderate-to-severe influenza, but 10 to 20 percent of cases were very severe with a virulent virus or pneumonia (Crosby Reference Crosby2003). Symptoms included fever, chills, joint pain, pain in the diaphragm, vomiting, headache, bleeding from oral cavities, damage to internal organs, and impacts on a patient’s mental state (Starr Reference Starr1976; Barry Reference Barry2004). A distinct feature of the pandemic was a high death rate for adults aged 18-to-44 and for healthy adults, resulting in a W-shaped mortality age profile. Various treatments and vaccines were tried, but effective treatment was limited.Footnote 2 Instead, nursing care, such as keeping a patient hydrated, nourished, warm, and providing access to fresh air, was the only means for increasing the chances of recovery (Crosby Reference Crosby2003).
Overview of NPIs
Most major U.S. cities applied a range of NPIs during the fall and winter of 1918. While the exact cause of the disease was unknown at the time, public health officials understood that it was more likely to spread in crowded areas, by coughing and sneezing, and by the use of common drinking cups (Barry Reference Barry2004). For instance, the New York Times reported on 7 October 1918: “Under adverse conditions the health authorities of American communities are now grappling with an epidemic that they do not understand very well. But they understand it well enough to know that it spreads rapidly where people are crowded together.”Footnote 3
The NPIs implemented in U.S. cities included social distancing measures such as the closure of schools, theaters, and churches, and the banning of mass gatherings, such as parades, public funerals, and meetings of political parties and unions. Other NPIs included mandated mask-wearing, case isolation, making influenza a notifiable disease, and public disinfection/hygiene measures. Many cities introduced staggered business hours to avoid crowding in public transportation. Some cities also closed libraries, colleges, saloons, dance halls, bowling alleys, movie theaters, and other places of public amusement.
Variation across U.S. Cities in NPIs
Our empirical analysis exploits variation in the speed and intensity of the implementation of NPIs across major U.S. cities in the fall of 1918 to estimate the impact of NPIs on mortality and economic activity. This raises an important question: What are the sources of variation in NPIs across cities?
In this section, we discuss evidence of the variation of NPIs from contemporary newspaper articles. We find that there are two broad sources of variation in local policymakers’ decisions to implement NPIs. The first source is differences in the information available to local policymakers at the time of the arrival of the flu, primarily driven by differences in city location—essentially, distance to the East Coast. The second source is differences in the policy preferences and beliefs of local policymakers, as well as local political economy factors. The latter results in variation conditional on city location.
CITY LOCATION
Distance to the East Coast explains a substantial part of the variation in NPIs across cities (see Figure 2). As the fall wave of the pandemic swept the country from east to west, cities in the Midwest and West were affected later. These cities generally implemented NPIs faster as they had more time to prepare and could learn from the experiences of the eastern cities.
There are numerous examples of this information channel driven by city location.Footnote 4 The Health Commissioner of Omaha argued that public gathering bans were introduced preemptively based on the experience of eastern cities: “The condition in Omaha is by no means as serious as in eastern cities… We are taking this drastic step to keep it from becoming so.”Footnote 5 The mayor of Cincinnati emphasized that NPIs were introduced based on the experience of other cities that were hit earlier: “Cincinnati is endeavoring to prevent an epidemic of Spanish influenza. There is no epidemic here. We are doing what other cities should have done—we are preventing.”Footnote 6 The Seattle Star admonished citizens to not “grumble because you can’t see a movie” as ”[t]he health of the city is more important than all else. An ounce of prevention now is worth a thousand cures. In Boston, influenza has taken a toll of thousands. We do not want to court that situation here.”Footnote 7
The close relationship between NPIs and city location, however, raises concerns for the empirical analysis that exploits variation of NPIs across cities. For instance, western status may also be correlated with other city-specific characteristics that interact with the arrival of the flu and drive both policy and outcomes, such as city density, demographics and city poverty, and air pollution. Further, the virus may have become weaker over time (Crosby Reference Crosby2003; Almond Reference Almond2006).Footnote 8 A decline in virulence may generate a spurious correlation between faster and more stringent NPIs and lower mortality. The later arrival of the flu in the west may have also given the local population more time to prepare, making it a priori difficult to distinguish between the effects of NPIs and the effects of self-distancing by the local population.
To address these important concerns, in our empirical analysis, we ensure that all our main results are robust to controlling for various city characteristics such as density, longitude, and the timing of the arrival of the flu based on Sydenstricker (Reference Sydenstricker1918). We also present results excluding the most western cities. After controlling for these characteristics associated with the timing of the flu’s arrival, we argue that most remaining variation stems from factors associated with the local policymakers that happened to be in charge when the second wave hit and are thus not directly related to local health or economic fundamentals. We discuss this second source of variation in NPIs next.
LOCAL POLICY PREFERENCES AND POLITICAL ECONOMY FACTORS
A second source of variation in NPIs across cities is differences in the preferences and beliefs of local health officials. Views on the need for and effectiveness of NPIs differed widely across public health officials and other local actors. Moreover, there were widespread debates about NPIs involving local public officials, doctors, business owners, and civil society. These debates informed local policy decisions.
The role of local public health officials. Local responses to the pandemic were not driven by a federal response, as no coordinated pandemic plans existed.Footnote 9 Instead, local health officials had discretion over NPIs, and individual public health officials were central to their implementation.
St. Louis is often cited as an example of the quick and effective implementation of social distancing measures to manage the epidemic. This included canceling the Liberty Loan parade, in contrast to other cities such as Charleston and Philadelphia, where the exigency to meet quotas for liberty loans to finance WWI led local governments to ignore the health officials’ recommendation (Hatchett, Mecher, and Lipsitch Reference Hatchett, Mecher and Lipsitch2007; Barry Reference Barry2004).Footnote 10 The leadership of the “strong-willed and capable” Health Commissioner Max C. Starkloff was crucial to the policy response in that city (Navarro and Markel 2016). Medical doctors in St. Louis believed that the timely closing of public places had prevented the high mortality experienced by eastern cities such as Boston.Footnote 11
In Oakland, California, the mayor initially pursued a light-touch approach. However, the appointment of a new health commissioner, who believed that more stringent NPIs were necessary, led the mayor to reverse course and close places of public amusement, schools, and churches.Footnote 12 In many other cities, however, public health officials did not take the virus seriously at first, played down the disease as nothing more than “old fashioned grippe,” incorrectly claimed they had the disease under control, or were unwilling to take charge of the response.
The Twin Cities of Minneapolis and St. Paul provide another interesting case study of differing responses to the epidemic. While the flu arrived in the Twin Cities around the same time, health commissioners in Minneapolis and St. Paul disagreed on whether closing public spaces was the best course of action in the epidemic. Local officials in Minneapolis moved quickly to ban public gatherings and close schools in early October. Right across the Mississippi River, St. Paul remained largely open into November, as its leaders were confident they had the epidemic under control and believed NPIs would not be effective.Footnote 13
Debates over the cost-effectiveness of NPIs. Public officials and other actors debated whether NPIs were effective in reducing the spread of the disease and mortality, as well as the extent of a tradeoff between public health and economic activity.Footnote 14 Policymakers and public health officials in some cities argued that NPIs were effective in protecting public health. Some also argued that NPIs would benefit the economy.
For example, following a meeting of public local health officials in which Denver closed all places of public assembly, The Denver Post reported: “From an economic viewpoint, the doctors were agreed that one or two or three weeks closing of public assemblies now would save many dollars in the long run, for they confidently predicted that 40 percent of the population would be stricken if strict measures were not taken to prevent the spread of the contagion and that another 40 percent of the population would be caring for the great mass afflicted.”Footnote 15 After introducing an order restricting opening hours for downtown stores, the mayor of Portland explained: “it will save lives, prevent suffering and lessen economic hardships if all of us for a short time do our utmost to stamp out this epidemic than to use only halfway measures over a long period of time.”Footnote 16
On the other hand, other public health officials and interest groups believed that closures were not effective and would cause a panic that was worse than influenza. The Minnesota State health officer, Dr. Henry
M. Bracken, argued that closures in Minneapolis were “unnecessary and inadvisable,” preferring to rely on isolation and quarantine.Footnote 17 In Detroit, local leaders concluded that “nothing would be accomplished – save increasing hysteria – by closing the schools, amusements and places of public gatherings.”Footnote 18 The Philadelphia Inquirer ran an editorial opposing closures for causing panic: “The fear of influenza is creating a panic, an unreasonable panic that will be promoted, we suspect, by the drastic commands of the authorities.”Footnote 19
The question of whether to close schools was also contentiously debated in many cities. Health officials and school superintendents in some cities argued for keeping schools open since children could be monitored by teachers and nurses instead of playing in the streets. In contrast, the New York Times questioned whether it was wise to keep schools open in New York City.Footnote 20
There were also debates about mask-wearing. San Francisco and Oakland implemented masking ordinances, and mask use was widespread (Crosby Reference Crosby2003). However, various groups opposed the masking ordinance, arguing it was ineffective and impinged on civil liberties.Footnote 21 When the masking ordinance was reintroduced in January 1919 following a resurgence in cases, opponents of masking formed an Anti-Mask League to petition for the ordinance to be rescinded (Crosby Reference Crosby2003).
Lobbying by business interests and other groups. Businesses lobbied both for and against NPIs. Businesses directly affected by closures often opposed them, while businesses that were adversely affected by the spread of influenza supported closures. An interesting illustration comes from San Francisco. On 17 October, the mayor met with members of the San Francisco board of health and business interests to discuss the policy response to the epidemic. At the meeting, representatives of the U.S. Shipping Board emphasized that the “influenza epidemic in the East has seriously hampered the ship building program” and that “the East is now looking to California and the western states to carry on the work of ship building.” They urged health officials to close public places of amusement to limit the severity of the epidemic (San Francisco Board of Health 1918).
Theater and movie theater owners attending the San Francisco board of health meeting said revenues had declined sharply, at one theater by 40 percent, due to fear of the virus. The theater owners, therefore, supported a closure to bring the epidemic under control. The owner of one theater said: “I have interviewed the managers and owners of many theaters and show houses and they have all stated that as the people appear to be voluntarily staying away anyhow, that the amusement managers would not suffer much more if all theaters were ordered closed” (San Francisco Board of Health 1918). On the other hand, in Los Angeles and Worcester, theater owners felt they were being treated unfairly by the closures. They lobbied for stricter closure orders for other businesses to stamp out disease more quickly, which businesses in other sectors opposed.Footnote 22
Lobbying was directly effective in changing policy in some cases. For example, in St. Louis, opposition to restricted business hours led the health commissioner to rescind the order because “he had been convinced that the order was working a hardship on small businesses, such as cigar dealers.”Footnote 23 In Pittsburgh, saloon owners and other businesses affected by the state-level closure order lobbied to reopen the city. In response, the mayor announced that he would not enforce Pennsylvania’s statewide closure order after it was extended an additional week in early November 1918.Footnote 24
DATA
The core data underlying this paper consists of city-level information on NPIs, influenza mortality, and local economic activity for the period around the 1918 pandemic. This section outlines each of these three components. Further details are provided in Online Appendix C. For replication files see Correia, Luck, and Verner (2022).
City-Level Measures of NPIs
Our starting point for constructing city-level measures of NPIs is the work by Markel et al. (Reference Markel, Lipman, Alexander Navarro, Sloan, Michalsen, Stern and Cetron2007), who gather detailed information on NPIs for 43 major U.S. cities from municipal health department bulletins, local newspapers, and reports on the pandemic. Markel et al. (Reference Markel, Lipman, Alexander Navarro, Sloan, Michalsen, Stern and Cetron2007) measure city-level NPIs in two ways. First, they measure the intensity of NPIs by the cumulative number of days where three types of NPIs were active (school closure, public gathering bans, and a collection of other measures that included quarantine/isolation of suspected cases) from 8 September 1918 through 22 February 1919. This measure, which we denote as NPI Intensity, can thus take values between 0 and 504—three times the number of days in the sample.Footnote 25
Second, they measure the speed of NPI implementation as the number of days elapsed between the “mortality acceleration date”—the date when the excess death rate surpassed twice the baseline death rate—and the date when city officials first enforced a local NPI. We multiply this day count by minus one, so that higher values indicate a faster response, and denote this measure as NPI Speed.
To extend the NPI measures to additional cities, we first add information for Atlanta by using the raw NPI data provided by Markel and coauthors. Second, we add NPI information for a further six cities from Berkes et al. (2020). Third, we hand-collect NPI information on four additional cities, extending the total sample from 43 to 54 cities.Footnote 26 Mortality data is available only for 46 out of the 54 cities. Other outcome variables such as manufacturing employment are available for a wider set of cities, although only the NPI Intensity is available for them, as computing the NPI Speed measure requires knowing the “mortality acceleration date.” See Online Appendix Table A1 for a list of the cities in each sample; Online Appendix Table A2 for the values of the NPI variables for each city; Online Appendix C.2 for more details on how the NPI measures were computed; and Online Appendix C.6 for city-level figures of the daily excess mortality rates and the period when each type of NPI measure was active.
To capture the idea that NPIs are likely to be most effective if they are both implemented relatively early and aggressively, our preferred measure of NPIs is an indicator variable equal to one for cities with both NPI Speed and NPI Intensity above their medians. We refer to this indicator variable as High NPI. High NPI equals one for 18 cities and zero for 28 cities in our main sample of 46 NPI cities with available mortality data.
All the cities in our sample eventually adopted at least one of the three types of NPIs, with considerable variation in the speed and aggressiveness of these measures. School closures and cancellations of public gatherings were the most common, and the median duration of NPIs was four weeks, with the longest lasting ten weeks. High NPI cities on average implemented the first NPI about 1.5 days after the mortality rate reached twice its baseline level, whereas Low NPI cities reacted on average only after 12 days (see Table A3 in the Online Appendix). Similarly, High NPI cities had an average NPI intensity of 133, compared to 56 for Low NPI cities. Figure 2 illustrates the geographic variation in NPIs for the 46 cities in our main sample.
Mortality Data
Besides using mortality data to compute the “mortality acceleration date” and thus the NPI Speed variable, we also study two mortality outcomes: peak excess mortality and cumulative excess mortality.Footnote 27 In addition to studying excess mortality due to influenza and pneumonia
(denoted as I&P occasionally throughout the paper), we also analyze all-cause excess mortality, an overall less precise but more robust measure (Stokes et al. Reference Stokes, Lundberg, Elo, Hempstead, Bor and Preston2021).
To compute daily excess mortality rates, we first collect monthly mortality rates between 1910 and 1916 from the annual Mortality Statistics (Bureau of the Census 1913). We use these rates to compute monthly median mortality rates, denoted as the “baseline mortality rates.” Second, we obtain 1918 population estimates from the Bureau of the Census (1922). Third, we collect weekly death counts during the pandemic from the Weekly Health Index published by the U.S. Census Bureau, retrieved from Navarro and Markel (2016) and the United States Public Health Service (1920). These weekly death counts occasionally have missing values, which we linearly interpolate. Lastly, we smooth out the weekly death counts and the monthly baseline mortality rates to a daily frequency, and compute the daily excess death rates as the daily mortality rates minus the daily baseline mortality rate. This approach follows Collins et al. (Reference Collins, Frost, Gover and Sydenstricker1930) and Markel et al. (Reference Markel, Lipman, Alexander Navarro, Sloan, Michalsen, Stern and Cetron2007). Details of each step involved, including the algorithms employed, specific examples, comparisons between our estimates and those of Markel et al. (Reference Markel, Lipman, Alexander Navarro, Sloan, Michalsen, Stern and Cetron2007), as well as comparisons between influenza and pneumonia and all-cause mortality rates, are provided in Online Appendix C.1.
Figure 3 shows the weekly mortality rates for both influenza and pneumonia and all-cause mortality, as well as the mortality acceleration date and the start and end dates of the three different types of NPIs for six different cities. Several of the patterns previously outlined are evident. For instance, cities further east such as Boston and Philadelphia, experienced increases in mortality earlier and were slower to implement NPIs than cities further west, such as Rochester or St. Louis. Moreover, there is variation in the speed and intensity of NPIs and the mortality outcomes in nearby cities such as St. Paul and Minneapolis. The same figure for each city in our sample can be found in Online Appendix C.
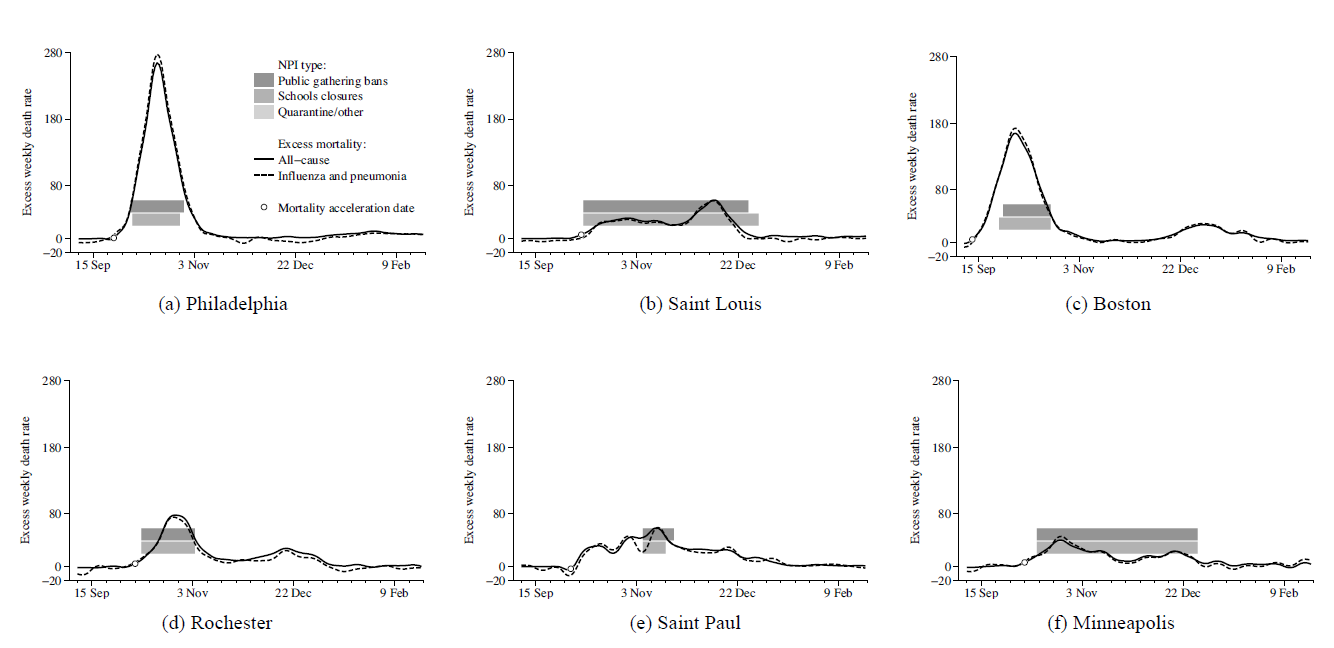
Figure 3 NPIs AND MORTALITY
Note: This figure compares weekly mortality rates smoothed to a daily frequency against the dates where three types of NPIs were active (public gathering bans, school closures, and quarantine/isolation/etc.), for eight selected cities (see Online Appendix C.6 for figures of all cities).
Sources: Mortality data from Collins et al. (Reference Collins, Frost, Gover and Sydenstricker1930), Bureau of the Census (1913), Navarro and Markel (2016), United States Public Health Service (1920), and Bureau of the Census (1922). NPI data from Markel et al. (Reference Markel, Lipman, Alexander Navarro, Sloan, Michalsen, Stern and Cetron2007), Berkes et al. (2020), and authors’ calculations. See Data section, Online Appendix C.1, and Online Appendix C.2 for details.
Economic Outcomes
To study the short-run economic impact of the 1918 Flu Pandemic and associated NPIs, we construct a monthly city-level measure of business disruptions by digitizing information on business conditions from Bradstreet’s weekly “Trade at a Glance” tables.Footnote 28 These tables provide city-level one-word summaries of the conditions of wholesale trade, retail trade, and manufacturing. We categorize these words into an indicator variable of whether trade was “Not disrupted” or “Disrupted.” For robustness, we also construct a three-valued measure that ranks business conditions into “Bad,” “Fair,” and “Good.” We then aggregate this measure into a monthly frequency, as weekly information is not always reported for all cities. This results in a monthly series of business disruptions for 27 cities with NPI measures from January 1917 to December 1922. Further details are provided in Online Appendix C.3.
To study the medium-run impact of NPIs, we digitize information on city-level manufacturing activity from the Census of Manufactures. Manufacturing accounted for 32 percent of nonfarm employment in the United States in 1910. The Census of Manufactures is available every five years until 1919 and every two years thereafter, so we use manufacturing data on employment and output for the years 1904, 1909, 1914, 1919, 1921, 1923, 1925, and 1927. See Online Appendix C.4 for a precise listing of the sources used, as well as a discussion of potential sources of measurement error, such as methodological changes and changes in city boundaries. We also use city-level annual bank assets as a proxy for local economic activity, digitized from the Annual Reports of the Comptroller of the Currency.
Control Variables
Finally, we collect various additional variables that we use to control for observable differences across cities. We use information on city population and city density from various decennial censuses, as well as city-level public health spending per capita from Swanson and Curran (Reference Swanson and Curran1976). Further, to more explicitly control for geography and the timing of the arrival of the flu, we use city longitude and information on the week of the arrival of the second wave of the flu as reported in Sydenstricker (Reference Sydenstricker1918). We also draw on state-level WWI casualties from the United States Adjutant-General’s Office (1920), state-level exposure to WWI production from Garrett (Reference Garrett2008), and the distance of each city to military training camps. To control for poverty and air pollution, we use city-level illiteracy rates, infant mortality, and reliance on coal-based energy production, following Clay, Lewis, and Severnini (Reference Clay, Lewis and Severnini2019).
NPIs AND MORTALITY
This section examines the relationship between NPIs and mortality. We begin by classifying cities according to the High NPI indicator variable, which is equal to one for cities with above-median NPI speed and intensity. Figure 4 compares the weekly excess death rates from influenza and pneumonia for low and high NPI cities, relative to the mortality acceleration dates of each city. Mortality tended to peak three weeks after it accelerated, but remained elevated for most of the 19 weeks. Comparing both lines suggests that cities with stricter NPIs had lower peak mortality and a flatter mortality curve, although they were more likely to experience a second peak. However, the area under the curve is smaller for high NPI cities, so cities with stricter NPIs had lower cumulative excess mortality over the course of the pandemic, which may have been achieved by mitigating epidemic overshoot (Bootsma and Ferguson Reference Bootsma and Ferguson2007).
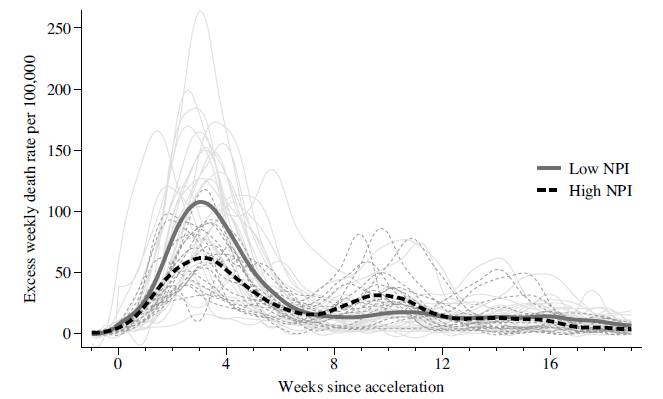
Figure 4 EXCESS WEEKLY DEATH RATES SINCE MORTALITY ACCELERATION DATE
Note: This figure shows the average excess weekly death rate due to influenza and pneumonia for low and high NPI cities, smoothed to a daily frequency. The thick solid lines represent averages across time, while the thin semitransparent lines represent the individual paths of each city, colored accordingly. High NPI cities are defined as those with above-median NPI intensity and speed. The origin of the x-axis corresponds to the date where mortality accelerated in a city, as defined by Markel et al. (Reference Markel, Lipman, Alexander Navarro, Sloan, Michalsen, Stern and Cetron2007). To prevent missing values, the x-axis stops at 19 weeks, as cities hit later in the pandemic do not have 24 weeks of data after their mortality acceleration date.
Source: See Figure 3.
Empirical Framework
To more formally investigate the pattern revealed in Figure 4, we estimate city-level regressions of the form
 $$Mortalit{y_c} = \alpha + \beta NP{I_c} + {X_c}\delta + {u_c},$$
where Mortality c is a city-level measure of either influenza and pneumonia mortality or all-cause mortality per 100,000 inhabitants, NPI c is one of the three NPI measures, and X c is a vector of city-level control variables.
A key concern with using variation in NPI measures across cities is that NPIs may be endogenous to local health and economic outcomes. Importantly, as described previously, the variation in the decision to implement NPIs can be explained by two main factors. The first factor is differences in the information available to local policymakers at the time of the arrival of the flu, driven by city location.Footnote 29 The second factor is differences in the policy preferences and beliefs of local policymakers, as well as local political economy factors. The variation from the former is a particular concern for being able to identify the causal effects of NPIs. Hence, we control for several city-level characteristics in our regressions that capture the differences between cities that had more or less time to prepare for the arrival of the flu.
As a set of baseline controls, we include the log city population in 1900 and 1910 to account for city size and past growth. Given that the flu was more likely to spread in crowded areas, we control for city density in 1910. To account for the structure of the local economy, we include manufacturing employment in 1914 to 1910 population. To proxy for the quality of the local health care system, we also control for public health expenditure in 1917 relative to 1910 population.
Given the modest sample size of 46 cities, we select a relatively small set of baseline control variables. Nonetheless, we report several other specifications that add additional controls. For instance, to capture base-line differences in influenza exposure, we control for lagged influenza and pneumonia mortality in 1917. To account for the fact that the cities further west were affected later than those in the east, we control for a city’s longitude, as discussed earlier. We argue that variation conditional on city longitude reflects local policy preferences, beliefs, and political economy factors, as detailed in our historical background discussion. In additional robustness checks, we control for the week of the flu’s arrival as indicated by Sydenstricker (Reference Sydenstricker1918) or the number of days between the first case in Camp Devens in Boston and the acceleration of all-cause mortality in a given city.
Another concern is that NPIs may be correlated with local poverty, air pollution, or the quality of local institutions, which may independently affect mortality. For example, existing work has shown that mortality in the pandemic was higher in cities with higher measures of poverty and in cities with higher air pollution due to a greater prevalence of coal-fired plants (Clay, Lewis, and Severnini Reference Clay, Lewis and Severnini2018, Reference Clay, Lewis and Severnini2019).Footnote 30 We therefore also include both the illiteracy rate, infant mortality, and local coal-fired capacity as control variables.
WWI is another potentially important confounder. To control for the exposure to WWI arms production, we use data from Garrett (Reference Garrett2009), who constructs a binary variable for states that were involved in WWI production. War production during WWI was concentrated in the east and mid-west of the United States. We also present robustness tests controlling for state-level WWI casualties per capita, which capture mortality from the war and also proxy for the extent of recruitment of the local population.Footnote 31 Finally, narrative accounts of the pandemic argue that the second wave was amplified via military camps (Crosby Reference Crosby2003; Barry Reference Barry2004).Footnote 32 We therefore also provide specifications in which we control for a city’s distance to the closest army camp.
Results
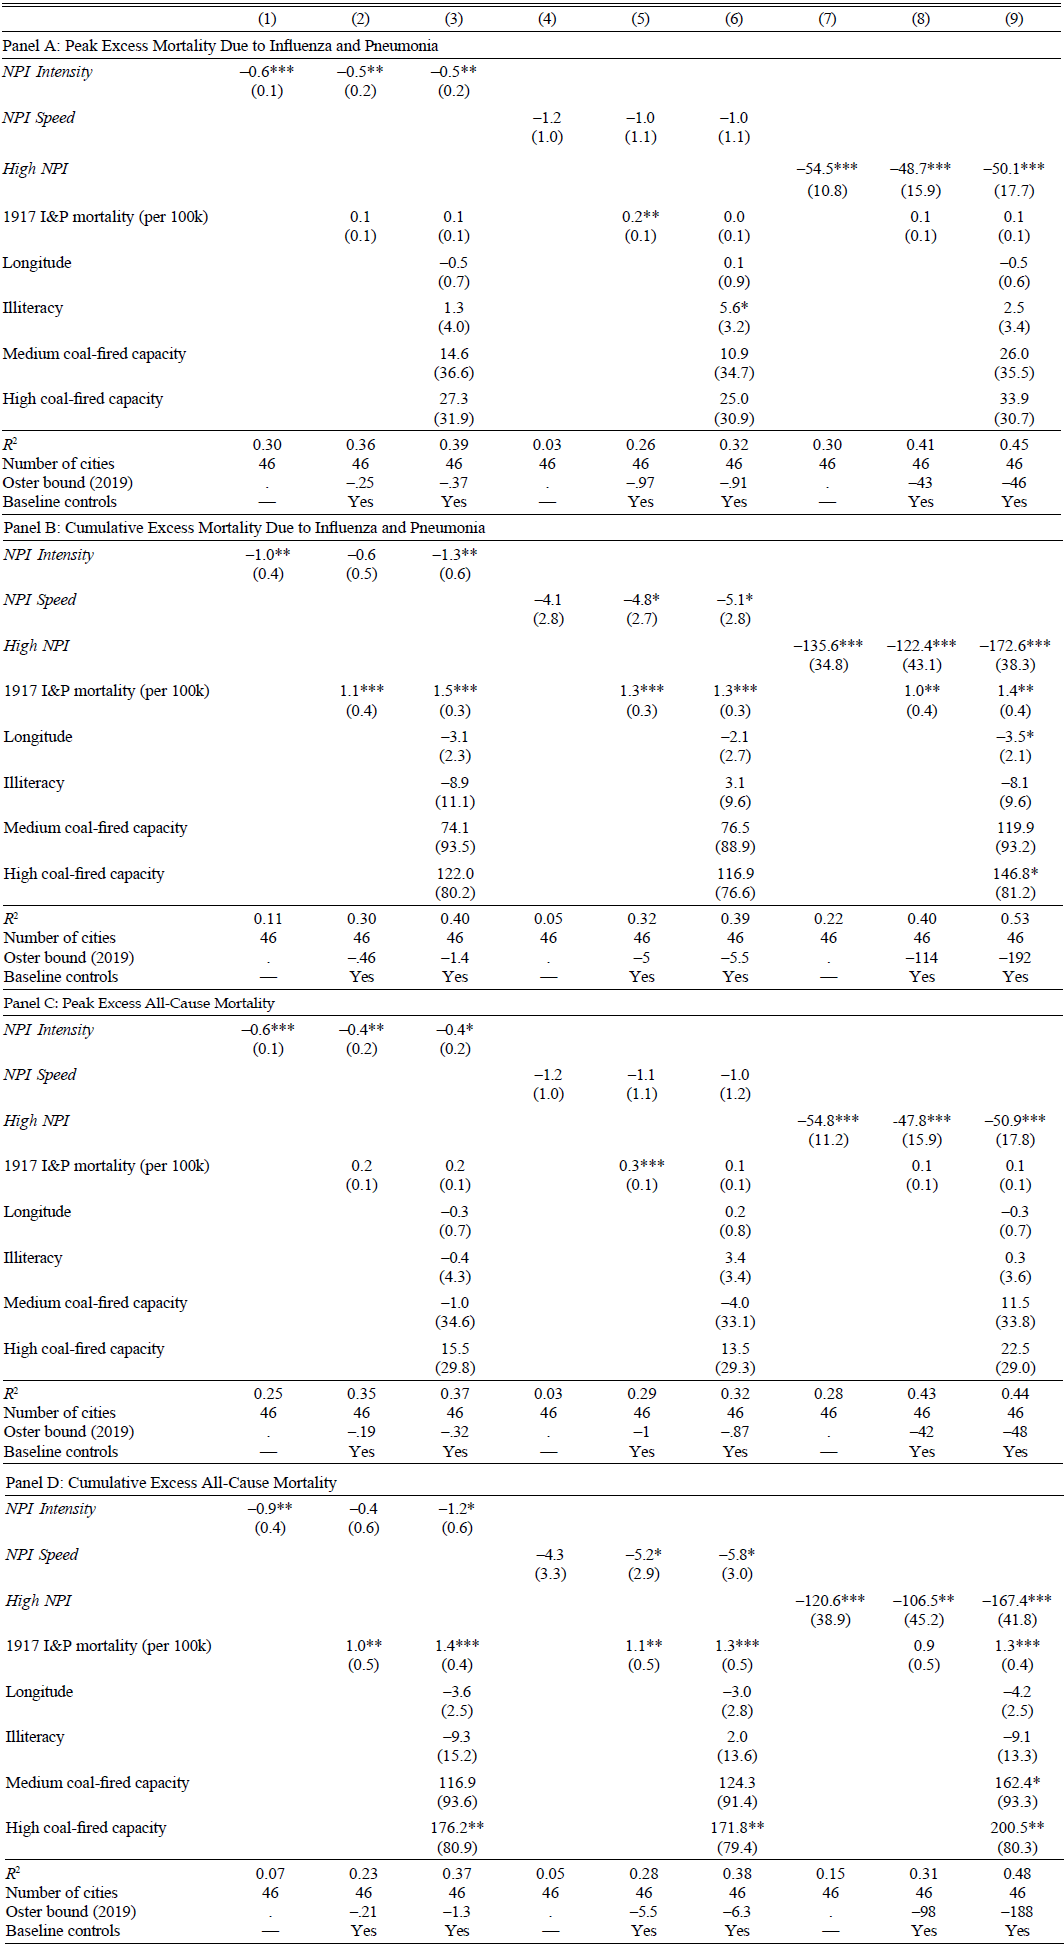
Table 1 presents estimates of Equation (1) for various mortality outcomes. Panel A reports the estimates for weekly excess peak mortality due to influenza and pneumonia. Results for NPI Intensity, NPI Speed, and High NPI are presented in Columns (1)–(3), (4)–(6), and (7)–(9), respectively. Columns (1), (4), and (7) present regressions without controls. The estimates are negative and statistically significant for NPI Intensity and High NPI, indicating that cities with more stringent NPIs saw lower peak mortality from influenza and pneumonia. For NPI Speed, the point estimate is negative but not statistically significant, and the R Footnote 2 is substantially lower. Columns (2), (5), and (8) show that the estimates are similar when we include the base-line controls along with lagged influenza mortality. Furthermore, Columns (3), (6), and (9) reveal that the estimates are essentially unchanged when including additional controls such as longitude, the illiteracy rate, and the reliance on coal-fired power plants. In terms of magnitudes, the estimate in Column (9) implies that high NPI cities experienced a 50 percent reduction in peak mortality relative to the mean. These estimates suggest that NPIs in the fall of 1918 were successful in flattening the curve.
Table 1 NPIs AND MORTALITY
* = Significant at the 10 percent level.
** = Significant at the 5 percent level.
*** = Significant at the 1 percent level.
Notes: This table presents city-level regressions of pandemic mortality measures on NPI measures. Peak mortality is the weekly excess death rate per 100,000 of the first peak of 1918 pandemic fall wave. Cumulative excess mortality is the total excess death rate from 8 September 1918 to 22 February 1919. Baseline controls not reported in the table are log of 1900 and 1910 city population, city 1914 manufacturing employment over 1910 population, city density in 1910, and per capita city-level health spending as of 1917. Robust standard errors in parentheses.
Source: See Figure 3.
In Panel B, we examine the relationship between NPIs and cumulative excess mortality from influenza and pneumonia over the 24-week period from 8 September 1918 to 22 February 1919. Columns (1) and (7) show that NPI Intensity and High NPI are associated with statistically significantly lower cumulative excess mortality in a regression without controls (see also Figure A1 in the Online Appendix). As in the regressions for peak mortality in Panel A, the estimate of NPI Speed in Column (4) is negative but not statistically significant. Subsequent columns show that the estimates are similar but slightly lower when including additional controls for city characteristics. However, the estimate of High NPI in Columns (8)–(9) remains significant at the 1 percent level. This estimate implies a reduction in cumulative mortality of 24–34 percent relative to the mean, a magnitude similar to Hatchett, Mecher, and Lipsitch (Reference Hatchett, Mecher and Lipsitch2007) (20 percent reduction) and Bootsma and Ferguson (Reference Bootsma and Ferguson2007) (10–30 percent reduction).
Next, Panels C and D in Table 1 show equivalent effects of NPIs on all-cause mortality, as opposed to influenza and pneumonia mortality. Reported data on influenza and pneumonia mortality may contain measurement error due to challenges in establishing the cause of death, especially during a period of extremely high mortality when the healthcare system is overwhelmed. There is a high correlation between excess influenza and pneumonia mortality and excess all-cause mortality during the second wave. Hence, the findings in Panel C are closely aligned with those in Panel A, and those in Panel D resemble those in Panel B.
All four panels also report the coefficients for a selected set of control variables. Our findings confirm some of the relationships between mortality and local characteristics discussed earlier. Cities further west tended to have lower mortality. This may be driven by a weakening of the virus strain, a higher degree of voluntary distancing, or other factors correlated with western status. In line with findings in Clay, Lewis, and Severnini (Reference Clay, Lewis and Severnini2018, Reference Clay, Lewis and Severnini2019), mortality was higher in cities with a greater reliance on coal-fired energy and a higher illiteracy rate. Finally, areas with a higher prior exposure to influenza and pneumonia mortality also experienced higher mortality during the 1918 pandemic. However, irrespective of the controls, the effect of High NPI is essentially unchanged.Footnote 33
We provide a range of additional robustness checks in the Online Appendix. For instance, we show that the result that High NPI cities had lower mortality is robust to controlling for the timing of the arrival of the flu, measures of city exposure to WWI production and mortality, and infant mortality. It is also robust to excluding the western-most cities from the sample (see Table A4 and Table A5 in the Online Appendix).
Taken together, we find a robust effect of NPIs on mortality. Importantly, our analysis reveals that the efficacy of NPIs depends crucially on both the speed at which they are implemented and their intensity. In our analysis, this is reflected by the consistently negative and significant effect of the High NPI measure on all four mortality measures.
These findings are an important advancement over the existing literature. Markel et al. (Reference Markel, Lipman, Alexander Navarro, Sloan, Michalsen, Stern and Cetron2007) find that NPIs have negative effects on mortality. However, other work either finds no discernible effects (Kellogg Reference Kellogg1919)Footnote 34 or weak or imprecisely estimated effects (Hatchett, Mecher, and Lipsitch Reference Hatchett, Mecher and Lipsitch2007; Clay, Lewis, and Severnini Reference Clay, Lewis and Severnini2018; Barro Reference Barro2020).Footnote 35 Our findings support and complement the original findings in Markel et al. (Reference Markel, Lipman, Alexander Navarro, Sloan, Michalsen, Stern and Cetron2007). While we do find that the effect of NPI Intensity and NPI Speed is sensitive to the exact specification, we find a robust negative effect of NPIs that were both fast and aggressive. The effect is precisely estimated, the magnitudes are meaningful, and it is robust to including a wide range of control variables, using four different measures of mortality, and expanding the sample used in Markel et al. (Reference Markel, Lipman, Alexander Navarro, Sloan, Michalsen, Stern and Cetron2007).
NPIs AND ECONOMIC ACTIVITY
Economic Activity in the Short Run
Were NPIs that flattened the mortality curve associated with a worse economic downturn in fall 1918? We next examine the impact of the pandemic and NPIs on city-level business disruptions. For this, we rely on a monthly index of business disruptions constructed from Bradstreet’s trade conditions reports.
Figure 5 plots the average of our “No disruptions” variable across High NPI cities—cities with above-median NPI Intensity and NPI Speed. The figure is based on a sample of 27 cities for which both the index and the information on NPIs are available. “No disruptions” are assigned a value of 100; “Disruptions” are assigned a value of 0. Figure 5 plots the combined index for Wholesale Trade, Retail Trade, and Manufacturing sectors. Online Appendix Figure A2 plots the index for each sector separately.
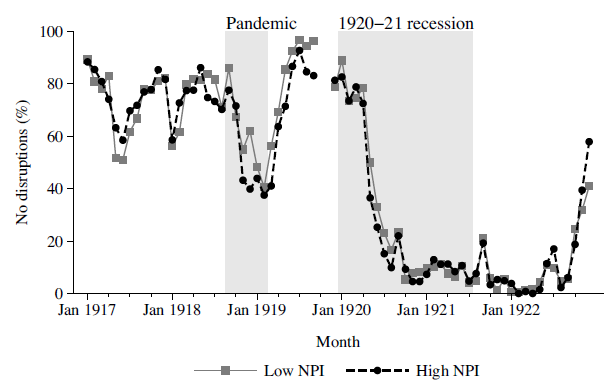
Figure 5 NPIs AND SHORT-RUN ECONOMIC DISRUPTIONS
Notes: This figure plots the average of an index of economic conditions for low and high NPI cities. High NPI cities are defined as cities with above median NPI Intensity and NPI Speed. The index is based on the “Trade at Glance” tables from Bradstreet’s weekly magazine, which reported the conditions of three sectors (wholesale, retail, and manufacturing) in brief text snippets (e.g., “good,” “poor”). To compute the index, we first convert the snippets into an indicator variable equal to 100 for when there were no disruptions and 0 when there were disruptions. We then average this indicator variable across the three sectors and further aggregate it from a weekly to a monthly frequency. The shaded regions correspond to the 1918–19 Pandemic (September 1918 to February 1918) and to the 1920–21 recession (January 1920 to July 1921). No data is available for October and November 1919 as the magazine was not published due to the New York printing press strikes.
Sources: Bradstreet Company. Bradstreet’s: A Journal of Trade, Finance, and Public Economy (1917–1922). For details, see Data section and Online Appendix C.3.
The first takeaway from Figure 5 is that the pandemic itself was associated with disruptions in economic activity. From September 1918 to February 1919, there was a decline in the share of cities with no disruptions.Footnote 36 The business disruptions index then displays a gradual recovery through spring 1919. By early 1920, however, the U.S. economy had entered a severe recession. Trade disruption became widespread and even more severe than the repercussions of the 1918 pandemic.
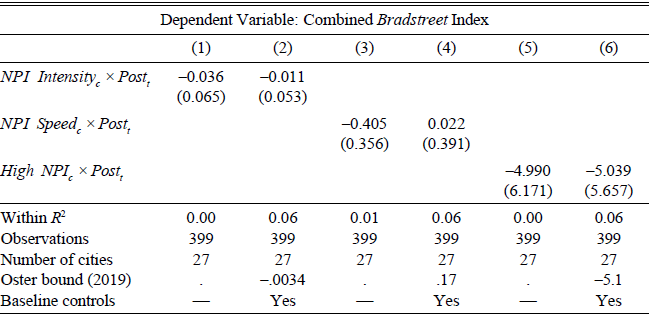
TABLE 2 NPIs AND LOCAL ECONOMIC ACTIVITY IN BRADSTREET’S TRADE CONDITIONS
* = Significant at the 10 percent level.
** = Significant at the 5 percent level.
*** = Significant at the 1 percent level.
Notes: This table presents estimates of Equation (2). The dependent variable is a monthly city-level index of economic disruptions that take a value of 100 for “No disruptions” and 0 for “Disruptions.” Controls interacted with Post t are the log of 1900 and 1910 city population, 1910 city density, 1917 city health spending per capita, and manufacturing employment in 1914 to 1910 population. Robust standard errors clustered by city in parenthesis.
Sources: Bradstreet Company. Bradstreet’s: A Journal of Trade, Finance, and Public Economy (1917–1922). NPI data from Markel et al. (Reference Markel, Lipman, Alexander Navarro, Sloan, Michalsen, Stern and Cetron2007), Berkes et al. (2020), and authors’ calculations. See Data section, Online Appendix C.3, and Online Appendix C.2 for details.
The second takeaway from Figure 5 is that the decline in activity during the pandemic was similar in high and low NPI cities. In particular, high and low NPI cities saw approximately equal declines in the combined business disruptions index. For example, from September 1918 to February 1919, high NPI cities saw a 41-point decline in the index, while low NPI cities saw a 52-point decline.
To formally examine the patterns in Figure 5, Table 2 presents results from estimating difference-in-differences models of the form
 $$TradeDisruption{s_{ct}} = {\alpha _c} + {\tau _t} + \beta (NP{I_c} + Pos{t_t}) + ({X_c} \times Pos{t_t})\Gamma + {\varepsilon _{ct}},$$
where TradeDisruptions ct is one of the four trade disruptions indexes from Bradstreet’s, NPI c is one of the three NPI measures, and X c contains a set of city-level controls. The estimation period is January 1918 to March 1919, and Post t is a dummy that equals one from August 1918 onward.
Across all three NPI measures, higher NPIs are generally not associated with significant reductions in the combined index. Our preferred specification, using the High NPI measure with controls (Table 2 Column (6)), implies that High NPI cities saw a 5.0 point relative decline in economic activity (increase in disruptions). However, the effect is statistically insignificant across all specifications, indicating that there is little evidence supporting the view that NPIs had a substantially negative effect on economic activity.
In Online Appendix Table A6, we report the effects of the different underlying components of the main index: wholesale trade (Panel A), retail trade (Panel B), and manufacturing (Panel C). We find both negative and positive estimates, but none is statistically significant. Furthermore, in Online Appendix Table A7, we show that the findings noted earlier are also robust to including a range of additional controls outlined in the empirical framework. Accounting for the timing of the arrival of the flu, WWI exposure, poverty, and air pollution does not alter the conclusion that NPIs did not significantly exacerbate the local economic downturn during the pandemic. The coefficients are small and insignificant across all specifications except one specification that controls for longitude in conjunction with the baseline controls.Footnote 37
Taken together, monthly information on business disruptions indicates that the cities that were able to flatten the curve through NPIs did not experience larger disruptions in local business activity as a consequence of their NPI measures. Thus, while the pandemic itself was disruptive to the economy, there is no evidence supporting the view that public health interventions exacerbated the disruptions of economic activity.
A specific concern with this interpretation is that Bradstreet’s “Trade at Glance” sample is relatively small (27 cities), so there may not be enough power to detect modest negative effects. It is therefore useful to consider what effect sizes we can reject. Looking at the High NPI estimate for the combined index in Panel A Column (6), its 90 percent confidence interval is (−14.7, 4.6). At this level, we can reject negative effects below –14.7, which is one-third of the peak-to-trough decline during the pandemic, and about one-sixth of its decline during the 1920–21 recession.Footnote 38 With the industry-specific indexes, the standard errors are larger, so there is more uncertainty about these point estimates. Nonetheless, across all specifications, there is no clear evidence of large negative effects of NPIs on economic activity in the short run.
Economic Activity in the Medium Run
Our findings in the previous section indicate that cities with stricter NPIs did not experience more severe short-term business disruptions. We now examine how NPIs affected economic activity in the medium run after the pandemic using city-level data from the Census of Manufactures on employment and output. The Census data have several advantages over Bradstreet’s data. First, the Census data are measures of actual economic outcomes instead of qualitative reports, which may be subjective. Second, the Census data cover all 46 to 54 cities for which we can obtain NPI data, which doubles the sample compared to the analysis based on Bradstreet’s data.Footnote 39 However, the Census of Manufactures was only collected every five years until 1919 and every two years from 1919 onward. It is therefore not informative about pre-trends between 1915 and 1918 or about the immediate effects of the pandemic. Instead, the Census allows us to analyze the medium-run economic effects of NPIs.
To study the medium-term impact of NPIs around the 1918 Flu Pandemic and to control for other observable characteristics and longer pre-trends, we estimate a dynamic difference-in-differences equation of the form
 $${Y_{ct}} = {\alpha _c} + {\tau _t} + \sum\limits_{j \ne 1914} {{\beta _j}NP{I_c}{1_{j = t}} + } \sum\limits_{j \ne 1914} {{X_s}{\gamma _j}{1_{j = t}} + } {\varepsilon _{ct}},$$
where Y ct is a measure of economic activity in city c, such as the log of manufacturing employment, NPI c is one of the NPI measures, α c is a city fixed effect, τ t is a time fixed effect, and X s is a set of control variables that are interacted with time indicator variables to allow for changes in the relationship between outcome variables and controls. The set of coefficients β j captures the relative dynamics of cities with strict versus lenient NPIs.
Figure 6 presents the results from estimating Equation (3) for manufacturing employment using the NPI Intensity and High NPI measures as regressors. The estimates without controls show that, relative to 1914, cities with stricter NPIs had a higher level of employment from 1919 onward than those with more lenient NPIs. For instance, the estimate for 1919 implies that High NPI cities experienced 18 percent higher employment growth from 1914 to 1919. The confidence bands indicate that growth lower than 2 percent can be rejected at the 95 percent level.
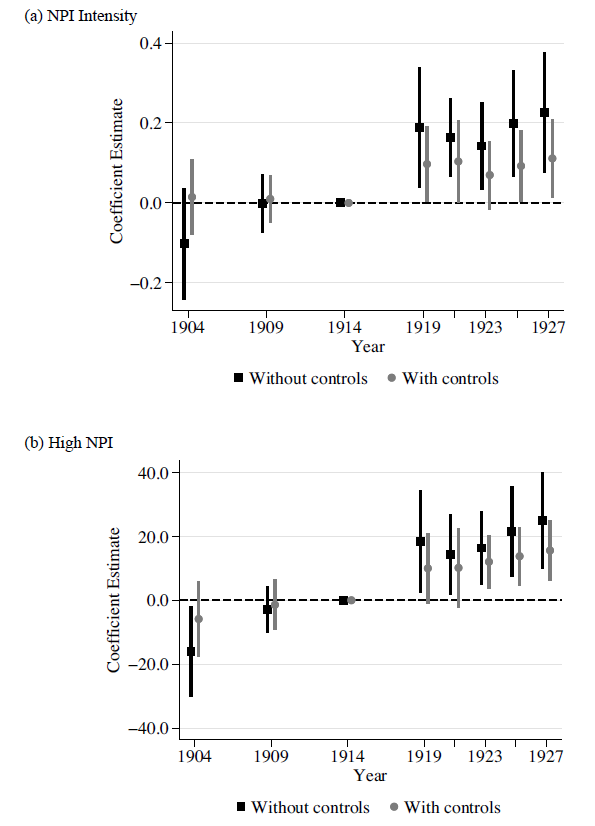
Figure 6 NPIs IN FALL 1918 AND MANUFACTURING EMPLOYMENT GROWTH ACROSS U.S. CITIES
Note: This figure presents results from estimating Equation (3) on log manufacturing employment with and without baseline controls. Baseline controls are city log 1900 and 1910 population, city 1914 manufacturing employment to 1910 population, city density in 1910, and per capita city-level health spending as of 1917. Panels (a) and (b) use NPI Intensity and High NPI as the NPI measures, respectively. Error bands denote 95 percent confidence intervals with robust standard errors clustered at the city level.
Sources: NPI data from Markel et al. (Reference Markel, Lipman, Alexander Navarro, Sloan, Michalsen, Stern and Cetron2007), Berkes et al. (2020), and authors’ calculations. Manufacturing data from the U.S. Census of Manufactures (1919) and U.S. Statistical Abstract (1924, 1926, 1931). See Data section, Online Appendix C.2, and Online Appendix C.4 for details.
However, the estimates without controls in Panel (b) of Figure 6 also show that cities with stricter NPIs grew faster between 1904–1909, indicating a pre-trend from 14 to 9 years before the pandemic. This raises the concern that the results may be driven by more general city-growth patterns. This is not entirely surprising given that most cities with strict NPIs were located further west, and, as the structure of the U.S. economy changed quickly at the turn of the twentieth century, western cities such as Los Angeles and Seattle grew particularly quickly.Footnote 40
One approach to addressing this concern is to control for observable differences across cities with strict and lenient NPIs. Once we include our baseline controls, the estimates after 1918 remain positive, but are sometimes only significant at a 90 percent level.Footnote 41 For instance, the point estimates in Panel (b) indicate that cities with high NPIs had 10 percent higher manufacturing employment in 1919 compared with low NPI cities. The 95 percent confidence interval is (−1 percent, 20 percent), ruling out substantial negative effects. In terms of economic significance, the average growth of manufacturing employment between 1914 and 1919 was 33 percent, with a standard deviation of 22 percent. Thus, the point estimate corresponds to one-third of the average growth and one-half of the cross-city standard deviation in growth.
To confirm this visual pattern, Table 3 compares the pre- and post-period averages in manufacturing employment and output for cities with strict and lenient NPIs, controlling for city observables. The estimates for both employment and output are generally positive across all three NPI measures. The estimates are not always significant, but the point estimates suggest moderate positive effects. Our preferred specification suggests High NPI cities see around 17 percent higher manufacturing employment and 12 percent higher manufacturing output after the pandemic (Column (6)). The confidence intervals reject a large negative effect of NPIs on both measures of economic activity. For example, based on the estimates in Column (6), we can reject at the 95 percent level that the effect of High NPI c on employment and output are below 6.2 and −5.0 percent, respectively. In the conclusion, we discuss the potential mechanisms for why NPIs may have had positive medium-run economic effects.
TABLE 3 NPIs AND LOCAL MANUFACTURING EMPLOYMENT AND OUTPUT

* = Significant at the 10 percent level.
** = Significant at the 5 percent level.
*** = Significant at the 1 percent level.
Notes: This table presents estimates of Equation (2). The dependent variables are the log of manufacturing employment (Panel A) and log of manufacturing output (Panel B), using data from the 1904, 1909, 1914, 1919, 1921, 1923, 1925, and 1927 Census of Manufacturers. Controls interacted with Post t are the share of manufacturing employment in 1914, log of population in 1900 and 1910, city density in 1910, and per capita city health spending in 1917. Robust standard errors clustered by city in parenthesis.
Sources: NPI data from Markel et al. (Reference Markel, Lipman, Alexander Navarro, Sloan, Michalsen, Stern and Cetron2007), Berkes et al. (2020), and authors’ calculations. Manufacturing data from the U.S. Census of Manufactures (1919) and U.S. Statistical Abstract (1924, 1926, 1931). See Data section, Online Appendix C.2, and Online Appendix C.4 for details.
In Online Appendix Table A8, we provide additional robustness checks. We show that the results noted previously are robust to controlling for longitude, the timing of the flu’s arrival, WWI exposure, poverty, and air pollution, as discussed in the empirical framework. Furthermore, in Online Appendix Table A9, we show that the same holds even when excluding the western-most cities. Fast and stringent NPIs are never associated with negative effects on local economic activity in the aftermath of the flu. The estimates are positive across all specifications and, in some cases, statistically significant at the 5 percent level.
As mentioned earlier, a key drawback of using the Census of Manufacturers is that data are not available from 1915 through 1918. This raises the concern that cities with strict and lenient NPIs could have been on different trajectories in this time period.Footnote 42 To partly address this concern, we use annual data on total national bank assets as a proxy for local economic activity. With our standard controls, there is no indication of a pre-trend in national bank assets for cities with stricter NPIs between 1910 and 1917 (see Online Appendix Figure A4). This is reassuring because if cities with stricter NPIs were growing at a faster pace before 1918, this should arguably have been reflected in the size of the local banking system. Moreover, there is an uptick in bank assets using both the High NPI and NPI Intensity measure after August 1918.Footnote 43
Newspaper Evidence of Effects of the Pandemic and NPIs on Economic Activity
The economic disruption from the pandemic and the effect of NPIs were extensively discussed in contemporary newspaper accounts. For example, on 24 October 1918, the Wall Street Journal reported:
In some parts of the country [the influenza epidemic] has caused a decrease in production of approximately 50% and almost everywhere it has occasioned more or less falling off. The loss of trade which the retail merchants throughout the country have met with has been very large. The impairment of efficiency has also been noticeable. There never has been in this country, so the experts say, so complete domination by an epidemic as has been the case with this one. (WSJ, 24 October 1918.)
In this section, we present narrative evidence that the pandemic led to significant economic disruptions, fear of the virus, and voluntary distancing. While NPIs directly reduced the revenues of businesses subject to closures, newspapers also report that these businesses saw a large decline in sales even in the absence of NPIs due to voluntary distancing and the spike in illness and mortality.Footnote 44 These narrative accounts thus provide clues to why NPIs reduced mortality without significantly reducing economic activity.
Supply-side effects. Newspaper accounts indicate that the pandemic depressed the economy through both supply and demand-side channels. Supply-side reductions occurred in the form of productivity reductions and labor shortages. Businesses in many sectors reported labor short-ages due to illness and death. The Bell Telephone Company called on the citizens of Philadelphia to “use the telephones as little as possible during the emergency as its service is already being rushed to the breaking point. The company has more than 850 operators or more than twenty-six percent of the entire force, out owing to illness from the epidemic.”Footnote 45 Meat packing plants in Omaha were “crippled” by the epidemic; one large meat packing plant reported 30 percent of employees were absent due to influenza.Footnote 46
Demand-side effects and voluntary distancing. Fear of the influenza has depressed demand and social activity in many cities. On 25 October 1918, the Wall Street Journal reported:
Widespread epidemic of influenza has caused serious inroads on the retail merchandise trade during the current month. Heads of large organizations report that not only has sickness cut down the shopping crowds, but in many cities the health authorities have shut down the stores. The chain store companies have felt the effect of the sickness not a little, for in addition to the smaller business done a number of their employees are sick. (WSJ, 25 October 1918.)
Cafes, restaurants, and saloons in Oakland closed early as a result of “a lack of business due to the Spanish influenza epidemic.”Footnote 47 Theater attendance was also depressed in many cities, even before NPIs closed theaters. In New York, the New York Times reported that “an unprecedented theatrical depression, which managers attribute in large part to the influenza scare, resulted in sudden decisions yesterday to close five playhouses tonight.”Footnote 48 St. Paul was slower to close movie theaters than Minneapolis but still saw a reduction in movie theater patronage “by nearly half.”Footnote 49
When schools were not closed, school absenteeism was high in cities severely affected by influenza. In Chicago, absentee rates reached 50 percent (Navarro and Markel 2016). Absenteeism was high, both because children were ill and because many parents kept their children home for fear that they would become infected. In New York, the Health Commissioner reported that a “careful survey shows that about half of the absences are due to the fear of parents and not to the illness of children.”Footnote 50 Fear of influenza also had other social consequences, such as lowering turnout in the 1918 election.Footnote 51
Direct cost of NPIs on businesses. While the pandemic itself clearly depressed economic activity, NPIs also directly impacted some businesses. The businesses directly affected by closures in the entertainment, restaurant, retail, and hospitality sectors reported significant revenue losses. In Salt Lake City, the labor union reported that 1,000 employees, including 300 musicians and several hundred theater workers, were out of employment for nine weeks during the closing order.Footnote 52 In Rochester “400 persons directly connected with the theaters have been thrown into idleness and the majority of them deprived of their salaries” due to the closure orders.Footnote 53 The Birmingham News listed the estimated costs to theaters, movie theaters, and department stores, concluding that “undertakers are the only ones who have profited from the epidemic” from a financial perspective.Footnote 54
CONCLUSION
Using both narrative evidence from contemporary newspapers and statistical analysis, this paper examines the impact of non-pharmaceutical interventions during the 1918 Flu Pandemic on mortality and economic activity. We find that while NPIs flattened the curve of disease transmission, they were not associated with worse economic performance during or after the pandemic. Instead, our findings suggest that the main source of economic disruption was the pandemic itself.
There are several important caveats to our results. First, our empirical analysis is limited to 27 to 46 cities, resulting in non-trivial uncertainty around some point estimates. Second, we cannot examine pre-trends for manufacturing outcomes in the years 1915 through 1917, as the data is not available at an annual frequency. Third, the economic environment toward the end of 1918 was unusual due to the end of WWI. Nevertheless, the collection of evidence from various data sources and contemporary newspaper accounts paints a picture of significant health benefits of NPIs at limited economic cost, if at all.
Our findings raise the question: Why were NPIs not economically harmful during the pandemic and possibly even beneficial in the medium-term? With the limited data available for 1918, it is challenging to shed light on the exact mechanisms through which NPIs affected the economy, but we discuss some potential channels that are supported by the narrative evidence.
The direct effect of NPIs such as theater closures and public gathering bans is contractionary, as these policies restrict economic activity. Newspaper accounts of lobbying by theater and store owners against closures reflect this direct negative effect. However, the pandemic itself can be highly disruptive to the economy. Many activities that NPIs restrict would not have occurred even in the absence of NPIs. Narrative accounts reveal that there was significant voluntary distancing. For example, attendance in theaters, schools, and churches was significantly depressed even when NPIs were not implemented. Moreover, the pandemic resulted in significant disruptions in production due to precautionary reductions in labor supply, illness, and mortality. As a result, the counterfactual without NPIs would still involve a downturn.
Moreover, NPIs may have indirect economic benefits by addressing the root of the economic disruption—the pandemic itself—in a coordinated fashion. Mitigating the pandemic may have prevented an ultimately worse economic downturn. Our narrative evidence suggests some contemporaries held this view. For example, shipbuilding companies lobbied for stricter NPIs to reduce the spread of the disease and thereby limit labor shortages and associated disruptions to production.
Several mechanisms could explain the potential medium-term economic benefits of NPIs. Prior research finds that the 1918 pandemic led to subsequent labor shortages, higher poverty, lower productivity, lower human capital, lower social trust, and higher inequality, with these adverse effects often persisting for many years (Garrett Reference Garrett2009; Karlsson, Nilsson, and Pichler Reference Karlsson, Nilsson and Pichler2014; Guimbeau, Menon, and Musacchio Reference Guimbeau, Menon and Musacchio2022; Almond Reference Almond2006; Beach, Ferrie, and Saavedra Reference Beach, Ferrie and Saavedra2018; Percoco Reference Percoco2016; Aassve et al. Reference Aassve, Alfani, Gandolfi and Le Moglie2021; Galletta and Giommoni Reference Galletta and Giommoni2022). Berkes et al. (2020) find that cities with more aggressive NPIs saw higher innovation after the pandemic, potentially by preserving organizational capital required for invention. Thus, by reducing illness and mortality, NPIs may have reduced the negative medium-term impact of the pandemic on labor supply, innovation, human capital, and productivity. Moreover, cities with more effective pandemic responses may also have attracted more new workers, who may have perceived these cities to have better public institutions.
More specific historical details also shed light on why NPIs in 1918 did not worsen the economic downturn. NPIs implemented in 1918 were milder than the measures adopted in some countries during COVID-19. On the spectrum of costs and benefits of specific NPIs, many measures implemented in 1918 had relatively modest economic costs. More severe measures, such as widespread closures of businesses will likely increase the cost of NPIs. School closures were less costly in 1918, as female labor force participation was lower. Estimates suggest that the 1918 Flu Pandemic was more deadly than COVID-19, especially for prime-age workers, which also suggests more severe economic impacts of the 1918 Flu Pandemic and greater medium-run benefits of NPIs. The 1918 H1N1 virus also had a shorter incubation period than COVID-19, which facilitated identifying and isolating suspected cases. As a result, we stress the limits of the external validity of lessons from the 1918 Flu Pandemic. Despite these important differences, ongoing research finds that NPIs implemented in 2020 have reduced disease transmission (Allcott et al. Reference Allcott, Levi Boxell, Ferguson, Gentzkow and Goldman2021) while accounting for a relatively small fraction of the overall decline in economic activity (see, e.g., Sheridan et al. Reference Sheridan, Lau Andersen, Toft Hansen and Johannesen2020; Baek et al. Reference Baek, McCrory, Messer and Mui2020; Demirgüç-Kunt, Lokshin, and Torre Reference Demirgüç-Kunt, Lokshin and Torre2020; Goolsbee and Syverson Reference Goolsbee and Syverson2020).