Mining and the exploitation of natural resources has long been seen as a mixed blessing for the development of an economic area. Rich endowments of resources provide cheap access to important inputs in the production process, which can lead to increased employment and higher incomes (Black, McKinnish, and Sanders Reference Black, McKinnish and Sanders2005; Michaels Reference Michaels2011; Allcott and Keniston Reference Allcott and Keniston2014; Aroca Reference Aroca2001; Fernihough and O'Rourke Reference Fernihough and Hjortsh⊘j O'Rourke2014; Chandler Reference Chandler1972; Wright Reference Wright1990). On the other hand, many studies describe a “resource curse,” in which the area becomes focused on exploitation of the resource and does not develop more broadly. The export of the mining product could crowd out other economic activities (Sachs and Warner Reference Sachs and Warner2001). Other scholars have emphasized the quality of institutions as the main factor in determining if there is a positive or negative relationship between resource endowments and incomes (Mehlum, Moene, and Torvik Reference Mehlum, Moene and Torvik2006). The process of unearthing the resources can have negative consequences for health, making the mining area an unattractive place to live. This can make it more difficult to attract workers and families, to the extent that the mines have to pay compensating high wages to get miners to come work there (Fishback Reference Fishback1992).
The goal of this article is to understand the economic and demographic consequences on communities in the United States that have experienced multiple expansions and contractions of coal mining activity. Capturing the short- and long-term net impacts on local areas over a 30-year time period, spanning multiple expansions and contractions, is a key part of this analysis. A long-run historical perspective is necessary because many of the mining areas in the United States were first settled between 1870 and 1930, when coal was the dominant source of fuel in the United States, and have gone through long cycles of boom and bust. I collected, compiled, and digitized a panel database of annual county-level coal mining activity from 1870 to 1970 for the entire United States. The estimation strategy identifies time-varying net effects from county-specific deviations in coal mining activity relative to county averages, after controlling for shocks in a state in each year. The estimation results should be interpreted as the average net impact of possessing and extracting differing amounts of coal over time, versus not possessing the ability to extract coal in the county.
The results of the article provide evidence that increased levels of coal production had a positive impact on population over an initial ten-year span, and that the effect was most prevalent in eastern states before 1930. The results also show that mining activity stimulated population growth for two decades, but began to have negative effects on population after three decades. Summing up the effects suggests that there was not a significant overall decrease in population due to coal mining, relative to areas that do not engage in coal mining, and that the overall net effect over a 20- or 30-year period was positive. The article also provides evidence that increased coal mining activity had a small and positive short-term net impact on manufacturing activity, but that the manufacturing sector did not experience long-term benefits from the increase in local coal mining activity. Short-term increases in earnings and output, coupled with short- and long-term decreases in per capita employment, suggest that any surge in manufacturing activity due to increases in local coal mining activity was not a long lasting phenomenon, and that manufacturing firms did not find it advantageous to locate near coal extraction sites.
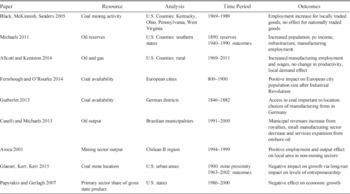
Numerous studies have attempted to understand the economic consequences of natural resource extraction. Many of these studies illustrate the importance of organizational and institutional conditions to the economic consequences of mineral production, and have been done using cross-country comparisons where large differences in local conditions can exist (Mehlum, Moene, and Torvik Reference Mehlum, Moene and Torvik2006; David and Wright Reference David and Wright1997; Sachs and Warner Reference Sachs and Warner2001). Also, many of these studies are focused on the post-1945 era, implying the resource curse may be specific to the conditions in the developed and developing world during this timeframe. As summarized in the Appendix, others have investigated the economic consequences of resource extraction within a specific geographical area over time (Black, McKinnish, and Sanders Reference Black, McKinnish and Sanders2005; Michaels Reference Michaels2011; Caselli and Michaels Reference Caselli and Michaels2013; Papyrakis and Gerlagh Reference Papyrakis and Gerlagh2007; Allcott and Keniston Reference Allcott and Keniston2014; Glaeser, Kerr, and Kerr Reference Glaeser, Pekkala Kerr and Kerr2015).Footnote 1 There is also an extensive literature that chronicles the importance of natural resources to industrialization in North America and Europe (Wright Reference Wright1990; Chandler Reference Chandler1972; Gutberlet Reference Gutberlet2013; Fernihough and O'Rourke Reference Fernihough and Hjortsh⊘j O'Rourke2014; Keay Reference Keay2007; Clark and Jacks Reference Clark and Jacks2007). This study contributes to the existing literature by capturing both the short- and long-term net impacts of up to 30 years of coal mining on local areas, over multiple expansions and contractions in activity.
NATURAL RESOURCES AND LOCAL ECONOMIES
The idea of a curse of natural resources, where exploitation of the resource results in a lack of broad development, is in conflict with research in economic history that has shown the importance of natural resources to industrialization and economic development. Alfred Chandler (Reference Chandler1972) documented the importance of cheap anthracite coal to the rise of factories in many industries (iron, glass, paper, textiles, distillation) throughout the northeastern United States in the 1830s and 1840s, which allowed American manufacturers to meet the growing demand for goods at a time of rising population and improving transportation. Gavin Wright (Reference Wright1990) finds that the timing of U.S. leadership in industrial production in the late nineteenth and early twentieth centuries coincided with U.S. leadership in coal production and the growth of the natural resource content of American exports. More recently, Ian Keay (Reference Keay2007) shows that Canada's natural resource endowment positively influenced the size and efficiency of the economy throughout the twentieth century. Research has also shown the importance of access to natural resources, such as coal, in the location choice of manufacturing firms in nineteenth-century Germany (Gutberlet Reference Gutberlet2013), suggesting there could be direct effects of coal production on manufacturing employment in local areas during phases of early industrialization. For an opposing view regarding the importance of access to coal, Gregory Clark and David Jacks (Reference Clark and Jacks2007) conclude that England gained little advantage from possessing coal and that “an Industrial Revolution based on coal reserves which gave the same pithead price but were located in the Netherlands or Ireland would not have involved a much slower growth rate.”
A priori predictions for the impact of coal mining activity on local economic development are uncertain. In the short run, a surge in mining activity may be accompanied by an increase in local demand for goods and services, increasing activity in these sectors. This effect could be especially strong in coal mining company towns, many of which were located in isolated areas. The increase in coal mining activity and incomes is also likely to drive up wages in the area in other sectors, like the manufacturing of tradable goods, potentially crowding out activity. The increase in coal mining activity is also likely accompanied by the migration of coal miners and their families into the area, potentially exacerbating the direct demand and price effects in the short run. Dan Black, Terra McKinnish, and Seth Sanders (Reference Black, McKinnish and Sanders2005) examined the coal boom and bust of the 1970s and 1980s in Kentucky, Ohio, Pennsylvania, and West Virginia, and found evidence of modest employment spillovers into sectors with locally traded goods. Hunt Allcott and Daniel Keniston (Reference Allcott and Keniston2014) investigated the effects of oil and gas booms and busts in the United States since the early 1970s, and show oil and gas booms increase manufacturing employment and overall wages, and that manufacturing productivity does not increase. The authors surmise that rural manufacturing firms are benefiting from increases in local demand.
Other sectors of the local economy could benefit from coal mining activity as more time passes from technology spillovers, learning by doing, agglomeration effects occurring via downstream and upstream linkages to other sectors, improvements in local infrastructure or education, or the net migration of labor. One potential long term downside of coal mining is a shift in resource allocation in the area away from the tradable non-resource sector and productivity improving activity. This is mainly driven by the crowding-out effects of higher local factor prices and the lack of firm entry or expansion. Edward Glaeser, Sari Pekkala Kerr, and William Kerr (2015) find that the presence of historical coal mines in the vicinity of urban areas has a negative impact on long run levels of entrepreneurship, which in turn has a negative impact on the growth prospects of that area. On the other hand, Allcott and Keniston (Reference Allcott and Keniston2014) suggest that if spillovers from the resource sector are strong enough, then long term tradable output may be higher in areas that experience resource booms.
Guy Michaels (Reference Michaels2011) investigated oil reserves impacts in the southern United States from 1890 to 1990 and found that in the long run, oil abundance raised per capita income, attracted population, improved infrastructure, and increased manufacturing employment at the county level. This is in contrast to the short-term theory, and results of Black, McKinnish, and Sanders (Reference Black, McKinnish and Sanders2005) in Appalachia. The author surmises that the results show higher wages can attract population and lead to infrastructure investment, increasing productivity across industries, overcoming the potential of higher local factor prices and other negative spillovers. Others have used a Jennifer Roback (Reference Roback1982) style general equilibrium model to identify specific economic impacts of a productivity shifter, or policy, on a local area through factor costs, direct demand, or positive economic spillovers (Hornbeck and Keskin Reference Hornbeck and Keskin2012; Kline and Moretti Reference Kline and Moretti2014; Greenstone, Hornbeck, and Moretti Reference Greenstone, Hornbeck and Moretti2010; Kitchens and Fishback Reference Kitchens and Fishback2015). I contribute to this literature by using county-level data in the United States to answer whether or not mining for coal impacts local communities differently as time passes, over multiple expansions and contractions.
Figure 1 presents the amount of bituminous coal produced in the United States from 1800 to 2000, and illustrates the cyclical boom and bust nature of coal mining activity in the United States since 1870.Footnote 2 Community building happened quickly in many areas where mining occurred, but understanding the full consequences requires community conditions to be viewed many years later. An analysis that spans multiple boom and bust cycles, and accounts for the amount of mining activity in the area over a long time period, should capture any impacts on local communities from mining activity which may take years to surface. Long-term changes due to net migration, technology spillovers, agglomeration, infrastructure improvements, or a crowding out of resource allocation, will be identified in the analysis by using long-term measures of coal production at the county level. A positive net result on employment implies spillover or agglomeration impacts outweigh any negative effects from resource allocation or crowding out. Short-term impacts, such as local demand spillovers or crowding-out wage effects, will be identified in the analysis by using short-term measures of coal production at the county level. A positive net result on employment implies local demand effects are greater than any negative impacts due to crowding out.
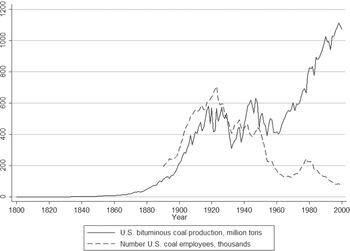
Figure 1 NATIONAL COAL PRODUCTION AND EMPLOYMENT VERSUS YEAR
RESEARCH DESIGN
This article identifies the net effects of coal mining on local area population and non-mining activity, and analyzes specific channels through the use of time-varying measures of coal production. The net effects will be identified from county-specific deviations in coal mining activity across time, about the county averages, after controlling for shocks in a state in a year. The analysis will be performed using county coal production, population, and manufacturing activity from 1870 to 1970.Footnote 3 In 1870, approximately 17 million tons of bituminous coal was being produced in the United States. By 1880, over 42 million tons of bituminous coal were being produced, with an increase to over 212 million tons by 1900 (United States Geological Survey 1882–1931). This dramatic rise in reported coal production, starting in approximately 1870, is shown in Figure 1. Also, before 1870 significant coal production operations were concentrated in Illinois, Maryland, Ohio, and Pennsylvania, and total production did not cross the 10 million net ton threshold until 1864 (United States Geological Survey 1882–1931).Footnote 4 The increase in productivity per worker is strongly related to the level of mechanization present in the coal mining industry. Innovations like the mechanical loader in the 1920s, and the continuous miner in the 1940s, significantly lessened the cost of accessing coal. Figure 1 shows that by 1970 140,000 employees produced roughly the same amount of coal that 640,000 employees produced in 1920.
A dramatic shift in the relationship between U.S. coal production and coal employment, where increases and decreases in coal production are not related to changes in coal employment, is shown in Figure 1 to have occurred in approximately 1970. While it is recognized that stopping the analysis in 1970 will not include the dramatic increase in coal production that began in the United States during this time period, inclusion of the post-1970 period in the analysis could potentially identify a different effect than the pre-1970 period. In the pre-1970 period, the analysis will identify the time-varying net impacts of changes in cumulative coal mining on net migration and local manufacturing activity, which will be driven in part by coal mining employees and their families moving into and out of the area. An analysis using the post-1970 period would identify the net impacts changes in cumulative coal mining activity have on the local area that are not related to employee migration. These impacts may be driven solely by changes in pay to existing employees, or changes in profits to corporations, who may or may not have a presence in the area. These two mechanisms are very different, which is the main reason the choice was made to end the analysis in 1970.
A within-country investigation from 1870 to 1970 will also allow the analysis to focus more directly on causal factors aside from the political economy and institutional structure. By 1870 the United States had established a basic set of property rights, protections of individual freedom, rule of law, and federal structure of state, local, and national governments, which has been largely consistent over time. Paul David and Gavin Wright (Reference David and Wright1997) present evidence that these institutions were one of the many reasons the United States was able to exploit its resource endowment more effectively than other countries. Wright (Reference Wright1990) argues that mineral supplies were “more a matter of development than endowment,” and that historical resource abundance in the United States was a result of industrial success and progress. Using the United States from 1870 to 1970 will address how coal mining activity and the boom and bust nature of extracting natural resources shaped local economies in a situation where the impact of national level institutions and their enforcement were fairly uniform.
Data
For this article I collected, compiled, and digitized a panel database of annual county-level coal mining activity from 1870 to 1970 for the entire United States.Footnote 5 Mining production information provides a direct measure of variation in local mining activity, and also enables the creation of a cumulative measure, which will allow the examination of the buildup and decline of mining activity over various time periods. The annual coal mining production data from 1870 to 1931 was acquired from the United States Geological Survey (USGS) and the Bureau of Mines Mineral Resources of the United States documents (USGS 1882–1931). These documents were published from 1882 to 1931 and contain annual county-level coal mining production information. The U.S. coal mining data for the years 1932 to 1970 were obtained from the USGS and the Bureau of Mines Mineral Yearbook documents. These documents have been published since 1932 and also contain annual county-level coal mining production information (USGS 1932–1970).
All three main types of coal are included in these observations: anthracite, bituminous, and lignite. The majority of the observations report less than 2,000,000 short (net) tons of coal production at the county level in a year. The mean level of annual coal production at the county level for the entire sample is 1,475,383 short tons. Coal production data were only obtained for those counties that reported data in the documents. Production data in the documents came from the efforts of multiple sources: commercial mines, traffic managers of coal-originating railroads, local coal operator associations, and state mine inspectors. Counties with significant coal operations report their production consistently. If coal production was not reported, production is set equal to zero in that county and year when the summation of annual coal production over each decade or time period is performed. This procedure will be discussed further in the following section.
The mining production data are merged with economic and socio-demographic data obtained from Census publications compiled in Michael Haines (Reference Haines2010). Outcome data for total population and manufacturing employment was obtained at the county level for the decennial census years 1870 to 1970. Additional information on the manufacturing sector (earnings, output, number of establishments) was obtained for the decennial census years up to 1940. The result of the data collecting process is one panel dataset where each observation is a county in a year. Additional data on other non-mining sectors (retail, services, wholesale trade) have been collected but are not currently being analyzed. In my analysis it is critical to capture both the early twentieth century, when coal was the dominant fuel in the United States, and multiple expansions and contractions over time. Right now these data do not provide this ability at the county level. Data collection for these variables is ongoing, and may be incorporated in future work.
County boundaries have changed significantly from 1870 to 1970, and could significantly impact the analysis of population, coal mining, and economic conditions at the county level. Therefore, I have combined counties into a larger “new” county if there were any changes from 1900 to 1970. For example, if a county was created in 1910 from another county that had been in existence since 1870, these two counties were combined and are treated as one county in my dataset for the whole time period. I did not address county changes that occurred before 1900. I used the Richard Forstall (Reference Forstall1996) document to help me determine which changes captured in the Atlas of Historical County Boundaries (The Newberry Library 2012) were “significant” and required attention. From the Forstall document, a significant change is “a boundary change large enough to have a significant effect on the county's population as of the preceding census. However, changes that involved a sizable area (generally more than 25 square miles) are treated as significant even if they involved little population.”
Empirical Model
The impacts of coal mining activity on population and manufacturing are estimated at the county level in the United States with the following equation:
where Yct is the outcome measure in county c and census year t, and will include county-level population measures and manufacturing activity. The coefficients of interest are the coefficients for the vector of cumulative county coal production, CoalDecadect , over the three previous decades. To capture the long-term effects of initial settlement before coal production began, I include a series of interaction terms between the initial county population and dummy variables for each census year. For example, for an observation in 1910, this variable would be the population in the county in 1870 interacted with a dummy variable corresponding to year 1910. County fixed effects are included to control for any time invariant characteristics at the county level. These would include: geography, elevation, ruggedness, agricultural suitability, and climate. State-by-year fixed effects are included to take into account any state specific shocks from year to year. This would include any heterogeneous institutional changes, like unionization rates, technological advances and utilization, or changes in infrastructure investment.Footnote 6 The state-by-year fixed effects also capture the impact of national changes, like the World War and the Depression, which may also have had heterogeneous impact in different states.
The first measure of CoalDecadect contains cumulative county coal production in millions of net tons from year t to t–10. The second measure contains cumulative county coal production from year t–10 to t–20, and a third measure contains cumulative county coal production from year t–20 to t–30. For example, if the year is equal to 1920, this variable would contain measures of production form 1890–1900, 1900–1910, and 1910–1920 in that county. The coefficient of the most recent decade, relative to year t, captures the net short-term impacts of coal mining on county population and manufacturing. The coefficients of the second and third measures in CoalDecadect capture longer-term lags in the impact of coal mining, which will measure the mine life-cycle effects on population and manufacturing activity. Combining the coefficients informs us about the overall impact of coal mining on population or manufacturing over a long time period.
The coefficients of the initial population year interaction variables capture the impact over the long run of prior settlement before mining began. When mining was introduced into areas with more population at the start, mining companies had to invest less in infrastructure and were less likely to establish company towns. Such communities may have also been more likely to survive when mining activity slowed or disappeared. The inclusion of county fixed effects captures the part of this variation that was constant over time in each county, while the interaction of the census year dummies with initial population in each county leads to coefficients that show how initial conditions influenced later activity.
In the full specification with county and state-by-year fixed effects, the impact of mining activity is identified by changes over time within each county, while controlling for state specific shocks in each census year.Footnote 7 The estimation strategy uses within county variation in coal mining activity over time, around a long-term average, to identify the time-varying net effects.Footnote 8 By including counties without coal mining in the sample, the results should be interpreted as the average net impact of possessing and extracting differing amounts of coal over time, versus not possessing the ability to extract coal in the county.
Figure 2 offers examples of the identifying variation used in the analysis in three representative coal producing counties in Alabama, Illinois, and West Virginia. Figure 2 shows there is a significant amount of variation in coal production at the county level across time for these three representative counties. Figure 3 contains maps of the United States from 1910 and 1970 that provide the measure of the previous decades' cumulative coal production at the county level. The maps provide the location and concentration of coal mining activity during the twentieth century. Many of the states and counties that mined coal during the 1900s were still mining coal in the 1960s. Yet, the extent of mining varied at those locations over time, and there was a distinct shift in activity from the Illinois coal basin to coal mining areas in Appalachia between 1910 and 1970.
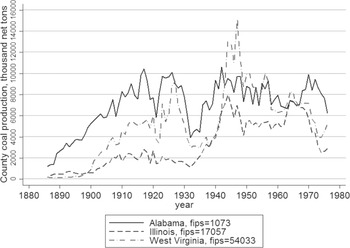
Figure 2 COUNTY COAL PRODUCTION (THOUSAND NET TONS) VERSUS YEAR THREE REPRESENTATIVE COUNTIES IN AL, IL, WV
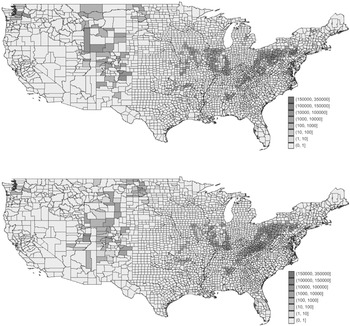
Figure 3 PREVIOUS DECADE COUNTY COAL PRODUCTION (THOUSAND NET TONS) 1910 AND 1970
RESULTS
Population
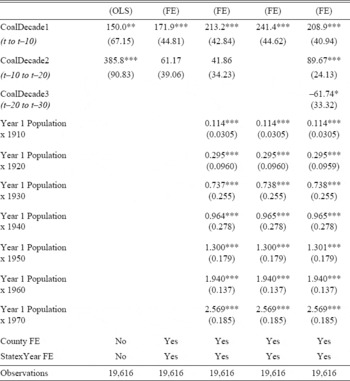
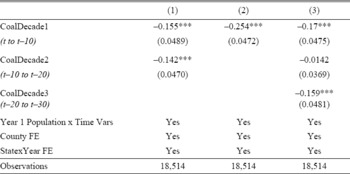
Table 1 shows the estimates of the impact of coal mining production over multiple decades on total population, defined every ten years in the decennial census. The analysis was performed in counties with a total population of less than 100,000 people in the 1900 census. This sample specification excludes counties with very large cities that likely did not have coal production. The ordinary least squares results with no fixed effects in the first column suggest that coal production had a strong initial effect on population, and the effect was even stronger in the subsequent decade. However, once county fixed effects, state-by-year fixed effects, and the initial county population interaction variables are added to the analysis in the rest of the specifications, mining activity had the strongest effects in the initial decade. The coefficient of 213.2 in column three implies an increase of one million tons of production over the past decade increases population by 213 residents, or that a one standard deviation increase in coal production over the past ten years increases county population by 1,711 residents, or 0.031 standard deviations.
Table 1 OLS AND FIXED EFFECT RESULTS — TOTAL POPULATION IN A COUNTY 1900 TO 1970 (NON-URBAN COUNTIES)
Standard errors in parentheses, clustered at county level.
Includes county corrections 1900–1970.
Base year is 1900 for population interaction dummy variable. Coal production in million net tons.
Non-urban defined as county with less than 100,000 people in 1900 census.
* p < 0.10, ** p < 0.05, *** p < 0.01
Sources:
Coal mining information from USGS Mineral Resource and Yearbook documents 1882–1970; county characteristics from Haines (2010).
The specification in column five shows that mining activity stimulated population growth for two decades, but began to have negative effects on population after three decades. The coefficients show that 209 more people were added in counties where an additional one million tons of coal were produced in the most recent decade. Another 90 people were added when one million tons had been produced a decade earlier, but one million tons of production three decades earlier was associated with 62 fewer people in the county. Based on Figure 1, where 625,000 employees produce approximately 500 million tons of coal per year in the 1920s, approximately 125 miners, each producing 800 tons per year, were required to produce a million tons over the course of a decade. Using these figures, the regression results suggest that adding a miner in the most recent decade added the miner to the county, and an additional 0.67 people to the population. Each miner from the preceding decade adds a total of only 0.72 people, and the miner from years t–20 to t–30 is associated with the loss of a total of 0.5 people. Summing up the effects suggests an additional miner who worked for three decades added themselves, and approximately 0.9 of an additional person, to the county population. This is consistent with a pattern where two-thirds of the miners who worked for 30 years brought a spouse to town, had a child in the mining camp, and two-thirds of the children moved away. These results suggest there is not a significant overall decrease in population due to coal mining relative to areas that do not engage in coal mining, and that the overall net effect is positive.
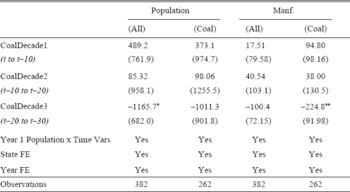
In robustness tests, the results of which are presented in the Appendix, I have rerun the county analysis in Table 1 using the natural log of the dependent variable and by restricting the sample only to states in which coal was ever produced between 1870 and 1970 (33 states). Overall, the results for population are very similar to the results in Table 1. The county-level analysis was also replicated at the state level to address concerns regarding potential spatial correlation in the effects across counties, and to test whether the effects on population extend to the state level. Results are presented for a sample of all states, and coal-producing states only. The signs of the impacts on population are similar to the county results, but only the coefficient for the third decade in all states is statistically significant. The magnitude of the effect is larger, but assuming 125 workers produce one million tons, it would take approximately 8,750 workers to produce the state-level average of 70 million tons in a decade. This implies each additional miner added to produce coal is associated with a loss of approximately 0.13 people in the state three decades later. This effect is actually smaller than the effect at the county level, suggesting long-term migration out of coal mining areas may be happening mostly within states.
The first decade effect of coal activity shown in Table 1 aligns with the prevailing notion of a surge in population when a coal expansion occurs. It is similar to that found in Michaels (Reference Michaels2011), where oil abundance, higher wages, and infrastructure investment attracted population at the county level from 1890 to 1990 in the southern United States. However, the results suggest that the negative effects of mining activity, like pollution, began to have an effect on the local population in approximately the third decade after production. The results for the initial population and census year interaction terms show the importance of early settlement in the counties increased in magnitude over time. In 1910 the relationship with initial population was small, and by 1970 an additional person in 1870 added 2.6 people to the population. These results are also consistent with the idea that the local impact of resource production is dependent on transport costs (Wright Reference Wright1990; Chandler Reference Chandler1972). Many coal areas were developed in remote areas. The time-varying impact of coal production on local population could suggest transport costs were decreasing over time within each county, relative to when production occurred, thereby reducing the amount of local economic activity related to past coal production.
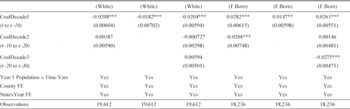
Table 2 shows the results of fixed effects specifications, in non-urban counties, that explore potential differences in the effect of coal production over time on the composition of the county population. The dependent variables are the percent of the county population that is white or foreign born, which were obtained from Haines (Reference Haines2010) for each decennial year.Footnote 9 In the full specifications the short-term effect of the production of one million tons was to raise the share of foreign born by 2.6 percent, while lowering the share of whites by a similar 2 percent. The long-term effect of coal production decreased the share of foreign born by 2.8 percent, more than offsetting the original increase. These short- and long-term fluctuations are most likely driven by the net migration of foreign and non-white coal miners and their families into and out of coal mining areas. The pattern here suggests that immigrants found coal mining to be an attractive occupation, but that once they gained more experience in the United States they migrated to other locations. The impact on the foreign born was likely complicated by the slowdown in immigration caused by the World Wars, Depression, and immigration limits imposed in the 1920s. The results also suggest the non-white population may have been more inclined to migrate to and stay in the coal mining areas. Overall, these results align with prevailing notions of who was working in the coal mines in the United States, and that these workers were mobile.
Table 2 FIXED EFFECT RESULTS — PERCENT WHITE AND FOREIGN BORN IN A COUNTY 1900 TO 1970 (NON-URBAN COUNTIES)
Standard errors in parentheses, clustered at county level.
Coal production in million net tons.
*p < 0.10, ** p < 0.05, *** p < 0.01
Sources:
See Table 1.
Manufacturing Activity
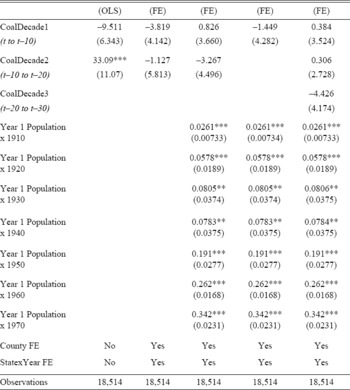
Table 3 shows the estimates of the impact of coal mining production over multiple decades on manufacturing employment. The results in Table 3 show small and statistically insignificant effects of coal mining on manufacturing employment. In the full specification in column five a one-million-ton increase in coal production has effects ranging from 0.3 to −4.4 manufacturing workers over the past 30 years. Given that decade production of one million tons of coal required approximately 125 coal workers, it is clear that decade cumulative coal production does not have a significant net impact on county manufacturing employment, after controlling for the initial county population interaction variables and county and state-by-year fixed effects. When the outcome variable is manufacturing workers per thousand people, as in Table 4, the coefficients for CoalDecade1 and CoalDecade3 are both statistically significant and negative. The short-term negative effect is present in Table 4 because the increase of 125 miners, due to a one million net ton increase in decade coal production, expands the population by a great deal more than the much smaller change in manufacturing employment.
Table 3 OLS AND FIXED EFFECT RESULTS — MANUFACTURING EMPLOYMENT IN A COUNTY 1900 TO 1970 (NON-URBAN COUNTIES)
Standard errors in parentheses, clustered at county level.
Includes county corrections 1900–1970.
Base year is 1900 for population interaction dummy variable.
Coal production in million net tons.
Non-urban defined as county with less than 100,000 people in 1900.
* p < 0.10, ** p < 0.05, *** p < 0.01
Sources:
See Table 1.
Table 4 FIXED EFFECT RESULTS — MANUFACTURING EMPLOYMENT PER CAPITA (1,000 PEOPLE) IN A COUNTY 1900 TO 1970 (NON-URBAN COUNTIES)
Standard errors in parentheses, clustered at county level.
Coal production in million net tons.
* p < 0.10, ** p < 0.05, *** p < 0.01
Source:
Sources: See Table 1.
In robustness tests presented in the Appendix, I have rerun the analysis in Table 3 using the natural log of the dependent variable, restricted the county-level sample to coal-producing states only, and replicated the county-level analysis at the state level. The results for manufacturing employment at the county level are similar in sign to the levels results in Table 3, but the coefficients are now statistically significant in the log-linear specification. The positive short-term and negative longer-term net effects on the percent change in manufacturing employment are nearly offsetting, implying that any initial increase in manufacturing employment due to coal mining does not last beyond the initial decade. The state-level analysis for coal producing states does provide statistically significant evidence that an increase in decade cumulative coal production has a negative long-term impact on manufacturing employment in the state, but when put in terms of coal miners versus coal production, the impact is smaller in magnitude than the results at the county-level provided in Table 3.
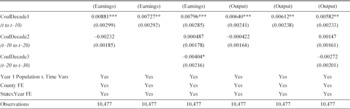
Table 5 shows the estimates of the impact of coal mining production over multiple decades on manufacturing earnings and output, up to 1940.Footnote 10 Surges in coal production in the most recent decade were associated with statistically significant, but relatively small, increases in manufacturing output and in earnings for manufacturing workers. The coefficient on CoalDecade1 in column three shows that a one million net ton increase in coal production during the previous decade increases manufacturing earnings by 0.8 percent, although the coefficient for CoalDecade3 suggests that half of that effect would be given back two decades later. Increases in coal production were also associated with a rise in output of 0.58 percent within the first decade, but then reduced in the long run. These effects on earnings and output are small when measured as elasticities. A one-million-ton rise is approximately 67 percent of the mean cumulative decade coal production in the sample, leading to elasticities of less than 0.02.
Table 5 FIXED EFFECT RESULTS — LOG MANUFACTURING EARNINGS AND LOG OUTPUT IN A COUNTY 1900 TO 1940 (NON-URBAN COUNTIES)
Standard errors in parentheses, clustered at county level.
Manufacturing wages and output corrected for inflation, in thousands of dollars.
Coal production in million net tons.
* p < 0.10, ** p < 0.05, *** p < 0.01
Sources:
See Table 1.
The results in Tables 3–5 provide evidence that increases in coal production decreased per capita manufacturing employment in the county in both the short and long run, but that earnings and output experienced small increases in the short run. This implies that the existing manufacturing sector may have benefited from the influx of population in the short run, due to increases in local demand for their goods, but that the manufacturing sector did not experience long-term benefits from the increase in local coal mining activity. The increase in local demand is plausible, given the types of sub-sector goods included in the Manufacturing SIC sector code of 19 which could have been sold locally: food products, coal products, tobacco, lumber, textiles, and paper. In contrast to the findings for Europe during the period of industrialization, and the results seen in Michaels (Reference Michaels2011), it appears that the mature and extensive rail networks in the United States may have lowered transport costs enough that overall, the manufacturing sector did not find it advantageous to locate near the extraction sites for coal.
Eastern versus Western States
Technology spillovers or agglomeration effects via linkages with other sectors, such as manufacturing, could be different depending on the presence of other types of mining or resource extractive activity, such as copper mining or oil extraction. Most, if not all, of the metals mined in the United States are extracted from western states. For this reason, the sample was split into eastern and western states, where any state that was bisected by the 100th meridian was determined to be western. This resulted in the following states being deemed western: Arizona, California, Colorado, Kansas, Montana, Nebraska, Nevada, New Mexico, North Dakota, Oklahoma, Oregon, South Dakota, Texas, Utah, Washington, and Wyoming. Some of these states were also included in the coal state analysis discussed previously, suggesting that at least at the state level there is the potential for some overlap between coal mining and other types of extractive activity. All other states are eastern states in the analysis.
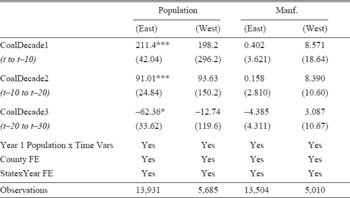
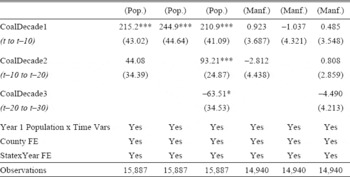
Table 6 shows that the impact coal mining activity had on population movements was mainly driven by counties in states east of the 100th meridian. The coefficients for the eastern state analysis in column one are similar to those shown in Table 1. An increase of one million net tons of coal in the short run raised population by a statistically significant 211 people in eastern states, but only 198 in western states. In eastern states the positive impacts on population extend into the subsequent decade, increasing local population by a statistically significant 91 people. In the long run, local population decreases by 62 people in eastern states. The long-term impacts of the increase in production are similar in sign in both eastern and western states, but the impacts are statistically significant only in eastern states. The manufacturing employment effects were again small and statistically insignificant.
Table 6 FIXED EFFECT RESULTS — TOTAL POPULATION AND MANUFACTURING EMPLOYMENT IN EASTERN AND WESTERN STATES 1900 TO 1970 (NON-URBAN COUNTIES)
Standard errors in parentheses, clustered at county level
Coal production in million net tons
* p < 0.10, ** p < 0.05, *** p < 0.01
Sources:
See Table 1.
Heterogeneity versus Time
Since around 1920, there has been a large drop in coal mining employment in the United States due to increasing levels of mechanization and other factors, such as the rise of household electrification and decreased use of coal in the household. The peak number of bituminous coal mining employees in the United States came in 1923, when 704,793 people were employed in the bituminous coal mining industry. These employees produced 564,565 thousand short tons of bituminous coal in 1923. In 1970, 140,140 employees produced 603,930 thousand short tons of bituminous coal (Cain Reference Cain1800–Reference Cain2000). These statistics, and the relationship between production and employment in the coal sector shown in Figure 1, suggest that there is heterogeneity in the effect of coal mining on population or manufacturing employment relative to time.
Chandler (Reference Chandler1972) and Wright (Reference Wright1990) both address the historical importance of decreasing transport costs in the extraction of coal in the United States. Clark and Jacks (Reference Clark and Jacks2007) conclude the Industrial Revolution would have occurred even if coal was not located in England, in part due to low transport costs. This is in contrast to the results of Gutberlet (Reference Gutberlet2013), who finds that manufacturing firms in nineteenth-century Germany did find it advantageous to locate near coal. These findings provide additional motivation to explore any potential structural shifts in the impact coal production had on local economic outcomes from 1870 to 1970. In early stages of development, when transport costs are potentially high, it may be advantageous for economic activity to be located near the coal extraction location. While the national rail network of the United States was mature by the late nineteenth century, many coal mining areas were developed in remote locations. The impact of coal production on local economic outcomes may vary with time if after controlling for county and state-by-year fixed effects, and the initial population interaction variables, transport costs within and across counties experienced significant variation from 1870 to 1970.
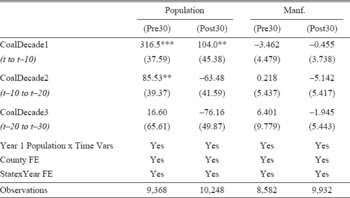
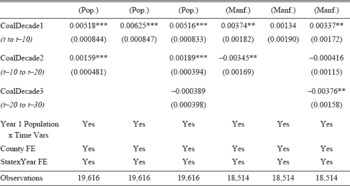
Table 7 shows the estimates that explore these potential differences by allowing the effects of coal mining to vary before and after 1930. Columns one and two contain results for population in the pre- and post-1930 periods. The analysis was performed by splitting the sample in 1930, and uses the full specification with county and state-by-year fixed effects. The pre-30 analysis includes the 1930 census year population as an outcome, and the post-30 analysis includes outcomes in 1940, 1950, 1960, and 1970. The population results suggest that positive migration in the most recent decade was present throughout the whole time period, but that there was a shift in the long-term impacts after 1930. An increase in coal production of one million tons in the most recent decade increases population by 317 people in the pre-1930 period, an approximately 50 percent increase relative to the effects for the whole sample. The long-term impacts are similar in magnitude to the effects for the whole sample, but the positive impact in the second decade is present only in the pre-1930 period, and the negative third decade impact is only present in the post-1930 period. The manufacturing employment effects were again small and statistically insignificant, providing additional evidence that overall, manufacturing firms did not find it advantageous to locate near coal extraction sites. One potential explanation is that transport costs were already low enough relative to other labor and capital costs in the late nineteenth century, and that this relationship did not significantly change in either the pre- or post-1930 periods.
Table 7 FIXED EFFECT RESULTS — TOTAL POPULATION AND MANUFACTURING EMPLOYMENT PRE AND POST 1930 (NON-URBAN COUNTIES)
Standard errors in parentheses, clustered at county level.
Coal production in million net tons.
* p < 0.10, ** p < 0.05, *** p < 0.01
Sources:
See Table 1.
CONCLUSION
This research contributes to the existing literature of economic development from natural resources, the resource curse, and the consequences of mining activity, by using long-term county and state data in the United States to investigate the boom and bust nature of extracting natural resources. This study has an advantage over prior studies by capturing short- and long-term effects of up to 30 years of coal mining activity. Detailed county-level mining production data have allowed me to capture short- and long-run impacts by creating lagged and cumulative measures over various time periods. Therefore, the study is able to come much closer to measuring the impact of production over the entire life cycle of the coal mines.
The results of the article provide evidence that increased levels of coal production had a positive short-term net impact on population, and that the effect was most prevalent in eastern states before 1930. The results also show that mining activity stimulated population growth for two decades, but began to have negative effects on population after three decades. The first decade effect of coal activity aligns with the prevailing notion of a surge in population when a coal expansion occurs. However, the results suggest that the negative effects of mining activity, like pollution, did not begin to have an effect on the local population until approximately the third decade after production. Summing up the effects suggests an additional miner who worked for three decades added themselves, and approximately 0.9 of an additional person, to the county population. These results suggest that there was not a significant overall decrease in population due to coal mining, relative to areas that do not engage in coal mining, and that the overall net effect over a 20- or 30-year period was positive.
The article also provides evidence that increased coal mining activity had a small and positive short-term net impact on manufacturing activity, measured via earnings, output, and employment, but that per capita manufacturing employment decreased in both the short and the long run. Manufacturing firms may have been selling a portion of their goods locally, benefiting from the influx of population in the short run, but they did not experience long-term benefits from the increase in local coal mining activity. Firms may have hired additional workers to fulfill an increase in local demand, but any potential increase in manufacturing employment was offset by the surge of population to the area. Short-term increases in earnings and output, coupled with short- and long-term decreases in per capita employment, suggest that any surge in manufacturing activity due to increases in local coal mining activity was not a long lasting phenomenon, and that overall manufacturing firms did not find it advantageous to locate near coal extraction sites. Future research will work to expand the analysis beyond the mining and manufacturing sectors, providing further evidence on the relationship between coal mining activity and local economies.
Mining is thought to be among the activities that are most damaging to the environment and to health, but the products unearthed are often essential for many goods and services that can lead to higher standards of living. Accurate measurement of the impact of mining is extremely important for evaluation of public policies toward mining. The results of this article suggest extracting coal may be a good policy for an area when considering the outcomes of the local, non-mining industries. Extractive industries still play a large role in the national and local economies of the United States and around the world. Understanding the historical results of such activity in the United States should provide some insight into the world today.
Appendix
Appendix Table 1 TOTAL POPULATION AND MANUFACTURING EMPLOYMENT IN COAL PRODUCING STATES 1900 TO 1970 (NON-URBAN COUNTIES)
Appendix Table 2 LOG POPULATION AND LOG MANUFACTURING EMPLOYMENT IN A COUNTY 1900 TO 1970 (NON-URBAN COUNTIES)
Appendix Table 3 FIXED EFFECT RESULTS — TOTAL POPULATION AND MANUFACTURING EMPLOYMENT IN A STATE 1900 TO 1970
Appendix Table 4 LITERATURE REVIEW SUMMARY