


1. Introduction
Air pollution abounds throughout the world (World Health Organization 2022), harming our health and marring our cities. It originates from burning fossil fuels, burning waste, agriculture, industry and natural sources (World Health Organization 2006). Particulate matter is one component of air pollution that approximately 90 % of towns and cities breathe in excess of published guidelines (Southerland et al. Reference Southerland, Brauer, Mohegh, Hammer, van Donkelaar, Martin, Apte and Anenberg2022; World Health Organization 2021, 2022). Particulate matter causes or contributes to various non-communicable diseases, and is the 13th leading cause of mortality worldwide (Anderson, Thundiyil & Stolbach Reference Anderson, Thundiyil and Stolbach2012). Nature has an effective and beautiful way to clean pollutants out of the air: rain.
Environmental studies show that rain cleans particulate matter out of the air (Barnes et al. Reference Barnes, Pacheco, Landuyt, Hu and Portnoy2001; Green et al. Reference Green, Dettmann, Yli-Panula, Rutherford and Simpson2004; Pérez, Gassmann & Covi Reference Pérez, Gassmann and Covi2009), and laboratory experiments confirm that falling droplets act as the capture mechanism (Davies Reference Davies1961). But how do rain droplets capture pollution particles, and can we learn how to clean our air better by understanding rain? Previous conceptual models explain that as a rain droplet falls, it sweeps through a cylindrical volume of air (McDonald Reference McDonald1962). Particles within that volume either collide with the droplet or flow around it, depending on particle position relative to the falling droplet, and the particle Stokes number, which is defined as  $St=2d_p^2 \rho _p U (9 \nu \rho _a R_d)^{-1}$, where $d_p$ is the particle diameter, $\rho _p$ is the particle density, $U$ is the droplet free fall velocity, $\nu$ and $\rho _a$ are the kinematic viscosity and density of air, respectively, and $R_d$ is the droplet radius (Michael & Norey Reference Michael and Norey1969). Particles with larger $St$ deviate more from the air streamlines as they bend around a falling droplet. Hence increased $St$ and closer proximity to the swept-cylinder axis increase particle–droplet collision rates. These basic flow dynamics are also supplemented by turbulence in the air, which can alter particle motion (Maxey Reference Maxey1987; Voth & Soldati Reference Voth and Soldati2017; Mathai, Lohse & Sun Reference Mathai, Lohse and Sun2020), induce large particle accelerations (Toschi & Bodenschatz Reference Toschi and Bodenschatz2009), and increase particle collisions (Pumir & Wilkinson Reference Pumir and Wilkinson2016). These effects parametrize the so-called droplet collision efficiency (the fraction of particles in the swept cylindrical volume that collide with the drop), which sometimes is erroneously called a collection efficiency. Collision efficiencies reported in the literature are typically based on theoretical considerations or bulk measurements of cumulative particle collection (McDonald Reference McDonald1962, Reference McDonald1963; Michael & Norey Reference Michael and Norey1969; Moore et al. Reference Moore, Hanlon, Powers, Schmale and Christner2020). However, previous models and experiments fail to detail particle–droplet impact behaviours and their effects on the capture events. Particles impacting a liquid pool may be captured on the surface, enter, or rebound off the surface (Lee & Kim Reference Lee and Kim2008; Wang, Song & Yao Reference Wang, Song and Yao2015; Wang et al. Reference Wang, Song, Ji and Yao2017; Chen et al. Reference Chen, Liu, Lu and Ding2018; Galeano-Rios et al. Reference Galeano-Rios, Cimpeanu, Bauman, MacEwen, Milewski and Harris2021), suggesting that particle–droplet collision does not ensure particle capture or collection.
To more fully understand the natural air-cleaning mechanism of rain, we investigate the impact of natural and model airborne particles with water droplets by blowing various particles at a stationary droplet and imaging the impact events with high-speed photography. We find multiple impact behaviours, which do not all result in particle capture, and map out the parameter space in which they occur.
2. Experimental methods and description
2.1. Particle–droplet impact experiments
Figure 1(a) shows a schematic of the experimental set-up used for the particle–droplet impact experiments. We secured a syringe approximately 2–5 cm over the top end of PVC piping and expressed tap water from a flat-ended hypodermic needle on its tip to form a pendant droplet with diameter in the range  $d_d=0.5\unicode{x2013}1.8$ mm. We then placed a small amount ( ${\lesssim }40 {\rm mm}^3$) of particles of known properties in the other end of the PVC piping, inserted an air compressor blow gun, and blew the particles through the horizontal section of pipe, which turned a corner to flow upwards, out of the pipe, and towards the droplet on the syringe. For some of the higher-velocity experiments, we placed a single horizontal pipe to the side of the droplet and blew from the side so that the back of the droplet was unobstructed by the hypodermic needle to allow particles to escape from the droplet unimpeded. The average particle-to-air volume fraction for these experiments was $O(10^{-5})$. We adjusted the velocity of the air and suspended particles by adjusting the air compressor outlet pressure, resulting in air and particle velocities in the range $U = 0.86 \unicode{x2013}20.49\ {\rm m}\ {\rm s}^{-1}$. This produces droplet Reynolds numbers $Re=U d_d/\nu$ in the range 64–1068. This variation in $Re$ is unlikely to affect the particle impact events, because particles impact on the front of droplets, and the streamlines of the air flow are most sensitive to $Re$ in the wake of the droplet.

Figure 1. Experimental set-up and images of particles. (a) Experimental set-up used to blow particles at a droplet of water on a syringe. (b–g) Sample microscope images of particles used (all have the scale shown in b). The particles are: (b) desert dust, (c) wood ash, (d) sunflower pollen, (e)  $43\ \mathrm {\mu }{\rm m}$ polystyrene spheres, (f) $82\ \mathrm {\mu }{\rm m}$ solid glass spheres and (g) $86.5\ \mathrm {\mu }{\rm m}$ steel spheres. The set-up used to measure the contact angle $\theta$ of particles is shown in (h) and described in § 2. Sample images from this set-up are (i) a hydrophilic particle and (j) a hydrophobic particle. Particles stick to the outer surface of droplets in a way similar to how they stick to a pool of water, as shown in (k,l).
We imaged the flow of the particle-laden air over the droplet at 90 000–200 000 frames per second with a Photron SA-Z high-speed camera, that looked through an InfiniTube FM-200 with  $1\times$ and $2.5\times$ objective lenses (from Infinity) providing spatial resolution $2.1\unicode{x2013}5.3\ \mathrm {\mu }{\rm m}$ per pixel. Most of the particles approached the drop in a straight line, with negligible deviation caused by the air turning to go around the droplet. Particles with smaller diameter $d_d$, density $\rho _p$ and/or velocity $U$ deviated slightly from a straight trajectory. The Stokes number describes this behaviour and is a ratio of the time it takes a particle to respond to a change in the flow to the time scale of the flow change (large numbers indicate a slow particle response, i.e. a straighter trajectory). For particles flowing around a sphere, the Stokes number is defined as $St=2d_p^2 \rho _p U (9 \nu \rho _a R_d)^{-1}$, where $U$ is the particle velocity, because the droplet is fixed (Michael & Norey Reference Michael and Norey1969). In our experiments, the Stokes number was relatively high, $St= 1.7 \unicode{x2013}4300$, resulting in the mostly straight trajectories that were observed as particles approached the droplet. Particles approaching a droplet impacted at random locations, and we saved and analysed video clips with particle impacts in sufficient focus. From the videos, we measured the particle impact velocity $U$, droplet diameter $d_d$, and radial location where the particle impacts the droplet $R_i$, which is measured in cylindrical coordinates $(r,z)$ as shown in figure 2.

Figure 2. Measurement of impact radius  $R_i$. When a particle impacts on the front of a droplet (as viewed by the camera), $R_i$ is measured by finding the $z$ location where the droplet and particle are tangent, as shown by the dotted black line. At this $z$ location, the droplet and particle make the same angle $\alpha$ with the $z$-axis. The location of first contact must lie on the droplet surface at this $z$ location, and all points on the droplet surface at this $z$ location have the same distance, $R_i$, to the $z$-axis (which is parallel to $\boldsymbol {U}$).
2.2. Particles
We blew natural and synthetic model particles with various properties at the droplets. The natural particles consisted of various pollens, wood ash and desert dust. We collected the pollen from various plants in Newport, Rhode Island, in the spring and summer of 2021. We obtained samples of desert dust from the Sonoran Desert near Phoenix, Arizona, where regular dust storms occur. The model particles were approximately spherical, made of various materials, had mean diameters in the range  $d_p = 10\unicode{x2013}196\ \mathrm {\mu }{\rm m}$ and densities in the range $\rho _p = 120\unicode{x2013}7800\ {\rm kg}\ {\rm m}^{-3}$, and were sold by Duke Scientific and Cospheric. This resulted in particle-to-droplet diameter ratios in the range 0.015–0.26. We coated some of the model particles with a hydrophobic coating called Glaco Mirror Coat Zero, which increased the wetting angle of the particles. This was accomplished by spraying a thin layer of particles in a beaker and then lightly heating the beaker on a hot plate to shorten the drying time. We repeated this two to three times to improve the consistency of the coating, but still observed some variation in the wetting angle between particles. This coating did not appear to appreciably affect the diameter or density of the particles. Properties of the various natural and model particles used are listed in table 1, and sample images of some particles are shown in figures 1(b–g). Particle images were taken with a Zeiss Stemi SU 11 Apo light microscope and a Toupcam E3CMOS02300KPA camera.
Table 1. Properties of the particles used in the experiments and of some common pollutants. For the particles used in the experiments, we show the mean diameters and contact angles, and the range within which 95 % of the particles lie. The coating on some of the particles is Glaco Mirror Coat Zero, which increases the contact angle. Some of the polystyrene particles were too small to get an accurate contact angle measurement, but all the other polystyrene particles have a mean contact angle between  $61^{\circ }$ and $63^{\circ }$ so these are expected to be the same. The size distributions of the wood ash and desert dust were skewed, so the ranges within which 95 % of the diameters fell are listed instead in parentheses. The lower end of the range is the optical resolution of the camera for the zoom used. The properties of common pollutants found in the literature are indicated by an asterisk and do not represent the ranges within which 95 % of particles lie (Chepil Reference Chepil1957; McDonald Reference McDonald1962; Shahad Reference Shahad1989; Sosnoskie et al. Reference Sosnoskie, Webster, Dales, Rains, Grey and Culpepper2009; Wagner et al. Reference Wagner2009; Després et al. Reference Després2012; Wang et al. Reference Wang, Tang, Mei and You2018, Reference Wang, Yuen, Chan, Chen, Yang, Cheung and Yeoh2020; Bhatt et al. Reference Bhatt, Priyadarshini, Acharath Mohanakrishnan, Abri, Sattler and Techapaphawit2019).

Figure 1(h) shows a schematic of the experimental set-up used to measure particle wetting angles. To measure the wetting angle, we sprinkled particles over a small pool of water such that the particles became captured on the pool surface, and we took photos of them as shown in figures 1(i,j). Note that particles protrude from droplet surfaces in a way similar to that shown in figures 1(k,l). From the photos, we measured the height that the particles protruded above the water surface, which we then used to calculate the wetting angle  $\theta$ of the particles, which is the angle between the wetted spherical surface and the local pool surface. A force balance of gravity, buoyancy and surface tension showed that gravity has a negligible effect on the particles captured at the pool interface, as described by the low Bond number $Bo=\rho _l g d_p^2/\sigma = O(10^{-5}\unicode{x2013}10^{-3})$ (where $\rho _l$ is the liquid density, $g$ is the gravitational acceleration, $d_p$ is the particle diameter and $\sigma$ is the surface tension coefficient). These calculations showed the deformation of the pool near the particles is approximately $0.1^{\circ }$ or less. Hence calculations of $\theta$ can be simplified to the angle formed by the intersection of a sphere with a plane. We measured $\theta$ on ten particles of each kind, and report the mean and range within which 95 % of contact angles lie in table 1.
Table 1 also shows properties of some common pollutants, which we use with the free fall velocity of rain drops,  $0.7\unicode{x2013}9.2\ {\rm m} {\rm s}^{-1}$ (List Reference List1951, p. 396), to predict the range of impact behaviours expected for common pollutants, as discussed in § 3 and shown on the right of figure 4(j) with the light blue bars.
2.3. Measurement of the impact radius  $R_i$ and uncertainty quantification

The impact radius  $R_i$ is found by measuring the distance from the droplet central axis $z$ to the point where the particle first contacts the droplet, as shown in figure 2. For most particle impacts in these experiments, the particles impact with a vertical velocity (when blown from below, or horizontal when blown from the side). Hence $z$ is also vertical, being set parallel to the particle velocity vector $\boldsymbol {U}$ at impact. If a particle turns as it approaches the droplet, due to a low Stokes number, then the particle may impact with a non-vertical impact velocity. To account for this, the reference frame must simply be turned to align $z$ with the particle velocity vector at impact.
When the particle impacts on the outer circumference of the droplet, as seen by the camera, the measurement of  $R_i$ is straightforward as $R_i$ is perpendicular to the viewing direction of the camera. When the particle impacts on the front surface of the droplet (as sketched in figure 2), $R_i$ is not perpendicular to the viewing direction of the camera, but $R_i$ can still be measured by assuming that the droplet and particle are both axisymmetric. This is done in the following manner. First, the impact frame is the first frame in which droplet deformation occurs. Second, the location of first contact is the point where the droplet and particle surfaces are tangent. This lies at the $z$ location at which both the particle and droplet surfaces make the same angle $\alpha$ with the $z$-axis, as shown in the sketch in figure 2. All points on the droplet surface at this vertical location have the same distance to the droplet axis, $R_i$. Hence the impact radius $R_i$ is measured as the distance from the droplet central axis to the point on the drop circumference at this vertical location. We examined a sample set of impact cases and estimate the 95 % confidence uncertainty of this measurement technique to be $\pm 1.5$ pixels. Additionally, the zeroth-order uncertainty of finding the edge of droplets and particles for all the image-based measurements is $\pm 0.5$ pixels at 95 % confidence. We propagated these uncertainties for each impact case through the equations for calculating $R_i/R_d$ using the Taylor series method, and found that 95 % of the data have a 95 % confidence uncertainty of less than $\pm 0.025$ on $R_i/R_d$ (where $R_d$ is the droplet radius). This uncertainty is plotted next to the axes in figures 4(j) and 6(e), which are discussed in § 3.
Uncertainties on the variables used to calculate  $We_p$ were also propagated through the equation for $We_p$, and the dominant uncertainty was found to stem from the scatter in the particle diameter. The 95 % confidence uncertainty on $We_p$ ranged from $\pm$5 % to $\pm$19 %, depending on the particles used (see table 1). For convenience, the maximum 95 % confidence uncertainty is plotted at low and high $We_p$ in figures 4(j) and 6(e), near the axes. Each marker in these figures represents one impact event.
3. Results
The various methods by which a rain droplet captures pollution particles depend on particle and droplet properties. The properties of common pollutants vary greatly, ranging in diameter  $d_p=10\ {\rm nm}\unicode{x2013}200\ \mathrm {\mu }{\rm m}$ (Chepil Reference Chepil1957; Shahad Reference Shahad1989; Kleeman, Schauer & Cass Reference Kleeman, Schauer and Cass1999; Sarkar et al. Reference Sarkar, Rano, Mishra and Sinha2005; Després et al. Reference Després2012; Wang et al. Reference Wang, Yuen, Chan, Chen, Yang, Cheung and Yeoh2020), density $\rho _p$ (McDonald Reference McDonald1962; Sosnoskie et al. Reference Sosnoskie, Webster, Dales, Rains, Grey and Culpepper2009; Wagner et al. Reference Wagner2009; Wang et al. Reference Wang, Tang, Mei and You2018; Bhatt et al. Reference Bhatt, Priyadarshini, Acharath Mohanakrishnan, Abri, Sattler and Techapaphawit2019), shape (see figures 1b–d) and wettability. Rain drops also vary in diameter ( $d_d \approx 0.1\unicode{x2013}6.0$ mm; Szakáll et al. Reference Szakáll, Mitra, Diehl and Borrmann2010), which determines their free fall velocity ( $U\approx 0.2\unicode{x2013}9.2\ {\rm m}\ {\rm s}^{-1}$; List Reference List1951, p. 396). Figure 3 shows the various effects of these properties on capture behaviours when natural pollution particles collide with water droplets. When a cluster of three pollen grains impacts, the droplet captures the pollen on its surface (figure 3a). But a particle of ash, being super hydrophilic (see table 1), stays on the surface only momentarily before the droplet pulls it inside (figure 3b). A grain of desert dust pushes to the droplet interior while forming a small air cavity (figure 3c). To investigate the effects of pollution properties more fully, we use model spherical particles that permit greater control but exhibit similar behaviours to natural pollutants, as seen by comparing figures 3(c,d). Previous studies show that particle shape and surface roughness affect the particle behaviour (Voth & Soldati Reference Voth and Soldati2017) and water impact dynamics (Truscott, Epps & Belden Reference Truscott, Epps and Belden2014; Mathai, Govardhan & Arakeri Reference Mathai, Govardhan and Arakeri2015). Although we use smooth spherical particles in this study for simplicity, we expect variations in the shape to change the effective particle size and density, and variations in the particle roughness to alter its effective wetting properties (Zhao, Chen & Wang Reference Zhao, Chen and Wang2014). We leave further study of the effects of particle shape and roughness for future studies. We use three main dimensionless parameters to describe particulate capture by rain: the particle Weber number $We_p=\rho _p d_p U^2/\sigma$, which is the ratio of particle inertia to droplet surface tension $\sigma$; the radial impact location (in cylindrical coordinates; see figure 2) normalized by the droplet radius $R_i/R_d$; and the particle wetting angle $\theta$, which delineates between hydrophilic ( $\theta <90^{\circ }$) and hydrophobic ( $\theta >90^{\circ }$) particles. These dimensionless parameters are similar to those used to describe millimetric-sized objects entering a pool of water (Aristoff & Bush Reference Aristoff and Bush2009; Speirs et al. Reference Speirs, Mansoor, Belden and Truscott2019b), wherein the liquid Weber number (using liquid density $\rho _l$), Bond number ( $Bo=\rho _l g d_p^2/\sigma$) and wetting angle are used. In the case of particles impacting droplets, $Bo$ is sufficiently low that surface tension always dominates gravity, and the minor changes in this parameter are of negligible importance. The parameter $R_i/R_d$ is more useful as it describes both the impact angle $\alpha$ and the local droplet thickness.

Figure 3. Rain droplets capture natural air pollutants in various ways. (a) A cluster of three sunflower pollen grains is captured on the surface ( $d_p =35\ \mathrm {\mu }{\rm m}$ and $U=7.67\ {\rm m}\ {\rm s}^{-1}$). (b) A particle of wood ash impacts and then surface tension pulls it inside ( $d_p = 53\ \mathrm {\mu }{\rm m}$, $U=4.44\ {\rm m}\ {\rm s}^{-1}$ and $\theta <10^{\circ }$). (c) A particle of desert dust creates a small cavity as it enters ( $d_p = 85\ \mathrm {\mu }{\rm m}$ and $U= 4.77\ {\rm m} {\rm s}^{-1}$). (d) A model particle creates a small cavity as it enters, similar to the dust particle in (c) ( $d_p = 82\ \mathrm {\mu }{\rm m}$, $\theta =144^{\circ }$ and $U= 6.17\ {\rm m}\ {\rm s}^{-1}$). Green arrows indicate the direction of particle motion. Time $t=0$ occurs at impact. The scale bar is $100\ \mathrm {\mu }{\rm m}$ for each case. Supplementary movie 1 (available at https://doi.org/10.1017/jfm.2023.101) shows full videos for (a–d).
3.1. Hydrophilic particles
Impacts between hydrophilic particles and rain droplets exhibit the capture behaviours shown in figures 4(a–i), which roughly separate into impacts near the droplet centre ( $R_i/R_d\lesssim 0.8$) and impacts near the edge ( $R_i/R_d\gtrsim 0.8$), and are mapped out in the regime plot in figure 4(j). We look at central impacts first. When a hydrophilic particle with low inertia, i.e. low $We_p$, impacts near the droplet centre, it forms a small depression and ripple on the droplet and becomes trapped on the droplet surface (figure 4a). The droplet holds the particle on the surface such that the angle between the wetted particle surface and droplet interface equals $\theta$ (see figures 1h–l). We call this behaviour surface capture, and it is the same behaviour seen for the pollen grains in figure 3(a).

Figure 4. Hydrophilic particle–droplet impact behaviours. The various impact behaviours include: (a) surface capture ( $We_p=6$, $R_i/R_d=0.03$), (b) quasi-static seal entry ( $We_p=77$, $R_i/R_d=0.47$), (c) shallow-seal entry and escape ( $We_p=631$, $R_i/R_d=0.38$), (d) surface-seal entry and escape ( $We_p=1137$, $R_i/R_d=0.16$), (e) surface skid ( $We_p=14$, $R_i/R_d=0.92$), (f) skid entry ( $We_p=56$, $R_i/R_d=0.82$), (g) skid entry and escape ( $We_p=150$, $R_i/R_d=0.91$), (h) surface skid and escape ( $We_p=132$, $R_i/R_d=0.99$) and (i) capillary pull in ( $We_p=0.44$, $R_i/R_d=0.84$, $\theta \lesssim 10^{\circ }$). Green and blue arrows indicate particle velocity direction before and after the frame, respectively. Supplementary movies 2–5 show full videos for each image. All scale bars are $100\ \mathrm {\mu }{\rm m}$. (j) Plotting $We_p$ versus $R_i/R_d$ maps out the impact behaviours shown by the symbol shapes in (a–i) and figure 6(b). Symbol size increases with $\rho _p/\rho _l$. Symbol colour indicates the post-impact behaviour: green tones indicate capture on the droplet surface, red tones indicate capture inside the droplet, and black indicates escape. The dotted lines plot the bounding curves of (3.1) with $k_1=0.7$ and $\theta _d=135^{\circ }$ (the slope discontinuities stem from interpolating empirical $C_D$ values from May (Reference May1975); see Appendix A). The solid line plots (3.2) with $k_2 = 0.25$, and the dashed line plots (3.3) with $k_3 = 0.2$. The light blue bars on the right indicate approximate $We_p$ ranges of some common pollutants, which extend below the lower plot limit.
With enough inertia, the particle enters the droplet, overcoming the surface tension  $F_{\sigma } = -{\rm \pi} d_p \sigma \cos \theta _d$, drag $F_D = ({{\rm \pi} }/{8})C_D \rho _l d_p^2 U^2$ and lift forces $F_L = ({{\rm \pi} }/{8})C_L \rho _l d_p^2 U^2$, where $\theta _d \approx 135^{\circ }$ is the dynamic contact angle, $C_D$ and $C_L$ are the drag and lift coefficients (May Reference May1975) and $\rho _l$ is the liquid density. Summing these forces in the droplet local normal direction $\boldsymbol {n}$ (as shown in the free body diagram in figure 5(b), with kinematic relations shown in figure 5(a)), and equating them to the particle mass $m_p$, times the required acceleration to prohibit entry $a_{\boldsymbol {n}} = k_1U^2\sin \alpha /d_p$ (where $\sum F_{\boldsymbol {n}} = m_p a_{\boldsymbol {n}}$) yields the following entry transition after rearranging and substituting $\cos \alpha = R_i/R_d$ and $\sin \alpha = (1-(R_i/R_d)^2)^{1/2}$ (these substitutions assume a spherical drop):
 \begin{equation} We_p = \frac{-24\cos\theta_d\,f\left(\dfrac{R_i}{R_d}\right)}{\left[ 4k_1 - 3C_D\,\dfrac{\rho_l}{\rho_p} \right] \left[ 1-\left(\dfrac{R_i}{R_d} \right)^2 \right]^{{1}/{2}} - 3C_L\,\dfrac{\rho_l}{\rho_p}\, \dfrac{R_i}{R_d} }. \end{equation}
The constant  $k_1=0.7$ accounts for the scaling of the travel distance and the sphere deceleration. The function $f(R_i/R_d)$ describes the direction of the resultant surface tension force, which is a complicated function of the droplet deformation. This direction can be bounded to lie between the $-\boldsymbol {U}$ direction and the $\boldsymbol {n}$ direction (sketched in figure 5b), which results in the two bounding curves for the true transition line between the surface capture and internal capture regimes. The dotted lines in figure 4(j) plot the bounds of (3.1), which divide the surface capture (green symbols) and internal capture regimes (red symbols) quite well. See Appendix A for additional mathematical details on the derivation of (3.1).

Figure 5. Sketches showing two-dimensional slices of the droplet and particle to indicate relevant geometry, velocities and forces for modelling impact behaviours. (a) The moment of particle–droplet impact, with definitions of the impact radius  $R_i$, droplet radius $R_d$, impact angle $\alpha$, local droplet normal $\boldsymbol {n}$ and tangent $\boldsymbol {t}$ directions, and local droplet thickness $2h$. (b) A free body diagram for the surface-capture-to-entry transition model, indicating the surface tension $F_{\sigma }$, drag $F_D$ and lift $F_L$ forces, and the dynamic contact angle $\theta _d$. The direction of $F_{\sigma }$ lies between the $-\boldsymbol {U}$ and $\boldsymbol {n}$ directions, and summing the forces with these two extremes bounds the surface-capture-to-entry transition. (c) A free body diagram for the escape model, indicating the dominant forces of surface tension $F_{\sigma }$ and drag $F_D$. (d) The bow wave velocity $c$ and impact velocity $U$ with their respective directions for the wave model.
Hydrophilic particles entering droplets form three cavity types that also form for millimetric spheres entering a pool (Aristoff & Bush Reference Aristoff and Bush2009). At the lowest entry  $We_p$, quasi-static seal (Aristoff & Bush Reference Aristoff and Bush2009) cavities form, which look like a quasi-static meniscus moving along the particle surface until it meets itself at the rear (figure 4b). At $We_p \gtrsim 200\unicode{x2013}700$ (depending on $\rho _p/\rho _l$, figure 4j), the particle forms a larger air cavity that pinches off near the droplet surface in a shallow seal (Aristoff & Bush Reference Aristoff and Bush2009; figure 4c). These cavities entrain an air bubble in the droplet that is at least the volume of the particle and either remains attached to the particle (especially for hydrophobic particles, as shown in figure 3d) or detaches to move freely in the droplet. At even higher $We_p$, particles experience surface seal (Aristoff & Bush Reference Aristoff and Bush2009), where the impact ejects a thin circumferential water film or splash crown that collapses inwards (see supplementary movie 3, clip 1) and closes the air cavity at the surface (figure 4d). Particles that enter with any seal type can remain in the droplet or push out of the back and escape. Droplets prevent escape when the surface tension $F_{\sigma } = {\rm \pi}d_p \sigma$ and drag $F_D = ({{\rm \pi} }/{8})C_D \rho _l d_p^2 U^2$ forces (for $C_D$, see Hoerner Reference Hoerner1965; Vakarelski et al. Reference Vakarelski, Klaseboer, Jetly, Mansoor, Aguirre-Pablo, Chan and Thoroddsen2017) decelerate particles to a stop before they traverse the local droplet thickness $2h= 2(R_d^2 - R_i^2)^{1/2}$ and exit through the back interface (see figures 5a,c). Summing these forces in the $\boldsymbol {U}$ direction and equating them to $m_p$ times the required acceleration to prevent escape, $a_{\boldsymbol {U}} = k_2U^2/2h$ ( $\sum F_{\boldsymbol {U}} = m_p a_{\boldsymbol {U}}$), yields the escape criterion
 \begin{equation} We_p = \frac{24 \left[ 1 - \left(\dfrac{R_i}{R_d} \right)^2 \right]^{{1}/{2}} }{4k_2 \left( \dfrac{d_p}{d_d} \right) - 3C_D \left( \dfrac{\rho_l}{\rho_p} \right) \left[ 1 - \left(\dfrac{R_i}{R_d} \right)^2 \right]^{{1}/{2}} }, \end{equation}
where the constant  $k_2=0.25$ accounts for the sphere deceleration and the scaling of the travel distance caused by the stretching of the back interface (see Appendix B for additional mathematical details). The solid line in figure 4(j) plots (3.2), which divides the particles captured internally (red symbols) and the ones that escape (black symbols). Equation (3.2) also reveals that rain droplets with larger diameters $d_d=2R_d$ can retain particles with larger inertia. Yet, as rain droplet diameter increases above 1 mm, droplets oscillate around an increasingly more oblate shape (Szakáll et al. Reference Szakáll, Mitra, Diehl and Borrmann2010). This decreases the local thickness of the droplet that a particle has to pass through to escape ( $2h$), and should allow particles to escape at lower $We_p$ values than predicted by (3.2), which assumes a spherical droplet. Hence for the largest rain droplet sizes, this model may need to be adjusted to account for the flattening of the drop. Equation (3.2) also shows that as $\rho _p/\rho _l$ increases, the escape $We_p$ decreases, which can be seen in the experimental data as indicated by the symbol size in figure 4(j). For cases in which the particle does exit the drop, the air cavity formed at entry remains inside, and a liquid filament connects the escaping particle to the droplet (figure 4d), which breaks up into smaller droplets as the particle pulls away (see supplementary movie 3, clip 1).
Droplet capture behaviours change once again when particles impact near the edge ( $R_i/R_d \gtrsim 0.8$). At the lowest $We_p$, when the outer edge of the particle extends beyond the edge of the droplet, the particle skids up the side and remains on the surface, which we call surface skid (figure 4e). The impact forms a bow wave that moves away from the particle at velocity $c=\sqrt {2{\rm \pi} \sigma /\lambda \rho _l}$ (de Gennes, Brochard-Wyart & Quéré Reference de Gennes, Brochard-Wyart and Quéré2004, p. 135), where $\lambda = k_3 d_p$ is the wavelength, assumed to scale with the particle diameter. When the component of the particle velocity in the droplet tangent direction $\boldsymbol {t}$ exceeds the wave velocity ( $U_{\boldsymbol {t}}>c$, see figure 5d), the wave passes over the particle and pulls it inside the drop, i.e. skid entry, as shown in figure 4(f). Equating these velocities ( $U \cos \alpha =\sqrt {2{\rm \pi} \sigma /k_3 d_p \rho _l}$) and rearranging yields the entry transition at the droplet edge,
 \begin{equation} We_p = \frac{2{\rm \pi}}{k_3}\,\frac{\rho_p}{\rho_l} \left( \frac{R_d}{R_i} \right)^2, \end{equation}
which we plot with the dashed line in figure 4(j) for  $k_3 = 0.2$, and find that it divides the surface skid and skid entry data well (see Appendix C for additional mathematical details). As $R_i/R_d\rightarrow 1$, particles stick out too far for the limited wave height to pass over the particle and hence do not enter even when $U_{\boldsymbol {t}}>c$.
Whether a particle experiences surface skid or skid entry, it can either remain captured by the droplet or escape. Equation (3.2) also predicts the escape transition near the edge and fits the data there well (figure 4j). Particles that enter first escape with a coating of water, but ones that do not enter only remove a small drop as shown in figures 4(g) and 4(h), and supplementary movie 4. In both cases, surface tension turns the particle trajectory towards the droplet centre as it escapes.
3.2. Hydrophobic particles
Hydrophobic particles exhibit many of the same behaviours as hydrophilic particles, but the change in  $\theta$ shifts regime boundaries and introduces new behaviours as shown in figure 6. Particles impacting in the droplet centre transition from surface capture to entry at a larger $We_p$ (dotted lines in figure 6(e) have shifted up from figure 4j). This occurs because $\theta _d$ increases with $\theta$ (compare supplementary movie 2, clip 2 and movie 5, clip 2), which increases the resultant surface tension force, thus requiring more inertia for the particle to enter the drop (3.1). The larger $\theta$ does not appear to affect the escape transition (3.2), which is plotted the same for both hydrophilic and hydrophobic particles in figures 4(j) and 6(e) (solid line).

Figure 6. Hydrophobic particle–droplet impact behaviours include many of the same behaviours as hydrophilic particles, but also include: (a) deep-seal entry ( $We_p=284$, $R_i/R_d= 0.12$), (b) enter escape ( $We_p=396$, $R_i/R_d= 0.13$), (c) ricochet ( $We_p=42$, $R_i/R_d= 0.93$) and (d) rebound ( $We_p=29$, $R_i/R_d= 0.47$). Green and blue arrows indicate particle velocity before and after the frame, respectively. Supplementary movies 6 and 7 show full videos for each image. The scale bar in each frame is $100\ \mathrm {\mu }{\rm m}$. (e) A plot of $We_p$ and $R_i/R_d$ maps out the various impact behaviours with some changes compared to hydrophilic particles (compare to figure 4j). The dotted lines plot the bounds of (3.1) with $k_1=0.7$ and $\theta _d=180^{\circ }$ (slope discontinuities stem from interpolating empirical $C_D$ values from May Reference May1975), and the solid line plots (3.2) with $k_2 = 0.25$ (same as figure 4j). Symbol shape indicates the impact type shown by the images in (a–d) and figure 4, and symbol size increases with $\rho _p/\rho _l$. Symbol colour indicates the post-impact behaviour as described in figure 4.
Upon entry, hydrophobic particles form larger-diameter cavities that entrain more air. This induces shallow seal to occur at lower  $We_p \approx 100$ and a fourth cavity type called deep seal (Aristoff & Bush Reference Aristoff and Bush2009), shown in figure 6(a), to appear at $We_p \approx 250$ (figure 6e). For millimetric spheres entering liquid pools, hydrostatic pressure causes deep seal, but in this study, hydrostatic pressure is negligible and a combination of surface tension and particle deceleration causes the deep seals. As the particle enters, the low $\rho _p/\rho _l$ decelerates the particle faster (Aristoff et al. Reference Aristoff, Truscott, Techet and Bush2010), creating a decreasing cavity diameter with increasing penetration (Speirs et al. Reference Speirs, Mansoor, Belden and Truscott2019b). Surface tension closes the smaller cavity diameter near the particle faster than it closes the larger cavity diameter near the droplet surface leading to a deep seal. The deep seals seen in this study typically occur between the cavity midpoint and the particle, and are often followed by a shallow seal (see supplementary movie 6, clip 1). The larger cavity diameter formed by hydrophobic particles increases even more as
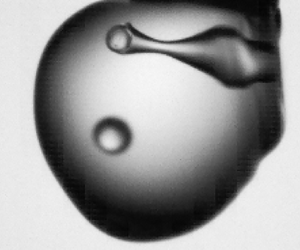
  $We_p$ increases. This results in cavity diameters so large that no pinch-off type has time to close the cavity before the particle escapes. These enter escape impacts leave a large hole in the droplet, as shown in figure 6(b), which is similar to the cavities formed by a microfluidic jet impacting a droplet (Quetzeri-Santiago et al. Reference Quetzeri-Santiago, Hunter, van der Meer and Rivas2021). These cavities can be so large that their volume is comparable to that of the droplet, implying that droplet size likely alters the cavity dynamics for very large $We_p$. This enter escape behaviour also occurs for hydrophilic particles, but not until higher $We_p$ (see figure 4(j), $We_p > 1000$, and supplementary movie 2, clip 3).
Capture behaviour for hydrophobic particles also differs from hydrophilic particles when particles impact near the droplet edge. When hydrophobic particles impact in the range  $0.8 \lesssim R_i/R_d \lesssim 0.9$ and their outer edge extends slightly beyond the droplet edge, they experience surface skid, skid entry, and skid entry and escape, similar to hydrophilic particles (figure 6e). Yet when $R_i/R_d \gtrsim 0.9$, particles extend beyond the edge of the droplet further, and the bow wave formed at impact does not have enough inertia to pass over the particle and cause entry by itself. Unlike hydrophilic particles, capillary forces do not assist the bow wave in passing over a hydrophobic particle, which causes the wave entry transition, (3.3), to no longer apply for $R_i/R_d \gtrsim 0.9$. Instead, the distorted droplet surface acts like a spring that pushes a hydrophobic particle impacting with any $We_p$ away from the droplet, causing them to ricochet from the droplet surface like stones skipping on a lake (Clanet, Hersen & Bocquet Reference Clanet, Hersen and Bocquet2004; Belden et al. Reference Belden, Hurd, Jandron, Bower and Truscott2016), as seen in figure 6(c). Notice that (3.1) also divides the ricochet impacts from the entry impacts when extended further to the right (dotted lines in figure 6e), which is warranted due to the lack of the wave entry transition.
3.3. Wetting extremes and other behaviours
As  $\theta \rightarrow 0^{\circ }$ or $\theta \rightarrow 180^{\circ }$, the surface capture regime does not exist even at low $We_p$ (below the entry transitions, (3.1) and (3.3)). As $\theta \rightarrow 0^{\circ }$, particles stay on the surface only momentarily. Upon impact, such particles do not enter because their inertia cannot overcome the hydrodynamic forces and outward surface tension force caused by the large $\theta _d$ during droplet deformation. After the initial high deformation stage, the super hydrophilic particle is unstable, poking out of the droplet surface, and capillary forces pull it into the droplet interior (figure 4i). We call this behaviour capillary pull in, and it is the same behaviour seen for the ash particle in figure 3(b). Conversely, as $\theta \rightarrow 180^{\circ }$, it becomes more difficult for particles to stick to droplets. Upon impact, the particle depresses the interface, but lacking sufficient inertia to enter, the surface recoils and launches the particle back into the air as shown in figure 6(d). This behaviour also occurs for hydrophobic particles impacting pools, and is called rebound (Lee & Kim Reference Lee and Kim2008; Galeano-Rios et al. Reference Galeano-Rios, Cimpeanu, Bauman, MacEwen, Milewski and Harris2021). There is a gradual transition between rebound and ricochet. We delineate between the two by the absolute value of angle between the incoming and outgoing particle velocity vectors $\beta$ (placed tip to tail): when $|\beta | < 90^{\circ }$, it is a rebound; when $|\beta |>90^{\circ }$, it is a ricochet. Even after a hydrophobic particle enters a droplet and decelerates to a near stop, it can still escape. If the particle presses against the droplet surface for long enough, the water film between itself and the interface drains, the particle de-wets, and surface tension grabs the particle and flings it out of the droplet as seen in figure 7(a). This is similar to the resurrection phenomenon seen in pool impacts (Galeano-Rios et al. Reference Galeano-Rios, Cimpeanu, Bauman, MacEwen, Milewski and Harris2021). Alternatively, if a captured particle is attached to an internal bubble (which formed at the droplet entry event), then this bubble can contact the droplet surface as shown in figure 7(b) at $t=0$. The contact opens a crater in the droplet, which collapses, forming a Worthington jet ( $t=100\ \mathrm {\mu }{\rm m}$), and allowing the particle to pop out on the droplet surface ( $t=250\ \mathrm {\mu }{\rm m}$), like a partial resurrection.

Figure 7. Previously captured particles can escape, and impact with previously captured particles changes expected behaviour. (a) A hydrophobic particle captured inside a droplet contacts the droplet interface and de-wets, which causes surface tension to fling it out of the droplet. (b) A hydrophobic particle captured inside the droplet has a bubble attached (indicated by the red arrow at  $t=0\ \mathrm {\mu }{\rm s}$). The bubble contacts the droplet interface and forms a cavity that collapses, allowing the particle to emerge onto the droplet surface. (c) A hydrophilic particle with $We_p=30$ impacts another particle captured on the droplet surface at $R_i/R_d = 0.93$. The particle collision causes the impacting particle to ricochet away and the surface particle to enter (red arrows). If the surface particle were not present, then the impacting particle should have skid up the side of the droplet and possibly entered by a wave (see figure 4j). (d) A hydrophilic particle with $We_p=40$ impacts another particle resting just inside the droplet surface at $R_i/R_d = 0.25$. The collision both wets the impacting particle and decelerates it such that surface tension holds the particle on the surface, but it no longer has enough inertia to enter with the expected quasi-static seal that should have occurred if the interior particle was not present. All scale bars are $100\ \mathrm {\mu }{\rm m}$. See supplementary movies 8 and 9 for full videos of (a–d).
With time, particles accumulate inside and on droplets, and incoming particles collide with previously captured particles. Such impacts complicate capture behaviours and cause regime changes, such as forcing particles to ricochet or be captured on the surface instead of entering as shown in figures 7(c) and 7(d).
4. Conclusion
We see that rain droplets capture pollution particles using many of the same mechanisms seen for much larger bodies impacting on pools of water (Clanet et al. Reference Clanet, Hersen and Bocquet2004; Lee & Kim Reference Lee and Kim2008; Aristoff & Bush Reference Aristoff and Bush2009). Impacting particles are captured on droplet surfaces, skid on the surface, enter by capillary forces or waves, enter with various cavity types (quasi-static, shallow, deep and surface seals), rebound or ricochet off, and pass through the droplet, escaping out of the back. Droplet surface tension and free fall velocity, in addition to particle impact location, size, density and wettability, determine which capture or escape behaviours occur. These findings reveal that the previously discussed collision efficiency of a rain droplet with airborne particulate matter (McDonald Reference McDonald1962, Reference McDonald1963; Michael & Norey Reference Michael and Norey1969; Moore et al. Reference Moore, Hanlon, Powers, Schmale and Christner2020) does not equal its true collection efficiency as some particulates escape, and that rain collects some types of particulate matter more easily than others. Hence atmospheric models must take particulate matter properties into account to accurately model particulate fluxes through the environment. By understanding the cleansing power of rain, scientists and engineers can design more innovative and efficient filtration systems to protect the environment and our societies from the damaging effects of air pollution. The beauty of rain-cleaned skies is only enhanced as we understand the beautiful microscopic capture events that create them.
Supplementary movies
Supplementary movies are available at https://doi.org/10.1017/jfm.2023.101.
Acknowledgements
The authors thank M. Morris for collecting dust samples from the Sonoran Desert, and A. Speirs for collecting pollen samples.
Funding
This work was supported by the Naval Undersea Warfare Center In-House Laboratory Independent Research managed by Dr T. Ruffa, and by the Office of Naval Research, Navy Undersea Research Program monitored by Ms M. Medeiros (N.B.S., grant no. N0001422WX01353).
Declaration of interests
The authors report no conflict of interest.
Author contributions
N.B.S. conceived the research. N.B.S. and J.L.B. designed the experiments. N.B.S. took and analysed the data. All authors developed the theoretical modelling. N.B.S. wrote the paper, and all authors edited the paper.
Appendix A. Mathematical details of the surface-capture-to-entry transition
We model the transition from surface capture to quasi-static seal entry by summing the forces on the particle in the droplet local normal direction  $\boldsymbol {n}$ and equating the sum to the particle mass $m_p$ times the required acceleration to prohibit entry $a$ in the $\boldsymbol {n}$ direction (see figures 5(a) and 5(b) for a sketch of the kinematics and a free body diagram). The forces on the particle include surface tension $F_{\sigma }$, drag $F_D$ and lift $F_L$.
The time-averaged resultant surface tension force can be calculated as  $F_{\sigma } = -{\rm \pi} d_p \sigma \cos \theta _d$, where $\theta _d$ is the time-averaged dynamic contact angle. High-speed videos show that the solid–liquid–air contact line on a particle entering with a quasi-static seal cavity lies near the particle equator for the initial stage of entry, before the contact line moves around to the back of the particle, sealing the cavity and ending the entry process. The dynamic wetting angle during the initial stage of entry can be approximated as $\theta _d \approx 135^{\circ }$ for hydrophilic particles and $\theta _d \approx 180^{\circ }$ for hydrophobic particles (see supplementary movie 2, clip 2 and movie 5, clip 2, respectively). We use these values for calculations, because once the contact line begins to move to the back of the droplet, quasi-static seal is likely to occur. The shape of the deformation in the droplet interface determines the direction of $F_{\sigma }$. This deformation is a complicated function of many variables, but at the higher impact speeds for which we see shallow seals, the trailing cavity causes $F_{\sigma }$ to point in the $-\boldsymbol {U}$ direction (figure 4c), whereas at lower impact speeds, the droplet deformation is diminished and $F_{\sigma }$ points closer to the $\boldsymbol {n}$ direction. Hence we can bound the direction of $F_{\sigma }$ to lie between the $-\boldsymbol {U}$ and $\boldsymbol {n}$ directions, as sketched in figure 5(b).
The average drag force can be calculated as  $F_D = ({{\rm \pi} }/{8})C_D \rho _l d_p^2 U^2$. May (Reference May1975, figure 4-14) reports drag coefficients as a function of sphere submergence depth for spheres impacting a pool at impact angles in $10^{\circ }$ increments from $10^{\circ }$ to $90^{\circ }$. We calculate the average $C_D$ from these curves, assume that $C_D(\alpha =0)=0$, and interpolate to obtain average drag coefficients for impact angles in the range $\alpha = 0^{\circ }\unicode{x2013}90^{\circ }$. This empirical nature of $C_D$ results in discontinuities in the slope of the surface-capture-to-entry transition, which we see by the slight jaggedness in the dotted lines in figures 4(j) and 6(e).
The average lift force can be calculated as  $F_L = ({{\rm \pi} }/{8})C_L \rho _l d_p^2 U^2$. Values for the coefficient of lift $C_L$ during the initial entry stage of oblique impacts do not appear to be readily available in the literature. Consequently, we assume that the total hydrodynamic force acts in the $\boldsymbol {n}$ direction and equals the vector sum of $F_D$ and $F_L$. This results in $C_L = C_D/\tan \alpha$.
The required acceleration to prohibit entry can be described as follows. The velocity of the particle in the  $\boldsymbol {n}$ direction must decrease to zero in the time it takes the particle to travel over a distance that scales with its diameter; $a_{\boldsymbol {n}} = k_1(U\sin \alpha - 0)/(d_p/U) = k_1U^2\sin \alpha /d_p$, where $k_1$ is a constant that accounts for the scaling of the travel distance and the sphere deceleration. The particle mass is $m_p = \frac {1}{6} {\rm \pi}d_p^3 \rho _p$.
The force and acceleration balance  $\sum F_{\boldsymbol {n}} = m_p a_{\boldsymbol {n}}$, with $F_{\sigma }$ in the $\boldsymbol {n}$ direction, is
 \begin{equation} F_{\sigma} + F_D\sin\alpha + F_L\cos\alpha = m_p a_{\boldsymbol{n}}. \end{equation}
Plugging in the forces,  $m_p$ and $a_{\boldsymbol {n}}$, and cancelling out common terms, yields
 \begin{equation} -\sigma \cos\theta_d + \tfrac{1}{8}C_D \rho_l d_p U^2\sin\alpha + \tfrac{1}{8}C_L \rho_l d_p U^2\cos\alpha = \tfrac{1}{6}k_1 \rho_p d_p U^2 \sin\alpha. \end{equation}
Rearranging yields
 \begin{equation} -\cos\theta_d = \frac{\rho_p d_p U^2}{\sigma} \left[ \left( \frac{k_1}{6} - \frac{C_D}{8}\,\frac{\rho_l}{\rho_p} \right) \sin\alpha - \frac{C_L}{8}\, \frac{\rho_l}{\rho_p} \cos\alpha \right]. \end{equation}
Substituting  $\cos \alpha = R_i/R_d$ and $\sin \alpha = (1-(R_i/R_d)^2)^{1/2}$, and solving for $We_p$, gives the upper bound of the surface-capture-to-entry transition
 \begin{equation} We_p = \frac{-24\cos\theta_d}{\left[ 4k_1 - 3C_D \left( \dfrac{\rho_l}{\rho_p} \right) \right] \left[ 1-\left(\dfrac{R_i}{R_d} \right)^2 \right]^{{1}/{2}} - 3C_L \left( \dfrac{\rho_l}{\rho_p} \right) \left( \dfrac{R_i}{R_d} \right) }, \end{equation}
when  $F_{\sigma }$ acts in the $\boldsymbol {n}$ direction. If $F_{\sigma }$ acts in the $-\boldsymbol {U}$ direction, then the $F_{\sigma }$ term in (A1) is multiplied by $\sin \alpha$, which results in the lower bound of the surface-capture-to-entry transition
 \begin{equation} We_p = \frac{-24\cos\theta_d \left[ 1-\left(\dfrac{R_i}{R_d} \right)^2 \right]^{{1}/{2}} }{\left[ 4k_1 - 3C_D \left( \dfrac{\rho_l}{\rho_p} \right) \right] \left[ 1-\left(\dfrac{R_i}{R_d} \right)^2 \right]^{{1}/{2}} - 3C_L \left( \dfrac{\rho_l}{\rho_p} \right) \left( \dfrac{R_i}{R_d} \right) }. \end{equation}
Note that the only difference between (A4) and (A5) is the  $[1-(R_i/R_d)^2)]^{1/2}$ term in the numerator. These two equations can be combined by replacing this term with $f(R_i/R_d)$, where $f(R_i/R_d) = 1$ when $F_\sigma$ acts in the $\boldsymbol {n}$ direction, and $f(R_i/R_d) = [1-(R_i/R_d)^2)]^{1/2}$ when $F_\sigma$ acts in the $-\boldsymbol {U}$ direction, as seen in (3.1). Note that (A4) and (A5) act as bounding equations, and the true transition should lie between them. Using the value $\rho _p/\rho _l = 1$, which is the median value for the data around the transition, we find that (A4) and (A5) fit the transition from surface capture to quasi-static seal for both hydrophilic and hydrophobic particles when $k_1 \approx 0.7$, as plotted in figures 4(j) and 6(e) by the dotted lines.
Appendix B. Mathematical details of the escape transition
We model the transition from capture in the droplet to escape out of the back of the droplet by summing the forces on the particle in the travel direction  $\boldsymbol {U}$ and equating the sum to the particle mass $m_p$ times the required acceleration to prohibit escape $a_{\boldsymbol {U}}$. The forces on the particle include surface tension $F_{\sigma }$ and drag $F_D$ (figure 5(c) sketches a free body diagram).
The surface tension force stems from the trailing cavity attached to the droplet surface, the cavity after pinch-off, and/or the stretching of the back surface as the particle pushes it outwards. For each of these scenarios, the relevant length scale on which the surface tension acts is approximately the particle circumference  ${\rm \pi} d_p$, and the direction of the force directly opposes the direction of travel regardless of $\theta$, as seen in figures 4(c,d) and 6(a,b). We approximate the average resultant surface tension force as $F_{\sigma } = {\rm \pi}d_p \sigma$, and assume that it acts the whole time the particle is in the droplet.
The drag force on a sphere entering the water is high at first impact, but quickly drops (Truscott, Epps & Techet Reference Truscott, Epps and Techet2012; Speirs et al. Reference Speirs, Belden, Pan, Holekamp, Badlissi, Jones and Truscott2019a) and eventually reaches a very low value caused by the streamlined shape the cavity forms after pinch-off (Vakarelski et al. Reference Vakarelski, Klaseboer, Jetly, Mansoor, Aguirre-Pablo, Chan and Thoroddsen2017). Integration of the pressure over the front half of a submerged sphere reveals a forebody drag coefficient  $C_D = 0.01$ (Hoerner Reference Hoerner1965, pp. 3–12), and for a streamlined cavity $C_D = 0.02\unicode{x2013}0.03$ (Vakarelski et al. Reference Vakarelski, Klaseboer, Jetly, Mansoor, Aguirre-Pablo, Chan and Thoroddsen2017). Hence we assume that $C_D \approx 0.03$ as the particle passes through the droplet, and calculate the drag force as $F_D = ({{\rm \pi} }/{8})C_D \rho _l d_p^2 U^2$.
The required acceleration to prohibit escape can be described as follows. The velocity of the particle must decrease to zero in the time it takes the particle to travel over a distance that scales with the droplet's local thickness  $2h$, as shown in figure 5(a); $a_{\boldsymbol {U}} = k_2(U - 0)/(2h/U) = k_2U^2/2h$, where $k_2$ is a constant that accounts for the sphere deceleration and the scaling of the travel distance caused by the stretching of the back interface. The particle mass is $m_p = \frac {1}{6} {\rm \pi}d_p^3 \rho _p$.
The force and acceleration balance is
 \begin{equation} F_{\sigma} + F_D = m_p a_{\boldsymbol{U}}. \end{equation}
Plugging in  $F_{\sigma }$, $F_D$, $m_p$ and $a_{\boldsymbol {U}}$, and cancelling out common terms, yields
 \begin{equation} \sigma + \frac{1}{8}\,C_D \rho_l d_p U^2 = \frac{k_2}{12h}\,\rho_p d_p^2 U^2. \end{equation}
Rearranging and substituting  $h = (R_d^2 - R_i^2)^{1/2}$ yields
 \begin{equation} \sigma = \frac{k_2}{12}\,\frac{\rho_p d_p^2 U^2}{ ( R_d^2 - R_i^2 )^{{1}/{2}}} - \frac{1}{8}\,C_D \rho_l d_p U^2. \end{equation}
Further rearranging and solving for  $We_p$ yields the escape transition
 \begin{equation} We_p = \frac{24 \left[ 1 - \left(\dfrac{R_i}{R_d} \right)^2 \right]^{{1}/{2}} }{4k_2 \left( \dfrac{d_p}{d_d} \right) - 3C_D \left( \dfrac{\rho_l}{\rho_p} \right) \left[ 1 - \left(\dfrac{R_i}{R_d} \right)^2 \right]^{{1}/{2}}},\end{equation}
which is the same as (3.2). Using the value  $\rho _p/\rho _l = 2.5$, which is the median value for the data around the transition, and a particle-to-droplet diameter ratio $d_p/d_d = 0.1$, which is common in the high $We_p$ range of our data, we find that (B4) fits the transition from capture on the inside of a droplet to escape when $k_2 \approx 0.25$. This is plotted by the solid lines in figures 4(j) and 6(e). If we use $\rho _p/\rho _l = 7.8$, then the calculated $We_p$ from (B4) decreases from $We_p \approx 375$ to $270$ at low $R_i/R_d$. We also see this decrease in the transitional $We_p$ in the data for the higher-density particles, as shown by the largest symbols in figure 4(j).
Appendix C. Mathematical details of the wave transition
We model the transition from surface skid to skid entry by comparing the velocities of the bow wave and particle as sketched in figure 5(d). The bow wave causes entry by passing over the particle when the component of the particle velocity in the droplet tangent direction  $\boldsymbol {t}$ exceeds the wave velocity $c$ (
$c$ ( $U_{\boldsymbol {t}}>c$). Small-amplitude waves propagate at velocity
 \begin{equation} c=\sqrt{\frac{2{\rm \pi} \sigma}{\lambda \rho_l}}, \end{equation}
where  $\lambda$ is the wavelength (de Gennes et al. Reference de Gennes, Brochard-Wyart and Quéré2004, p. 135). If we assume that $\lambda$ scales with the particle diameter and that the effect of the larger wave amplitude seen in this study can be accounted for by a scaling constant $k_3$, then $\lambda = k_3 d_p$. We equate the two velocities ( $U_{\boldsymbol {t}}=c$) as follows:
 \begin{equation} U \cos\alpha=\sqrt{\frac{2{\rm \pi} \sigma}{k_3 d_p \rho_l}}, \end{equation}
where  $\alpha$ is the impact angle. Substituting $\cos \alpha =R_i/R_d$ and rearranging yields the entry transition at the droplet edge:
 \begin{equation} We_p = \frac{2{\rm \pi}}{k_2}\,\frac{\rho_p}{\rho_l} \left( \frac{R_d}{R_i} \right)^2. \end{equation}
We plot this with the dashed line in figure 4(j) for  $k_3 = 0.2$ and $\rho _p/\rho _l=1$, which is typical for the data near the transition, and find that it divides the surface skid and skid entry data well.


 Open access