1. Introduction
When a fire occurs in a densely populated area with a high concentration of houses or office buildings, such as an urban setting, the flames may spread to nearby buildings. Interactions among multiple fires nearby are potential risks, leading to devastating mass fires or even more disastrous hazards in wildland or urban areas (Harris & McDonald Reference Harris and McDonald2022). Thus, basic knowledge and prediction regarding the interaction of multiple fires is crucial in minimising the impacts and risks of fires. From a fluid mechanics perspective, the interaction of multiple fires results from the interference of the surrounding flow field due to other nearby fires. These fires restrict the air entrainment process and then lead to a change in flame geometry and the burning rate (Chen et al. Reference Chen, Fang, Zhang, Miao, Lin, Tu and Hu2023a ). In this regard, understanding the intrinsic physics of multiple fire interactions and burning behaviour in wind-free conditions has been extensively investigated, such as investigating flame merging dynamics and flame height (Baldwin Reference Baldwin1968; Maynard, Princevac & Weise Reference Maynard, Princevac and Weise2016). Buoyant turbulent fires can be deemed sinks because of the pressure drop, drawing in and engulfing the surrounding air to sustain combustion. The drawing in the airflow of fires interacts with the other nearby fires, causing the flame to merge or converge. Trelles & Pagni (Reference Trelles and Pagni1991) reported that the horizontal fire-induced airflow was drawn towards the centroid of multiple fires in the Oakland Hills fire. Many relevant works have been comprehensively summarised in a number of review articles (Vasanth et al. Reference Vasanth, Tauseef, Abbasi and Abbasi2014; Liu et al. Reference Liu, Lei, Gao, Chen and Xie2021; Chen et al. Reference Chen, Fang, Zhang, Miao, Lin, Tu and Hu2023a ). However, in real fire scenarios, the absence of wind is considered an ideal condition, and field-based findings should account for the effects of cross-winds. Under the effect of heat and flow fields, an interaction among multiple fires becomes more complex. Several scholars have investigated the flame interaction dynamics and burning behaviours of multiple fires to clarify the multiple fire behaviours in the wind. Note that two flames under wind, the basic components of multiple fires, become the focus of research interest.
Morvan et al. (Reference Morvan, Hoffman, Rego and Mell2011) performed two- and three-dimensional wildfire simulations with two fire sources and different fuel compositions. They concluded that the results reasonably reproduced the front and trailing edge interaction. However, they also suggested that further research is needed to improve the accuracy. Rather recently, Chen et al. (Reference Chen, Hu, Kuang, Zhang, Lin and Zhong2021), Li et al. (Reference Li, Ding, Simeoni, Ji, Wan and Yu2021) and Tang et al. (Reference Tang, Deng, He and Zhang2023) experimentally studied the flame–flame interaction of tandem turbulent diffusion flames. The results indicated that flames were more likely to merge under a cross-wind inertial force. The tilt angle of the downstream flames was observed to be smaller than that of the upstream ones, a phenomenon attributed to the blockage effect caused by the upstream fire. This effect significantly alters the flow impinging on the downstream flame, making it considerably different from the free stream. Furthermore, a diffusion flame can be deemed a deformable object, which presents some features in contrast to a rigid body immersed in a fluid stream owing to the unsteady interaction between the hydrodynamics and inertia (Shelley & Zhang Reference Shelley and Zhang2011). A group of deformable bodies moving through a viscous incompressible flowing fluid is a ubiquitous issue in nature, of which the scenario of multiple flapping flags interacting with a cross-wind has been actively investigated as an archetype (Ristroph & Zhang Reference Ristroph and Zhang2008). When the incoming airflow passes around the objects, hydrodynamic forces will change the shape of these bodies (i.e. morphological characteristics). In turn, the shape-changed flexible bodies also modify the surrounding hydrodynamic forces, and these strongly coupled effects make it a challenge to understand this problem fully. Ristroph & Zhang (Reference Ristroph and Zhang2008) experimentally investigated the hydrodynamic drafting of a tandem pair of interacting flapping flags with varied gaps. They found that they undulate in a downwind flowing soap film with greater lateral amplitudes for the follower than the leader. Zhu (Reference Zhu2009) and Uddin, Huang & Sung (Reference Uddin, Huang and Sung2015) performed numerical simulations on the interaction of a pair of tandem flexible flags separated in a flowing viscous incompressible fluid at various Reynolds numbers.
Similar to a flapping flag, a diffusion flame can also be seen as a flexible hot fluid that undulates under airflow. What will happen when dual tandem fires are subjected to the cross-airflow? Inspired by the undulation phenomenon of a pair of tandem flexible, shape-changing objects in a two-dimensional plane under a cross-wind, we first explore this kind of problem for two nearby fires, a case which is commonly seen in practical fire accidents (Finney & McAllister Reference Finney and McAllister2011). This unexplored potential flame flapping that might ignite neighbouring combustibles is of great practical interest, which is very important in wildland fires or tank fires in refineries. The interaction of flame–flame in tandem arrangement in the presence of wind is a complex three-dimensional flame–flow dynamics problem. Although these data are reported for two flame geometries in the streamwise direction (Chen et al. Reference Chen, Hu, Kuang, Zhang, Lin and Zhong2021), how the two tandem diffusion flames interact in the spanwise direction remains unknown, posing a really interesting question. However, few reports on the flame interaction are as yet available in the spanwise direction.
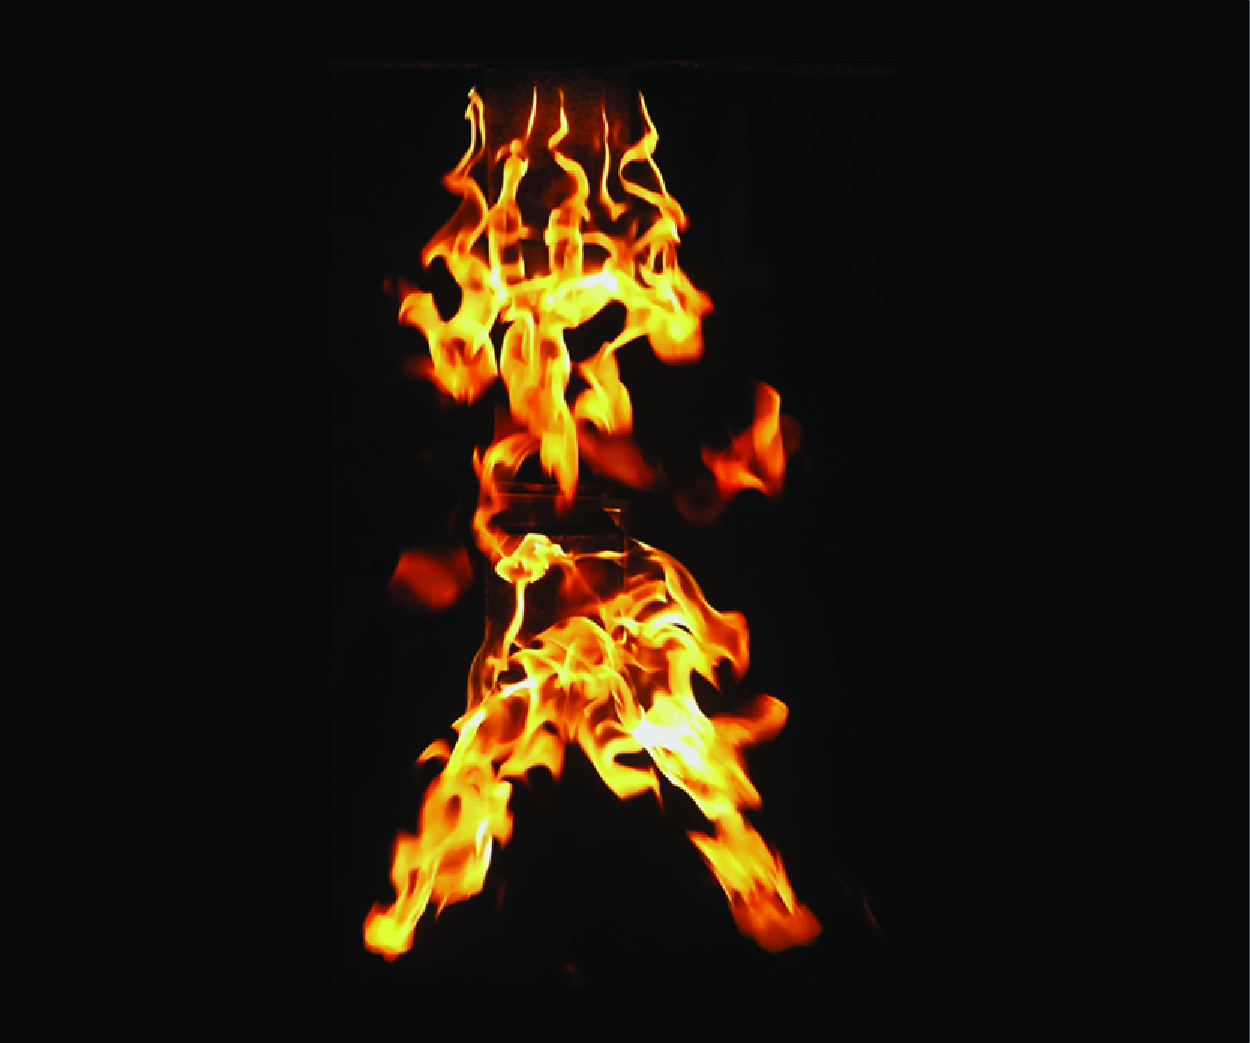
This study focused on the movement of flames seen from an overhead view, and we discovered a peculiar phenomenon induced by the movement of flames in the spanwise direction. The authors named these fire motions the oscillating mode, in which the flame oscillates from side to side as a single mass, and the bifurcating mode, in which the flame splits into two large parts. From a fire safety standpoint, the bifurcating mode indicates the possibility of flames spreading to more distant houses because flames spread to both sides. From a fluid dynamics point of view, it would be interesting to investigate why flames of such shapes appear alternately.
Three main contents were included in this study. A series of experiments was performed to investigate the flame–flame interaction and morphological characteristics in the spanwise direction, using two square gaseous burners with various heat release rates and separation distances in a wind tunnel. The flame motion phenomenon in the spanwise direction was observed, discussed and interpreted experimentally. In the second part, the flame motion was reproduced using computational fluid dynamics (CFD) simulation based on large eddy simulation (LES) to explain the mechanism of the two modes. Finally, the maximum flame width was modelled through the scaling analysis.
2. Methods
2.1. Experimental set-up
Figure 1 presents a schematic diagram of the experimental set-up. It comprises a wind tunnel, two gaseous diffusion burners, mass flow controllers and a sampling system. The dimensions of the wind tunnel are 1.5 m high and 1.3 m wide. The cross-wind generated by the wind tunnel ranges from 0 to 3.0 m s−1 with a local turbulence intensity of less than 5 %, monitored by four-probe hot-wire anemometers (accuracy:
$\pm$
0.01 m s−1) in real time. The two identical square stainless-steel gas burners included a quartz sand layer of 10 cm and a side length of 15 cm in the tandem arrangement. A 40 cm thin fireproofing panel was placed between the wind tunnel exit and the leading edge of the first burner to minimise the bluff body effect and avoid flow separation at the leading edge of the burner. The position of the first burner was fixed, and the separation distance (
$S$
) between these two burners was altered by moving the downstream burner farther away. The velocity boundary profile upstream of the first burners is measured and presented in figure 1. As fuel,
$\mathrm{C_3H_8}$
was used to sustain stable total heat release rates (
$\dot {Q}$
), controlled by fuel supply rates. Gas mass flow issuing from each burner was controlled by one mass flow controller with the accuracy of 0.1 SLPM (standard litre per minute). The heat release rate of both the upstream diffusion flame (UDF) and the downstream diffusion flame (DDF) was regulated, ranging from 17.43 to 34.86 kW. Both equal and unequal heat release rates for these two burners were considered. An overhead video camera at 25 frames per second and a resolution of
$1920\times 1080$
pixels captured the burning process in the spanwise direction. Flame maximum width (
$W$
) in the spanwise direction was determined using the intermittency distribution contour (
$I = 0.05$
) by averaging all recorded images (Chen et al. Reference Chen, Hu, Kuang, Zhang, Lin and Zhong2021). In contrast to the two-dimensional problem of two flags in a cross-wind, when two flames are close, they interact due to the pressure drop caused by air entrainment, even in still air, making the observation and investigation of this problem more complex. In order to exclude the effect of pressure thrust caused by the entrained air, we mainly focus on the mutual influences between flames that are dominated by cross-wind (
$S/D$
= 3, 4, and 5) in this work. Beyond that, because two flames will fully merge and act just like one equivalent flame, trailing fire may hinder the flapping motion of the leading fire (Chen et al. Reference Chen, Hu, Kuang, Zhang, Lin and Zhong2021). Besides, one could not tell the behaviour of each diffusion flame and their interaction under cross-wind. This study pays attention to cases when flames are not fully merging. The cases under cross-wind velocities from 1.2 to 3.0 m s−1 with separation distances (
$S/D$
) from 3 to 5 are considered in this work based on the results of preliminary tests and previous research. Seventy-five tests were conducted, including reference tests with an isolated diffusion flame (IDF). Each test was repeated at least three times, showing good repeatability for the following analysis. Error bars in the figure mean the standard deviation of the maximum flame width.

Figure 1. Schematic of the experimental set-up.
2.2. Mathematical models
This study utilises the LES-based FireFOAM solver, which is an in-house version of the authors’ group. Previous studies provided information about the modifications made regarding the examination of various fire scenarios, such as flame spread on solid fuels (Fukumoto, Wang & Wen Reference Fukumoto, Wang and Wen2018), syngas jet flames (Fukumoto, Wang & Wen Reference Fukumoto, Wang and Wen2019) and pool fires incorporating liquid fuel flows (Fukumoto et al. Reference Fukumoto, Wen, Li, Ding and Wang2020). The difference from the standard version is that diffusion coefficients can be set for each chemical species. The dynamic Smagorinsky model (Germano et al. Reference Germano, Piomelli, Moin and Cabot1991; Lilly Reference Lilly1992) for a turbulence model is available. The combustion model used is the eddy dissipation model based on the energy cascade concept for the LES (Chen et al. Reference Chen, Wen, Xu and Dembele2014), and the weighted sum of the grey gases model (Smith, Shen & Frledman Reference Smith, Shen and Frledman1982) is incorporated as a radiation model.
2.2.1. Governing equations
The FireFOAM solver solves the continuity, momentum, mass fraction of chemical species
$J$
and sensible enthalpy equations. The coupling algorithm for the momentum and continuity equations is known as pressure-implicit with splitting of operators, including the outer iteration. The algorithm is referred to as PIMPLE (a combined PISO–SIMPLE algorithm, where PISO stands for Pressure-Implicit with Splitting of Operators and SIMPLE stands for Semi-Implicit Method for Pressure-Linked Equations; implemented in OpenFOAM v2006 (2020)). For PIMPLE parameters, the number of outer iterations is 3, and the number of the pressure-corrector iterations is 3. The respective equations are as follows:
Continuity equation

Momentum equation


Mass fraction equation of gas species
$J$

Sensible enthalpy equation

where – is the time average, ∼ is the density-weighted average,
$\bar{\rho }$
is the density (kg m−
$^3$
),
$t$
is the time (s),
$u_j$
is the velocity in the
$j$
direction (m s−1),
$x_j$
is the coordinate in the
$j$
direction (m),
$\mu$
is the dynamic viscosity (Pa
$\cdot$
s),
$\mu _{\textit{SGS}}$
is the sub-grid-scale viscosity (Pa
$\cdot$
s),
$\bar{p}_{\textit{rgh}}$
is the modified pressure (Pa),
$\bar{p}$
is the static pressure (Pa),
$g_j$
is the gravitational acceleration in the
$j$
direction (m s−
$^2$
),
$\tilde { Y }_J$
is the mass fraction of chemical species
$J$
,
$Sc_{\textit{t}}$
is the turbulent Schmidt number ( = 0.85, a default value was used),
$j_{iJ}$
is the mass diffusion flux (kg (m
$^{-2}\cdot$
s−1)),
$\bar{\omega }_J$
is the reaction rate of chemical species
$J$
(kg (m−
$^3\cdot$
s−1)),
$\tilde {h}$
is the sensible enthalpy (J kg−1),
$D_{\textit{h}}$
is the thermal diffusivity (m
$^2$
s−1),
$Pr_{\textit{t}}$
is the turbulent Prandtl number ( = 0.85, a default value was used),
$q_{\textit{reac}}^{ \prime \prime \prime }$
is the volumetric heat release rate due to reaction (W m−
$^3$
) and
$q_{\textit{rad}}^{ \prime \prime }$
is the radiative heat flux (W m−
$^2$
). Equation (2.2) includes
$p_{\textit{rgh}}$
, which is the static pressure minus the potential energy, to account for the effect of buoyancy by the last term. For the discretisation scheme, the second-order ‘filteredLinear2V’ scheme is used for the momentum equation, and the second-order ‘limitedLinear’ scheme is used for the mass fraction and enthalpy equations (OpenFOAM v2006 2020).
The parameter
$j_{iJ}$
is calculated as

where
$\tilde {T}$
is the temperature and the thermal diffusivity
$D_{\textit{h}}$
is modelled by

where
$C_{\textit{p}}$
is the heat capacity at the constant pressure (J (kg−1
$\cdot$
K−1)), and
$D_{\textit{diff, J}} = D_{\textit{h}}/Le_J$
.
$Le_J$
is the Lewis number of chemical species
$J$
which can be obtained from references. For example,
$Le_{{{\textit{C}}_3{\textit{H}}_8}} =1.74$
,
$Le_{{\textit{O}}_2} =1.11$
,
$Le_{{\textit{H}}_2{\textit{O}}} =0.83$
,
$Le_{{\textit{CO}}_2} =1.39$
and
$Le_{{\textit{N}}_2} =1$
(Smooke Reference Smooke1991; Giacomazzi, Picchia & Arcidiacono Reference Giacomazzi, Picchia and Arcidiacono2008). The parameter
$\kappa$
(W (m−1
$\cdot$
K−1)) is the thermal conductivity modelled by the modified Eucken correction (Poling, Prausnitz & O’Connell Reference Poling, Prausnitz and O’Connell2001)

where
$R$
is the gas constant (J (kg−1
$\cdot$
K−1)),
$C_{\textit{v}}$
is the heat capacity at the constant volume (J (kg−1
$\cdot$
K)−1) and
$D^T_J$
(kg (m−1
$\cdot$
s−1)) is the thermal diffusion coefficient. Maragkos, Beji & Merci (Reference Maragkos, Beji and Merci2017) adopted the following formula in their version of FireFOAM:

where
$M_J$
is the molecular weight of chemical species
$J$
and
$X_J$
is the volume fraction of chemical species
$J$
.
The value of
$\mu$
is estimated by Sutherland’s law (OpenFOAM v2006 2020)

where
$A_{\textit{s}} = 1.67212\times 10^{-6}$
(kg (m
$\cdot$
s
$\cdot$
K
$^{0.5}$
)−1), and
$T_{\textit{s}}$
= 170.672 (K).
2.2.2. Turbulence model
The Smagorinsky model is a widely used and successful sub-grid-scale model (Smagorinsky Reference Smagorinsky1963), known as one of the most basic sub-grid-scale models for LES. However, the model has a parameter, the Smagorinsky constant (
$C_{\textit{s}}$
), whose value depends on the characteristics of the flow. The dynamic Smagorinsky model is an improved version of the Smagorinsky model that allows
$C_{\textit{s}}$
to be determined dynamically in both time and space (Germano et al. Reference Germano, Piomelli, Moin and Cabot1991 and Lilly Reference Lilly1992). In the Smagorinsky model,
$\mu _{\textit{SGS}}$
is computed by


where
$\unicode{x1D6E5} _{\textit{filter}}$
is the filter width (m) and
$\tilde {S}$
is the symmetrical component of the velocity gradient tensor (s−1). The parameter
$C_{\textit{s}}$
is estimated as


where
$\langle \rangle$
is an area-weighted average,
$L_{ij}$
is called the Germano identity and
$\widehat {\quad }$
is the value of the test filter for the dynamic Smagorinsky model with the width of the test filter given as
$\hat {\unicode{x1D6E5} }_{\textit{filter}} =2\unicode{x1D6E5} _{\textit{filter}}$
. The value of
$\mu _{\textit{SGS}}$
has been obtained up to this point. For the combustion model, it is necessary to estimate the sub-grid-scale turbulent kinetic energy (
$k_{\textit{SGS}}$
, (m
$^2$
s−
$^2$
))

where
$C_{\textit{I}}$
is the model constant for
$k_{\textit{SGS}}$


In OpenFOAM v2006 2020, the dynamic Smagorinsky model is not included. Passalacqua (Reference Passalacqua2021) introduced this model, and we previously integrated it into the in-house version of FireFOAM (Fukumoto et al. Reference Fukumoto, Wang and Wen2019).
For completeness, a direct comparison between the incompressible and compressible formulations of the dynamic Smagorinsky model is shown in figure 22 of Appendix A. As shown there, the density correction has a negligible effect on both the temperature rise and the velocity distribution; accordingly, the incompressible formulation of the model is adopted throughout this study.
2.2.3. Combustion model
Magnussen & Hjertager (Reference Magnussen and Hjertager1977) initially suggested the eddy dissipation model and later extended it to the eddy dissipation concept model (Magnussen Reference Magnussen1981). The eddy dissipation concept models the average reaction rate by considering the process of dissipating energy from the large to small scale. However, since the variables in the model are from the Reynolds average Navier–Stokes simulation (RANS), a problem arises with the direct replacement of variables when applying it to the LES. For example, the RANS-based epsilon and sub-grid-scale epsilon are different. Chen et al. (Reference Chen, Wen, Xu and Dembele2014) re-constructed the eddy dissipation turbulence energy cascade model proposed by Ertesvåg & Magnussen (Reference Ertesvåg and Magnussen2000) to match the scale of the LES model. Their model has been applied to a variety of combustion scenarios by LES: pool fires (Chen et al. Reference Chen, Wen, Xu and Dembele2014; Wang, Wen & Chen Reference Wang, Wen and Chen2014a ), jet flames (Wang et al. Reference Wang, Wen, Chen and Dembele2014b ; Fukumoto et al. Reference Fukumoto, Wang and Wen2019), flame spread (Fukumoto, Wang & Wen Reference Fukumoto, Wang and Wen2022) and buoyant diffusion flames (Chen et al. Reference Chen, Fukumoto, Zhang, Lin, Tang and Hu2023b ). This section presents the essential information for implementation.
The energy dissipation concept uses the length scale on the last structure level,
$L^*$
(m), and the velocity scale on the last structure level
$u^*$
(m s−1). The reaction takes place in these scales. Chen et al. (Reference Chen, Wen, Xu and Dembele2014) estimated those as


where
$\varepsilon _{\textit{tot}}$
is the total epsilon and
$\nu$
is the kinematic viscosity. From these derivations, Chen et al. (Reference Chen, Wen, Xu and Dembele2014) assumed that the smallest scale ( = last structure level) is the Kolmogorov length, and they derived
$C_{\textit{D1}} = 0.5$
and
$C_{\textit{D2}} = 0.75$
. Chen et al. (Reference Chen, Wen, Xu and Dembele2014) also modelled the total dissipation energy,
$\varepsilon _{\textit{tot}}$
, (m
$^2$
s
$^{-3}$
) based on the energy cascade concept

where
$\unicode{x1D6E5} _{\textit{filter}}$
is the filter width (m) and
$k_{\textit{SGS}}$
is the sub-grid-scale turbulent kinetic energy (m
$^2$
s−
$^2$
). Thus far, these equations are the formulation of the variables that link the eddy dissipation concept to the LES. For the detailed derivation of this model, readers should refer to Chen et al. (Reference Chen, Wen, Xu and Dembele2014). It is now possible to determine the reaction rate using the eddy dissipation concept model. The reaction rate of chemical species
$J$
is given by


where
$\bar{\omega }_J$
is the reaction rate of chemical species
$J$
,
$\nu _J^{\prime }$
and
$\nu _J^{\prime \prime }$
are the molar stoichiometric coefficients on the left- and right-hand sides of the global reaction equation,
$\dot { m }^*$
is the mass transfer rate between fine structures and surrounding fluids (s−1),
$\gamma$
is the mass fraction of fine structures,
$\chi$
is the reacting fraction of fine structures,
$s$
is the stoichiometric O
$_2$
-to-fuel mass ratio and subscripts fu and O
$_2$
are fuel and oxygen, respectively,


where
$L^{\prime }$
is the integral scale (m),
$\tilde {Z}$
is the mixture fraction,
$Z_{\textit{st}}$
is the mixture fraction at the stoichiometric state,
$\alpha = 0.2$
and
$\dot {Q}$
is the heat release rate (W).
The mass transfer rate between fine structure and surrounding fluids is modelled as (Ertesvåg & Magnussen Reference Ertesvåg and Magnussen2000)

3. Results
3.1. Experiment
3.1.1. Two modes of flame behaviour in the spanwise direction
For two proximal tandem filaments, it was found that they obviously undulate in the spanwise direction (Zhu Reference Zhu2009). It is instructive to compare the behaviour of tandem filament motions with analogous views of tandem diffusion flames. Time variation of representative frames for two tandem fires separated by varying distances
$S$
in the spanwise direction under relatively strong cross-airflow is exhibited in figure 2. From the overhead view, it is of interest to observe that both flames flap, i.e. flame tip waves back and forth in the spanwise direction, in particular, the downstream following flame takes on greater lateral amplitude in figure 2(a) that is identical to flexible objects (Zhu Reference Zhu2009).

Figure 2. Selected frames at the interval of 0.04 s revealing the two motion modes for DDF under relatively strong cross-wind (
$u_{\textit{c}} = 2$
m s−1) at different spacings for non-merging cases: (a) mode I: oscillating mode; (b) mode II: bifurcating mode. See also Movie 1 about the experimental overhead video image at
$u_{\textit{c}} = 2$
m s−1,
$S/D$
= 3 and
$\dot {Q_{{u}}}$
= 17.43 kW and
$\dot {Q_{{d}}}$
= 17.43 kW.

Figure 3. Normalised flame position of the upper edge and lower edge as a function of time under varied cross-wind velocities for the UDF and DDF (
$S/D$
= 3,
$\dot {Q}_{{u}}$
= 17.43 kW and
$\dot {Q}_{{d}}=17.43$
kW).
From the top and left of figure 2(a), the arc shape of the DDF directly reflects the instantaneous wake vortex to a great extent, which indicates that this oscillation phenomenon is closely associated with the invisible flow structures. Due to the presence of soot, the luminous flame itself is a natural flow-field tracer to some extent. Based on experimental observation, two modes were distinguished through the flame phenomena. Firstly, the flapping behaviour of flames in the spanwise direction is defined as mode I-’oscillating mode’. In addition to the oscillating mode, symmetrical or asymmetrical bifurcation of the flame to the left and right sides is in the DDF, as depicted in figure 2(b). This bifurcation phenomenon is barely noticeable for the UDF. In the meantime, it is also observed that the maximum width of this wing-like structure in the spanwise direction seems to increase as the spacing enlarges. In this case, the second mode is defined as mode II–’ bifurcating mode’. Through the playback of the recorded video, one can observe that these two aforementioned modes alternately appear at random. Note that these phenomena only exist in cross-wind-dominated cases (
$u_{\textit{c}} \geqslant 1.2$
m s−1).
The formation of these two modes indicates that the oscillation or bifurcation of the DDF strongly depends on the flow structure downwind of the UDF. Shinohara & Kudo (Reference Shinohara and Kudo2004) identified several types of vortices downstream of a diffusion flame by the flow visualisation technique. One of them is wake vortices, which consists of periodical vortices of alternating signs (i.e. including cyclonic and anticyclonic rotation), similar to the Kármán vortex street. However, this kind of wake vortex is not as well ordered as the Kármán vortex street owing to the coupling actions of the buoyancy and drag forces (Zhu Reference Zhu2009). For the oscillating mode, downstream flame synchronous flaps form under the action of wake vortices shedding from the UDF at the height above the burner surface. Thus, one could observe that flames with arcs occasionally occur. The flapping mechanism is explained by simulation in § 3.2.3.
To further characterise the flame motion behaviour in the spanwise direction, it is of interest to capture the instantaneous flame edge position versus the elapsed time. The upper/lower edge of the flame represents the widest location along the spanwise direction where the flame could reach. In order to objectively track the upper/lower flame edge, each frame is loaded into a MATLAB script and converted to a bitonal picture. Then, the upper/lower edges of UDF and DDF can be extracted via MATLAB, which is defined as the distance between the burner centreline and the upper/ lower flame edge. Figure 3 shows an instantaneous measure of the upper/lower flame edge normalised by
$D$
with the increasing
$u_{\textit{c}}$
at a given separation distance, where both fires have the same heat release rate of 17.43 kW. In figure 3, firstly, we define up as positive and down as negative, employing the burner centre as the coordinate origin. Then, the coordinates of the upper/lower edges of the UDF and DDF can be obtained. Finally, instantaneous flame upper/lower edges with the elapsed time are normalised by burner size
$D$
. Blue and orange solid lines represent the UDF and DDF edges’ positions, respectively. Grey dash lines represent the edge of the burner, and ’0’ corresponds to the burner centre. The oscillating and bifurcating modes are defined as follows:

where
$x_{{norm,upedge}}$
,
$\bar{x}_{{norm,upedge}}$
,
$x_{{norm,lowedge}}$
and
$\bar{x}_{{norm,lowedge}}$
are the normalised upper flame edge position, the time-averaged normalised upper flame edge position, the normalised lower flame edge position and the time-averaged normalised lower flame edge position. When the position of the flame edge on both sides is greater than the average of each side, the bifurcating mode is assumed. Otherwise, the oscillating mode is assumed. The absolute value of either or both should be greater than or equal to that of the UDF in light of the asymmetry in bifurcation. This definition can be a quantitative standard to distinguish these two modes.

Figure 4. Power (
$-$
) vs frequency
$f$
(Hz) by the fast Fourier transform of the flame position data in figure 3, where
$f$
is the frequency and
$f_{{max}}$
is the peak frequency. The results are shown for following cases: (a) UDF,
$u_{\textit{c}}$
= 1.2 m s−1, (b) UDF,
$u_{\textit{c}}$
= 2.0 m s−1, (c) UDF,
$u_{\textit{c}}$
= 3.0 m s−1, (d) DDF,
$S/D = 3$
,
$u_{\textit{c}}$
= 1.2 m s−1, (e) DDF,
$S/D = 3$
,
$u_{\textit{c}}$
= 2.0 m s−1 and (f) DDF,
$S/D = 3$
,
$u_{\textit{c}}$
= 3.0 m s−1. Here,
$\dot {Q}_{{u}}$
= 17.43 kW and
$\dot {Q}_{{d}}$
= 17.43 kW. Note that, if the frequency at which the curve drops is not equal to
$f_{{max}}$
, its frequency is also indicated (see (b) and (c)).
Typical oscillating and bifurcating mode examples have been marked in figure 3. Some notable observations can be made that: (i) the DDF behaviour is much more disordered than that of the UDF, while the amplitude of upper and lower edges of the UDF is narrower than that of the DDF; (ii) the amplitude of upper and lower edges for either the UDF or DDF have a declining trend as
$u_{\textit{c}}$
increases, the amplitude of the edge of the DDF at 1.2 m s−1 is almost twice that of the DDF with
$u_{\textit{c}}$
= 3.0 m s−1. The occurrence of the oscillating and bifurcating modes seems irregular. This trend would be due to the flame self-sustained oscillatory frequency, cross-flow turbulence intensity and the fire size and strength. Figure 4 shows the power spectrum vs frequency analysed by the fast Fourier transform (FFT) of the flame position data in figure 3, where
$f$
is the frequency, and
$f_{{max}}$
is the peak frequency in figure 3. The peak power of the UDFs appears at approximately 0.2–1.8 Hz, and that of the DDFs shows 0.5–2.2 Hz, which is approximately similar to a puffing frequency of buoyancy flames and pool fires (Cetegen & Ahmed Reference Cetegen and Ahmed1993; Maragkos & Merci Reference Maragkos and Merci2020). The main spanwise flapping occurs at these frequencies. The power spectrum decreases steadily, which indicates that the high-frequency component has less power than the low-frequency component. Due to the influence of the UDF, the power is higher for the DDF than for the UDF. For the slower
$u_{\textit{c}}$
, the power is also higher because the DDF is affected by the UDF, resulting in a larger oscillation width. A faster
$u_{\textit{c}}$
results in less power because the oscillation width is reduced. Instead, in the DDF,
$f_{{max}}$
increases gradually as
$u_{\textit{c}}$
increases, indicating that the flapping speed becomes fast. As
$u_{\textit{c}}$
increases, the low-frequency component increases, resulting in a wave with a mixture of low- and high-frequency components. In other words, as
$u_{\textit{c}}$
increases, the flapping becomes faster, the flame width decreases and flapping with various periods gets mixed together.
Furthermore, the sheltering effect of the UDF reduces the tilt angles of the DDF, and the tilt angles become smaller at a given cross-wind with the increasing burner distance for non-merged cases. The ratio of the flame tilt angle of the DDF to that of the UDF for non-merged cases was a function of a modified Froude number,
$u_{\textit{c}}^2/(gS)$
. Note that this work focuses on the flapping behaviour under cross-wind ranging from 1.2 to 3.0 m s−1, in which the thermal buoyancy caused by diffusion flames was overwhelmed by the inertial force of the cross-wind. The increasing rate of tilting angles for both the UDF and DDF gradually becomes slower with the further increase in cross-wind speed between 1.2 and 3.0 m s−1. Given these conditions, tilting behaviour is not considered a primary factor in this study.

Figure 5. Power (
$-$
) vs frequency
$f$
(Hz) by the FFT. The original data are the difference in the normalised flame position of the upper and lower edges of the DDF in figure 3. The bifurcating mode is set to 1, and the oscillating mode is set to 0 to create a square wave. The results are shown for following cases: (a)
$u_{\textit{c}}$
= 1.2 m s−1, (b)
$u_{\textit{c}}$
= 2.0 m s−1, (c)
$u_{\textit{c}}$
= 3.0 m s−1 with
$\dot {Q}_{{u}}$
= 17.43 kW,
$\dot {Q}_{{d}}$
= 17.43 kW and
$S/D$
= 3. Note that, if the frequency at which the curve drops is not equal to
$f_{{max}}$
, its frequency is also indicated (see (b)).
The additional FFT data are shown in figure 5. The original data are the difference in the normalised flame position of the upper and lower edges of the DDF in the bifurcating mode. The original data were created based on the bifurcating mode = 1, and the oscillating mode = 0, indicating a square wave. By treating mode switching as if it were a signal switch, we attempted to identify its frequency. The parameter
$f_{{max}}$
is the fundamental frequency of the square wave around which mode switching is considered to occur. As shown in figure 5(a), (b) and (c), when
$u_{\textit{c}}$
is fast, waves with higher energy tend to appear at higher frequencies. This trend may be due to the faster cross-wind velocity, leading to the flame oscillating more rapidly and more frequently switching modes. This is reflected in the increasing
$f_{{max}}$
from 1.5 Hz at
$f_{{max}}$
= 1.2 m s−1 (figure 5
a) to 3 Hz at
$f_{{max}}$
= 3.0 m s−1 (figure 5
c). Although there is such a tendency, several waves with different frequencies and powers appear, as shown in figure 5. Different frequencies appear in the spectra (with peaks at various frequencies), indicating that the mode switching is complex or non-periodic. For example, Xia & Zhang (Reference Xia and Zhang2018) proposed a theory for the flickering phenomenon of small buoyant diffusion flames. However, this flame is more complex, as the UDF and DDF oscillate simultaneously on both the left and right sides. In other words, four waves oscillate independently. Thus, reproducing such a phenomenon using CFD is more reasonable than formulating it theoretically (see § 3.2).
3.1.2. Maximum flame width magnitude in the spanwise direction
The previous section exhibited an instantaneous phenomenon as a function of time. Since fire plume flow is usually turbulent, flame shape parameters such as horizontal flame extent and flame height are time-dependent and unsteady. As a result, time-averaged flame shape parameters are taken based on 50 % intermittency for analysis in some works (Zukoski, Cetegen & Kubota Reference Zukoski, Cetegen and Kubota1985; White et al. Reference White2015; Maynard & Butta Reference Maynard and Butta2017; Sun et al. Reference Sun, Liu, Gao, Xie and Zhang2021). However, the objective of this work is to investigate the flapping behaviour of a pair of tandem diffusion flames under cross-wind, which focuses on the furthest distance the fires can reach in the spanwise direction because the neighbouring combustibles may be ignited due to flame contact. The maximum flame widths (
$W$
) in the spanwise direction have been identified, which aids in assessing the most dangerous fire scenarios, a factor often overlooked in previous research. Meanwhile, the maximum flame height corresponding to the 0.05 flame intermittency has also been addressed and analysed in fire research (Zukoski et al. Reference Zukoski, Cetegen and Kubota1985; Lee, Delichatsios & Silcock Reference Lee, Delichatsios and Silcock2007; Zhou & Wu Reference Zhou and Wu2007; Shintani et al. Reference Shintani, Nagaoka, Deguchi, Ido and Harada2014; Ji, Ge & Qiu Reference Ji, Ge and Qiu2021). Figure 6 shows the time-averaged maximum flame width (
$W$
) to quantitatively describe this phenomenon. This width is defined as the maximum distance in the spanwise direction based on the lowest intermittency level (
$I$
= 0.05). Figure 6 compares the variation of measured
$W$
against cross-wind for the IDF (
$W_{\textit{i}}$
), UDF (
$W_{{u}}$
) and DDF (
$W_{{d}}$
). It is observed that the maximum
$W_{{u}}$
for varying a separation distance (
$S$
) is nearly the same as
$W_{\textit{i}}$
at a given heat release rate, which also becomes narrower as
$u_{\textit{c}}$
increases. A small difference in
$W$
between the UDF and IDF implies that the DDF in cross-wind has a negligible effect on the UDF. The presence of the flame motion of the DDF indicates that the UDF has a strong influence on the DDF flapping movement.

Figure 6. Intermittency of the presence of flame using recorded images (top) and measured maximum flame width against cross-wind speed (
$u_{\textit{c}}$
) under various spacings (
$S$
) for non-merging cases (lower).
It is also found that all the maximum widths of the IDF, UDF and DDF grow with the increasing
$\dot {Q}$
due to the expansion of flame volume. Moreover,
$W_{{d}}$
is broader when raising
$\dot {Q}_{{u}}$
. Compared with the maximum
$W$
of the IDF and UDF, that of the DDF is found to be markedly larger. Meanwhile, it enlarges with the increasing
$S$
, which is consistent with the visual observations in figure 2. An intuitive physical interpretation is provided as follows. Since the flame is a natural indicator of the flow pattern, the flames are passive and follow the motion of surrounding fluid owing to fluid viscosity. The DDF is entirely immersed in the wake of the UDF. The motion of wind-blown UDF produces a disturbed vortex-embedded wake, which is helpful for the flapping behaviour of the DDF. As the two tandem flames are brought further apart, or the resistance of the UDF is strengthened (equal to higher
$\dot {Q}$
), the wake downstream should widen and disentangle (Ristroph & Zhang Reference Ristroph and Zhang2008). Hence,
$W_{{d}}$
is wider when separation distances are larger or the heat release rate of the UDF is larger. When there is a stronger cross-wind (>1.2 m s−1), the sideways movement of both flames is limited (equal to lower
$W$
) by the force of the cross-wind. In other words, the interaction between these two fires is weaker, and
$W$
greatly depends on
$u_{\textit{c}}$
(refer to figure 3).

Figure 7. Ratio of the UDF or DDF maximum width to that of IDF as a function of modified
$Fr=u_{\textit{c}}^2/(gS)$
.
A comparison of the maximum width of the UDF and DDF to that of the IDF is plotted in figure 7 as a function of
$u^2_{\textit{c}}/(gS)$
following Chen et al. (Reference Chen, Hu, Kuang, Zhang, Lin and Zhong2021). In addition to the phenomenon found above, one could also notice that
$W_{{d}}/W_{\textit{i}}$
shows a non-monotonic trend. The first rising trend indicates that
$W_{{d}}$
decreases slower than
$W_{\textit{i}}$
with increasing
$u_{\textit{c}}$
. The following declining regime signifies that the wake structures downstream of the UDF become notably narrow under the increasing cross-wind effect. One can speculate that
$W_{{u}}/W_{\textit{i}}$
tends to be almost unity when the cross-wind velocity is large enough before these flames blow out.
3.1.3. Full-scale test vs laboratory test
We experimented on tandem diffusion flames under cross-winds in §§ 3.1.1 and 3.1.2. In fire research, large-scale and full-scale tests are difficult to carry out because they require a well-controlled large-scale fire testing facility and are expensive. Therefore, the research often relies on laboratory-scale experiments, which provide valuable insights despite differences in scale. These data, such as the length scales of the flame geometry, are then subject to an analysis utilising classical scale modelling and dimensionless parameters to develop or generalise the resulting correlation. Similarities exist between the large-scale and laboratory-scale experiments, especially in flow behaviour. The scale modelling methods have been widely applied in fire research (Emori & Saito Reference Emori and Saito1983; Quintier Reference Quintier1989) by preserving the most important terms. Emori & Saito (Reference Emori and Saito1983) suggested the scaling relations of velocity (
$u)$
, time (
$t$
) and temperature (
$T$
) vs length scale (
$L$
):
$u_{\textit{fs}}/u_{\textit{ls}}=(L_{\textit{fs}}/L_{\textit{ls}})^{0.5}$
,
$t_{\textit{fs}}/t_{\textit{ls}}=(L_{\textit{fs}}/L_{\textit{ls}})^{0.5}$
and
$T_{\textit{fs}}/T_{\textit{ls}}=L_{\textit{fs}}/L_{\textit{ls}}$
, where the subscripts fs and ls denote full scale and laboratory scale. In our work, the heat release rate (HRR) adapted in the experiments ranges from 17.43 to 34.86 kW, and the burner size is 15 cm. The dimensionless HRR (expressed as
$\dot {Q}^* = \dot {Q}/[\rho _\infty C_{\textit{p},\infty } T_{\infty } g^{1/2}D^{5/2}]$
) is approximately 1.8–3.6, where subscript
$\infty$
denotes ambient with
$T = 293.15$
K. During preliminary tests, it was observed that the flapping behaviour of diffusion flames occurs when the cross-wind velocity
$u_{\textit{c}} \gt 1.2 \, \text{m}\,\text{s}^{-1}$
. To better understand the scaling effects, we consider experimental data from relatively larger-scale fire tests as a reference. According to the results of large-scale fully turbulent pool fire tests (Lei et al. Reference Lei, Deng, Liu, Mao, Saito, Tao, Wu and Xie2022b
), for a diesel pool fire with a side length of 7 m, the theoretical heat release rate can reach 100 MW, and the dimensionless HRR is around 0.7. The dimensionless HRR of large-scale pool fires is at the same magnitude as that on the laboratory scale. Based on the scaling relation, the critical velocity at which the flame-flapping behaviour occurs should be approximately

In real fire situations, wind speeds of 10 m s−1 or higher are quite common, especially in areas prone to wildfires and during urban fire incidents. Large-scale fire experiments and field observations have documented wind conditions that exceed this threshold, which significantly impacts fire behaviour (Liu et al. Reference Liu, Lei, Gao, Chen and Xie2021). For instance, extreme wildfire events have been documented with wind speeds that can range from 2 to 40 m s−1 (Finney & McAllister Reference Finney and McAllister2011), contributing to rapid fire spread and dynamic flame behaviour. Given these conditions, flame-flapping phenomena in the spanwise direction are expected to occur in large-scale fires where the length scales are of the order of 10 m, and the heat release rates range from 1 to 100 MW.

Figure 8. Computational domains for (a) a square burner and (b) tandem square burners with
$S/D=3$
.
3.2. Simulation
Sections 3.1.1 and 3.1.2 used luminous flames as flow-field tracers. However, this method cannot observe variables in the flow field, such as temperature and velocity vectors. In this section, we visualise the flow using simulations to understand the two modes better.
Table 1. Boundary conditions for a square burner and tandem square burners. Boundary condition names, such as inletOutlet, are defined in the documentation (OpenFOAM v2006 2020). The names are associated with those in figure 8.

$^{1}$
The Dirichlet condition based on a mass or volumetric flow rate.
$^{2}$
The Neumann condition with a zero gradient is applied. When backflow occurs
$u_i$
is specified based on the pressure.
$^{3}$
The Neumann condition with a zero gradient is applied. When backflow occurs,
$u_i = 0$
is set.
$^{4}$
The synthesised-eddy based velocity inlet condition, which is the Dirichlet condition. See more details in the documentation (OpenFOAM v2006 2020)
$^{5}$
The no-slip condition.
$^{6}$
In FireFOAM,
$p$
is not solved.
$p_{\textit{rgh}}$
is solved, instead.
$^{7}$
$p_{\textit{rgh}} = p_{\textit{ref}} - 0.5\rho |u|^2$
, where
$p_{\textit{ref}}$
is 101,325 Pa.
$^{8}$
The Neumann condition with a zero gradient for pressure.
$^{9}$
The convective/diffusive condition. The zero gradient condition and the Dirichlet condition are mixed based on the ratio of convection and diffusion. When convection is strong,
$Y_{{\textit{C}}_3{\textit{H}}_8}$
(fuel mass fraction) = 1. See more details in the documentation (OpenFOAM v2006 2020) or the authors‘ previous study (Fukumoto et al. Reference Fukumoto, Wang and Wen2018).
$^{10}$
The Neumann condition with a zero gradient is applied. When backflow occurs,
$Y_{{\textit{O}}_2}$
= 0.233 and
$Y_{{\textit{N}}_2}$
= 0.767 are set.
$^{11}$
$Y_{{\textit{O}}_2}$
= 0.233 and
$Y_{{\textit{N}}_2}$
= 0.767.
$^{12}$
$T = 293.15$
K.
$^{13}$
The Neumann condition with a zero gradient is applied. When backflow occurs,
$T = 293.15$
K is set.
$^{14}$
The Neumann condition with a zero gradient is applied to the quartz-sand burner surface. The burner consists of a porous sand layer, where fuel exits through designated inlet regions (flowRateInletVelocity, see footnote 9). The remaining solid surface is treated as adiabatic to account for the insulating properties of the quartz sand.
$^{15}$
$\nu _{\textit{SGS}}$
is the SGS kinematic viscosity, given by the Spalding wall function.
3.2.1. Computational conditions and domains
Figure 8 shows the computational meshes and domains for (a) a square burner and (b) tandem square burners with
$S/D=3$
. The computational mesh for the square burner was used for validation, while the mesh for the tandem square burners was constructed based on the experimental set-up. Figure 8(b) shows the domain for
$S/D=3$
. The burner shape was square with 150
$\times$
150 mm, and the burner spacings were
$S/D$
= 3, 4 and 5. The computational domains with
$S/D = 4$
and
$5$
are shown in figure 23 of Appendix B. Table 1 summarises the boundary conditions, where the names used in figure 8 (e.g. gas burner) for the boundary conditions are consistent. The fuel was
$\mathrm{C_3H_8}$
, and the irreversible one-step chemistry model was used

Cross-wind
$u_{\textit{c}}$
was not set for (a) the square single burner cases and was set for (b) the tandem-square-burner cases. Table 2 lists the computational conditions for tandem square burners. The value of
$S/D$
was varied from 3 to 5, the distance between burners.
$u_{\textit{c}}$
was 1.2, 2.0 and 3.0 m s−1 and
$\dot {Q}$
was set to 17.43 or 34.86 kW. At 293 K (the ambient condition) based on
$u_{\textit{c}}, \rho _{\infty }$
and
$\mu _{\mathrm{\infty }}$
, the Reynolds numbers are 11,400 (
$u_{\textit{c}}$
= 1.2 m s−1), 15,200 (
$u_{\textit{c}}$
= 1.6 m s−1), 19,000 (
$u_{\textit{c}}$
= 2.0 m s−1), 23,700 (
$u_{\textit{c}}$
= 2.5 m s−1) and 28,500 (
$u_{\textit{c}}$
= 3.0 m s−1). The Reynolds number is high enough to be considered turbulent with respect to the cross-wind.
Table 2. Computational conditions for the tandem square burners.

3.2.2. Grid dependency and validation
Figure 9 shows the mean magnitude
$u$
and
$T$
at different grid resolutions in the refinement region in the case of tandem square burners. As shown in figure 9(a), the effect of the grid size on velocity is negligible. In contrast, as shown in figure 9(b), the predicted temperature is significantly affected when the grid widths are 15 and 7.5–8.1 mm. The velocities and temperatures at the finest mesh (4.7–5 mm) and medium mesh (7.5–8.1 mm) generally show good agreement. The number of cells on the coarsest mesh (15 mm) is approximately 920,000; on the medium mesh (7.5–8.1 mm), approximately 4,380,000; and on the finest mesh (4.7–5 mm), approximately 15,790,000. For the coarsest mesh, the effect of the cell size on the temperature cannot be ignored, and for the finest computational mesh, the computation time increases – therefore, an intermediate mesh of 7.5–8.1 mm was used in this study.

Figure 9. Mean magnitude
$u$
and
$T$
at different grid resolutions in the case of tandem square burners:
$u_{\textit{c}}$
= 1.2 m s−1,
$\dot {Q}_{{u}}$
= 17.43 kW and
$\dot {Q}_{{d}}$
= 34.86 kW.

Figure 10. (a) Temperature rise (
$\unicode{x1D6E5} T$
) and (b) normalised velocity (
$u_{\textit{y}}/\dot {Q}^{1/5}$
) plotted against the normalised coordinate (
$y/\dot {Q}^{2/5}$
).
As an additional criterion, the plume resolution index (PRI) is evaluated

where
$L^\prime$
is obtained by (2.26), and
$\unicode{x1D6E5}$
is the grid width (m). A value of
$PRI$
= 5–15 is an acceptable resolution according to the literature (Maragkos et al. Reference Maragkos, Beji and Merci2017), and higher values correspond to a higher grid resolution. In this study,
$PRI$
is 25 for 17.43 kW and 33 for 34.86 kW. Thus, the grid resolution is sufficient.

Figure 11. Flame heights (
$L_{\textit{f}}$
) for square pool fires for heat release rates of (a) 17.43 and (b) 34.86 kW. The McCaffrey correlation (see (3.5)) is plotted for reference.
Figure 10 shows (a) the temperature rise and (b) normalised velocity vs normalised coordinate. The correlation suggested by McCaffrey (Reference McCaffrey1979) is plotted for reference. McCaffrey suggested the flame region for
$y/\dot {Q}^{2/5} \leqslant 0.08$
, intermittent region for
$0.08 \leqslant y/\dot {Q}^{2/5} \leqslant 0.2$
and plume region for
$0.2 \leqslant y/\dot {Q}^{2/5}$
. The predictions match the trends in all three regions, but the temperature increase is approximately 200 K higher in the intermittent region. The agreement between the predictions and McCaffrey’s correlation is reasonable for the velocity prediction in the intermittency and plume regions.
Figure 11 shows flame heights
$L_{\textit{f}}$
for heat release rates of (a) 17.43 kW and (b) 34.86 kW. The McCaffrey correlation (McCaffrey Reference McCaffrey1995; as cited in Heskestad Reference Heskestad2016) is plotted for reference


The predicted flame height is estimated by the average of the highest coordinate values recorded during the simulations, for which the following equation is valid. This equation evaluates stoichiometric to fuel-rich conditions, the same as the previous study (Fukumoto et al. Reference Fukumoto, Wang and Wen2018)

where subscripts C, H and O are respective elemental species. This criterion identifies all points where the local mixture fraction exceeds the stoichiometric value (3.7), and the flame height
$L_{\textit{f}}$
is defined as the maximum coordinate satisfying this condition. Based on this definition, the errors for 17.43 and 34.86 kW are approximately 11 % and 5 %, respectively.
From figures 10–11, the accuracy of the calculation for single pool fires has now been verified. The next step is to verify the consistency between the measurements and predictions for tandem-square-burner scenarios. We consider the evaluation function closest to the experimentally defined intermittency shown in figure 6. The highest average
$T$
is assumed to be
$I = 1$
, since the probability of the existence of a flame is maximum. In contrast, the lowest average temperature (
$T_{\infty }$
) is assumed to be
$I = 0$
due to no flame. Based on this assumption, temperature at
$I = 0.05$
is estimated by linear interpolation as

where
$T_{{max}}$
and
$T_{I=005}$
are the maximum temperature and the temperature with
$I$
= 0.05. Using the evaluation function for
$T_{I=005}$
, a three-dimensional isosurface was created to estimate the widths of the UDF and DDF.

Figure 12. Predicted flame width for tandem-square-burner cases validated with the experimental flame width in figure 3.
The predicted flame width for tandem-square-burner cases compared with the experimental data is shown in figure 12. Figure 12(a) shows
$W_{\textit{i}}$
, while all
$W_{{u}}$
are expected to be similar. Therefore, only
$S/D$
= 3 (b) and 5 (c) are plotted. The flame width trend shows that
$W_{\textit{i}}$
and
$W_{{d}}$
decrease as
$u_{\textit{c}}$
increases. Moreover,
$W_{{d}}$
is larger than
$W_{\textit{i}}$
, and
$W_{{d}}$
increases as
$S/D$
increases, as discussed in § 3.1.2. For
$u_{\textit{c}}$
= 1.2 and 2.0 m s−1 and
$\dot {Q}_{{d}}$
= 34.86 kW in figure 12(h), (i), there is a difference from the experimental data, especially where the flame width is measured to be large. Finally, the sensitivity of the predicted flame width to the burner height from the ground is shown in figure 24 of Appendix C, showing that variations in the burner height
$H$
(0.4 and 0.8 m) have only a marginal effect on the flame width under the present cross-flow conditions.
3.2.3. Flapping mechanisms
Equation (3.8) was used to determine how to estimate the flame width, which is close to the experimental intermittency. However, Yang & Blasiak (Reference Yang and Blasiak2005) proposed an alternative flame-volume criterion as follows:

where
$V_{\textit{f1}}$
is the criterion for flame volume. This definition is particularly well suited for reproducing the visual appearance of flames on computers, such as those shown in figure 2.

Figure 13. Selected flames at an interval of 0.08 s for
$S/D = 3$
,
$u_{\textit{c}}=2.0$
m s−1,
$\dot {Q}_{{u}}$
= 17.43 kW and
$\dot {Q}_{{d}}$
= 17.43 kW. See also Movie 2 for the computational video of flame volume and velocity vectors corresponding to
$S/D = 3$
,
$u_{\textit{c}}=2.0$
m s−1,
$\dot {Q}_{{u}}$
= 17.43 kW and
$\dot {Q}_{{d}}$
= 17.43 kW.
Figure 13 shows the selected flames at an interval of 0.08 s for
$S/D = 3$
and
$u_{\textit{c}}=$
2.0 m s−1 based on (3.9). As observed in the experiment, the simulation also confirms two modes, the oscillating and bifurcating modes. The time interval is 0.08 s, and changes in the flame tip can be observed in figure 13(a), (b). As described in § 2.2, the simulation uses the continuity, momentum, mass fraction, sensible enthalpy equations and general methods, such as a combustion model and a turbulence model, to obtain the solution and does not use a particular physical model for this problem. In other words, the flapping phenomenon is caused by a combination of fluid motion, concentration change, temperature change, turbulence and combustion. Furthermore, flames in the oscillating and bifurcating modes for
$S/D$
= 4 and
$S/D$
= 5 are shown in figure 14. Both simulations reproduce the two modes. In both modes, the flame widths at both ends increase with increasing
$S/D$
. In the oscillating mode, the flame width increases when the flame is biased in either direction, as shown in figure 14(a). In contrast, in figure 14(c), the flame moves to the centre, narrowing the flame width. In figure 14(a), (c), there are velocity vectors in the opposite direction to the arc shape in the oscillating modes. This behaviour is explained by the wake vortices shed from the UDF. These vortices induce alternating flow patterns, causing the flame tips to oscillate. The flapping mechanisms will be described later (see figure 17). In the bifurcating mode, since the flame is open on both sides, the flame width is broader, as shown in figure 14(b), (d). From the fire safety point of view, the bifurcating mode is less desirable than the oscillating mode because the flame moves more in the spanwise direction.

Figure 14. Selected flames for
$u_{\textit{c}}$
= 2.0 m s−1,
$\dot {Q}_{{u}}$
= 17.43 kW and
$\dot {Q}_{{d}}$
= 17.43 kW. Respective flames are (a) the oscillating mode for
$S/D$
= 4, (b) bifurcating mode for
$S/D$
= 4, (c) oscillating mode for
$S/D$
= 5 and (d) bifurcating mode for
$S/D$
= 5.

Figure 15. Streamlines for
$S/D =3$
,
$u_{\textit{c}}=2.0$
m s−1,
$\dot {Q}_{{u}}$
= 17.34 kW and
$\dot {Q}_{{d}}$
= 17.34 kW. Stream (1) is a cross-wind near the burner. Stream (2) is a cross-wind slightly away from the burner. Streams (3) and (4) are entrainment air from the surroundings. Stream (3) is close to the UDF, and stream (4) is on the side of the wake of the UDF and DDF. Note that the gas flows move in the order of (No.), (No.)’ and (No.)”. Only half of the computational domain is shown.
Thus far, the oscillating mode and bifurcating mode were confirmed by the experiments and simulations. Next, the mechanisms of these modes are discussed. The overall flow in this system is shown in figure 15. The streams in this system exhibit strong three-dimensionality rather than a two-dimensional aspect, like the flow around the cylinder. This diagram explains how air is supplied by the environment under the cross-wind condition. There are four main streams. Stream (1) is a cross-wind along the burners. Stream (2) is a cross-wind away from the burner (approximately 0.65 m in the simulations). Streams (3) and (4) are entrainment air from the surroundings due to the UDF and DDF. Stream (3) is close to the UDF, and stream (4) is positioned on the outer side of the wake of both the UDF and DDF. Note that the computational domain in figure 15 is half. Stream (1) is considered to be the main flow component. Stream (2) lifts the flame at the location of stream (2)’. It is interesting that the fire is lifted by the cross-wind away from the fire source (stream (2)), even though the momentum direction is different. Stream (3) lifts the UDF wake and some of the DDF wake (stream (3)’). Stream (4) lifts the DDF wake (stream (4)’). Stream (4) merges with stream (2) beneath the DDF (see (2)’(4)’). The air is entrained toward the nearest fire source. In the end, streams (1)–(4) merge to form stream (1)”(2)”(3)”(4)”. All the streams rise vertically because of the buoyancy caused by the fires.

Figure 16. Velocity vectors for (a) IDF,
$\dot {Q}_{\textit{i}}$
= 17.43 kW, (b)
$S/D$
= 3,
$\dot {Q}_{{u}}$
= 17.43 kW,
$\dot {Q}_{{d}}$
= 17.43 kW, (c)
$S/D$
= 3,
$\dot {Q}_{{u}}$
= 17.43 kW,
$\dot {Q}_{{d}}$
= 34.86 kW and (d)
$S/D$
= 5,
$\dot {Q}_{{u}}$
= 17.43 kW,
$\dot {Q}_{{d}}$
= 17.43 kW. The cross-wind velocity is
$u_{\textit{c}}=2.0$
m s−1 on the
$y$
= 0 m surface.
Figure 16 shows the velocity vectors for the following cases: (a) the IDF with
$\dot {Q}_{\textit{i}}$
= 17.43 kW, (b) tandem burners with
$S/D$
= 3, where
$\dot {Q}_{{u}}$
= 17.43 kW,
$\dot {Q}_{{d}}$
= 17.43 kW, (c)
$S/D$
= 3 with
$\dot {Q}_{{u}}$
= 17.43 kW,
$\dot {Q}_{{d}}$
= 34.86 kW and (d)
$S/D$
= 5 with
$\dot {Q}_{{u}}$
= 17.43 kW,
$\dot {Q}_{{d}}$
= 17.43 kW. For all the cases, the cross-wind velocity is
$u_{\textit{c}}=2.0$
m s−1. Additionally, (b) is in the bifurcating mode, (c) is in the oscillating mode and (d) is in the bifurcating mode. It is not easy to distinguish them by the velocity distribution, and flame volume is a better way to make these determinations (see figures 13 and 14). The red areas show a strong cross-wind effect, and the blue areas show the flame-caused velocity defect. The left and right flows do not intersect; the flapping generated on the left side of the UDF affects the flapping generated on the left side of the DDF. Likewise, flapping generated on the right side of the UDF affects flapping generated on the right side of the DDF. There appears to be no significant change in velocity distribution or vectors over the (a) IDF and (b)
$S/D$
= 3 and (d) 5. The result contradicts the observation that, as
$S/D$
increases, the flame width of the DDF (
$W_{{d}}$
) increases. This contradiction can be explained by the fact that the velocity defect region is wider downstream, which in turn causes a broader flame width downstream of the DDF. Therefore, when the burner is positioned downstream of the DDF, the visible area of the flame extends in the spanwise direction. The interface between the red and blue regions is wavy, confirming the effect of flapping. The instability of the interface becomes more pronounced downstream of the DDF. Comparing (b) and (c), the heat release rate is doubled in (c), resulting in a slight increase in cross-wind velocity around the DDF. This increase may be due to the effect of increased entrainment (see streams (3) and (4) in figure 15), but it also affects the upstream. The slight increase in cross-wind may reduce the flame width of the UDF, but the experimental values (figure 3) do not show this trend.

Figure 17. Three types of flapping mechanisms. Numerical conditions are
$S/D = 3$
,
$u_{\textit{c}}=2.0$
m s−1,
$\dot {Q}_{{u}}$
= 17.43 kW and
$\dot {Q}_{{d}}$
= 17.43 kW. See also Movie 3 for the computational video image of flame volume corresponding to
$S/D = 3$
,
$u_{\textit{c}}=2.0$
m s−1,
$\dot {Q}_{{u}}$
= 17.43 kW and
$\dot {Q}_{{d}}$
= 17.43 kW.
Figure 17 depicts the three types of flapping mechanisms. When viewed from above, the gas flow near the interface on the left side is referred to as Flow L, and that on the right side is referred to as Flow R. As explained in figure 16, Flow L and Flow R slightly move to the left and right. If Flow L and Flow R merge or are close together and point in the same direction, the system is in the oscillating mode (figure 17 a). In contrast, if Flow L and Flow R point in opposite directions, this is the bifurcating mode (figure 17 b). Another possibility is that the flame tips on Flow L and Flow R have different lengths (figure 17 c). This mode may be difficult to judge because the flame may appear to be both in the oscillating and bifurcating modes, depending on the length of the flame. The safe way to determine the mode is to make it the same as the previous mode. It should be noted that, in the oscillating mode, the flame front at the tip of the flame is oriented in the same direction on both sides, as shown in figure 17(a), and in the opposite direction, as shown in figure 17(c). The difference in flame tip length between the left and right flames is thought to be pulsating due to puffing in the cross-wind direction, depicted as ’Pulsating’ in figure 17(c). Pool fires oscillate in the height direction, but this flame oscillates in the cross-wind direction.
Next, we discuss the mechanism of mode switching. Figure 18(a) shows the mechanism of switching from oscillating mode to bifurcating mode, and figure 18(b) shows the mechanism of the switching from bifurcating mode to oscillating mode. In figure 18(a), the centre part of the flame splits into two flames. This is thought to be caused by a difference in the period of the left and right flapping. In figure 18(b), the flame that branched at both ends (5.80 s) is pointing in the same direction at the next instant (5.88 s), indicating a switch to oscillating mode. This switching is also thought to be caused by the difference between the left and right periods of the flapping. The difference between the left and right flapping cycles is thought to cause mode switching.

Figure 18. Mode switching mechanisms. Numerical conditions are
$S/D = 3$
,
$u_{\textit{c}}=2.0$
m s−1,
$\dot {Q}_{{u}}$
= 17.43 kW and
$\dot {Q}_{{d}}$
= 17.43 kW.

Figure 19. Power (
$\mathrm{m}^{2}$
) vs frequency
$f$
(Hz) by the FFT of the flame length data, where
$f$
is the frequency,
$f_{{max}}$
is the peak frequency and the flame length is determined by the longest coordinate value in the cross-wind direction obtained by the simulations. The results are shown for the following cases: (a) DDF and
$u_{\textit{c}}$
= 1.2 m s−1, (b) DDF and
$u_{\textit{c}}$
= 2.0 m s−1 and (c) DDF and
$u_{\textit{c}}$
= 3.0 m s−1 with
$\dot {Q}_{{u}}$
= 17.43 kW,
$\dot {Q}_{{d}}$
= 17.43 kW and
$S/D$
= 3. The power drops approximately at
$f$
= 1 Hz.
An increase in cross-wind velocity increases the frequency of flapping (see figure 4). Figure 19 shows the power (m2) vs frequency
$f$
(Hz) by the FFT of the flame length data. The respective conditions are: (a) DDF and
$u_{\textit{c}}$
= 1.2 m s−1, (b) DDF and
$u_{\textit{c}}$
= 2.0 m s−1 and (c) DDF and
$u_{\textit{c}}$
= 3.0 m s−1. The burner distance is
$S/D$
= 3, and
$Q_{{u}}$
= 17.43 kW and
$Q_{{d}}$
= 17.43 kW. The flame length is determined by the longest coordinate value in the cross-wind direction obtained by the simulations. The criterion is (3.7), the same as the flame height definition. The power drops approximately at
$f$
= 1 Hz. The variations in flame length reveal that the energy begins to decay at approximately 1 Hz, regardless of wind speed. This trend indicates that the primary factor of the characteristic frequency of energy dissipation is buoyancy rather than the effects of cross-wind. Concerning flapping frequency (figure 4), at low cross-wind velocity (1.2–2.0 m s−1), the flapping frequency is closer to puffing, and interaction is more likely to occur. At higher cross-wind velocity (3.0 m s−1), the flapping frequency increases, so the puffing effect is relatively small.
Ultimately, the occurrence of the flapping phenomenon must be discussed based on numerical results. The main cause of the flapping phenomenon is considered to be cross-wind-induced wake. Assuming a representative diameter of 0.15 m, an atmospheric property of 293 K and
$u_{\textit{c}}$
= 2.0 m s−1, a Reynolds number (
$Re$
) is approximately 20,000. The well-known type of wake is the Kármán vortex, which appears behind a cylinder. Kourta et al. (Reference Kourta, Boisson, Chassaing and Minh1987) reported that velocity deficit regions appeared behind the cylinder for 2,000 <
$Re$
<16,000. There is a similarity in that the wake of a cross-wind causes the phenomenon. The next possibility is the puffing phenomenon in buoyant fires, which pulsates vertically. This cross-wind changes the direction of pulsating from vertical to the same direction as the cross-wind, and this pulsation also changes the timing of expansion and contraction of the left and right flames in the direction of the cross-wind. This pulsating phenomenon has been confirmed experimentally and numerically. The last effect that may have some influence is the lifting effect of the flame by the entrainment (streams (3)’, (4)’ and (2)’ in figure 15). These streams may collide with the flame and cause velocity fluctuations in the spanwise direction. However, a slight change in velocity is observed as shown in figure 16, but the effect on flame width is minor.
3.3. Scaling analysis
We have investigated this flapping phenomenon both experimentally and computationally. The following is a scaling analysis performed in this section, referring to the results in the previous sections to analyse the maximum width of the DDF in the spanwise direction (
$W_{{d}}$
). Note that the thermal and chemical effects of the DDF on the UDF are not taken into account because of the separation distance ranging from
$S/D=$
3 to 5, where these effects can be neglected. A set of controlling parameters
$W_{{d}}$
is listed as

where
$\rho _\infty$
and
$T_\infty$
are the density and temperature in ambient air,
$\unicode{x1D6E5} \rho$
and
$\unicode{x1D6E5} T$
are the difference between the ambient and the flame of density and temperature,
$C_{{\textit{p}},\infty}$
is the specific heat in ambient air,
$\rho _{{vap}}$
is the density of fuel vapour and
$\nu _{\mathrm{\infty }}$
is the kinematic viscosity in ambient air. Applying the Buckingham–
$\pi$
theorem in dimensional analysis to (3.10) yields

where
$\Pi _{i}$
are the dimensionless parameters:
$\Pi _8=W_{{d}}/D$
,
$\Pi _1=u_{\textit{c}}D/\nu _{\mathrm{\infty }}$
,
$\Pi _2=S/D$
,
$\Pi _3=\rho _{{vap}}/\rho _{\mathrm{\infty }}$
,
$\Pi _4=\dot {Q}_{{u}}/(\rho _{\mathrm{\infty }} C_{{\textit{p}},\infty} T_{\mathrm{\infty }} g^{1/2} D^{5/2})=\dot {Q}^\ast _{{u}}$
,
$\Pi _5=\dot {Q}_{{d}}/(\rho _{\mathrm{\infty }} C_{{\textit{p}},\infty} T_{\mathrm{\infty }} g^{1/2} D^{5/2})=\dot {Q}^\ast _{{d}}$
,
$\Pi _6=\unicode{x1D6E5} \rho /\rho _{\mathrm{\infty }}$
and
$\Pi _7=\unicode{x1D6E5} T/T_{\mathrm{\infty }}$
. Because
$\Pi _6$
and
$\Pi _7$
are constants in ordinary fires as suggested in Kuwana et al. (Reference Kuwana, Sekimoto, Saito and Williams2008) and Hartl & Smits (Reference Hartl and Smits2016). Re-arranging these dimensionless terms, equation (3.11) can be written as

Thus, the non-dimensional maximum width of the DDF could be expressed as


Figure 20. Schematic diagram showing the physics affecting the tandem flame-flapping behaviour under cross-wind in the spanwise direction.
Figure 20 shows the physical model of the spanwise flapping in the two modes by combining the above procedures. There are momentum exchanges between the flame and cross-wind due to the flame–cross-wind mixing, influenced by the ambient viscosity. Moreover, this viscosity effect may impact the pressure loss in the wake (Fric & Roshko Reference Fric and Roshko1994). That is,
$u_{\textit{c}}D/\nu _{\mathrm{\infty }}$
represents the same formula as a Reynolds number, indicating the ratio of cross-wind-induced inertia and ambient viscosity (Zhu Reference Zhu2009). As discussed at the end of § 3.2.3, the cross-wind-induced wake behind the UDF is a significant factor relevant to flame-oscillation and bifurcating phenomena in the spanwise direction (see figures 6, 12 and 16). Moreover,
$S/D$
affects the DDF flame width due to wake structures behind the UDF (see figures 6, 12 and 16).
$\dot {Q}^\ast _{{d}}/\dot {Q}^\ast _{{u}}$
(equal to
$\dot {Q}_{{d}}/\dot {Q}_{{u}}$
) with the same pool size is relevant to the velocity defect regions behind the UDF. For example, the cross-wind velocity ahead and behind the DDF increases for
$\dot {Q}_{{d}} \gt \dot {Q}_{{u}}$
(see figure 16(b), (c)). Therefore,
$\dot {Q}_{{d}}/\dot {Q}_{{u}}$
also impacts the wake structures behind the UDF (Chen et al. Reference Chen, Hu, Kuang, Zhang, Lin and Zhong2021). The parameter
$\dot {Q}^\ast _{{d}}$
is used as a fundamental parameter to determine flame geometry, such as flame height (Hamins et al. Reference Hamins, Konishi, Borthwick and Kashiwagi1996) and width (Lei et al. Reference Lei, Huang, Liu and Zhang2022a
), and hence should be taken into account. The value of
$\rho _{{vap}}/\rho _\infty$
implies the density ratio of gaseous fuel to the ambient fluid, which is also closely associated with the combustion and flame morphological behaviour (Hu et al. Reference Hu, Zhang, Delichatsios, Wu and Kuang2017). This density ratio is relevant to entrainment because the flame drags the surrounding air and supplies the oxidiser due to a difference in density. The occurrence and path of entrainment have already been discussed at the end of § 3.2.3 and in figure 15.
So far, relevant variables related to
$W_{{d}}$
have been discussed, but the same argument could be applied to the maximum width of the UDF and IDF. However, those are the lack of the effects by
$S/D$
and
$\dot {Q}_{{d}}/\dot {Q}_{{u}}$
. Their low lateral amplitudes are mainly influenced by the wake flow close to their flame tip region. Thus,
$W_{{u}}$
and
$W_{\textit{i}}$
could be expressed as the following functional correlation:

The experimental data are then statistically correlated by the proposed scaling law for the UDF, IDF and DDF, as illustrated in figure 21(a), (b), respectively. Based on the least square fit, the best fitting results for those above governing dimensionless parameters are reasonably represented by piecewise linear functions

where
$\Psi _1 = (u_{\textit{c}} D/\nu _{\mathrm{\infty }})^{-0.3}\dot {Q}^{\ast 0.3}_{\textit{u or i}} (\rho _{{vap}}/\rho _{\mathrm{\infty }})^{0.5}$
,
$\Psi _2 =(u_{\textit{c}} D/\nu _{\mathrm{\infty }})^{-0.3} \dot {Q}^{\ast 0.5}_{{d}}[(S/D)/(\dot {Q}^\ast _{{d}}/ \dot {Q}^\ast _{{u}})]^{0.2}$
$(\rho _{{vap}}/\rho _{\mathrm{\infty }})^{0.5} =$
$(u_{\textit{c}}D/\nu _{\infty })^{-0.3}\dot {Q}^{\ast 0.3}_{{d}} [(S/D)\dot {Q}^{\ast }_{{u}}]^{0.2}(\rho _{{vap}}/\rho _{\mathrm{\infty }})^{0.5}$
. The negative exponent of
$u_{\textit{c}} D/\nu _{\mathrm{\infty }}$
indicates that
$W$
becomes narrower with increasing
$u_{\textit{c}}$
, while the positive exponents of
$S/D$
,
$\dot {Q}^\ast _{{d}}$
and
$\dot {Q}^\ast _{{u}}$
signify the positive relationship against
$W_{{d}}$
, which is consistent with the results shown in figure 6. The unsteady flame–lapping behaviour of both fires in the spanwise direction is substantially characterised by invisible flow structures, as indicated by the oscillating mode and bifurcating mode, which are induced by the interaction between hot flame fluid and cross-wind fluid. Moreover, the wake vortical structure effects on
$W_{{d}}$
are reflected implicitly through
$S/D$
,
$\dot {Q}^\ast _{{u}}$
and
$u_{\textit{c}}D/\nu _{\mathrm{\infty }}$
. Note that the analysis mainly focuses on the relatively strong cross-wind (
$\geqslant 1.2$
m s−1). Vertical flame thermal buoyancy might mitigate the flame-flapping motion in the spanwise direction when the buoyancy and inertial force are of the same order of magnitude at a smaller
$u_{\textit{c}}$
.

Figure 21. Correlation of non-dimensional spanwise flame amplitude in terms of the proposed dimensionless group based on the physics, (a) UDF and IDF; (b) DDF.
4. Conclusions
This study experimentally and numerically investigated the flapping behaviour in the spanwise direction of tandem diffusion flames of varying separation distances (
$S/D=3-5$
) under a strong cross-wind effect. Both instantaneous lateral flame behaviour evolution as a function of time and time-averaged maximum flame width magnitude were quantified and analysed. Simulations following the experimental conditions were performed to understand better the phenomena observed in the experiments. Based on the involved physics, a scaling law was developed to characterise the maximum flame width.
From the observations, two modes of the DDF lateral flapping motion were identified. One was the oscillating mode, for which the downstream flame flapped under the action of the wake vortices of the UDF. Another was the bifurcating mode. Moreover, the flame alternated between oscillating and bifurcating modes. The movement of the upper and lower edges of the flame was more chaotic for the DDF compared with the UDF. As the cross-wind velocity increased, the amplitudes of the upper and lower edges decreased for both the UDF and DDF. Specifically, the amplitude of the DDF edge at 1.2 m s−1 was almost twice that at 3.0 m s−1. These time-averaged maximum flame widths were found to be nearly identical for both the UDF and IDF at the same heat release rate. However, the maximum flame width of the DDF was greater than that of the UDF and increased with increasing
$S/D$
due to the UDF’s widened and disentangled wake. The maximum flame width of the DDF is nearly 1.6 times that of the UDF when
$u_{\textit{c}}=2.0$
m s−1. Frequency analysis of flapping was performed at
$S/D$
= 3,
$u_{\textit{c}}$
= 1.2–3.0 m s−1, and
$\dot {Q}^\ast _{{u}}$
=
$\dot {Q}^\ast _{{d}}$
= 17.43 kW. The flapping of the UDF was generally around 0.2–1.8 Hz and did not change significantly at 1.2–3.0 m s−1. The flapping of the DDF was generally 0.5–2.2 Hz, with the frequency increasing as the cross-wind velocity increased. The frequency at which the mode switched was approximately 1–3 Hz, with higher frequencies and more frequent mode switching at a higher cross-wind velocity.
Next, our numerical simulation could reproduce both the oscillating mode and the bifurcating mode. Air was supplied by the cross-wind near or far from the fire source with ambient entrainment. The cross-wind near the fire source moved the fires in the cross-wind direction, while the cross-wind far from the fire source lifted them. Entrainment from the surroundings was used to lift the fire near the fire source. All streams and fires merged to form one large plume. Flapping occurred on the left and right sides of the UDF, and the effects of each propagated to the left and right sides of the DDF, respectively. Behind the burner, a region of velocity defects spread downstream. The causes of such flapping were turbulence caused by cross-winds, the puffing phenomenon seen in buoyant fires and collisions between the fires and an updraft generated below them. The misalignment or coincidence of flapping periods causes flapping. When a flame was viewed from the top, it was in the oscillating mode if the left and right flows were facing the same direction. In the bifurcating mode, they were facing the opposite direction. In addition, the flame appeared to be in the oscillating mode when the lengths of the left and right flames differed. In the oscillating mode, a single flame split into two flames, and in the bifurcating mode, the two flames merged. These phenomena occurred due to the difference in the flapping cycles of the left and right flames.
Finally, an attempt was made to conduct a scaling analysis using experimental observations and simulations to explain the flapping mechanism. The scaling analysis identified
$u_{\textit{c}}D/\nu _{\mathrm{\infty }}, S/D, \dot {Q}^\ast _{\textit{i, u, or, d}}$
and
$\rho _{{vap}}/\rho _{\mathrm{\infty }}$
as controlling variables, which can be correlated well with the proposed dimensionless groups, regarding the maximum flame width data.
This study provided the underlying knowledge of flapping of tandem diffusion flames in the spanwise direction under cross-wind conditions, which provides the information for determining the distance required for fire safety in scenarios such as fires in adjacent office buildings and houses. Attention to the flame-flapping phenomenon helps prevent the potential hazard of multiple fires.
Supplementary movies
Supplementary movies are available at https://doi.org/10.1017/jfm.2025.10182.
Funding
This research was supported by the National Natural Science Foundation of China (NSFC) under Grant Nos. 52225605 and 52306171, and by the Research Fund for International Excellent Young Scientists (Grant No. W2432034). We also acknowledge support from the Anhui Provincial Natural Science Foundation (Grant No. 2208085J34) and the CAS Pioneer Hundred Talents Program awarded to F.T.
Declaration of interests
The authors report no conflict of interest.
Author contributions
Yuhang Chen: Writing original draft, Investigation, Formal analysis, Data curation, Visualisation, Funding acquisition Kazui Fukumoto: Writing original draft, Writing review & editing, Software, Validation, Investigation, Formal analysis, Data curation, Visualisation, Funding acquisition Yanli Miao: Methodology, Investigation, Data curation Fei Tang: Resources, Conceptualisation, Funding acquisition. Longhua Hu: Writing review & editing, Supervision, Resources, Investigation, Funding acquisition.
Appendix A. Dynamic Smagorinsky model: incompressible vs compressible versions
A verification study comparing the incompressible and compressible dynamic Smagorinsky models (Moin et al. Reference Moin, Squires, Cabot and Lee1991) showed negligible differences in temperature rise and velocity distribution (figure 22), which indicates that the density correction applied to the incompressible model is sufficient for this study. Thus, the incompressible dynamic Smagorinsky model is adopted throughout this study without loss of accuracy.

Figure 22. (a) Temperature rise and (b) normalised velocity vs normalised coordinate using incompressible/compressible dynamic Smagorinsky model.

Figure 23. Computational domain for tandem square burners for
$S/D=4$
and
$S/D=5$
. Note that the coordinate origin (0, 0, 0) is on the square burner and UDF centres. Bolded texts indicate boundary conditions; see table 1 for each. The unit of length is mm.
Appendix B. Computational domains with
$\boldsymbol{S}\boldsymbol{/}\boldsymbol{D}$
= 4 and 5
Figure 23 shows computational meshes and domains with (a)
$S/D$
= 4 and (b)
$S/D$
= 5 for tandem square burners, where the names used in figure 23 (e.g. gas burner) for the boundary conditions are consistent in table 1. The burner shape was square with 150
$\times$
150 mm.
Appendix C. Effect of burner heights
Figure 24 shows (a) the computational domain for tandem square burners with
$H$
= 800 mm and
$S/D$
= 3 and (b) the predicted flame width (
$W_{{u}}$
,
$W_{{d}}$
) vs cross-wind velocity
$u_{\textit{c}}$
at burner heights of 0.4 and 0.8 m, with
$S/D$
= 3,
$\dot {Q}^\ast _{{u}}$
= 17.34 kW and
$\dot {Q}^\ast _{{d}}$
= 17.34 kW. For both burner heights, the flame width decreases with increasing cross-wind velocity
$u_{\textit{c}}$
, consistent with the entrainment flow being governed by the cross-wind conditions. While the burner height does influence the flame width to some extent, this effect is limited. Notably, for DDF at
$u_{\textit{c}}$
= 1.2 m s−1, the flame width is slightly shorter for the taller burner (0.8 m), but the effect is marginal. As the cross-wind velocity increases, the influence of burner height on the flame width becomes less significant. These results support the conclusion that, while the burner height has a slight effect, the cross-wind velocity remains the dominant factor influencing flame behaviour.

Figure 24. (a) Computational domain for tandem square burners for
$H = 800$
mm and
$S/D=3$
. Note that the coordinate origin (0, 0, 0) is on the square burner and UDF centres. Bolded texts indicate boundary conditions; see table 1 for each. The unit of length is mm. (b) The predicted normalised flame width for the UDF (
$W_{{u}}$
) and DDF (
$W_{{d}}$
) corresponding to
$S/D = 3$
,
$u_{\textit{c}}=1.2$
m s−1,
$\dot {Q}_{{u}}$
= 17.43 kW and
$\dot {Q}_{{d}}$
= 17.43 kW.