





1. Introduction
Heat transfer in internal flows is a subject of utmost relevance in mechanical and aerospace engineering applications. Typical applications include heat management in fuel cells, heat pumps, nuclear reactors, rocket nozzles and turbine blades. Accurate prediction of the heat transfer is necessary for design purposes, but the existing large scatter in experimental data makes it difficult to quantify the actual accuracy of semi-empirical predictive formulas, which are believed to have approximately  ${\pm }9\,\%$ uncertainty even for the simple case of smooth ducts with uniform heating (Rohsenow, Hartnett & Cho Reference Rohsenow, Hartnett and Cho1998). For duct shapes other than circular, the typical engineering approach is to use the same correlations, by replacing the pipe diameter with the hydraulic diameter of the duct (Kays & Crawford Reference Kays and Crawford1993; White & Majdalani Reference White and Majdalani2006). Although this is found to be rather successful in practice, it lacks solid theoretical foundations, which reflects into even higher uncertainty, of up to ${\pm }20\,\%$ (Shah & Sekulib Reference Shah and Sekulib1998).
Experiments of heat transfer in ducts are focused typically on the idealized case of uniform heating along the duct perimeter, notable examples including the studies of Brundrett & Burroughs (Reference Brundrett and Burroughs1967), Hirota et al. (Reference Hirota, Fujita, Yokosawa, Nakai and Itoh1997) and Modesti & Pirozzoli (Reference Modesti and Pirozzoli2022). However, many applications include cooling channels being subjected to non-uniform heating distributions. This is, for instance, the case for solar receivers (Candanedo, Athienitis & Park Reference Candanedo, Athienitis and Park2011), and for cooling channels of rocket nozzles (Nasuti, Torricelli & Pirozzoli Reference Nasuti, Torricelli and Pirozzoli2021), in which the coolant fluid receives most heating on one side. Although reduction of the heat transfer performance in these cases is to be expected on physical grounds as a result of symmetry breaking, it seems that a full explanation for the observational data is far from being reached. We believe that these large remaining uncertainties should be overcome in light of increasing constraints in the efficient use of energy. Whereas oversizing a thermal management system by  $20\,\%$ may be reasonable in some systems where weight is not a concern, it is certainly unacceptable in aerospace engineering.
High-fidelity numerical simulations of convective heat transfer are good candidates to support experiments in building fuller understanding of the physical mechanisms at play, and to sharpen current estimates of the heat transfer rates. Direct numerical simulations (DNS) have in fact been used extensively in recent years to analyse cases of symmetric heating, both for physical insight and to derive predictive heat transfer formulas (Pirozzoli, Bernardini & Orlandi Reference Pirozzoli, Bernardini and Orlandi2016; Abe & Antonia Reference Abe and Antonia2017, Reference Abe and Antonia2019; Wei Reference Wei2019; Alcántara-Ávila, Hoyas & Pérez-Quiles Reference Alcántara-Ávila, Hoyas and Pérez-Quiles2021). Specifically, relations for the scaling of the bulk temperature with the Reynolds number and the wall heat transfer coefficient at Prandtl number close to unity were derived by Abe & Antonia (Reference Abe and Antonia2017), whereas Prandtl number effects were considered by Abe & Antonia (Reference Abe and Antonia2019), Wei (Reference Wei2019) and Alcántara-Ávila & Hoyas (Reference Alcántara-Ávila and Hoyas2021).
Numerical simulations with non-symmetric heating are, on the other hand, quite limited, mainly dealing with flows inside square or rectangular ducts (Vázquez & Métais Reference Vázquez and Métais2002; Sekimoto et al. Reference Sekimoto, Kawahara, Sekiyama, Uhlmann and Pinelli2011; Kaller et al. Reference Kaller, Pasquariello, Hickel and Adams2019; Nasuti et al. Reference Nasuti, Torricelli and Pirozzoli2021). Nasuti et al. (Reference Nasuti, Torricelli and Pirozzoli2021) in particular was focused on convective heat transfer in a single rectangular cooling channel, with aspect ratio 3, accounting for conjugate heat transfer within the solid material. The main finding was a reduction of approximately  $12\,\%$ of the overall heat transfer as compared to the case of uniform heating. On the other hand, a recent study dealing with flow in a circular pipe with non-uniform heat load over the perimeter showed weak if any influence on the global Nusselt number (Straub et al. Reference Straub, Forooghi, Marocco, Wetzel and Frohnapfel2019). To the best of our knowledge, no DNS study has ever been carried out for planar channel flow with non-symmetric heating.
Given this background, the goal of the present study is to leverage on DNS to gain more complete understanding of the mechanisms underlying forced convection in the presence of non-symmetric heating, and to reduce persistent uncertainties in the prediction of even the most basic properties, such as the heat transfer coefficient. The case of a planar channel will be considered herein, with heating concentrated on one of the two walls. Sufficiently high Reynolds numbers are achieved, which are representative of a state of developed turbulence. The effect of molecular Prandtl number variation is also scrutinized, in the range  $0.025 \le {Pr} \le 4$. The present study is the continuation of previous efforts (Pirozzoli et al. Reference Pirozzoli, Bernardini and Orlandi2016, Reference Pirozzoli, Romero, Fatica, Verzicco and Orlandi2022; Modesti & Pirozzoli Reference Modesti and Pirozzoli2022) targeted to study forced thermal turbulent convection by means of DNS.
2. Methodology
Numerical simulations of fully developed turbulent flow in a plane channel are carried out, assuming periodic boundary conditions in the streamwise ( $x$) and spanwise ( $z$) directions. Several values of the bulk Reynolds number ( ${Re}_b = 2 h u_b / \nu$, with $u_b$ the bulk velocity, $h$ the channel half-height, and $\nu$ the fluid kinematic viscosity) are considered. The bulk velocity is kept strictly constant during the simulations through the use of a time-varying, spatially uniform body force. The incompressible Navier–Stokes equations are supplemented with the transport equation of passive scalars (hence buoyancy effects are disregarded), which are characterized in terms of their respective Prandtl number ${Pr} = \nu /\alpha$, where $\alpha$ is the scalar diffusivity. Although the study of passive scalars is relevant in several contexts, the main field of application here is heat transfer, therefore from now on we will refer to the passive scalar field as the temperature field (denoted $T$), and scalar fluxes will be interpreted as heat fluxes. Isothermal boundary conditions are assumed at the two walls of the channel, in the case of symmetric heating. In the case of one-sided heating, one of the two walls ( $y=0$) is isothermal, whereas adiabatic boundary conditions are assumed at the opposite wall ( $y=2 h$). The passive scalar equation is forced through a time-varying, spatially uniform source term (constant mean temperature (CMT) approach), so as to maintain the bulk temperature constant in time. Although the total heat flux resulting from the CMT approach is not strictly constant in time, it oscillates around its mean value under statistically steady conditions. Differences between the results obtained with the CMT and constant heat flux approaches were pinpointed by Abe & Antonia (Reference Abe and Antonia2017) and Alcántara-Ávila et al. (Reference Alcántara-Ávila, Hoyas and Pérez-Quiles2021), which although generally small, deserve some attention.
The computer code used for the DNS is based on the classical marker-and-cell method (Harlow & Welch Reference Harlow and Welch1965), whereby pressure and passive scalars are located at the cell centres, whereas the velocity components are located at the cell faces, thus removing odd–even decoupling phenomena and guaranteeing discrete conservation of the total kinetic energy and passive scalar variance in the inviscid limit. The Poisson equation resulting from enforcement of the divergence-free condition is solved efficiently by double trigonometric expansion in the periodic streamwise and spanwise directions, and inversion of tridiagonal matrices in the wall-normal direction (Kim & Moin Reference Kim and Moin1985). An extensive series of previous studies about wall-bounded flows from this group proved that second-order finite-difference discretization, in practical cases of wall-bounded turbulence, yields results that are by no means inferior in quality to those of pseudo-spectral methods (e.g. Pirozzoli et al. Reference Pirozzoli, Bernardini and Orlandi2016). The governing equations are advanced in time by means of a hybrid third-order low-storage Runge–Kutta algorithm, whereby the diffusive terms are handled implicitly, and convective terms are handled explicitly. The code was adapted to run on clusters of graphic accelerators, using a combination of CUDA Fortran and OpenACC directives, and relying on the CUFFT libraries for efficient execution of fast Fourier transforms (Ruetsch & Fatica Reference Ruetsch and Fatica2014; Pirozzoli et al. Reference Pirozzoli, Romero, Fatica, Verzicco and Orlandi2021).
Inner normalization of the flow properties will hereafter be denoted with the ‘+’ superscript, whereby velocities are scaled by the friction velocity  $u_\tau =\sqrt {\tau _w/\rho }$ (with $\tau _w$ the mean wall shear stress, and $\rho$ the fluid density), wall distances are scaled by the viscous length scale $\delta _v=\nu /u_\tau$, and temperatures are scaled by the friction temperature
 \begin{equation} T_{\tau} = \frac{\alpha}{u_{\tau}} \left\langle \frac {{\rm d} {T}}{{\rm d} y} \right\rangle_{y=0}, \end{equation}
where brackets denote averages in time and in the homogeneous space directions. In particular, the inner-scaled temperature is defined as  $\theta ^+ = (T_w-T)/T_{\tau }$, where $T$ is the local temperature, and $T_w$ is the temperature of the heated wall(s). Note that in this normalization, the non-dimensional temperature within the channel is positive, despite the fluid being cooler than at the heated wall. Finally, bulk values of streamwise velocity and temperature are defined as
 \begin{equation} u_b = \frac{1}{2h}\int_0^{2h} \langle u \rangle \, {\rm d} y , \quad T_b = \frac{1}{2h}\int_0^{2h} \langle T \rangle \, {\rm d} y . \end{equation}
From now on, capital letters will be used to denote flow properties averaged in the homogeneous spatial directions and in time, and lower-case letters will denote fluctuations from the mean. Instantaneous values will be denoted with a tilde, e.g.  $\tilde {u} = U + u$.
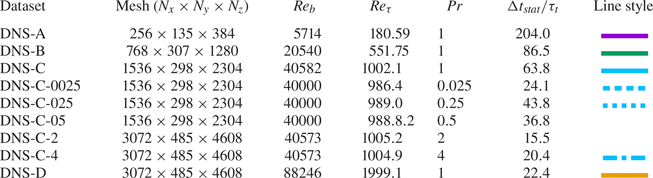
A list of the main simulations that we have carried out is given in table 1, all of which were computed in a  $6 {\rm \pi}h \times 2 h \times 2 {\rm \pi}h$ box. Flow cases from A to D are meant to explore the effects of friction Reynolds number increase up to ${Re}_{\tau } =h/\delta _v= 2000$, for unit Prandtl number. The mesh resolution for these cases is designed based on the criteria discussed by Pirozzoli & Orlandi (Reference Pirozzoli and Orlandi2021). In particular, the collocation points are distributed in the wall-normal direction so that approximately thirty points are placed within $y^+ \le 40$, with the first grid point at $y^+ < 0.1$, and the mesh is stretched progressively in the outer wall layer in such a way that the mesh spacing is proportional to the local Kolmogorov length scale, which there varies as $\eta ^+ \approx 0.8 \, {y^+}^{1/4}$ (Jiménez Reference Jiménez2018). Based on experience accumulated in a number of previous studies, the grid resolution in the wall-parallel directions is set to $\Delta x^+ \approx 8.2$, $\Delta z^+ \approx 4.1$. Flow case C was considered to address Prandtl number variations at fixed Reynolds number ${Re}_{\tau } \approx 1000$. Six values of the Prandtl number are considered, from ${Pr} = 0.025$ (which is representative of mercury) to ${Pr} = 4$ (not far from the typical value of water), and a finer mesh is used for flow cases DNS-C-2 and DNS-C-4, so as to satisfy restrictions on the Batchelor scalar dissipative scale, whose ratio to the Kolmogorov scale is approximately ${Pr}^{-1/2}$ (Batchelor Reference Batchelor1959; Tennekes & Lumley Reference Tennekes and Lumley1972). According to established practice (Hoyas & Jimenez Reference Hoyas and Jimenez2006; Ahn et al. Reference Ahn, Lee, Kang, Lee and Sung2015; Lee & Moser Reference Lee and Moser2015), the time intervals used to collect the flow statistics ( $\Delta t_{stat}$) are reported as a fraction of the eddy-turnover time ( $h/u_{\tau }$). All the DNS listed in table 1 were also repeated for the case of symmetric heating, which is considered for reference.
Table 1. Flow parameters for DNS of channel flow. Cases are labelled in increasing order of Reynolds number, from A to D. Case C was repeated on various meshes to investigate effects of Prandtl number variation, by considering  ${Pr}=0.5, 1, 4$. Here, $N_x$, $N_y$, $N_z$ denote the numbers of grid points in the streamwise, wall-normal and spanwise directions, respectively. Simulations are performed in a computational domain with size $6 {\rm \pi}h \times 2 h \times 2 {\rm \pi}h$, ${\Delta t}_{stat}$ indicates the time-averaging interval, and $\tau _t=h/u_\tau$ denotes the eddy turnover time.
The sampling errors for some key properties discussed in this paper have been estimated using the method of Russo & Luchini (Reference Russo and Luchini2017), based on extension of the classical batch means approach. Additional tests aimed at establishing the effect of streamwise domain length and grid size have been carried out for the DNS-C flow case. The results of the uncertainty estimation analysis are very similar to those reported in Pirozzoli et al. (Reference Pirozzoli, Romero, Fatica, Verzicco and Orlandi2022), and are not reported here. Basically, the estimated sampling and discretization errors are  $0.2\,\%$ for the Nusselt number, $0.4\,\%$ for the channel centreline temperature, and $0.7\,\%$ for the peak temperature variance.
3. Temperature field and statistics at unit Prandtl number
We begin by inspecting the instantaneous temperature fields in a cross-stream plane in figure 1. As is well established (Kim & Moin Reference Kim and Moin1989; Kawamura et al. Reference Kawamura, Ohsaka, Abe and Yamamoto1998; Antonia, Abe & Kawamura Reference Antonia, Abe and Kawamura2009; Pirozzoli et al. Reference Pirozzoli, Bernardini and Orlandi2016; Alcántara-Ávila, Hoyas & Pérez-Quiles Reference Alcántara-Ávila, Hoyas and Pérez-Quiles2018), the organization of the temperature field in the case of symmetric heating (figure 1b) closely resembles that of the streamwise velocity field (figure 1a). Specifically, large towering eddies are observed that are attached to the walls and convey low-speed, hot fluid from the near-wall region towards the channel core. Likewise, return incursions of cold fluid from the core flow towards the walls are also observed. Similarity is partly impaired in the presence of one-sided heating (figure 1c). In this case, the temperature field includes large-scale fluctuations that seem to protrude from the bottom heated wall farther than the channel centreline, well into the upper half of the channel where temperature is more uniform.

Figure 1. Flow case D ( ${Pr}=1$): instantaneous cross-stream fields of streamwise velocity (a,c) and temperature (b,d), for symmetric heating (a,b) and one-sided heating from the bottom (c,d), for (a,c) $\tilde {u}^+$, and (b,d) $\tilde {\theta }^+$.
In order to explain quantitatively the different flow organization in the case of symmetric and one-sided heating, in figure 2 we show the spectral maps of  $u$,
$u$,  $v$ and $\theta$ for the DNS-D flow case, as a function of the spanwise wavelength ( $\lambda _z$) and wall distance. The spectral densities of the streamwise velocity clearly bring out a two-scale organization of the flow field, with a near-wall peak associated with the wall regeneration cycle (Jiménez & Pinelli Reference Jiménez and Pinelli1999), and an outer peak associated with outer-layer, large-scale motions (Hutchins & Marusic Reference Hutchins and Marusic2007). The latter peak is found to be centred around $y/h \approx 0.3$, and to correspond to eddies with typical wavelength $\lambda _{z} \approx 1.5 h$ (Abe, Kawamura & Choi Reference Abe, Kawamura and Choi2004; del Álamo et al. Reference del Álamo, Jiménez, Zandonade and Moser2004). Very similar organization is also found for the temperature field in the symmetric heating case (figure 2c), the main difference being a somewhat less pronounced large-scale peak. Both the streamwise velocity and the temperature field exhibit a prominent spectral ridge corresponding to modes with typical spanwise length scale $\lambda _{z} \sim y$, here encompassing over one decade of length scales, which can be interpreted as the footprint of a hierarchy of wall-attached eddies after Townsend's model (Townsend Reference Townsend1976; Marisic, Baars & Hutchins Reference Marisic, Baars and Hutchins2017). The wall-normal velocity spectrum, shown in figure 2(b), has a similar organization, however the inner-layer peak occurs farther from the wall, and no outer-layer peak is visible. Furthermore, relatively more energy is found at the channel centreline, which is a hint of non-negligible turbulent transport across the two parts of the channel. Similarity between $u$ and $\theta$ is also confirmed in the near-wall region for the case of one-sided heating (figure 2d). Clear differences in the temperature spectra, however, arise far from the wall, as in the symmetric heating case very little energy is present around the channel centreplane, where the mean temperature gradient is zero. In the one-sided heating case, a distinct secondary peak of the spectral density is instead present far from the wall, and energy is still significant at $y \approx h$, with structures that tend to be larger than in the symmetric case. As expected, little energy is found near the upper wall, where the mean temperature gradient is zero. These marked differences can be explained as being due to the fact that production of temperature variance is different from zero throughout the channel, as the mean temperature is decreasing monotonically. Hence large-scale features may be present in the temperature field that are not present in the streamwise velocity field.

Figure 2. Variation of pre-multiplied spanwise spectral densities with wall distance for  $u$ (a), $v$ (b), and for $\theta$ under symmetric (c) and non-symmetric (d) heating conditions, flow case DNS-D ( ${Re}_{\tau }=2000$, ${Pr}=1$). Wall distances ( $y$) and spanwise wavelengths ( $\lambda _z$) are reported both in inner units (bottom, left), and in outer units (top, right). The dashed diagonal line marks the trend $\lambda _z = 6.1 y$. Contour levels from 0.2 to 2.0 are shown, in intervals of 0.2.
For all the flow cases, both the mean velocity (see Pirozzoli et al. Reference Pirozzoli, Bernardini and Orlandi2016) and the mean temperature exhibit near-logarithmic layers, namely
 \begin{equation} U^+= \frac 1k \log y^++ B, \quad \varTheta^+= \frac 1{k_{\theta}} \log y^{+}+ \beta({Pr}) , \end{equation}
where  $\beta$ accounts for change of the offset of the logarithmic layer with the Prandtl number (Kader & Yaglom Reference Kader and Yaglom1972). The temperature profiles at ${Pr}=1$ are shown in figure 3, which are both compared with (3.1a,b) by using $k_{\theta }=0.459$ (same as in pipe flow; Pirozzoli et al. Reference Pirozzoli, Romero, Fatica, Verzicco and Orlandi2022), with an additive constant resulting from best fitting $\beta (1) = 6.14$, a bit less than in pipe flow. Small deviations of the mean velocity and temperature profiles from a genuine logarithmic behaviour were observed in a number of previous studies (e.g. Afzal & Yajnik Reference Afzal and Yajnik1973; Lee & Moser Reference Lee and Moser2015; Pirozzoli et al. Reference Pirozzoli, Bernardini and Orlandi2016; Luchini Reference Luchini2017), in the form of an additive linear term whose slope decreases in wall units, hence the logarithmic law should be recovered only in the infinite Reynolds number limit. Despite those deviations, the logarithmic law is found to provide a very good working approximation for the mean temperature profile throughout the outer wall layer in the case of symmetric heating. A logarithmic layer is also distinctly present in the case of one-sided heating; however, deviations are much larger in that case, starting at $y/h \approx 0.2$, and the wake region is much more prominent.
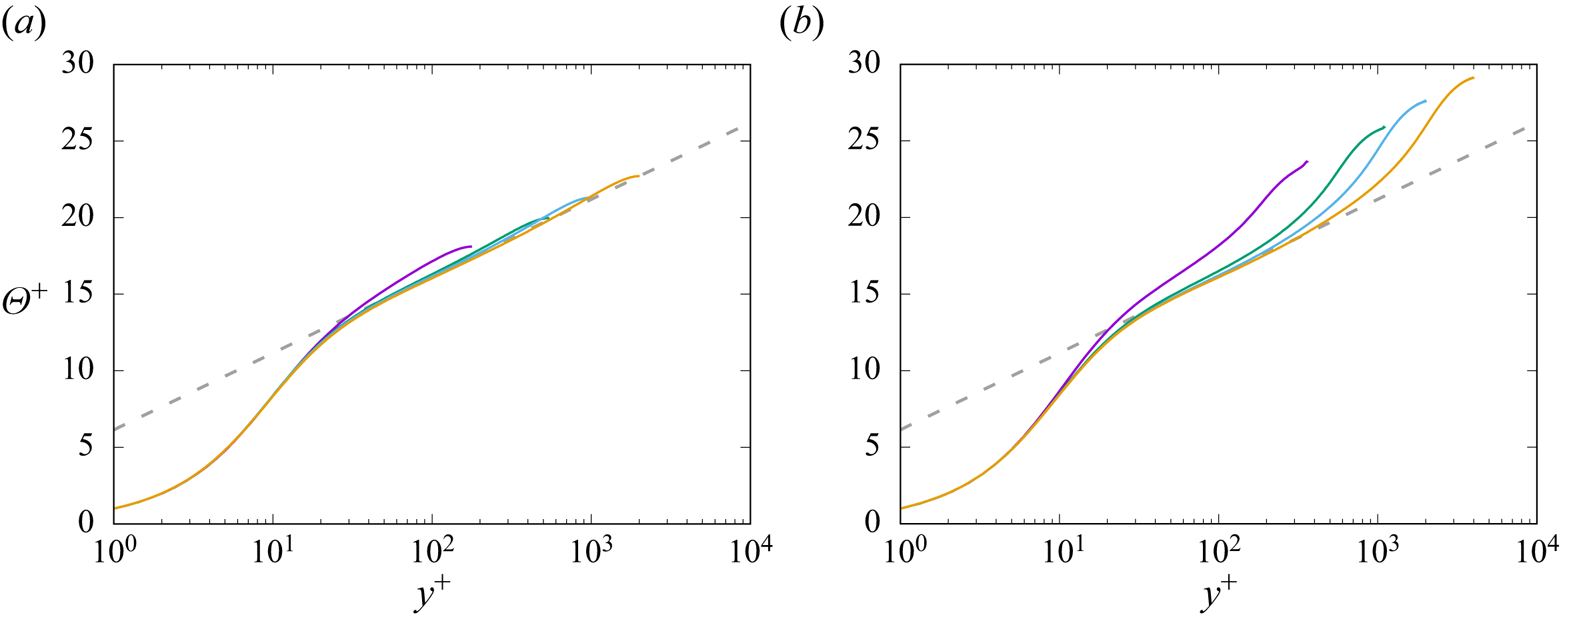
Figure 3. Inner-scaled mean temperature profiles for the case of symmetric (a) and one-sided (b) heating, at  ${Pr}=1$. The dashed line denotes the reference logarithmic law $\varTheta ^+ = \log y^+ / 0.459 + 6.14$. See table 1 for colour codes.
The temperature profiles are shown in defect form in figure 4, referred to either the centreline temperature in the case of symmetric heating, or the mean temperature at the adiabatic wall in the case of one-sided heating. In both cases, the reference temperatures correspond to the maximum values of  $\varTheta$, which are hereafter denoted with the $e$ subscript. Tendency towards outer-layer universality is clear – however, starting later ( ${Re}_{\tau } \gtrsim 1000$) in the case of one-sided heating. As noted in previous studies (Pirozzoli et al. Reference Pirozzoli, Bernardini and Orlandi2016), the defect temperature distributions can be represented conveniently in terms of compound parabolic/logarithmic distributions, namely
 $$\begin{gather} \varTheta^+_e-\varTheta^+= \beta_1 - \frac{1}{k_{\theta}} \log \eta, \end{gather}$$
 $$\begin{gather}\varTheta^+_e-\varTheta^+= C \left( 1 - \eta \right)^2, \end{gather}$$
where  $\eta =y/h$, with matching taking place at $\eta =\eta ^*$. The parabolic distribution (3.2b) well describes the wake part of the profiles, with the exception of the lowest ${Re}$ case, and as previously noticed, the associated curvature is much larger in the one-sided heating case than in the symmetric case. A similar composite representation also fits the mean streamwise velocity distributions (see Pirozzoli et al. Reference Pirozzoli, Bernardini and Orlandi2016). The parameters for the universal defect mean velocity and temperature distributions as determined from DNS data fitting are listed in table 2.
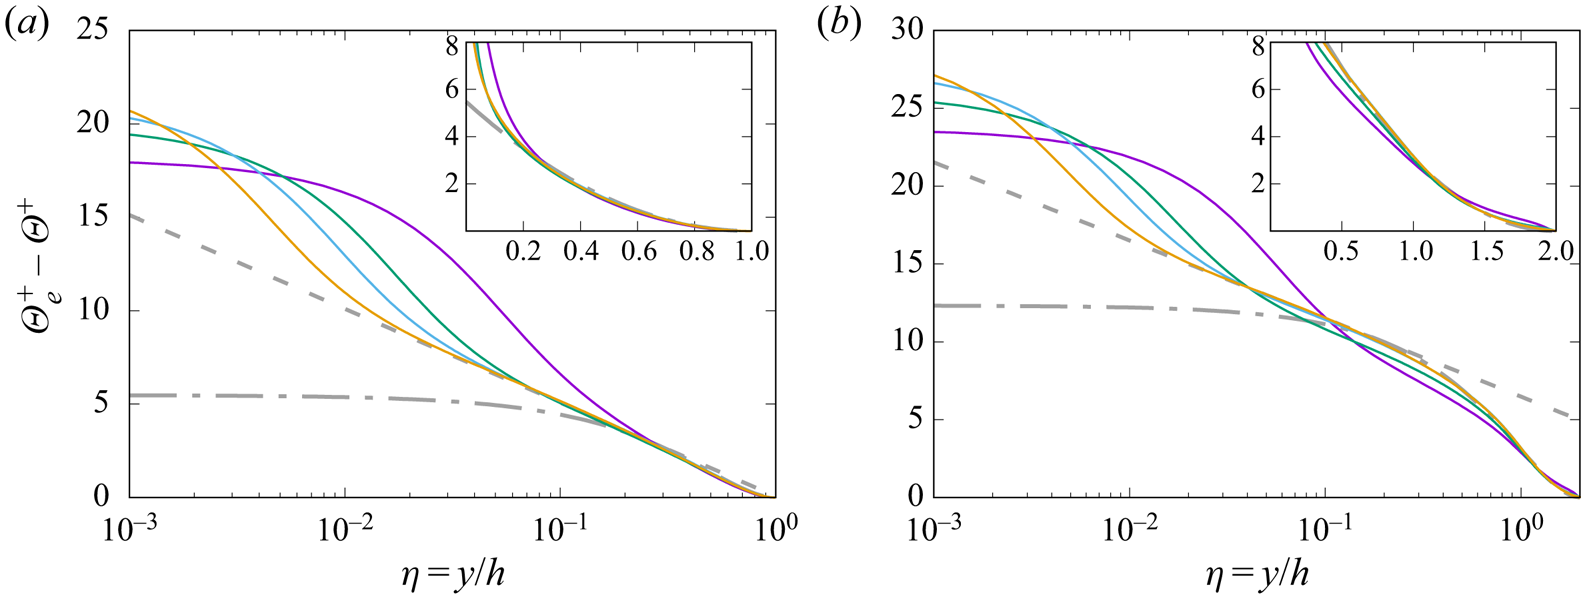
Figure 4. Defect mean temperature profiles for the case of symmetric (a) and one-sided (b) heating, at  ${Pr}=1$. The dash-dotted grey lines mark a parabolic fit of the DNS data ( $\varTheta _e^+-\varTheta ^+ = C (1-\eta )^2$, with $C=5.48$ in (a), and $C=12.3$ in (b)), and the dashed lines mark the outer-layer logarithmic profile $\varTheta _e^+-\varTheta ^+ = \beta _1 - (1/k_{\theta }) \log \eta$, with $\beta _1=0.0667$ in (a), and $\beta _1=6.48$ in (b). The insets depict the same distributions in linear scale. See table 1 for colour codes.
Table 2. Values of the universal parameters for mean temperature and streamwise velocity profiles as extracted from the DNS, to be used in (3.1a,b), (3.2a), (3.2b), (3.3a,b).

An important complement of the previous results are the trends of the maximum mean velocity and temperature with the Reynolds number, which are shown in figure 5(a). As noted by Schlichting (Reference Schlichting1979), these properties exhibit logarithmic variation with  ${Re}_{\tau }$, which follows from combining (3.1a,b) and (3.2a):
 \begin{equation} U_{e}^+= \frac 1{k} \log {Re}_{\tau} + B + B_1, \quad \varTheta_{e}^+= \frac 1{k_{\theta}} \log {Re}_{\tau} + \beta ({Pr}) + \beta_1, \end{equation}
with fitting constants given in table 2. Figure 5 visually confirms differences of the von Kármán constant for the velocity and temperature fields, as well as much larger values of the maximum temperature in the one-sided heating case. Logarithmic trends of the bulk velocity and mixed mean temperature were inferred by Abe & Antonia (Reference Abe and Antonia2016, Reference Abe and Antonia2017), for isothermal walls with  $Pr \approx 1$, using a global energy balance analysis. They obtained $k = 0.39$ and $k_{\theta } = 0.46$, which agree well with the present results. Those authors found that logarithmic trends of $u_b^+$ and $\theta _m^+$ start at lower ${Re}_{\tau }$ than needed to observe logarithmic layers in the mean velocity and mean temperature profiles, and attributed the reason to the presence of a $1/{Re}_{\tau }$ term in the scaling laws of the energy dissipation and scalar dissipation rate, which was also considered by Luchini (Reference Luchini2017) for the scaling of the mean velocity, and by Spalart & Abe (Reference Spalart and Abe2021) for the scaling of the Reynolds stresses and their budgets terms. Consistent with their findings, figure 5(b) shows a logarithmic ${Re}_{\tau }$ dependence even at modest Reynolds number.
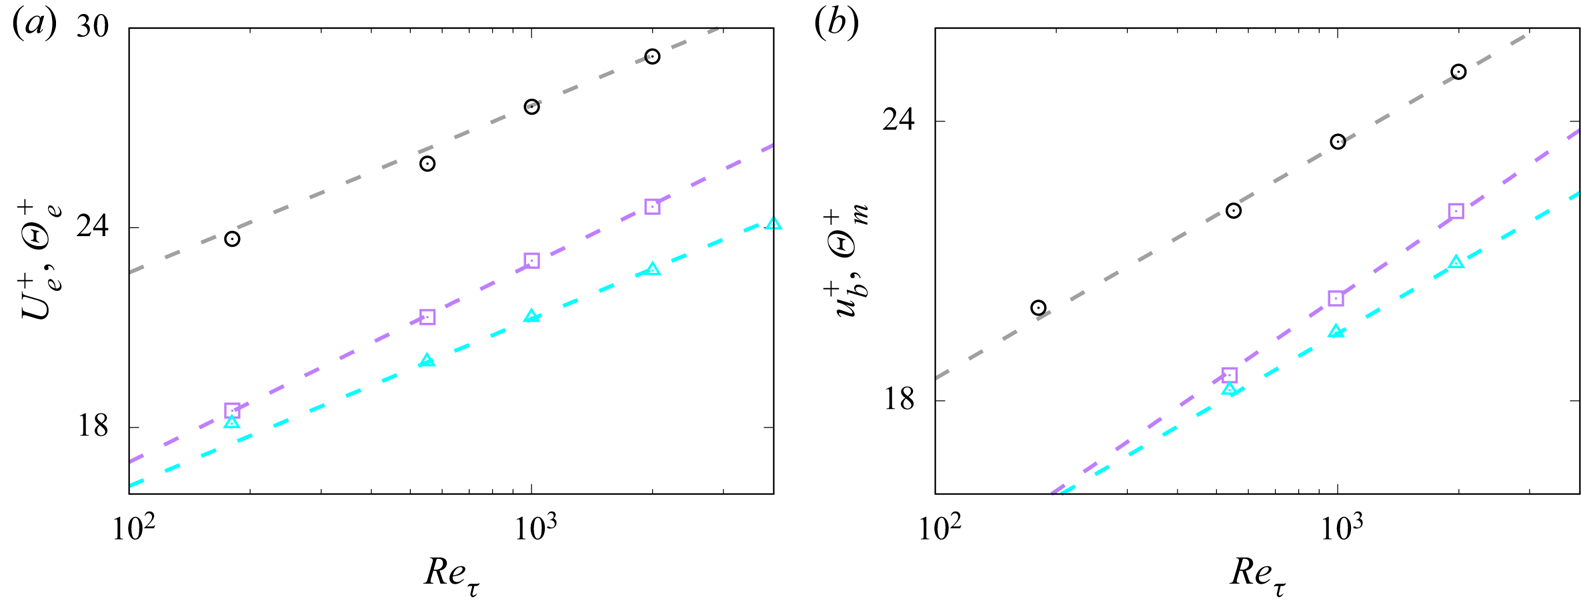
Figure 5. Maximum (a) and bulk mean (b) values of streamwise velocity (squares) and temperature for symmetric heating (triangles) and one-sided heating (circles), at  ${Pr}=1$. The dashed lines in (a) denote logarithmic fits of the DNS data after (3.3a,b), with coefficients given in table 2. The dashed lines in (b) denote logarithmic fits of the bulk values as suggested by Abe & Antonia (Reference Abe and Antonia2016, Reference Abe and Antonia2017).
The temperature variances are shown in figures 6(a,b). In the case of symmetric heating, the temperature variances exhibit a near-wall peak in the buffer layer, followed by monotonic decrease towards the centreline. A similar behaviour is here observed in the one-sided heating case, with near-wall peak amplitudes that increase nearly as the logarithm of  ${Re}_{\tau }$, and with absolute value that is a bit higher than in the symmetric case for given ${Re}_{\tau }$. Another notable feature of the one-sided heating case is the occurrence of a secondary peak of the temperature variance at $y \approx h$, which is not present in the case of symmetric heating. In order to clarify the reasons for the observed differences, in figures 6(c,d), we show the distributions of the temperature variance production term $P_{\theta } = - \langle v \theta \rangle \,{\rm d} \varTheta / {\rm d} y$. This quantity seems to be completely unaffected by the thermal forcing in the near-wall region, where the distributions for the symmetric and one-sided cases are identical. Differences, however, arise far from the wall, and the pre-multiplied distribution of $P_{\theta }$ attains a peak at $y/h \approx 1$ in the one-sided heating case, whose position matches very well the outer peak observed in the temperature variance. By also recalling the spectra in figure 2, it is quite clear that the outer peak in the temperature variance is rooted in the formation of large structures in the temperature field that cannot be present in the streamwise velocity field, and the higher temperature variance in the near-wall region is due to long-wavelength energy associated with the outer energy site.
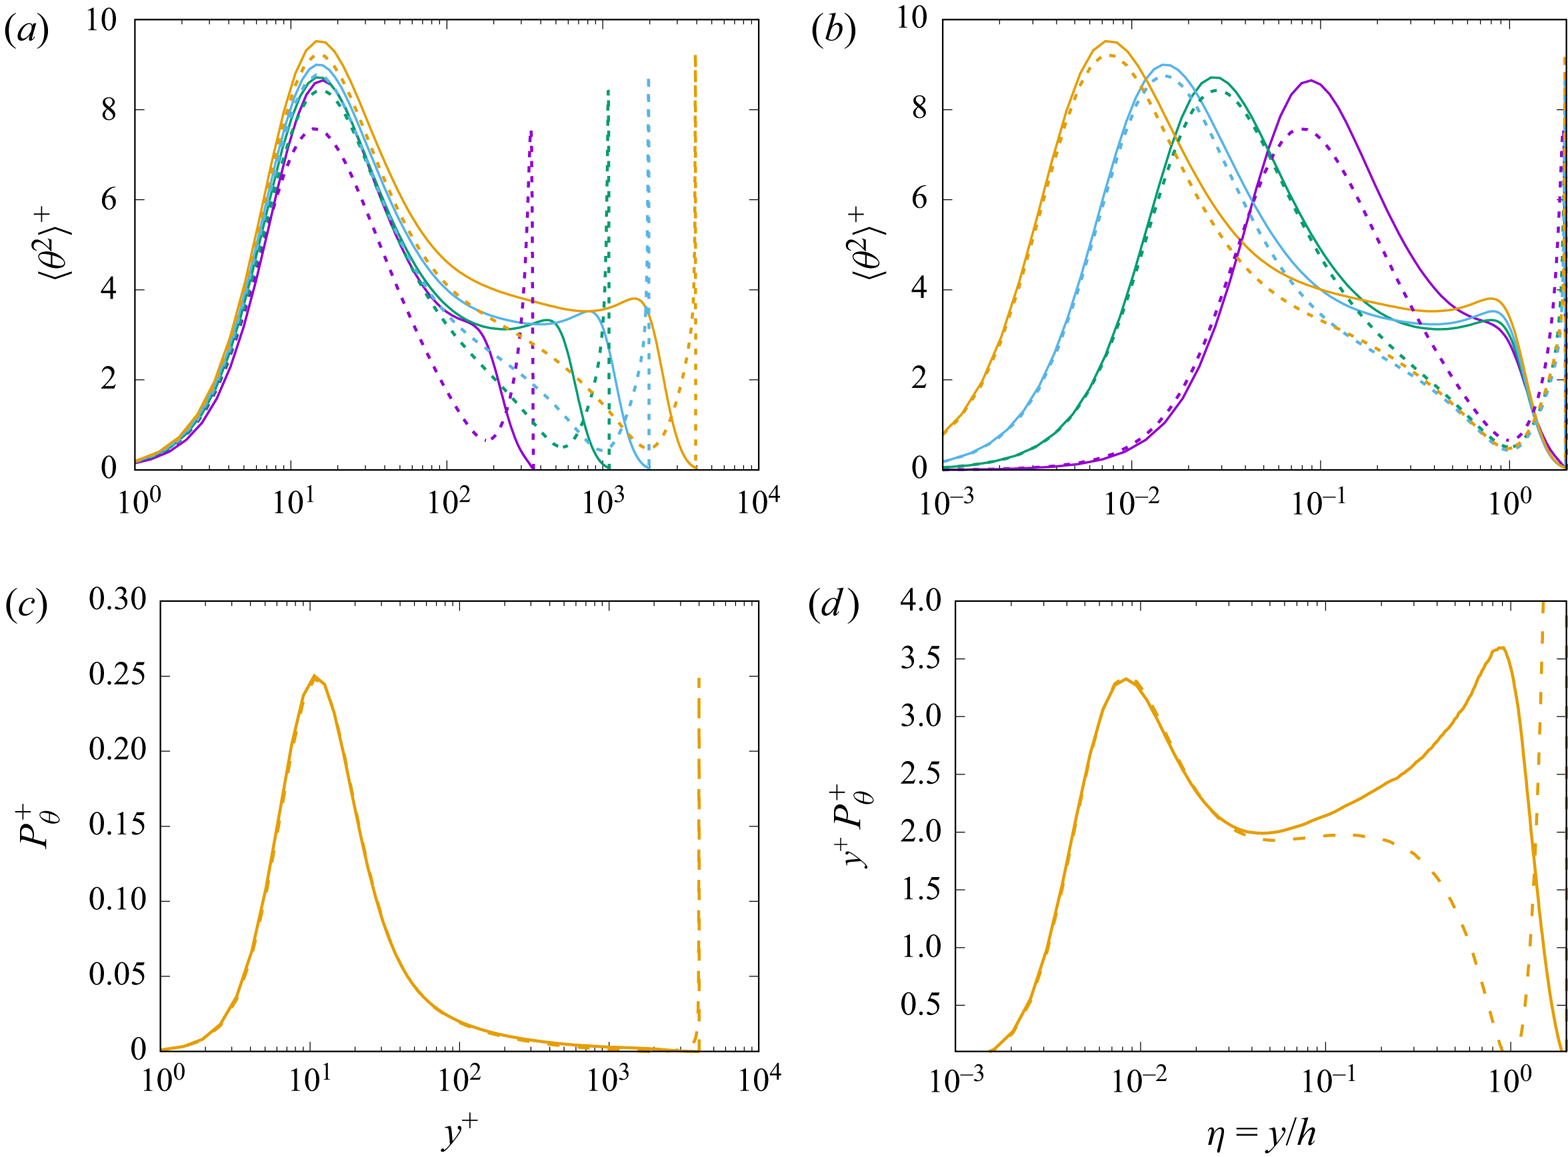
Figure 6. Distribution of temperature variances in inner (a), and outer (b) coordinates, at various  ${Re}_{\tau }$ values, for ${Pr}=1$. Solid lines denote cases with one-sided heating, and dashed lines denote cases with symmetric heating. Refer to table 1 for colour codes. In (c) we show the thermal energy production term $P_{\theta } = - \langle v \theta \rangle \,{\rm d} \varTheta / {\rm d} y$, as a function of $y^+$, for flow case DNS-D, and in (d) the same term is shown in pre-multiplied form, as a function of $\eta =y/h$.
4. Heat transfer coefficients
The primary subject of practical interest in the study of forced convection is the heat transfer coefficient at the wall, which can be expressed in terms of the Stanton number,
 \begin{equation} {St} = \frac{\alpha \left\langle \dfrac {{\rm d} T}{{\rm d} y} \right\rangle_w}{u_b ( T_m - T_w )} = \frac 1{u_b^+ \theta_m^+}, \end{equation}
where  $T_m$ is the mixed mean temperature (Kays, Crawford & Weigand Reference Kays, Crawford and Weigand1980),
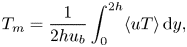 \begin{equation} T_m = \frac{1}{2 h u_b} \int_0^{2h} \langle u T \rangle \, {\rm d} y , \end{equation}
and  $\theta ^+_m = (T_w-T_m)/T_{\tau }$, or more frequently in terms of the Nusselt number,
 \begin{equation} {Nu} = {Re}_b \, {Pr} \, {St}. \end{equation}
Predictive formulas for the heat transfer coefficient can be derived readily based on the analytical expressions for the mean temperature and velocity profiles developed in the previous section, by neglecting the presence of viscous and conductive sublayers. As is evident in figure 7, the proposed expressions fit the data quite well, with the exception of the lowest Reynolds number case, thus supporting the validity of this assumption. In particular, inserting (3.2) and (3.3a,b), as well as their counterparts for the velocity field, into (4.1), an explicit formula can be obtained for the inverse Stanton number as a function of the friction Reynolds number. With the set of universal constants given in table 2, the final expression is
 \begin{equation} 1/{St} = 1.593 + 2.12 \, \beta({Pr}) + ({-}0.597 + 2.58 \, \beta({Pr})) \log {Re}_{\tau} + 5.64 \log^2 {Re}_{\tau} \end{equation}
in the case of symmetric heating, and
 \begin{equation} 1/{St} = 7.89 + 2.12 \, \beta({Pr}) + (10.5 + 2.58 \, \beta({Pr})) \log {Re}_{\tau} + 5.64 \log^2 {Re}_{\tau} \end{equation}
in the case of one-sided heating, with Prandtl number dependence absorbed into the unknown function  $\beta ({Pr})$. A relation similar to (4.4) would be obtained by multiplying logarithmic relations for $u_b^+$ by that for $\theta _m^+$, as proposed by Abe & Antonia (Reference Abe and Antonia2017) for $Pr \approx 1$. In fact, logarithmic fitting of the present DNS data shown in figure 5(b) yields the dotted line in figure 7, which is virtually indistinguishable from the prediction of (4.4). However, the latter retains the advantage of incorporating the dependence on the Prandtl number through the logarithmic offset function $\beta ({Pr})$, which will be discussed next.
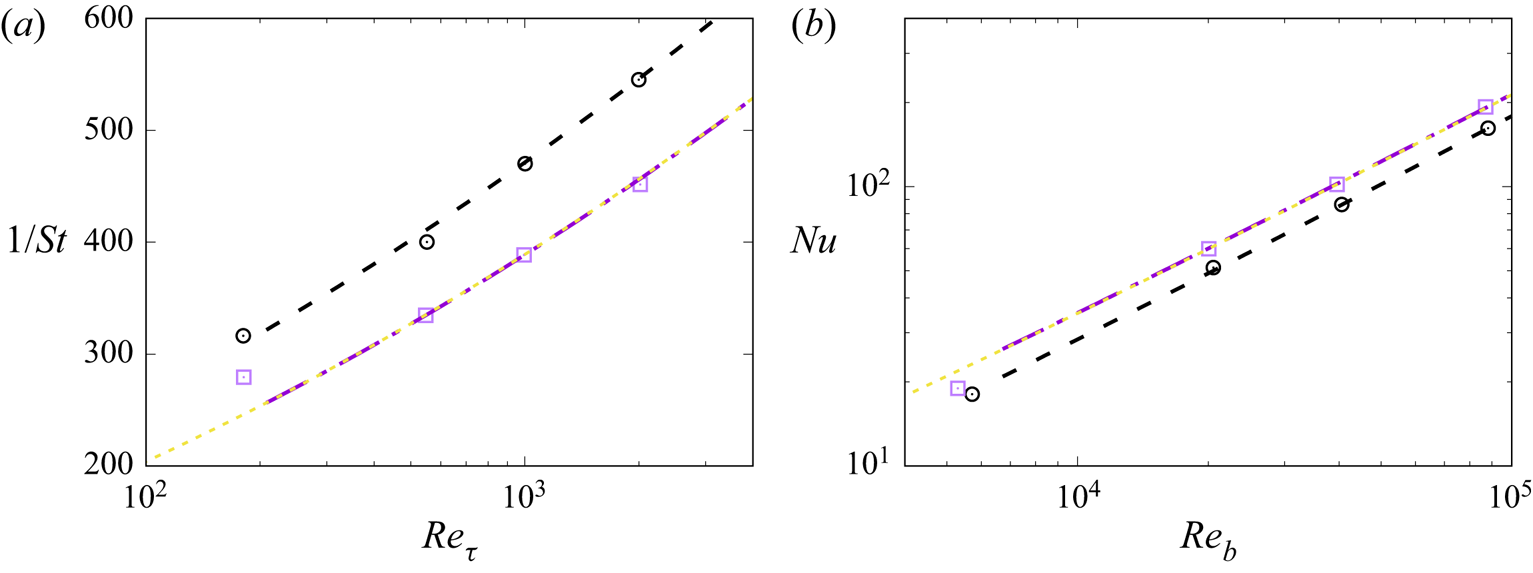
Figure 7. Variation of inverse Stanton number (a) and Nusselt number (b), with Reynolds number, for  ${Pr}=1$. The DNS data for the symmetric case are denoted with square symbols, and those for one-sided heating with circles. The dashed lines denotes the correlation (4.4), the dash-dotted lines the correlation (4.5), and the dotted lines the predicted heat transfer coefficients obtained from logarithmic fit of $u_b^+$ and $\theta _m^+$ in the case of symmetric heating (Abe & Antonia Reference Abe and Antonia2017).
5. Prandtl number effects
The effects of Prandtl number variation have been considered by carrying out DNS at fixed  ${Re}_{\tau }=1000$, up to ${Pr}=4$ (DNS-C-4). Some qualitative effects are shown in figure 8. At very low Prandtl number (figure 8a), turbulence is barely capable of perturbing the otherwise purely diffusive behaviour of the temperature field. As expected, increase of the Prandtl number yields a reduction of the thickness of the conductive sublayer, hence large temperature variations tend to be more confined to the wall vicinity. The presence of details on a finer scale is also evident at increasing ${Pr}$, on account of the previously noted reduction of the Batchelor scale. Other than that, the large-scale organization of the temperature field is qualitatively similar, reflecting outer-layer similarity.
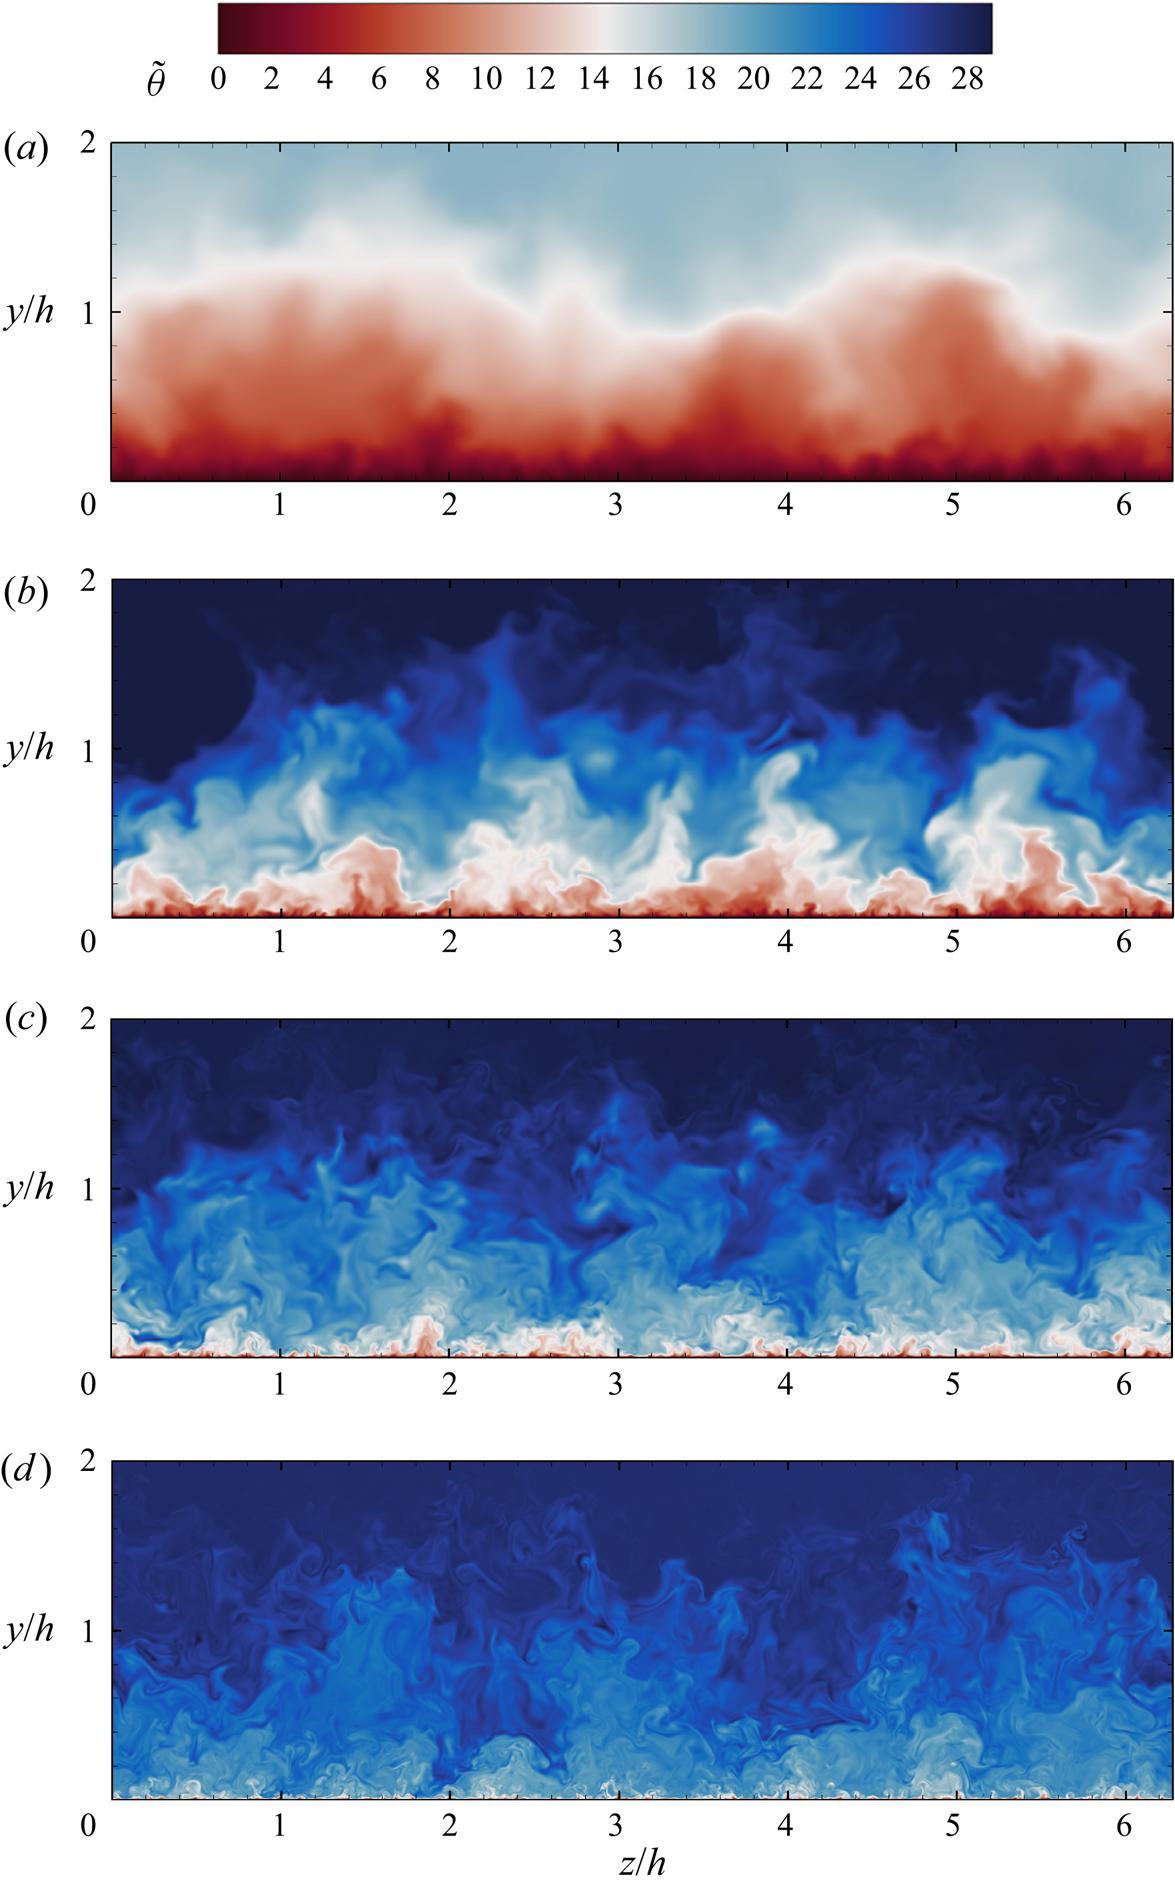
Figure 8. Instantaneous temperature fields in a cross-stream plane for one-sided heating at  ${Re}_{\tau }=1000$, for ${Pr}=0.025$ (DNS-C-025, a), ${Pr}=0.25$ (DNS-C-0025, b), ${Pr}=1$ (DNS-C, c), and ${Pr}=4$ (DNS-C-4, d).
The effect of Prandtl number variation on the mean temperature profiles is analysed in figure 9. As expected, universality is not achieved in inner scaling (figure 9a), as the asymptotic behaviour in the conductive sublayer is  $\varTheta ^+ \approx {Pr} \, y^+$ (Kawamura et al. Reference Kawamura, Ohsaka, Abe and Yamamoto1998). As a result, the temperature profiles in the outer layer are offset by a significant amount, as quantified through function $\beta ({Pr})$ in (3.1a,b). All flow cases exhibit a near-logarithmic layer, with the exception of the ${Pr}=0.025$ case. The defect representation shown in figure 9(b) continues to support outer-layer universality, which is robust to both Reynolds and Prandtl number variations.
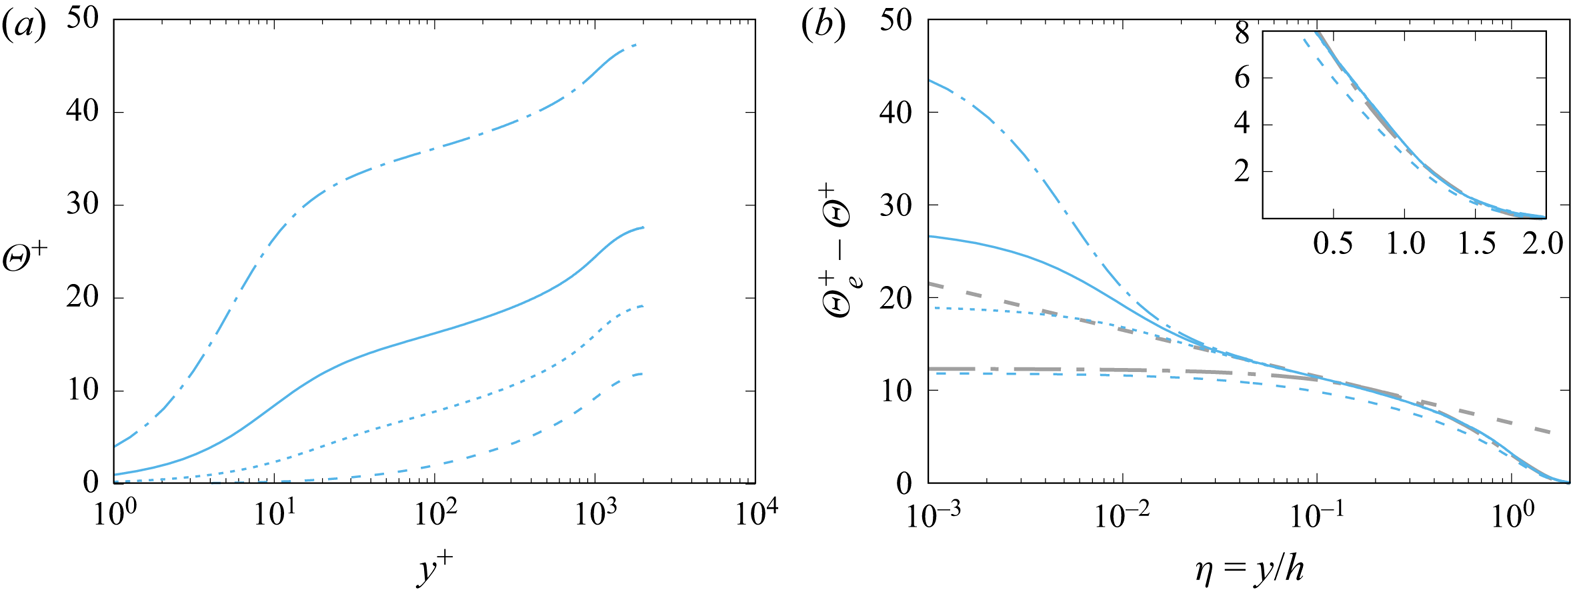
Figure 9. Inner-scaled mean temperature profiles (a) and defect temperature profiles (b), for one-sided heating, at  ${Re}_{\tau }=1000$. Refer to table 1 for line styles. In (b), the dash-dotted grey line marks a parabolic fit of the DNS data $\varTheta _e^+-\varTheta ^+ = C (1-\eta )^2$, with $C=12.3$, and the dashed lines mark the outer-layer logarithmic profile $\varTheta _e^+-\varTheta ^+ = \beta _1 - (1/k_{\theta }) \log \eta$, with $\beta _1=8.48$. The inset depicts the same distributions in linear scale.
In order to derive a convenient expression for the logarithmic offset function  $\beta ({Pr})$, we start from the functional form suggested by Kader & Yaglom (Reference Kader and Yaglom1972),
 \begin{equation} \beta({Pr}) = b_2 + b_1\,{Pr}^{\alpha} + \frac 1{k_{\theta}} \log {Pr}, \end{equation}
with  $\alpha =2/3$, and $b_1,b_2$ parameters to be determined from fitting experimental data. Based on (3.3a,b), we note that fixing ${Re}_{\tau }$ (here we set ${Re}_{\tau }=1000$), $\beta ({Pr})$ can be obtained by fitting the distribution of the maximum temperature $\varTheta _e^+$, as shown in figure 10. The fitting coefficients $b_1, b_2$, have been determined based on the DNS data for the symmetric heating case, and are reported in table 2. It is then quite satisfactory that the same function $\beta ({Pr})$ also yields excellent collapse of the data for the case of one-sided heating, with no further adjustment. Deviations are limited to the ${Pr}=0.025$ case, which, as observed previously, does not show a sizeable logarithmic layer. Hence we judge that the minimal Reynolds number for which the observed scaling based on validity of the log law is valid is ${Re}_{\tau }\,{Pr} \lesssim 200$.


Having estimated robustly the logarithmic offset function, we now go back to (4.4) and (4.5), to achieve a full representation of the dependence of the heat flux coefficients on  ${Re}$ and ${Pr}$. The predicted variation of the Nusselt number with ${Pr}$ is compared with the DNS data in figure 11(a). As expected based on the previous discussion, the quality of the fitting is excellent, with errors much less than $1\,\%$, with the exception of the ${Pr}=0.025$ case. Increase of the Nusselt number with ${Pr}$ is recovered for both symmetric and one-sided heating, with an overall trend that is quite far from a power law, as surmised in most semi-empirical formulas (e.g. Kays et al. Reference Kays, Crawford and Weigand1980). Nevertheless, empirical laws developed for symmetric forced convection at low ${Pr}$ (Abe & Antonia Reference Abe and Antonia2019; Alcántara-Ávila & Hoyas Reference Alcántara-Ávila and Hoyas2021) fit the DNS data quite well. The ratio of the respective Nusselt numbers is used in the figure 11(a) inset to provide a measure of the thermal efficiency of the channel in the presence of one-sided heating, as compared to the case of symmetric heating. The efficiency is found to be significantly significantly less than unity at low Prandtl number, and to increase at increasing ${Pr}$, as one can deduce easily from (4.4) and (4.5). The thermal efficiency predicted from the latter equations does in fact provide a close estimate of the DNS data, provided that ${Re}_{\tau }\, {Pr} \lesssim 200$. Figure 11(b) reports the extrapolated dependence of the thermal efficiency on the Reynolds number. Consistent with (scattered) data reported in the literature (e.g. Sparrow, Lloyd & Hixon Reference Sparrow, Lloyd and Hixon1966), we find the thermal efficiency for Prandtl number close to unity to be typically between 80 % and 85 %, and to increase with the Reynolds number. Significant variation with the Prandtl number is also observed, with much lower efficiency at low ${Pr}$, and higher efficiency (up to $90\,\%$) at higher ${Pr}$, at which sensitivity to ${Re}$ is also reduced.

Figure 11. Distribution of the Nusselt number as a function of  ${Pr}$ at ${Re}_{\tau }=1000$ (a), and estimated thermal efficiency as a function of ${Re}_b$, at various ${Pr}$ (b). In (a), the DNS data for symmetric heating are denoted with square symbols, and those for one-sided heating with circles; dotted and dashed lines denote the corresponding fits, according to (4.4) and (4.5) combined with (5.1). The dash-dotted and solid lines denote the low- ${Pr}$ fits of Abe & Antonia (Reference Abe and Antonia2019) and Alcántara-Ávila & Hoyas (Reference Alcántara-Ávila and Hoyas2021), respectively. The inset of (a) reports the thermal efficiency in the one-sided case (symbols) and the corresponding estimate based on the log law (dashed line). In (b), predictions are shown only for ${Re}_{\tau }\,{Pr} \gtrsim 200$, and the line styles are as in table 1.
6. Conclusions
We have studied turbulent forced convection in plane channel flow for various Reynolds and Prandtl numbers, considering the cases of both symmetric and one-sided heating. The latter case has been studied considerably less, although it is probably more relevant for practical applications, in which heating is often concentrated at one wall. The instantaneous temperature fields reveal that cases with one-sided heating are characterized by large-scale organization of the temperature field, which exhibits structures extending well beyond the channel symmetry plane, whereas in symmetrically heated cases, the temperature structures are confined to each half of the channel. The occurrence of large-scale organization of the temperature field is confirmed quantitatively by the spectrograms and profiles of the streamwise temperature fluctuations, which show a distinct energetic peak in the outer layer, which is absent in the case of symmetric heating. Analysis of the temperature variance production term further corroborates that increase of the inner peak of the temperature variance results from long-range influence of the outer thermal energy site.
Despite different organization of the outer-layer turbulence, the mean temperature profiles show many commonalities. All flow cases show the emergence of a logarithmic layer for the temperature profile, with slope similar to that found in pipe flow. Asymmetrically heated cases feature a much stronger wake region, which is modelled accurately using a parabolic law in both the symmetric and one-sided heating cases, although with different fitting constant. Once again, outer-layer similarity is confirmed to be a robust feature of wall turbulence, which is also found to apply to cases with one-sided heating, throughout the Reynolds and Prandtl numbers ranges. These universal features are used to derive analytical approximations for the heat transfer coefficient, whose deviation with respect to the DNS data is no more than  $1\,\%$, and which are used to estimate the thermal efficiency of one-side-heated channels, as compared to the idealized symmetric case. We find that the thermal efficiency is reduced substantially (by up to 40 %) at low Prandtl number, whereas the increasing relevance of turbulent convection tends to level off the differences at higher Prandtl number, with reduced efficiency of approximately 10 % at ${Pr}=4$.
The study confirms that DNS at moderate Reynolds number are a valuable tool for understanding the flow physics, but can also aid the derivation of more accurate predictive formulas, especially for quantities that are difficult to measure experimentally, such as heat fluxes. Future efforts will be devoted to studying asymmetric heating in more complex flow configurations, such as square and rectangular ducts, which are extremely relevant in engineering. Interestingly, publicly available data (Sparrow et al. Reference Sparrow, Lloyd and Hixon1966) show similar reduction of efficiency in that case.
Acknowledgments
We acknowledge that the results reported in this paper have been achieved using the PRACE Research Infrastructure resource MARCONI based at CINECA, Casalecchio di Reno, Italy, under project PRACE no. 20230112.
Funding
This research received no specific grant from any funding agency, commercial or not-for-profit sectors.
Declaration of interests
The authors report no conflict of interest.
Data availability statement
The data that support the findings of this study are available openly at the web page http://newton.dma.uniroma1.it/database/.


 Open access

