1. Introduction
The flow of a liquid sheet is of importance as a fundamental problem in fluid mechanics that is ubiquitous in nature and in a wide range of industrial applications, such as coating and cleaning in a manufacturing process. When a solid object impacts a liquid pool, a liquid film is emitted. Subsequently, a moving contact line is formed on the liquid–solid–gas interface (Duez et al. Reference Duez, Ybert, Clanet and Bocquet2007; Snoeijer & Andreotti Reference Snoeijer and Andreotti2013; Truscott, Epps & Belden Reference Truscott, Epps and Belden2014). The stability of the moving contact line determines splash and cavity formation: in the case that the liquid film is separated from the solid surface, the gas phase comes in between liquid and solid, and consequently a crown splash is generated.
Since the early pioneering work that discovered the formation of a crown splash during drop impact (Worthington Reference Worthington1877; Worthington & Cole Reference Worthington and Cole1897), the experimental conditions to generate splash during solid impact have been studied extensively, where the dominant conditions were found to be connected to impact velocity and surface wettability (Duez et al. Reference Duez, Ybert, Clanet and Bocquet2007; Aristoff & Bush Reference Aristoff and Bush2009; Truscott et al. Reference Truscott, Epps and Belden2014; Zhao, Chen & Wang Reference Zhao, Chen and Wang2014; Kim & Park Reference Kim and Park2019; Speirs et al. Reference Speirs, Mansoor, Belden and Truscott2019). In particular, it was revealed that the separation of the liquid film occurs at a relatively low impact velocity for hydrophobic solid surfaces, and a criterion for when this air entrainment occurs was first suggested by Duez et al. (Reference Duez, Ybert, Clanet and Bocquet2007) and Truscott et al. (Reference Truscott, Epps and Belden2014). Another key parameter is the geometry of the solid object: e.g. the liquid film can flow smoothly along the surface of a (hydrophilic) cone (Marston & Thoroddsen Reference Marston and Thoroddsen2014), whereas the film can separate at a singular point, such as a sharp corner of a plate (Peters et al. Reference Peters, van der Meer and Gordillo2013; Mayer & Krechetnikov Reference Mayer and Krechetnikov2018). The cavity formation after film separation is linked to the hydrodynamic force acting on the solid object during its descending motion. When no cavity forms, vortical structures form in the wake of the impactor leading to an increase in the hydrodynamic force. However, if a cavity forms, these vortical structures are suppressed, and hence the hydrodynamic force is reduced (Truscott, Epps & Techet Reference Truscott, Epps and Techet2012). Therefore, the dynamics of the impact process depends strongly on the stability of the liquid flow over the solid surface.
Prior studies investigated experimentally the emitted ejecta resulting from the impact of a solid object (Thoroddsen et al. Reference Thoroddsen, Etoh, Takehara and Takano2004; Peters et al. Reference Peters, van der Meer and Gordillo2013; Marston & Thoroddsen Reference Marston and Thoroddsen2014). The important finding is that, with increasing impact velocity, the initial velocity of the ejecta increases up to 30 times faster than the impact velocity of the solid object (Thoroddsen et al. Reference Thoroddsen, Etoh, Takehara and Takano2004). Furthermore, the ejecta of low-surface-tension liquids showed self-similarity for different impact velocities. In contrast, for high-surface-tension liquids, the ejecta was observed to be self-similar only at high impact velocities (Marston & Thoroddsen Reference Marston and Thoroddsen2014).
The dynamics of the liquid lamella is also important for many other phenomena encountered during impact, such as liquid fragmentation due to droplet impact (Rozhkov, Prunet-Foch & Vignes-Adler Reference Rozhkov, Prunet-Foch and Vignes-Adler2002; Villermaux & Bossa Reference Villermaux and Bossa2011; Wang et al. Reference Wang, Dandekar, Bustos, Poulain and Bourouiba2018; Wang & Bourouiba Reference Wang and Bourouiba2021) or the spreading and bouncing of a droplet (Roisman, Rioboo & Tropea Reference Roisman, Rioboo and Tropea2002; Okumura et al. Reference Okumura, Chevy, Richard, Quéré and Clanet2003; Eggers et al. Reference Eggers, Fontelos, Josserand and Zaleski2010). When a droplet impacts a cylindrical pole, it expands into a thin liquid sheet, and the rim retracts. Depending on the experimental conditions, such as the viscosity or elasticity of the liquid, fingers can emerge at the edge of the rim and pinch off into small droplets (Wang et al. Reference Wang, Dandekar, Bustos, Poulain and Bourouiba2018). This process is referred to as drop fragmentation. Many previous studies explained the rim dynamics and fingering with the Rayleigh–Plateau instability (Rozhkov et al. Reference Rozhkov, Prunet-Foch and Vignes-Adler2002) or the Rayleigh–Taylor instability (Villermaux & Bossa Reference Villermaux and Bossa2011; Peters et al. Reference Peters, van der Meer and Gordillo2013) or even coupled both instabilities (Wang & Bourouiba Reference Wang and Bourouiba2021). In the case of a droplet impacting onto solid substrates, the liquid lamella spreads radially, and if the wetting properties of the substrate are favourable, the lamella recedes and bounces off the substrate. A remarkable phenomenon observed in previous studies is that the contact time between the droplet and solid substrate is independent of the impact velocity, but instead is a function of the surface tension of the liquid and the initial radius of the drop (Richard, Clanet & Quéré Reference Richard, Clanet and Quéré2002; Okumura et al. Reference Okumura, Chevy, Richard, Quéré and Clanet2003; Bird et al. Reference Bird, Dhiman, Kwon and Varanasi2013).
In this work, we report an experimental study of the impact dynamics of a vertical solid plate into a liquid pool. The focus of our study is on the time evolution of the liquid sheet, which is ejected at the early stage of impact and flows over the solid surface without separation at a relatively high velocity. We employed a theoretical model to explain the time evolution of the film height and the rim thickness. The structure of the remaining text is as follows. In § 2, we first provide the experimental set-up and conditions. Section 3 describes the experimental results in detail. We first show the behaviour of the liquid film with a variation of the impact velocity and discuss the time evolution of the rim in § 3.1. In § 3.2, we model the time-dependent liquid film height to extend our understanding of the dynamics of the liquid film and compare it with the experimental results. Moreover, we propose relevant characteristic length and characteristic time scales for the maximum film height. Finally, we draw conclusions in § 4.
2. Experimental set-up and conditions
(a) Schematic of the experimental set-up, where a vertical plate with thickness $D_{o}$
and downwards velocity $U_{o}$
impacts a water surface, causing a liquid film to move upward along its sides. (b) Snapshots from the time evolution of the left liquid film during the impact of the solid plate ( $D_{o}=10\,\rm mm$
) at $U_{o}=2.5\,\rm m\,s^-{^1}$
. The time $t$
indicated above each snapshot is measured with respect to the time of impact (i.e. the first moment that the plate touches the undisturbed water surface, at $t=0$
).

Figure 1(a) depicts a schematic of the experimental set-up. Using a linear motor, an acrylic plate vertically enters into a glass tank (50 cm $\times$
50 cm $\times$
80 cm), which is filled with water up to 40 cm. To avoid the separation of the liquid film at a sharp edge of the solid, the frontal part of the plate has a cylindrically curved leading edge, such that every corner is rounded. The plate thickness $D_{o}$
was varied from $D_{o}=5$
to $20\,\rm mm$
, while the plate width $L$
was fixed at $L=7\,\rm cm$
for all cases (see inset in figure 1
a). The velocity $U_{o}$
of the plate at the moment of impact was controlled by a linear motor to be in the range of 0.8 $-$
2.9 m s−1. Within this range, we do not investigate velocities above which the liquid lamella starts to separate from the solid surface. This threshold velocity varies with $D_{o}$
. In all cases, the height of the plate was large enough to not interfere with the impact process. Further, we maintained vertical alignment of the plate and the rod holding it during the entire impact event.
The dynamics of the liquid film was captured using a high-speed camera (Nova S16, Photron) at $16\,000$
frames per second with a zoom lens (Navitar 12X). The camera operated at full frame with a resolution of 1024 $\times$
1024 pixels, providing a spatial resolution of 20 μm ${\rm px}^-{^1}$
. An LED light source (KL 2500, Schott) is employed for backlighting. To determine the airflow during the impact, the air was seeded with oil droplets (diameter $\sim$
1 μm
) by a fog generator (SAFEX Fog Generators, Dantec Dynamics) and illuminated with a green continuous-wave laser sheet (532 nm). Then, the velocity field was measured via particle image velocimetry (PIV).
The most important experimental parameters, together with the relevant dimensionless numbers, are summarised in table 1. These numbers are the Weber $We$
= $\rho U_{o}^{2}D_{o}/\sigma$
, the Bond $Bo$
= $\rho g D_{o}^{2}/\sigma$
, the capillary $Ca$
= $\mu U_{o}/\sigma$
and the Reynolds $Re$
= $\rho U_{o}D_{o}/\mu$
numbers. They are based on water properties with density $\rho$
, dynamic viscosity $\mu$
, surface tension $\sigma$
and gravitational acceleration $g$
. Since our experimental conditions are in a regime where $Ca\lt 0.04$
and where the static contact angle of water on an acrylic surface $\theta _{a}$
is smaller than $79^\circ$
, no separation of the liquid occurs during impact, and consequently no cavity is generated (Duez et al. Reference Duez, Ybert, Clanet and Bocquet2007; Truscott et al. Reference Truscott, Epps and Belden2014).
Summary of experimental conditions and corresponding dimensionless numbers.

3. Results and discussion
3.1. Rising of a liquid lamella
Figure 1(b) shows some experimental snapshots of the impact process, zooming in on the lamella. The liquid sheet is ejected during the impact event and subsequently flows over the plate surface. To understand the behaviour of the liquid lamella flow, we measure its height $h$
and rim thickness $e$
with respect to time. Here, $h$
is defined as the distance from the unperturbed water surface to the tip of the liquid film, and $e$
is the distance between the solid surface and the outer point of the rim, referred to as the maximum rim thickness, as indicated by the yellow arrows in figure 1(b). It should be noted that, since $e$
is obtained near the tip of the liquid film from experimental side-view images, it corresponds to the size of fingers in the case where the finger manifests, where fingers emerge owing to the instability of moving contact lines at an early time and subsequently retract (see inset in figure 3
d).
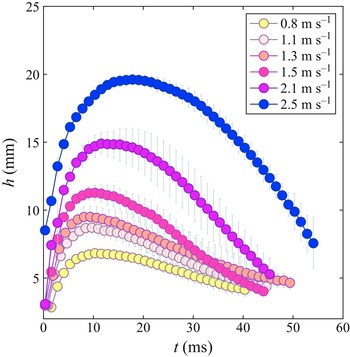
Time evolution of the liquid film height $h$
for different $U_{o}$
(see legend) and $D_{o}=10\,\rm mm$
. The error bars represent the standard deviation of ten experimental runs.

After the liquid film reaches its maximum height, it descends back into the liquid pool while being dragged by the solid, as depicted in figure 2. Since initially the kinetic energy of impacting objects transfers primarily into the liquid film (Thoroddsen et al. Reference Thoroddsen, Etoh, Takehara and Takano2004), the ejection speed of the liquid film directly depends on the initial speed of the object; the liquid film rises faster and higher with increasing $U_{o}$
for the same $D_{o}$
.
(a) The thickness $e$
of the rim of the liquid film as a function of time $t$
, for $D_{o}=10\,\rm mm$
. (b) To illustrate that $e$
is of the same order as the local capillary length $l_{c}$
defined in (3.1), the time evolution of their ratio $e/l_{c}$
is shown for $D_{o}=10\,\rm mm$
. (c) Time evolution of the ratio $e/l_{c}$
for $D_{o}=20\,\rm mm$
. (d) Time evolution of the averaged wavelength $\,\bar {\!\lambda }$
of the fingers for $D_{o}=10\,\rm mm$
. The inset shows how $\lambda$
is defined for each neighbouring pair of fingers in each image frame, which is subsequently averaged to determine $\,\bar {\!\lambda }$
. The error bar is the standard deviation of ten experimental runs.

In contrast to the film height $h$
, which reaches a maximum and then decreases again, the rim thickness $e$
continues to grow over time, as shown in figure 3(a), due to the liquid phase continuously accumulating in the rim. Here, the data were plotted until the point where the rim could be clearly differentiated from the lamella. From the same figure, one may conclude that, with increasing $U_{o}$
the rim becomes thinner. This can be understood by realising that the time rate of change of the volume of water displaced by the plate entering the pool is given by d $V$
/ ${\rm d}t \sim D_{o}U_{o}$
, where the volume itself is expected to be determined by the dimensions of the lamella, i.e. $V \sim eh$
. Since $\dot {h} \equiv \mathrm {d}h$
/ $\mathrm {d}t$
is at least an order of magnitude larger than $\mathrm {d}e$
/ $\mathrm {d}t$
, $e$
is of the order of $D_{o} U_{o}$
/ $\dot {h}$
. From the literature, it is known that the momentum transfer from the impact event to the liquid film becomes larger when $U_{o}$
increases (Thoroddsen et al. Reference Thoroddsen, Etoh, Takehara and Takano2004), and thus the ratio $U_{o}$
/ $\dot {h}$
decreases monotonically with $U_{o}$
. Because $e \sim U_{o}$
/ $\dot {h}$
, it decreases with increasing $U_{o}$
(as shown in figure 3
a).
The behaviour of the rim (i.e. the top part of the lamella) is governed by a competition between the inertia of the liquid sheet and a capillary restoring force concentrated at the rim (Villermaux & Bossa Reference Villermaux and Bossa2011; Wang et al. Reference Wang, Dandekar, Bustos, Poulain and Bourouiba2018). In addition, we consider the gravitational force $g$
in this situation. The viscosity does not come into play for the rim dynamics because viscosity only has an effect near the solid surface, where we assume a no-slip boundary condition. Since the rim continues to wet new solid surface, the viscous effects are confined to the boundary layer (Eggers et al. Reference Eggers, Fontelos, Josserand and Zaleski2010). Given that we measured the rim thickness close to the contact line, where the contribution of the boundary layer is relatively small, the viscous stress is negligible compared with gravity and capillarity. The capillary–inertial time scale is given by $\tau _{c}=\sqrt {\rho e_{o}^{3}/\sigma }$
(Rayleigh et al. Reference Rayleigh1879; Richard et al. Reference Richard, Clanet and Quéré2002), and we define the viscous time scale as $\tau _{\nu }=e_{o}^{2}/\nu$
, where for both time scales we use the initial value of rim thickness $e_{o}$
. Indeed, for $D_{o} = 10\,\rm mm$
, where we observe that $e_{o} \approx 0.5\,\rm mm$
, $\tau _{c}$
is approximately $1.3\,\rm ms$
whereas $\tau _{\nu } \sim 250\,\rm ms$
, ensuring that interfacial constraint on the rim is predominantly due to capillarity. Therefore, the balance of the involved forces acting on the rim may be written as
 \begin{equation} e \sim \sqrt {\frac {\sigma }{\rho (\mid -\ddot {h}\mid +g)}} = l_{c}, \end{equation}
which states that the rim thickness is proportional to the local and instantaneous capillary length based on the instantaneous film deceleration $\ddot {h}$
. For $D_{o}=10\,\rm mm$
, $e$
indeed closely follows $l_{c}$
without any fitting parameters, which is corroborated by the ratio $e$
/ $l_{c}$ $\approx 1$
, as depicted in figure 3(b). The initial destabilisation of the rim is likely caused by a combination of Rayleigh–Plateau and Rayleigh–Taylor instabilities, with deceleration and interfacial constraints on the rim being crucial factors (Wang et al. Reference Wang, Dandekar, Bustos, Poulain and Bourouiba2018; Wang & Bourouiba Reference Wang and Bourouiba2021). At larger $D_{o}$
in figure 3(c), however, the liquid sheet is decelerated more than in the case of $D_{o}=10\,\rm mm$
, which leads to $\mid -\ddot {h}\mid$
being larger. That is, more liquid is pulled away from the liquid sheet into the rim, resulting in $e$
/ $l_{c}$
being slightly larger than $1$
. It is interesting to note that, even though the liquid flows over a moving solid surface, there is an analogy with the rim dynamics for impacting on a small target, where the lamella and rim can expand freely, in the absence of the liquid friction from the solid surface (Villermaux & Bossa Reference Villermaux and Bossa2011; Wang et al. Reference Wang, Dandekar, Bustos, Poulain and Bourouiba2018).
Similar to droplet impact, fingering patterns caused by instability can be observed at the rim. For each time frame, we measure the distance of all observable, neighbouring fingers using the front-view experimental images and subsequently average them to obtain what we define to be the average wavelength $\,\bar {\!\lambda }$
of the pattern. The time evolution of this quantity is plotted in figure 3(d). Note that at early times $\,\bar {\!\lambda }$
is significantly smaller than the capillary length of water $l_{c, w}$
= $\sqrt {\sigma /\rho g} = 2.71\,\rm mm$
, but subsequently increases. Unlike sheet fragmentation after droplet impact on a pole, in which case the liquid can freely expand in the radial direction, in our case the advancing motion of the sheet is constrained geometrically by the width of plate $L$
. Hence, the ejected fingers emerge only at early times before the maximum extension of the lamella is reached, and subsequently the fingers merge with each other during the retraction of the rim due to the moving solid surface, causing $\,\bar {\!\lambda }$
to increase throughout the entire time for each $U_{o}$
(see supplementary movie https://doi.org/10.1017/jfm.2025.170). In addition, it can be seen that $\,\bar {\!\lambda }$
decreases with increasing $U_{o}$
. The number of fingers is proportional to $U_{o}$
, and the wavelength of fingers is proportional to $e$
(Wang et al. Reference Wang, Dandekar, Bustos, Poulain and Bourouiba2018; Wang & Bourouiba Reference Wang and Bourouiba2021). Increasing $U_{o}$
accelerates the rim destabilisation as it results in an increase of $\ddot {h}$
. In other words, with increasing $U_{o}$
, the number of fingers increases, causing $\,\bar {\!\lambda }$
to decrease. Further, as already discussed in figure 3(a), $e$
decreases with increasing $U_{o}$
, so that $\,\bar {\!\lambda }$
decreases with $U_{o}$
.
3.2. Modelling the height of the liquid film
(a) Simplified modelling of the liquid film dynamics, showing the considered control volume ( $CV$
, red dotted line). (b) A representative snapshot from PIV measurements of the airflow field in terms of velocity vectors and contour of vertical velocity components ( $U_{o}=1.3\,\rm m\,s^-{^1}$
and $D_{o} = 10\,\rm mm$
at $t = 9.9\,\rm ms$
). The velocity vector magnitude ranges from $0$
to $0.5\,\rm m\,s^-{^1}$
, and the vertical velocity lies between $-0.3$
and $+0.35\,\rm m\,s^-{^1}$
. (c) Comparison of the experimentally measured liquid film height (symbols) with the simplified model of equation (3.6) (solid black line) for three typical experimental conditions (see legend). Comparison of the order of magnitude of the four acceleration terms on the right-hand side of (3.6) for the liquid film height predicted by the model for (d) $D_{o}=10\,\rm mm$
, $U_{o}=1.1\,\rm m\,s^-{^1}$
and (e) $D_{o}=10\,\rm mm$
, $U_{o}=2.1\,\rm m\,s^-{^1}$
. Note that $h\,\ddot {h}$
is plotted, rather than $\ddot {h}$
itself, to allow for a fair comparison over the time span.

In order to illustrate and understand the rising motion of the liquid film, we want to predict the time evolution of the film height $h$
with a model. A schematic diagram is shown in figure 4(a), with the liquid pool in light blue and the solid object, descending at a velocity $U_{o}$
, in light grey. For simplicity, we neglect the formation of the rim (i.e. uniform thickness in the $y$
direction) and assume that $e$
is constant throughout time, turning it into a one-dimensional problem. We set the position of the solid surface at $x=0$
and that of the undisturbed free surface at $y=0$
. The initial time is set by the moment when the liquid comes into the control volume ( $\rm CV$
) in figure 4(a), such that the liquid sheet is located at $x =0, y =0$
when $t= 0$
. Since the frontal part of the solid is hemispherical, it takes some time for the liquid to reach the $\rm CV$
. The corresponding time for the liquid film to travel from the initial moment of impact to the origin point is typically less than 1 ms. The flow inside the liquid film is represented by $v(x,y,t)$
, and we assume there is no pressure gradient along the $y$
direction. Neglecting boundary effects at the sides of the object, the spanwise width of the solid plate $L$
cancels out, meaning the dynamics is considered per unit width in the spanwise direction. The mass conservation of the liquid film can therefore be expressed as
 \begin{equation} \frac {\mathrm {d}}{\mathrm {d}t}\left (\rho he\right )=\rho e \mathrm {v_{1}}, \end{equation}
where $\mathrm {v_{1}}$
is the velocity of the liquid-phase flow from the pool to the sheet. From (3.2), we have $\mathrm {v_{1}}=\dot {h}$
, taking $e$
to be constant as stated above.
As discussed in § 3.1, we consider that viscous effects are confined to a thin boundary layer close to the solid surface (Eggers et al. Reference Eggers, Fontelos, Josserand and Zaleski2010). This can be motivated by the transient character of the impact, where boundary layers start to form upon the first contact of the water and the body. Thus, viscous dissipation occurs in the area where the liquid sheet contacts the solid surface, which can be considered to be proportional to $h$
. The corresponding viscous force acting on the film can be approximated from Stokes’ first problem, given by
 \begin{equation} F_{\nu } =\mu \frac {\partial \mathrm {v}}{\partial x}\bigg |_{x=0} h = -\mu h \frac {U_{o}+\dot {h}}{\sqrt {\pi \nu t}}, \end{equation}
where $\nu$
is the kinematic viscosity of water. The thickness of the boundary layer $\delta \sim \sqrt {\nu t}$
does not grow beyond $e$
throughout the entire process. For example, for $U_{o}=1.3\,\rm m\,s^-{^1}$
and $D_{o}=10\,\rm mm$
, the initial value of $e$
is approximately 0.5 mm. This means that the boundary layer would take 250 ms to reach this thickness, which is much longer than the impact time of the object. First it should be noted that $F_\nu$
, as all forces introduced in this section, is understood to be a force per unit length in the spanwise direction of the object. Second, and more importantly, in estimating the velocity it needs to be taken into account that the liquid velocity in the film, $\mathrm {v_{1}}=\dot {h}$
, is measured in the laboratory reference frame where the downward moving plate has a velocity $-U_{o}$
such that the velocity difference between film and plate is equal to $-(\dot {h} + U_{o})$
. Consequently, $F_\nu$
is in the downward direction.
Using PIV and small oil droplets as seeds, we measure the airflow along the solid surface while the object enters the water, a snapshot of which is shown in figure 4(b). It is clear that air is being dragged with the downward-moving plate and moves back upward further away from the plate. For droplet impact, the air film is trapped between the liquid lamella and the solid substrate (Liu, Tan & Xu Reference Liu, Tan and Xu2015; Pack et al. Reference Pack, Kaneelil, Kim and Sun2018). Here, it is expected as well that due to the relatively high impact velocity, the influence of the surrounding gas would affect the beginning of the impact event, which is difficult to observe experimentally in our set-up. We assume the air stress is significant at the beginning as a result of air entrainment in front of the liquid sheet. The corresponding stress $\tau _{a}$
is chosen by the assumption that a thin wedge of air exists between the rim of the liquid and the solid surface so that the stress due to the air phase (de Gennes Reference de Gennes2002; Liu et al. Reference Liu, Tan and Xu2015) and corresponding force may be estimated as
 \begin{equation} F_{a} = \tau _{a} \, e \sim \frac {\rho _{a}c_a}{\sqrt {2\pi \gamma }}\left (U_{o}+\dot {h}\right ) e\,\,, \end{equation}
where $c_a$
is the speed of sound in air, $\rho _{a}$
is the density of air and $\gamma = 1.4$
is the adiabatic constant of air, which is considered an ideal gas.
Applying vertical momentum balance on the $\rm CV$
gives
 \begin{equation} \frac {\mathrm {d}}{\mathrm {d}t}\left (\rho V(t) \mathrm {v_{1}}\right ) - \rho L e \mathrm {v_{1}}^{2} = L \sum _{\rm CV} F_i\,, \end{equation}
where the film volume $V(t) = Leh$
and $\mathrm {v_{1}} = \dot {h}$
. Note that for clarity we have now included the spanwise width $L$
in the equation, and it should be remembered that $F_i$
denote forces per unit length. Substituting (3.2), (3.3), (3.4) together with the gravitational force $F_{g}=-\rho ehg$
and capillary force $F_{c}=\sigma \cos \theta _{D}$
with the dynamic contact angle $\theta _{D}$
into equation (3.5), it can be rewritten as
 \begin{equation} \frac {\mathrm {d}^{2}h}{\mathrm {d}{t}^{2}}=\frac {\sigma \cos \theta _{D}}{\rho e}\frac {1}{h}-\frac {\alpha }{e}\sqrt {\frac {\nu }{\pi t}}\left (\frac {\mathrm {d}h}{\mathrm {d}t}+U_{o}\right )-{\beta }\frac {\rho _{a}}{\rho }\frac {c_a}{\sqrt {2\pi \gamma }}\frac {1}{h}\left (\frac {\mathrm {d}h}{\mathrm {d}t}+U_{o}\right )-g. \end{equation}
Here we have introduced numerical constants $\alpha$
and $\beta$
in front of the viscous and air terms, respectively, since these forces are known only up to a multiplicative constant. These constants will be used as fitting parameters.
In figure 4(c) we compare the experimental results and the model of equation (3.6) for three typical, different combinations of $U_{o}$
and $D_{o}$
. Here, we approximate $e = e_{o}$
from experiments as $e_{o}=0.5\,\rm mm$
for $D_{o}=10\,\rm mm$
and $e_{o}=0.7\,\rm mm$
for $D_{o}=20\,\rm mm$
. The value of $\theta _{D} = 130^\circ$
is also obtained from the experiments as the time average from the experimental images. Furthermore, the initial condition for the velocity $\dot {h}(0)$
was also obtained from experimental data: $\dot {h}(0)=2.1\,\rm m\,s^-{^1}$
for $D_{o}=10\,\rm mm$
and $U_{o}=1.1\,\rm m\,s^-{^1}$
; $\dot {h}(0)=3.3\,\rm m\,s^-{^1}$
for $D_{o}=10\,\rm mm$
and $U_{o}=2.1\,\rm m\,s^-{^1}$
; and $\dot {h}(0)=2.5\,\rm m\,s^-{^1}$
for $D_{o}=20\,\rm mm$
and $U_{o}=1.1\,\rm m\,s^-{^1}$
. The fitting parameters $\alpha$
, $\beta$
are determined by the least-squares method, yielding $\alpha \approx 5$
and $\beta \approx 2.5$
, which were rounded for consistency across all three cases presented in figure 4(c).
The present model is able to predict the behaviour of the liquid film until it reaches its maximum height, but it starts to deviate strongly from the experimental result during the downward motion of the film. This might be due to constraints in the present model, such as the assumption that the film thickness $e$
is a constant, which is clearly violated during the downward motion of the film. Also, the descending dynamics of the film is expected to be qualitatively different from that of the rising motion; the interaction of the air with the liquid phase is relevant mostly at the first moments of the contact when the ejecta is emitted. After reaching its maximum height, the initial assumptions for our model, in particular regarding the effect of the air, no longer hold, and hence the model would need to be adapted, e.g. by including an equation for the time evolution of $e$
. Other factors could also have played a role, such as the fact that $\dot {h}(0)$
is likely to be underestimated due to measurement errors in the high-speed imaging footage.
In addition to a reasonable agreement with the experiment up to reaching the maximum film height, what the model can deliver is an estimate of the order of magnitude of each of the relevant forces: in figure 4(d,e), we plot the temporal evolution of (3.6), multiplied by the film height $h(t)$
for better comparison. It is clear that the viscous force provides the dominant term in the dynamics of the liquid film, whereas capillarity and gravity are negligible. Also, the air term is generally smaller, but may in some cases become non-negligible, e.g. in the case of figure 4(d). We may conclude that the initial dynamics of the liquid film is governed by the viscous dissipation in the boundary layer with the object and that this dissipation becomes both larger and more dominant for large impact velocity $U_{o}$
(figure 4
e). It is good to stress at this point that it is difficult to discriminate between the viscous and air terms in (3.6). If we compute the ratio of those two terms, we obtain (including the constants introduced in (3.6))
 \begin{equation} \frac {F_\nu }{F_a} = \frac {\alpha }{\beta }\frac {\rho }{\rho _a}\frac {h(t)}{e}\sqrt {\frac {2\nu \gamma }{c_a^2t}} \approx 0.6 \frac {\alpha }{\beta }\,, \end{equation}
where the time dependence is provided by $h(t)/\sqrt {t}$
. Since $h(t)$
is (at least initially) similar to $\sqrt {t}$
, the ratio of $F_\nu$
and $F_a$
can be approximated using $\rho = 998\,\rm kg\,m^-{^3}$
, $\rho _a = 1.2\,\rm kg\,m^-{^3}$
, $c_a = 340\,\rm m\,s^-{^1}$
, $\nu = 1.0 \times 10^{-6}\,\rm m{^2}\,s^-{^1}$
, $h/e \approx 10$
and $t \approx 5$
ms as $0.6\alpha /\beta$
. This corroborates that $F_\nu$
and $F_a$
are of the same order and determined by the numerical values found for $\alpha$
and $\beta$
.
(a) Maximum height $h_{max}$
reached by the liquid film plotted against the corresponding time $t_{ max}$
at which the maximum was reached for different values of the plate thickness $D_{o}$
, namely $5\,\rm mm$
(squares), $10\,\rm mm$
(circles) and $20\,\rm mm$
(diamonds). Each colour denotes the same $U_{o}$
for all $D_{o}$
(see legend). (b) Same data as in (a), but now $h_{ max}$
and $t_{ max}$
are normalised with the viscous length $l_{\nu }$
and time $\tau _{\nu }$
scales defined in (3.9) and (3.8), respectively.

To independently corroborate the dominance of viscous forces in the dynamics of the liquid film, we measured the maximum liquid film height $h_{ max}$
and the corresponding time $t_{ max}$
at which the maximum is reached for different $D_{o}$
and $U_{o}$
. We observe that the values of $h_{ max}$
and $t_{ max}$
tend to increase linearly with both $U_{o}$
and $D_{o}$
(not shown) and in addition, when plotting $h_{ max}$
against $t_{ max}$
, we also find a linear relation (figure 5
a). Inspired by the importance of viscosity for the motion of the liquid film that follows from the simplified model for the film height dynamics introduced above, we define relevant viscous time and length scales as follows:
 \begin{eqnarray} \tau _{\nu } &=& e_{o}^{2}/\nu , \end{eqnarray}
 \begin{eqnarray} l_{\nu } &=& U_{o} \tau _{\nu } = U_{o}e_{o}^{2}/\nu . \end{eqnarray}
As mentioned before, the initial thickness $e_{o}$
is observed to be $0.32$
, $0.5$
and $0.85\,\rm mm$
for $D_{o} = 5$
, $10$
and $20\,\rm mm$
, respectively. Since it is difficult to observe any differences of $e_{o}$
between small and large $U_{o}$
at early times in our experimental set-up, we use the same value of $e_{o}$
for each impact velocity $U_{o}$
. In figure 5(b) we normalise $h_{ max}$
and $t_{ max}$
with the viscous length and time scales $l_{\nu }$
and $\tau _{\nu }$
defined above, and find that the maximum film height data all collapse to $h_{ max} \approx 0.03 l_{\nu }$
, independent of $D_{o}$
and $U_{o}$
. Also $t_{ max}/\tau _{\nu }$
have similar values, although for large $U_{o}$
this value slightly increases, which may be due to the fact that at high $U_{o}$
, $e_{o}$
becomes much thinner than for small $U_{o}$
, which, however, we could not capture precisely within the spatial resolution of our set-up.
Finally, it is worth noting that the observation that the viscosity of the liquid film is the dominant parameter for the maximum film height and the corresponding time stands in sharp contrast to droplet bouncing, where the contact time between the droplet and the solid substrate is determined solely by surface tension (Richard et al. Reference Richard, Clanet and Quéré2002; Okumura et al. Reference Okumura, Chevy, Richard, Quéré and Clanet2003; Bird et al. Reference Bird, Dhiman, Kwon and Varanasi2013).
4. Conclusion
In conclusion, we studied the dynamics of the liquid film ejected during the impact of a vertical solid plate on a liquid bath while varying the impact speed and plate thickness. After being emitted due to the impact, the liquid sheet rises up along the solid surface without separation and eventually flows back down into the liquid pool. We found that, upon increasing impact velocity, the liquid film rises higher and faster, and its rim thickness becomes thinner.
The rim retracts over time while the liquid film flows along the solid surface. The experimental results show that the evolution of the rim thickness is approximately equal to the local instantaneous capillary length, which is defined based on capillarity, gravity and the deceleration of the liquid film in the vertical direction. It is worth noting that despite the presence of the solid surface, the viscous dissipation in the rim can be neglected. Further, fingers emerge at the beginning of impact and merge with each other over time, resulting in the average wavelength of fingers increasing throughout the lifetime of the liquid film. In contrast, increasing the impact velocity accelerates the destabilisation of the contact line as well as the emergence of fingers. Consequently, the wavelength of the fingers decreases with increasing $U_{o}$
.
In contrast to what happens to the rim, our one-dimensional model shows that the viscous force is responsible for the deceleration of the liquid sheet in the vertical direction. More specifically, we predicted the time evolution of the rising motion of the liquid sheet by the momentum balance including gravity, surface tension, viscosity and the resistance force due to the air layer between the liquid lamella and the solid surface. There is a reasonable agreement between the experimental data and theoretical prediction for the rising and early descending motions of the liquid film. However, the model deviates from the experimental result at later stages. This needs to be addressed in further studies, for example, by extending the model to two dimensions, including the time evolution of the film thickness $e$
. We decomposed the contribution of each force in the model and found that the rising motion is governed by the viscous force. Finally, both the maximum liquid film height and the corresponding time linearly increase as functions of the impact velocity and the plate width. They can be determined by the characteristic viscous length and time scales based on the initial rim thickness.
Supplementary movie.
Supplementary movie is available at https://doi.org/10.1017/jfm.2025.170.
Acknowledgements.
We thank G.-W. Bruggert and T. Zijlstra for their technical assistance, and A. Oratis for the many helpful discussions. This publication is part of the Vici project IMBOL (project no. 17070), which is partly financed by the Dutch Research Council (NWO). H.P. acknowledges funding support from the National Research Foundation of Korea (grant nos RS-2024-00343259, RS-2024-00406741).
Declaration of interests.
The authors report no conflict of interest.




 Open access