


1 Introduction
When two solid surfaces are brought into contact and separated, a net charge transfer may occur between the surfaces. This phenomenon is often referred to as ‘triboelectric charging’ or simply as ‘tribocharging’, although no frictional contact is required for charge transfer (Harper Reference Harper1967). The exact nature of triboelectric charge transfer between insulating surfaces is still not completely understood. There has been a long-lasting debate on whether ions or electrons are responsible for triboelectric charging (McCarty & Whitesides Reference McCarty and Whitesides2008; Knorr Reference Knorr2011; Lacks & Sankaran Reference Lacks and Sankaran2011). Furthermore, tribocharging is generally affected by numerous factors such as impurities and oxides, surface roughness, object geometry and relative humidity, which pose challenges in numerical modelling (Castle Reference Castle1997; Karner et al. Reference Karner, Maier, Littringer and Urbanetz2014; Schella, Herminghaus & Schroter Reference Schella, Herminghaus and Schroter2017).
Most attempts to model triboelectric charging are based on the concept of effective work function difference or contact potential difference between surfaces (Harper Reference Harper1967; Matsuyama & Yamamoto Reference Matsuyama and Yamamoto1995; Tanoue et al. Reference Tanoue, Tanaka, Kitano and Masuda2001; Laurentie, Traoré & Dascalescu Reference Laurentie, Traoré and Dascalescu2013; Korevaar et al. Reference Korevaar, Padding, Van Der Hoef and Kuipers2014; Mizutani, Yasuda & Matsusaka Reference Mizutani, Yasuda and Matsusaka2015; Grosshans & Papalexandris Reference Grosshans and Papalexandris2016a ,Reference Grosshans and Papalexandris b ), which can be regarded as the high-density limit of the surface state theory (Lowell & Rose-Innes Reference Lowell and Rose-Innes1980). In short, it is assumed that charge is transferred until the resulting electric potential difference between the surfaces balances out the driving potential or the work function difference. A relatively simple condenser model is commonly used to determine the electric potential difference due to the transferred charge, usually by treating the contact areas as uniformly charged parallel plates (Matsusaka et al. Reference Matsusaka, Maruyama, Matsuyama and Ghadiri2010).
Other modelling approaches found in the literature include particle polarization based charging (Pähtz, Herrmann & Shinbrot Reference Pähtz, Herrmann and Shinbrot2010; Siu et al. Reference Siu, Cotton, Mattson and Shinbrot2014; Yoshimatsu et al. Reference Yoshimatsu, Araujo, Shinbrot and Herrmann2016, Reference Yoshimatsu, Araújo, Wurm, Herrmann and Shinbrot2017); using particle electron surface density (Duff & Lacks Reference Duff and Lacks2008); high and low energy electrons (Kok & Lacks Reference Kok and Lacks2009); particle temperature variation based charging (Gu et al. Reference Gu, Wei, Su and Yu2013); and saturation charge density of the surface limited by dielectric breakdown (Korevaar et al. Reference Korevaar, Padding, Van Der Hoef and Kuipers2014). These other approaches have been mostly targeted at explaining triboelectricity between particles made of the same material, and therefore are not applicable to cases where different materials are present.
Laurentie et al. (Reference Laurentie, Traore, Dragan and Dascalescu2010, Reference Laurentie, Traoré and Dascalescu2013) developed a numerical model compatible with the discrete element method (DEM) to describe the charge transfer between insulating particles. The model is based on the effective work function difference between materials and takes into account the electric field at the contact point, which has been shown to impact insulator triboelectrification (Zhou et al. Reference Zhou, Wang, Yang, Zhu, Niu, Lin, Liu and Wang2014; Mizutani et al. Reference Mizutani, Yasuda and Matsusaka2015). The model has also showed good agreement with experimental results in vibrated bed experiments (Laurentie et al. Reference Laurentie, Traore, Dragan and Dascalescu2010, Reference Laurentie, Traoré and Dascalescu2013; Kolehmainen et al. Reference Kolehmainen, Sippola, Raitanen, Ozel, Boyce, Saarenrinne and Sundaresan2017b ); in a granular hopper chute flow (Naik et al. Reference Naik, Sarkar, Gupta, Hancock, Abramov, Yu and Chaudhuri2015); and in granular binary mixtures (Naik et al. Reference Naik, Sarkar, Hancock, Rowland, Abramov, Yu and Chaudhuri2016).
In gas–solid and granular flows, triboelectric charging may cause particle agglomeration (LaMarche et al. Reference LaMarche, Muzzio, Shinbrot and Glasser2010; Lee et al. Reference Lee, Waitukaitis, Miskin and Jaeger2015); affects particle entrainment rate (Fotovat et al. Reference Fotovat, Alsmari, Grace and Bi2017a ; Fotovat, Grace & Bi Reference Fotovat, Grace and Bi2017c ; Yang et al. Reference Yang, Zi, Huang, Wang, Lungu, Liao, Yang and Su2017); affects bubble size and shape in bubbling fluidized beds (Jalalinejad, Bi & Grace Reference Jalalinejad, Bi and Grace2012; Rokkam et al. Reference Rokkam, Sowinski, Fox, Mehrani and Muhle2013); and leads to adhesion of particles to the walls (Hendrickson Reference Hendrickson2006; Sowinski, Mayne & Mehrani Reference Sowinski, Mayne and Mehrani2012; Salama et al. Reference Salama, Sowinski, Atieh and Mehrani2013; Song & Mehrani Reference Song and Mehrani2017). For instance, this may result in wall sheeting seen in polymerization reactors that hinders the reactor performance (Hendrickson Reference Hendrickson2006).
While it is generally agreed that electrostatic forces cause wall sheeting, the exact mechanism still remains under debate, and it is unclear how the electrostatic forces lead to multiple particles thick layers. Mehrani and co-workers (Salama et al. Reference Salama, Sowinski, Atieh and Mehrani2013; Song & Mehrani Reference Song and Mehrani2017) have suggested that the particle sheet on the wall would consist of alternating layers of bipolar particles that attract each other. While this mechanism is feasible, it requires a fairly wide charge distribution. Furthermore, it has been shown by Lee et al. (Reference Lee, Waitukaitis, Miskin and Jaeger2015) that nearly monodisperse particles exhibit a fairly narrow charge distribution, making this mechanism unlikely for monodisperse particles. Dielectrophoresis has been shown to affect particle agglomeration (LaMarche et al. Reference LaMarche, Muzzio, Shinbrot and Glasser2010; Liu et al. Reference Liu, Marshall, Li and Yao2010; Lee et al. Reference Lee, Waitukaitis, Miskin and Jaeger2015; Siu et al. Reference Siu, Pittman, Cotton and Shinbrot2015) and might also play an important role in wall sheeting.
In the present study, the effects of triboelectric charging in a small fluidized bed of polyethylene particles were investigated both experimentally and numerically. The focus is on particle–wall adhesion, which was found to be a considerable side effect of triboelectric charging in the present experiments. We investigated the wall sheeting indirectly by measuring the pressure drop across the fluidized bed and directly by particle image velocimetry (Westerweel, Dabiri & Gharib Reference Westerweel, Dabiri and Gharib1997). The magnitude of average particle charge was adjusted by changing the relative humidity (RH, 0–60 %) while keeping other parameters constant. The triboelectric charging model proposed by Laurentie et al. (Reference Laurentie, Traoré and Dascalescu2013) was employed to describe triboelectric charging in the simulated bed, and effective work functions required by the model were calibrated by measuring the mean charge of particles in the bed by a Faraday cup technique (Fotovat, Bi & Grace Reference Fotovat, Bi and Grace2017b ). The numerical results were compared with experimental data to investigate possible modelling problems encountered when the model is used to predict fluidization behaviour.
2 Mathematical modelling
The coupled motion of the gas phase and the solid particles is solved in terms of computational fluid dynamics (CFD) and discrete element method via an OpenFOAM (Jasak et al. Reference Jasak, Jemcov and Tukovic2007)-based solver. The underlying equations of the CFD-DEM model are briefly presented before discussing the triboelectric charging model.
According to the soft-sphere contact model (Cundall & Strack Reference Cundall and Strack1979), particle motion is tracked by solving Newton’s equations of motion of individual particles:
 $$\begin{eqnarray}\displaystyle & \displaystyle m_{i}\frac{\text{d}\boldsymbol{v}_{i}}{\text{d}t}=\mathop{\sum }_{j}(\boldsymbol{f}_{c,ij}^{n}+\boldsymbol{f}_{c,ij}^{t})+\boldsymbol{f}_{e,i}+\boldsymbol{f}_{g\rightarrow p,i}+m_{i}\boldsymbol{g} & \displaystyle\end{eqnarray}$$
 $$\begin{eqnarray}\displaystyle & \displaystyle I_{i}\frac{\text{d}\unicode[STIX]{x1D74E}_{i}}{\text{d}t}=\mathop{\sum }_{j}\boldsymbol{T}_{ij}, & \displaystyle\end{eqnarray}$$
where $m_{i},I_{i},\boldsymbol{v}_{i}$
and
$m_{i},I_{i},\boldsymbol{v}_{i}$
and $\unicode[STIX]{x1D74E}_{i}$
are the mass, the moment of inertia, the translational velocity and the angular velocity of particle
$\unicode[STIX]{x1D74E}_{i}$
are the mass, the moment of inertia, the translational velocity and the angular velocity of particle $i$
, respectively. The forces acting on particle
$i$
, respectively. The forces acting on particle $i$
are classified as the normal and tangential contact forces (
$i$
are classified as the normal and tangential contact forces ( $\boldsymbol{f}_{c,ij}^{n}$
and
$\boldsymbol{f}_{c,ij}^{n}$
and $\boldsymbol{f}_{c,ij}^{t}$
, respectively) due to other particles and walls, the electrostatic force (
$\boldsymbol{f}_{c,ij}^{t}$
, respectively) due to other particles and walls, the electrostatic force ( $\boldsymbol{f}_{e,i}$
), the force due to surrounding gas (
$\boldsymbol{f}_{e,i}$
), the force due to surrounding gas ( $\boldsymbol{f}_{g\rightarrow p,i}$
) and the gravitational force (
$\boldsymbol{f}_{g\rightarrow p,i}$
) and the gravitational force ( $m_{i}\boldsymbol{g}$
). Torque acting on particle
$m_{i}\boldsymbol{g}$
). Torque acting on particle $i$
due to particle
$i$
due to particle $j$
is
$j$
is $\boldsymbol{T}_{ij}=\boldsymbol{R}_{c,ij}\times \boldsymbol{f}_{c,i}$
, where
$\boldsymbol{T}_{ij}=\boldsymbol{R}_{c,ij}\times \boldsymbol{f}_{c,i}$
, where $\boldsymbol{R}_{c,ij}$
is a vector from the centre of particle
$\boldsymbol{R}_{c,ij}$
is a vector from the centre of particle $i$
to the contact point. Rolling friction and torque due to forces other than contact forces are not accounted in this study.
$i$
to the contact point. Rolling friction and torque due to forces other than contact forces are not accounted in this study.
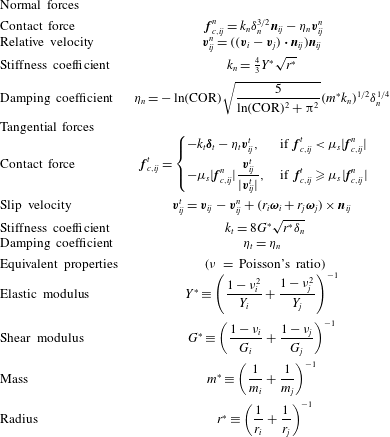
The equations describing the contact forces on a particle are given in table 1, where $\unicode[STIX]{x1D6FF}_{n}$
and
$\unicode[STIX]{x1D6FF}_{n}$
and $\unicode[STIX]{x1D739}_{t}$
are the normal and the tangential overlap distance of the particles, respectively;
$\unicode[STIX]{x1D739}_{t}$
are the normal and the tangential overlap distance of the particles, respectively; $\boldsymbol{n}_{ij}$
is an unit vector pointing from particle
$\boldsymbol{n}_{ij}$
is an unit vector pointing from particle $j$
to particle
$j$
to particle $i$
and
$i$
and $\unicode[STIX]{x1D707}_{s}$
is the sliding friction coefficient. The tangential overlap is obtained by numerically integrating the slip velocity of the colliding surfaces.
$\unicode[STIX]{x1D707}_{s}$
is the sliding friction coefficient. The tangential overlap is obtained by numerically integrating the slip velocity of the colliding surfaces.
Normal damping coefficient $\unicode[STIX]{x1D702}_{n}$
is determined according to the coefficient of restitution (COR) so that the actual COR is independent of the initial relative velocity of the particles (Antypov & Elliott Reference Antypov and Elliott2011). Without better knowledge, the tangential damping coefficient is set equal to the normal damping coefficient. The equations given in table 1 are used to model both particle–particle and particle–wall contacts. For particle
$\unicode[STIX]{x1D702}_{n}$
is determined according to the coefficient of restitution (COR) so that the actual COR is independent of the initial relative velocity of the particles (Antypov & Elliott Reference Antypov and Elliott2011). Without better knowledge, the tangential damping coefficient is set equal to the normal damping coefficient. The equations given in table 1 are used to model both particle–particle and particle–wall contacts. For particle $i$
in contact with a planar wall, the curvature radius and the mass of the wall are large when compared to the particle, so effectively
$i$
in contact with a planar wall, the curvature radius and the mass of the wall are large when compared to the particle, so effectively $r^{\ast }=r_{i}$
and
$r^{\ast }=r_{i}$
and $m^{\ast }=m_{i}$
.
$m^{\ast }=m_{i}$
.
Table 1. The contact forces and the equivalent properties for particles $i$
and
$i$
and $j$
in contact.
$j$
in contact.
The motion of the gas phase is solved in terms of the locally averaged variables over the computational mesh by solving the continuity and momentum equations of an incompressible fluid:
 $$\begin{eqnarray}\displaystyle & \displaystyle \frac{\unicode[STIX]{x2202}\unicode[STIX]{x1D6FC}}{\unicode[STIX]{x2202}t}+\unicode[STIX]{x1D735}\boldsymbol{\cdot }\unicode[STIX]{x1D6FC}\boldsymbol{u}=0, & \displaystyle\end{eqnarray}$$
 $$\begin{eqnarray}\displaystyle & \displaystyle \unicode[STIX]{x1D70C}\frac{\unicode[STIX]{x2202}(\unicode[STIX]{x1D6FC}\boldsymbol{u})}{\unicode[STIX]{x2202}t}+\unicode[STIX]{x1D70C}\unicode[STIX]{x1D735}\boldsymbol{\cdot }(\unicode[STIX]{x1D6FC}\boldsymbol{u}\boldsymbol{u})=\unicode[STIX]{x1D70C}\unicode[STIX]{x1D735}\boldsymbol{\cdot }\unicode[STIX]{x1D6FC}\unicode[STIX]{x1D749}-\unicode[STIX]{x1D735}p+\unicode[STIX]{x1D70C}\unicode[STIX]{x1D6FC}\boldsymbol{g}-\boldsymbol{F}_{g\rightarrow p}, & \displaystyle\end{eqnarray}$$
where $\unicode[STIX]{x1D6FC}$
,
$\unicode[STIX]{x1D6FC}$
, $p$
and
$p$
and $\unicode[STIX]{x1D70C}$
are the volume fraction, pressure and mass density of the gas phase, respectively;
$\unicode[STIX]{x1D70C}$
are the volume fraction, pressure and mass density of the gas phase, respectively; $\boldsymbol{u}$
is the velocity of the gas,
$\boldsymbol{u}$
is the velocity of the gas, $\unicode[STIX]{x1D749}$
is the gas phase deviatoric stress tensor and
$\unicode[STIX]{x1D749}$
is the gas phase deviatoric stress tensor and $\boldsymbol{F}_{g\rightarrow p}$
is the local gas–particle interaction force per unit volume.
$\boldsymbol{F}_{g\rightarrow p}$
is the local gas–particle interaction force per unit volume.
The forces exerted by the gas on the particles are calculated on a per-particle basis and an opposite force is applied to the gas. The force per unit volume exerted by the gas on the particles in a cell is given by
 $$\begin{eqnarray}\boldsymbol{F}_{g\rightarrow p}=\frac{1}{\unicode[STIX]{x0394}V}\mathop{\sum }_{i}\boldsymbol{f}_{g\rightarrow p,i},\end{eqnarray}$$
where $\unicode[STIX]{x0394}V$
is the volume of the cell and the sum runs over the particles in the cell. Neglecting the local acceleration of the fluid (
$\unicode[STIX]{x0394}V$
is the volume of the cell and the sum runs over the particles in the cell. Neglecting the local acceleration of the fluid ( $\text{D}\boldsymbol{u}/\text{D}t=0$
), the total force exerted on an individual particle can be written as
$\text{D}\boldsymbol{u}/\text{D}t=0$
), the total force exerted on an individual particle can be written as
 $$\begin{eqnarray}\boldsymbol{f}_{g\rightarrow p,i}=(\boldsymbol{f}_{d,i}+\boldsymbol{f}_{g\rightarrow p,i}^{\prime })/\unicode[STIX]{x1D6FC}-\unicode[STIX]{x1D70C}V_{p,i}\boldsymbol{g},\end{eqnarray}$$
where $\boldsymbol{f}_{d,i}$
is the drag force and
$\boldsymbol{f}_{d,i}$
is the drag force and $\boldsymbol{f}_{g\rightarrow p,i}^{\prime }$
includes all the remaining gas–particle interaction forces such as the virtual mass effect and the Basset force (Zhou et al.
Reference Zhou, Kuang, Chu and Yu2010).
$\boldsymbol{f}_{g\rightarrow p,i}^{\prime }$
includes all the remaining gas–particle interaction forces such as the virtual mass effect and the Basset force (Zhou et al.
Reference Zhou, Kuang, Chu and Yu2010).
Due to their low importance in gas–solid flows, the forces included in $\boldsymbol{f}_{g\rightarrow p,i}^{\prime }$
are neglected in this study. The Wen & Yu (Reference Wen and Yu1966) drag model is used to account for the effect of the local particle volume fraction on the drag force:
$\boldsymbol{f}_{g\rightarrow p,i}^{\prime }$
are neglected in this study. The Wen & Yu (Reference Wen and Yu1966) drag model is used to account for the effect of the local particle volume fraction on the drag force:
 $$\begin{eqnarray}\boldsymbol{f}_{d,i}=\frac{3}{4}\frac{\unicode[STIX]{x1D70C}V_{i}}{d_{i}}C_{d}(\boldsymbol{u}_{i}-\boldsymbol{v}_{i})\unicode[STIX]{x1D6FC}^{-1.65},\end{eqnarray}$$
where $V_{i}$
and
$V_{i}$
and $d_{i}$
are the volume and the diameter of the particle,
$d_{i}$
are the volume and the diameter of the particle, $C_{d}$
is the drag coefficient,
$C_{d}$
is the drag coefficient, $\boldsymbol{u}_{i}$
is the flow velocity interpolated at the particle position and
$\boldsymbol{u}_{i}$
is the flow velocity interpolated at the particle position and $\boldsymbol{v}_{i}$
is the particle velocity. The drag coefficient is evaluated based on the Schiller & Naumann (Reference Schiller and Naumann1933) correlation as formulated by Rowe (Reference Rowe1961):
$\boldsymbol{v}_{i}$
is the particle velocity. The drag coefficient is evaluated based on the Schiller & Naumann (Reference Schiller and Naumann1933) correlation as formulated by Rowe (Reference Rowe1961):
 $$\begin{eqnarray}C_{d}=\left\{\begin{array}{@{}ll@{}}\displaystyle \frac{24}{Re_{i}}(1+0.15Re_{i}^{0.687}) & \text{if }Re_{i}<1000,\\ 0.44Re_{i} & \text{if }Re_{i}\geqslant 1000,\end{array}\right.\end{eqnarray}$$
where
 $$\begin{eqnarray}Re_{i}=\frac{\unicode[STIX]{x1D6FC}\unicode[STIX]{x1D70C}|\boldsymbol{u}_{i}-\boldsymbol{v}_{i}|d_{p,i}}{\unicode[STIX]{x1D707}}\end{eqnarray}$$
is the particle Reynolds number.
2.1 Triboelectric charging
The term ‘effective work function difference’ stems from the well-established theory of contact charging between metals, where the total charge transferred between two objects is proportional to the work function difference of the surfaces (i.e. the difference in the energies required to extract an electron from each surface). In the case of ideal insulators, electrons are localized and participate in chemical bonding between molecules. In terms of band theory, it is very unlikely that an electron will transfer from a valence state on one surface to a conduction state on another, as the energy gap between the valence and conduction bands is wide. However, the band theory is theoretically valid only for continuous, homogeneous systems, so contact charging of insulators has been associated with electron states present at the surfaces only (Lowell & Rose-Innes Reference Lowell and Rose-Innes1980; Castle Reference Castle1997; Mehrani, Bi & Grace Reference Mehrani, Bi and Grace2007; Lacks & Sankaran Reference Lacks and Sankaran2011; Fotovat et al. Reference Fotovat, Bi and Grace2017b ).
The surface state theory (Lowell & Rose-Innes Reference Lowell and Rose-Innes1980) describes the charge transfer between two insulating surfaces based on the amount of available donor and acceptor states on the surfaces. Originally the theory was proposed for electron transfer, but it applies conceptually to ion transfer as well (Lee Reference Lee1994). The numerical model proposed by Laurentie et al. (Reference Laurentie, Traore, Dragan and Dascalescu2010, Reference Laurentie, Traoré and Dascalescu2013) is based on so-called high-density limit of the surface state theory: it is assumed that the net charge exchange between surfaces is not limited by the density of the available donor and acceptor states but rather by the electric field developed in the contact gap when the surfaces are separated.
2.1.1 Numerical model
Based on Laurentie et al. (Reference Laurentie, Traoré and Dascalescu2013), the charge exchange between two objects (either two particles or a particle and a wall) due to a discrete change in the contact area is given by
 $$\begin{eqnarray}\frac{\unicode[STIX]{x0394}q_{ij}}{\unicode[STIX]{x0394}A_{ij}}=\unicode[STIX]{x1D700}\left(\frac{\unicode[STIX]{x0394}\unicode[STIX]{x1D711}_{ji}}{\unicode[STIX]{x1D6FF}_{c}e^{+}}+\boldsymbol{E}_{ij}\boldsymbol{\cdot }\boldsymbol{n}_{ij}\right),\end{eqnarray}$$
where $\unicode[STIX]{x0394}q_{ij}$
is the charge transferred to object
$\unicode[STIX]{x0394}q_{ij}$
is the charge transferred to object $i$
from object
$i$
from object $j$
,
$j$
, $\unicode[STIX]{x0394}A_{ij}$
is the change in the contact area,
$\unicode[STIX]{x0394}A_{ij}$
is the change in the contact area, $\unicode[STIX]{x1D700}$
is the permittivity of the gas,
$\unicode[STIX]{x1D700}$
is the permittivity of the gas, $\unicode[STIX]{x0394}\unicode[STIX]{x1D711}_{ji}=\unicode[STIX]{x1D711}_{j}-\unicode[STIX]{x1D711}_{i}$
is the effective work function difference between the surfaces,
$\unicode[STIX]{x0394}\unicode[STIX]{x1D711}_{ji}=\unicode[STIX]{x1D711}_{j}-\unicode[STIX]{x1D711}_{i}$
is the effective work function difference between the surfaces, $\unicode[STIX]{x1D6FF}_{c}$
is the critical distance over which charge can transfer,
$\unicode[STIX]{x1D6FF}_{c}$
is the critical distance over which charge can transfer, $e^{+}$
is the elementary (positive) charge and
$e^{+}$
is the elementary (positive) charge and $\boldsymbol{E}_{ij}$
is the electric field at the contact point without the contribution of the charge transferred during the contact. In line with Laurentie et al. (Reference Laurentie, Traore, Dragan and Dascalescu2010, Reference Laurentie, Traoré and Dascalescu2013), charge transfer is restricted to the period during which the contact area is increasing
$\boldsymbol{E}_{ij}$
is the electric field at the contact point without the contribution of the charge transferred during the contact. In line with Laurentie et al. (Reference Laurentie, Traore, Dragan and Dascalescu2010, Reference Laurentie, Traoré and Dascalescu2013), charge transfer is restricted to the period during which the contact area is increasing $(\unicode[STIX]{x0394}A_{ij}>0)$
. This ensures that the total charge transferred during a collision is proportional to the maximum contact area.
$(\unicode[STIX]{x0394}A_{ij}>0)$
. This ensures that the total charge transferred during a collision is proportional to the maximum contact area.
The critical distance $\unicode[STIX]{x1D6FF}_{c}$
is an approximate distance over which charge transfer is reasonably probable. The values of
$\unicode[STIX]{x1D6FF}_{c}$
is an approximate distance over which charge transfer is reasonably probable. The values of $\unicode[STIX]{x1D6FF}_{c}$
found in the literature vary significantly and the value generally depends on environmental conditions such as humidity and, of course, the actual species responsible for the charge transfer (McCarty & Whitesides Reference McCarty and Whitesides2008). As the total charge transferred during a contact depends only on the ratio
$\unicode[STIX]{x1D6FF}_{c}$
found in the literature vary significantly and the value generally depends on environmental conditions such as humidity and, of course, the actual species responsible for the charge transfer (McCarty & Whitesides Reference McCarty and Whitesides2008). As the total charge transferred during a contact depends only on the ratio $\unicode[STIX]{x0394}\unicode[STIX]{x1D711}/(\unicode[STIX]{x1D6FF}_{c}e^{+})$
, it was not considered reasonable to choose an explicit value for
$\unicode[STIX]{x0394}\unicode[STIX]{x1D711}/(\unicode[STIX]{x1D6FF}_{c}e^{+})$
, it was not considered reasonable to choose an explicit value for $\unicode[STIX]{x1D6FF}_{c}$
in this study. Instead,
$\unicode[STIX]{x1D6FF}_{c}$
in this study. Instead, $\unicode[STIX]{x0394}\unicode[STIX]{x1D711}/(\unicode[STIX]{x1D6FF}_{c}e^{+})$
is used as a lumped parameter in the simulations, including the influence of both the effective work function difference and the critical distance. According to (2.10), this parameter can be interpreted as the electric field strength required to suppress charge transfer.
$\unicode[STIX]{x0394}\unicode[STIX]{x1D711}/(\unicode[STIX]{x1D6FF}_{c}e^{+})$
is used as a lumped parameter in the simulations, including the influence of both the effective work function difference and the critical distance. According to (2.10), this parameter can be interpreted as the electric field strength required to suppress charge transfer.
The advantage of this triboelectric charging model is its compatibility with the discrete element model. The change in contact area of the colliding objects is approximated from the change in the normal overlap distance $\unicode[STIX]{x1D6FF}_{n,ij}$
as (Kolehmainen et al.
Reference Kolehmainen, Ozel, Boyce and Sundaresan2017a
)
$\unicode[STIX]{x1D6FF}_{n,ij}$
as (Kolehmainen et al.
Reference Kolehmainen, Ozel, Boyce and Sundaresan2017a
)
 $$\begin{eqnarray}\unicode[STIX]{x0394}A_{ij}=2\unicode[STIX]{x03C0}r^{\ast }\unicode[STIX]{x0394}\unicode[STIX]{x1D6FF}_{n,ij},\end{eqnarray}$$
which is straightforward to evaluate as the normal overlap distance is already required by the contact model. Note that possible change in contact area due to the relative tangential velocity of the colliding surfaces is not taken into account in (2.11).
To speed up the simulations, a relatively low Young’s modulus is applied to the particles so as to increase the average collision time. This increases the average contact area and hence the average charge transferred in each collision. Based on the soft-sphere contact model, Kolehmainen et al. (Reference Kolehmainen, Ozel, Boyce and Sundaresan2017a ) concluded that if damping forces are neglected, the ratio of the charge that would be transferred in a real contact to the charge transferred in a simulated ‘soft’ contact is
 $$\begin{eqnarray}a_{corr}=\frac{\unicode[STIX]{x0394}q_{real}}{\unicode[STIX]{x0394}q_{soft}}=\left(\frac{Y_{soft}^{\ast }}{Y_{real}^{\ast }}\right)^{2/5}.\end{eqnarray}$$
As long as the particle softening does not alter significantly the dynamics of the bed, the effect of particle softening can be eliminated by multiplying the charge transfer rate given by (2.10) with $a_{corr}$
(Kolehmainen et al.
Reference Kolehmainen, Ozel, Boyce and Sundaresan2017a
).
$a_{corr}$
(Kolehmainen et al.
Reference Kolehmainen, Ozel, Boyce and Sundaresan2017a
).
To achieve feasible simulation times, the charge transfer rate given by (2.12) is further scaled by an artificial acceleration factor $a$
. In earlier studies by Kolehmainen et al. (Reference Kolehmainen, Ozel, Boyce and Sundaresan2017a
,Reference Kolehmainen, Sippola, Raitanen, Ozel, Boyce, Saarenrinne and Sundaresan
b
), the acceleration factor did not affect the saturation charge significantly. However, artificially increasing the charge transfer rate distorts the charge distribution, increasing the proportion of charge on the most strongly charged particles. This is further discussed in later sections.
$a$
. In earlier studies by Kolehmainen et al. (Reference Kolehmainen, Ozel, Boyce and Sundaresan2017a
,Reference Kolehmainen, Sippola, Raitanen, Ozel, Boyce, Saarenrinne and Sundaresan
b
), the acceleration factor did not affect the saturation charge significantly. However, artificially increasing the charge transfer rate distorts the charge distribution, increasing the proportion of charge on the most strongly charged particles. This is further discussed in later sections.
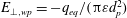
2.2 Equilibrium charge
In this study, the equilibrium charge is defined as the maximum charge that a particle can acquire by means of triboelectric charging when in contact with an uncharged and unpolarized insulating wall. In terms of the present charging model, equilibrium is achieved when the charge transfer is suppressed by the electric field induced by the particle itself.
Based on (2.10) no charge is transferred during a particle–wall contact when
 $$\begin{eqnarray}\frac{\unicode[STIX]{x0394}\unicode[STIX]{x1D711}_{wp}}{\unicode[STIX]{x1D6FF}_{c}e^{+}}+E_{\bot ,wp}=0,\end{eqnarray}$$
where $\unicode[STIX]{x0394}\unicode[STIX]{x1D711}_{wp}=\unicode[STIX]{x1D711}_{w}-\unicode[STIX]{x1D711}_{p}$
is the effective work function difference between the wall and the particle and
$\unicode[STIX]{x0394}\unicode[STIX]{x1D711}_{wp}=\unicode[STIX]{x1D711}_{w}-\unicode[STIX]{x1D711}_{p}$
is the effective work function difference between the wall and the particle and $E_{\bot ,wp}$
is the electric field strength normal to the wall at the contact point (pointing towards the particle). Neglecting any external electric field and assuming that the particle is perfectly spherical and uniformly charged, the electric field due to the particle itself is
$E_{\bot ,wp}$
is the electric field strength normal to the wall at the contact point (pointing towards the particle). Neglecting any external electric field and assuming that the particle is perfectly spherical and uniformly charged, the electric field due to the particle itself is $E_{\bot ,wp}=-q_{eq}/(\unicode[STIX]{x03C0}\unicode[STIX]{x1D700}d_{p}^{2})$
, where
$E_{\bot ,wp}=-q_{eq}/(\unicode[STIX]{x03C0}\unicode[STIX]{x1D700}d_{p}^{2})$
, where $q_{eq}$
is the equilibrium charge. Substituting to (2.13) and rearranging gives the equilibrium charge
$q_{eq}$
is the equilibrium charge. Substituting to (2.13) and rearranging gives the equilibrium charge
 $$\begin{eqnarray}q_{eq}=\unicode[STIX]{x03C0}\unicode[STIX]{x1D700}d_{p}^{2}\left(\frac{\unicode[STIX]{x0394}\unicode[STIX]{x1D711}_{wp}}{\unicode[STIX]{x1D6FF}_{c}e^{+}}\right).\end{eqnarray}$$
When multiple particles are involved, the level at which the mean particle charge saturates is limited by the total electric field developed in the bed. Also the electric field due to a charged wall further restricts accumulation of charge on particles; consequently, the mean particle charge in a bed can be considerably smaller than $q_{eq}$
.
$q_{eq}$
.
In accordance with Kolehmainen et al. (Reference Kolehmainen, Ozel, Boyce and Sundaresan2017a
,Reference Kolehmainen, Sippola, Raitanen, Ozel, Boyce, Saarenrinne and Sundaresan
b
), the expected magnitude of electrostatic effects is characterized by the dimensionless quantity $e/g$
(here
$e/g$
(here $e/g$
is a symbol and does not equal to
$e/g$
is a symbol and does not equal to $e^{+}/g$
), which is the ratio of the magnitude of the electrostatic force between two particles with equilibrium charge to the gravitational force:
$e^{+}/g$
), which is the ratio of the magnitude of the electrostatic force between two particles with equilibrium charge to the gravitational force:
 $$\begin{eqnarray}e/g\equiv \frac{q_{eq}^{2}/(4\unicode[STIX]{x03C0}\unicode[STIX]{x1D700}d_{p}^{2})}{mg},\end{eqnarray}$$
where $m$
is the mass of a particle. Together with (2.14), this parameter can be used to estimate the importance of electrostatic forces in the bed with a given effective work function difference.
$m$
is the mass of a particle. Together with (2.14), this parameter can be used to estimate the importance of electrostatic forces in the bed with a given effective work function difference.
2.3 Electrostatic forces
Assuming that the charge on particle $i$
is uniformly distributed on its surface and neglecting possible non-uniformity of the electric field over the particle, the electrostatic force acting on the particle is given by
$i$
is uniformly distributed on its surface and neglecting possible non-uniformity of the electric field over the particle, the electrostatic force acting on the particle is given by
 $$\begin{eqnarray}\boldsymbol{f}_{e,i}=q_{i}\boldsymbol{E}_{i},\end{eqnarray}$$
where $q_{i}$
is the charge of the particle and
$q_{i}$
is the charge of the particle and $\boldsymbol{E}_{i}$
is the electric field evaluated at the centre of the particle. When charge on the particle surfaces is uniformly distributed, the particles can be treated as point charges when evaluating the electric field (Feynman, Leighton & Sands Reference Feynman, Leighton and Sands1966): for example, the electric field on particle
$\boldsymbol{E}_{i}$
is the electric field evaluated at the centre of the particle. When charge on the particle surfaces is uniformly distributed, the particles can be treated as point charges when evaluating the electric field (Feynman, Leighton & Sands Reference Feynman, Leighton and Sands1966): for example, the electric field on particle $i$
due to particle
$i$
due to particle $j$
is given by
$j$
is given by
 $$\begin{eqnarray}\boldsymbol{E}_{j\rightarrow i}=\frac{q_{j}}{4\unicode[STIX]{x03C0}\unicode[STIX]{x1D700}}\frac{\boldsymbol{x}_{i}-\boldsymbol{x}_{j}}{|\boldsymbol{x}_{i}-\boldsymbol{x}_{j}|^{3}},\end{eqnarray}$$
where $q_{j}$
is the charge of particle
$q_{j}$
is the charge of particle $j$
and
$j$
and $\boldsymbol{x}$
denotes the position of the particle indicated by the subscript.
$\boldsymbol{x}$
denotes the position of the particle indicated by the subscript.
The electric field affecting on each particle is evaluated based on a particle–particle particle–mesh (PPPM) method, which in general is based on mapping particles to a computational mesh and solving a potential over the mesh (according to a relevant discretized Poisson equation). Long-range interactions between particles are then solved by interpolating the field from the mesh to each particle, but interactions between particles close to each other are evaluated through a direct sum (Toukmaji & Board Reference Toukmaji and Board1996).
In accordance with Kolehmainen, Ozel & Sundaresan (Reference Kolehmainen, Ozel and Sundaresan2016), Kolehmainen et al. (Reference Kolehmainen, Ozel, Boyce and Sundaresan2017a
,Reference Kolehmainen, Sippola, Raitanen, Ozel, Boyce, Saarenrinne and Sundaresan
b
), the electric field affecting particle $i$
is expressed as a sum a short-range term
$i$
is expressed as a sum a short-range term $\boldsymbol{E}_{s,i}$
, a long-range term
$\boldsymbol{E}_{s,i}$
, a long-range term $\boldsymbol{E}_{\unicode[STIX]{x1D6FB}^{2},i}$
and a correction term
$\boldsymbol{E}_{\unicode[STIX]{x1D6FB}^{2},i}$
and a correction term $\boldsymbol{E}_{c,i}$
, which is used to remove the overlapping contribution of the former two. The short-range term is evaluated as a direct contribution due to the nearby particles as
$\boldsymbol{E}_{c,i}$
, which is used to remove the overlapping contribution of the former two. The short-range term is evaluated as a direct contribution due to the nearby particles as
 $$\begin{eqnarray}\boldsymbol{E}_{s,i}=\frac{1}{4\unicode[STIX]{x03C0}\unicode[STIX]{x1D700}}\mathop{\sum }_{j}q_{j}\frac{\boldsymbol{x}_{i}-\boldsymbol{x}_{j}}{|\boldsymbol{x}_{i}-\boldsymbol{x}_{j}|^{3}}.\end{eqnarray}$$
In this study, the procedure for solving the short-range electric field is adapted to the DEM implementation of OpenFOAM. A list of so-called interacting cells is constructed at the beginning of the simulations to track the location of the particles in the computational mesh. The short-range term is not limited by a prescribed cutoff radius as in Kolehmainen et al. (Reference Kolehmainen, Ozel and Sundaresan2016, Reference Kolehmainen, Ozel, Boyce and Sundaresan2017a
,Reference Kolehmainen, Sippola, Raitanen, Ozel, Boyce, Saarenrinne and Sundaresan
b
) but covers all the particles located in the interacting cells. The list of interacting cells is determined according to the desired minimum distance of the short-range term ( $\unicode[STIX]{x1D6FF}_{s,min}$
). For example, all the particles in cell
$\unicode[STIX]{x1D6FF}_{s,min}$
). For example, all the particles in cell $A$
contribute to the short range field of the particles in cell
$A$
contribute to the short range field of the particles in cell $B$
if the shortest distance between the cells is below
$B$
if the shortest distance between the cells is below $\unicode[STIX]{x1D6FF}_{s,min}$
.
$\unicode[STIX]{x1D6FF}_{s,min}$
.
Similarly to Kolehmainen et al. (Reference Kolehmainen, Ozel and Sundaresan2016, Reference Kolehmainen, Ozel, Boyce and Sundaresan2017a
,Reference Kolehmainen, Sippola, Raitanen, Ozel, Boyce, Saarenrinne and Sundaresan
b
), the long-range field is evaluated as the gradient of the electric potential $\unicode[STIX]{x1D719}$
over the computational mesh:
$\unicode[STIX]{x1D719}$
over the computational mesh:
 $$\begin{eqnarray}\boldsymbol{E}_{\unicode[STIX]{x1D6FB}^{2}}=-\unicode[STIX]{x1D735}\unicode[STIX]{x1D719}.\end{eqnarray}$$
The electric potential, in turn, is solved from a Poisson equation
 $$\begin{eqnarray}\unicode[STIX]{x1D6FB}^{2}\unicode[STIX]{x1D719}=-\frac{\unicode[STIX]{x1D70C}_{c}}{\unicode[STIX]{x1D700}},\end{eqnarray}$$
where $\unicode[STIX]{x1D70C}_{c}$
is the volumetric charge density based on the total charge in each cell and
$\unicode[STIX]{x1D70C}_{c}$
is the volumetric charge density based on the total charge in each cell and $\unicode[STIX]{x1D700}$
is the mixture permittivity.
$\unicode[STIX]{x1D700}$
is the mixture permittivity.
A correction term is used to remove the contribution of the charge already involved in the short-range term from the long-range term. This is done by approximating the contribution of the charge in the interacting cells to the long-range field in each cell. The correction term for particles in cell $A$
is
$A$
is
 $$\begin{eqnarray}\boldsymbol{E}_{c,A}=-\frac{1}{4\unicode[STIX]{x03C0}\unicode[STIX]{x1D700}}\mathop{\sum }_{B}Q_{B}\frac{\boldsymbol{x}_{A}-\boldsymbol{x}_{B}}{|\boldsymbol{x}_{A}-\boldsymbol{x}_{B}|^{3}},\end{eqnarray}$$
where the sum is taken over all interacting cells of cell $A$
,
$A$
, $Q_{B}$
is the total charge in interacting cell
$Q_{B}$
is the total charge in interacting cell $B$
and
$B$
and $\boldsymbol{x}$
indicates the location of the cell centre indicated by the subscript. Differing from Kolehmainen et al. (Reference Kolehmainen, Ozel and Sundaresan2016, Reference Kolehmainen, Ozel, Boyce and Sundaresan2017a
,Reference Kolehmainen, Sippola, Raitanen, Ozel, Boyce, Saarenrinne and Sundaresan
b
), the correction term is equal for all particles in a cell, so the electric field correction can be conducted cell by cell before mapping the long-range field to the particles.
$\boldsymbol{x}$
indicates the location of the cell centre indicated by the subscript. Differing from Kolehmainen et al. (Reference Kolehmainen, Ozel and Sundaresan2016, Reference Kolehmainen, Ozel, Boyce and Sundaresan2017a
,Reference Kolehmainen, Sippola, Raitanen, Ozel, Boyce, Saarenrinne and Sundaresan
b
), the correction term is equal for all particles in a cell, so the electric field correction can be conducted cell by cell before mapping the long-range field to the particles.
In order to evaluate the charge transfer between particles, the electric field at the contact point of particles $i$
and
$i$
and $j$
is approximated as
$j$
is approximated as
 $$\begin{eqnarray}\boldsymbol{E}_{ij}\boldsymbol{\cdot }\boldsymbol{n}_{ij}=\boldsymbol{E}_{r,ij}\boldsymbol{\cdot }\boldsymbol{n}_{ij}-q_{i}/(\unicode[STIX]{x03C0}\unicode[STIX]{x1D700}d_{p,i}^{2})+q_{j}/(\unicode[STIX]{x03C0}\unicode[STIX]{x1D700}d_{p,j}^{2}),\end{eqnarray}$$
where $\boldsymbol{E}_{r,ij}$
is the electric field due to other sources than the colliding particles.
$\boldsymbol{E}_{r,ij}$
is the electric field due to other sources than the colliding particles. $\boldsymbol{E}_{r,ij}$
is linearly interpolated from electric fields at the particle centres as
$\boldsymbol{E}_{r,ij}$
is linearly interpolated from electric fields at the particle centres as
 $$\begin{eqnarray}\boldsymbol{E}_{r,ij}=\frac{(\boldsymbol{E}_{i}-\boldsymbol{E}_{j\rightarrow i})d_{i}+(\boldsymbol{E}_{j}-\boldsymbol{E}_{i\rightarrow j})d_{j}}{d_{i}+d_{j}}.\end{eqnarray}$$
In the case of a particle–wall contact, the electric field strength at the contact point is approximated as $\boldsymbol{E}_{iw}\boldsymbol{\cdot }\boldsymbol{n}_{iw}=\boldsymbol{E}_{i}\boldsymbol{\cdot }\boldsymbol{n}_{iw}-q_{i}/(\unicode[STIX]{x03C0}\unicode[STIX]{x1D700}d_{p,i}^{2})$
, where
$\boldsymbol{E}_{iw}\boldsymbol{\cdot }\boldsymbol{n}_{iw}=\boldsymbol{E}_{i}\boldsymbol{\cdot }\boldsymbol{n}_{iw}-q_{i}/(\unicode[STIX]{x03C0}\unicode[STIX]{x1D700}d_{p,i}^{2})$
, where $\boldsymbol{E}_{i}$
is the electric field evaluated at the centre of the particle and
$\boldsymbol{E}_{i}$
is the electric field evaluated at the centre of the particle and $\boldsymbol{n}_{iw}$
is an unit normal vector pointing from the contact point towards the particle.
$\boldsymbol{n}_{iw}$
is an unit normal vector pointing from the contact point towards the particle.
2.4 Charge on the wall
Whenever a particle exchanges charge with an insulating wall, an opposite charge remains on the contact area. This in turn affects the electric field developed in the bed. In this study, the wall charge is accounted in the electric field solved over the computational mesh. In principle, the electric potential is solved from (2.20) on both sides of the wall with using an appropriate boundary condition at the interface.
In homogeneous, linear and isotropic dielectric media the polarization is aligned and proportional to the electric field. At the interface of dielectric media $A$
and
$A$
and $B$
holds
$B$
holds
 $$\begin{eqnarray}\boldsymbol{n}_{AB}\boldsymbol{\cdot }(\unicode[STIX]{x1D700}_{B}\boldsymbol{E}_{B}-\unicode[STIX]{x1D700}_{A}\boldsymbol{E}_{A})=\unicode[STIX]{x1D70E},\end{eqnarray}$$
where $\boldsymbol{n}_{AB}$
is an unit normal vector of the interface pointing from
$\boldsymbol{n}_{AB}$
is an unit normal vector of the interface pointing from $A$
to
$A$
to $B$
;
$B$
; $\unicode[STIX]{x1D700}_{A}$
,
$\unicode[STIX]{x1D700}_{A}$
, $\unicode[STIX]{x1D700}_{B}$
,
$\unicode[STIX]{x1D700}_{B}$
, $\boldsymbol{E}_{A}$
and
$\boldsymbol{E}_{A}$
and $\boldsymbol{E}_{B}$
are the permittivities and the electric fields in mediums
$\boldsymbol{E}_{B}$
are the permittivities and the electric fields in mediums $A$
and
$A$
and $B$
in the immediate vicinity to the point considered and
$B$
in the immediate vicinity to the point considered and $\unicode[STIX]{x1D70E}$
is the free charge density on the surface (Jackson Reference Jackson1999).
$\unicode[STIX]{x1D70E}$
is the free charge density on the surface (Jackson Reference Jackson1999).
The charge on each boundary face of the computational mesh is tracked assuming an uniform charge distribution over the face. The electric potential of a boundary face between adjacent cells $A$
and
$A$
and $B$
is obtained by discretizing (2.24), resulting in
$B$
is obtained by discretizing (2.24), resulting in
 $$\begin{eqnarray}\unicode[STIX]{x1D719}_{f}\left(\frac{\unicode[STIX]{x1D700}_{B}}{d_{B}}+\frac{\unicode[STIX]{x1D700}_{A}}{d_{A}}\right)=\unicode[STIX]{x1D700}_{B}\frac{\unicode[STIX]{x1D719}_{B}}{d_{B}}+\unicode[STIX]{x1D700}_{A}\frac{\unicode[STIX]{x1D719}_{A}}{d_{A}}+\unicode[STIX]{x1D70E}_{f},\end{eqnarray}$$
where $\unicode[STIX]{x1D719}_{f}$
is the potential at the boundary face,
$\unicode[STIX]{x1D719}_{f}$
is the potential at the boundary face, $\unicode[STIX]{x1D719}_{A}$
and
$\unicode[STIX]{x1D719}_{A}$
and $\unicode[STIX]{x1D719}_{B}$
are the potentials at the respective cell centres,
$\unicode[STIX]{x1D719}_{B}$
are the potentials at the respective cell centres, $d_{A}$
and
$d_{A}$
and $d_{B}$
are the perpendicular distances from the face to the respective cell centres and
$d_{B}$
are the perpendicular distances from the face to the respective cell centres and $\unicode[STIX]{x1D70E}_{f}$
is the free surface charge density on the face (see figure 1). In (2.25) the normal component of the electric field on both sides of the face has been linearly approximated from the potentials at the face and at the adjacent cell centre.
$\unicode[STIX]{x1D70E}_{f}$
is the free surface charge density on the face (see figure 1). In (2.25) the normal component of the electric field on both sides of the face has been linearly approximated from the potentials at the face and at the adjacent cell centre.
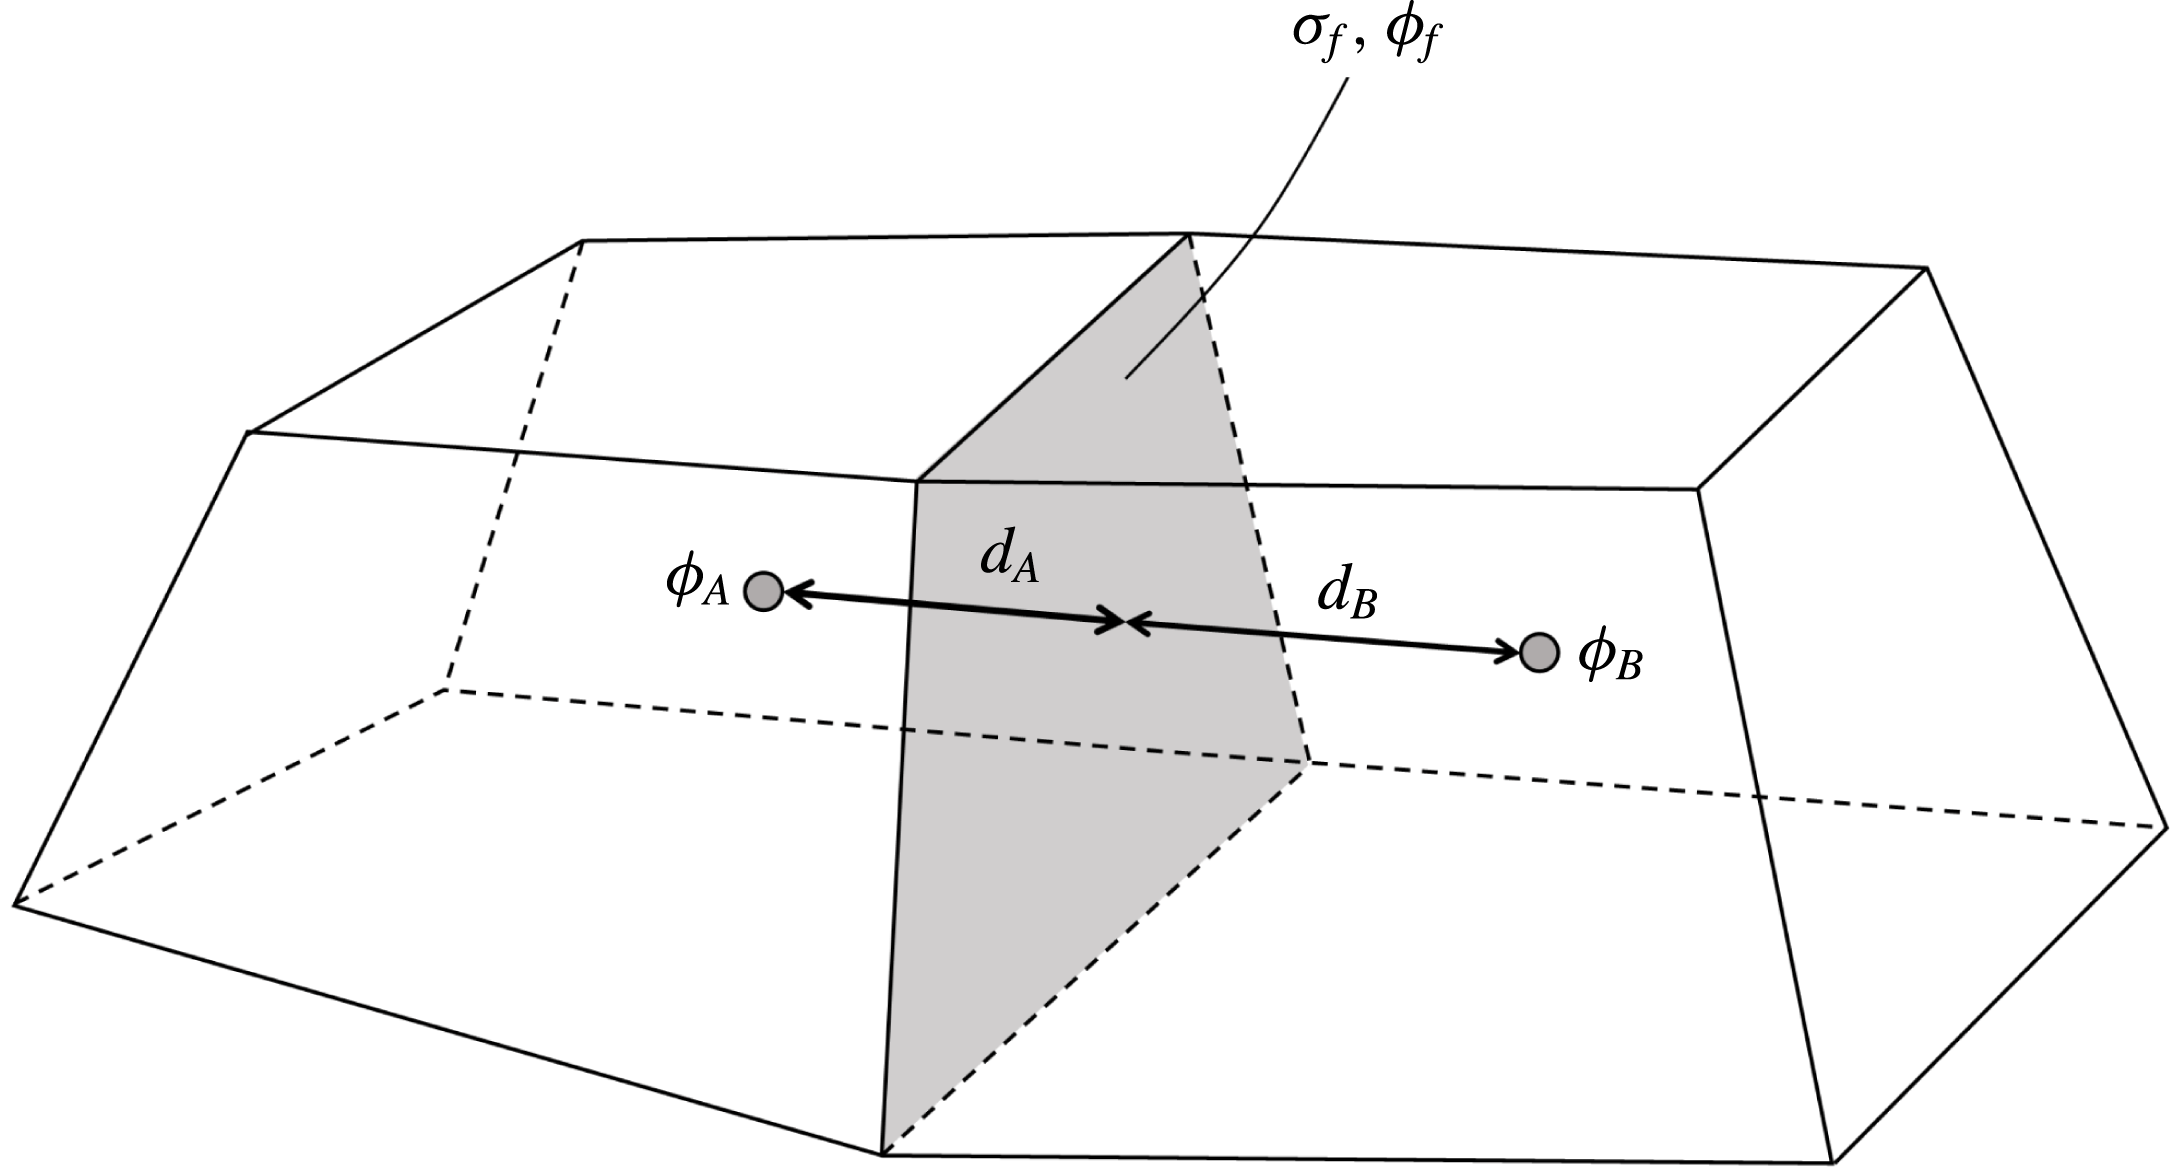
Figure 1. Common face of cells $A$
and
$A$
and $B$
at a region interface.
$B$
at a region interface.
3 Experimental set-up
Spherical polyethylene particles (Cospheric, CPMS-0.96) were fluidized by nitrogen gas in a rectangular soda-lime glass column. Based on the number frequency distribution provided by the manufacturer, the particle size distribution obeys approximately a truncated normal distribution described in table 2.
Table 2. Particle properties, dimensions of the fluidizing device and parameters used for particle image velocimetry.
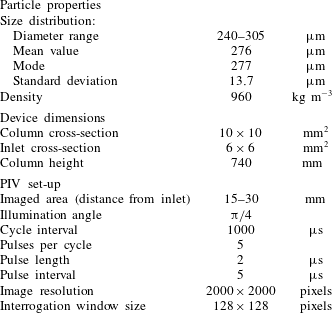
The main components of the experimental set-up are schematically depicted in figure 2. The fluidizing device consists of a rectangular fluidization column (A) and a plastic base part (B). The gas flows through a removable plastic inlet (C) and leaves through a conical expansion (D). The dimensions of the fluidization column are given in table 2.
Figure 2. The fluidizing device and the instruments used. A: glass pipe, B: base part, C: removable inlet, D: conical expansion, E: humidifier, F: rotameter, G: ball valve, H: high-speed camera, I: laser.
The inlet is a square duct covered by a stainless steel grating. Both the glass pipe and the inlet part are removable, which enables collecting the particles after fluidization. The total charge of the particles was measured before and after fluidization using a Faraday cup connected to an electrometer (Monroe 284).
The gas flow rate is controlled by a mass flow controller (Bronkhorst, F201CV). A part of the gas is conveyed through a humidifier (E), while the other part is conveyed directly into the base part (B). The portion of the gas flowing through the humidifier is manually controlled using a rotameter (F) and a ball valve (G). The relative humidity is measured from the base part using a relative humidity and temperature transmitter (Omega HX94 SS RH Probe).
The pressure difference between the base part and the ambient air is measured by a differential pressure sensor (Sensirion SDP1108). The hydrostatic pressure difference due to the density difference between nitrogen and the ambient air is insignificant (under 0.5 Pa), so the measured pressure difference is virtually equal to the overall friction loss across the fluidization device. The pressure loss measured across the empty device is subtracted from the pressure loss measured in each experiment to determine the loss due to the fluidized bed only.
The wall layer was imaged with a high-speed camera (pco dimax HS4) in selected humidities; the humidities were chosen so that the behaviour of the bed is expected to differ between the imaged cases. The bed was illuminated with a pulsed diode HF laser (Cavitar Cavilux HF), giving a cycle of short pulses between time intervals. PIVlab (Thielicke & Stamhuis Reference Thielicke and Stamhuis2014) was used to estimate the velocity of the particles in the imaged area in terms of particle image velocimetry (PIV). The imaged area covers the range of $15$
–
$15$
– $30~\text{mm}$
above the bed inlet and the interrogation window size corresponds to a physical size of about three particles. Other essential parameters of the PIV set-up are given in table 2.
$30~\text{mm}$
above the bed inlet and the interrogation window size corresponds to a physical size of about three particles. Other essential parameters of the PIV set-up are given in table 2.
A set of experiments was carried out in relative humidities ranging from 0 to 60 %. Besides the final charge and mass of the particles, the pressure drop across the bed was measured. The duration of each experiment was 30 min, which was considered sufficient for the charge to saturate in most conditions. The relative humidity was kept in the range of $\pm 1\,\%$
of the desired value during each experiment.
$\pm 1\,\%$
of the desired value during each experiment.
The flow rate of the fluidizing gas was $5.4\times 10^{-5}~\text{m}^{3}~\text{s}^{-1}$
in each experiment, corresponding to a superficial velocity of approximately 50 % of the settling velocity of an average-sized particle. The mass of the particles was measured before each experiment and after measuring the final charge, being
$5.4\times 10^{-5}~\text{m}^{3}~\text{s}^{-1}$
in each experiment, corresponding to a superficial velocity of approximately 50 % of the settling velocity of an average-sized particle. The mass of the particles was measured before each experiment and after measuring the final charge, being $1.5\pm 0.03~\text{g}$
. The final mass was used to determine the final charge-to-mass ratio of the particles.
$1.5\pm 0.03~\text{g}$
. The final mass was used to determine the final charge-to-mass ratio of the particles.
The same set of particles was used in successive experiments, but new particles were added to cover the minor loss of particles during the experiments. The charge on the particles was erased between the experiments by briefly fluidizing them in a high relative humidity ( ${>}60\,\%$
), so that the charge before the next experiment was between
${>}60\,\%$
), so that the charge before the next experiment was between $\pm 3~\text{nC}~\text{g}^{-1}$
. To reasonably estimate the effect of the charge accumulated on the particles to the pressure drop across the bed, the average pressure drop over the last 20 s of each experiment were compared to the time-averaged pressure drop across an effectively uncharged bed (where the final absolute net charge was measured to be smaller than
$\pm 3~\text{nC}~\text{g}^{-1}$
. To reasonably estimate the effect of the charge accumulated on the particles to the pressure drop across the bed, the average pressure drop over the last 20 s of each experiment were compared to the time-averaged pressure drop across an effectively uncharged bed (where the final absolute net charge was measured to be smaller than $1~\text{nC}~\text{g}^{-1}$
).
$1~\text{nC}~\text{g}^{-1}$
).
4 Simulation set-up
4.1 Geometry and boundary conditions
The computational mesh covers the fluidization column from the inlet to the conical expansion and consists of a grid of $1~\text{mm}^{3}$
cubical cells. The dimensions of each cell correspond to approximately three particle diameters, which typically provides nearly grid-independent results in terms of particle–fluid interaction (Radl & Sundaresan Reference Radl and Sundaresan2014) and the PPPM method used to evaluate the electrostatic forces (Kolehmainen et al.
Reference Kolehmainen, Ozel and Sundaresan2016). The minimum range of the short-range electric field was set slightly smaller than
$1~\text{mm}^{3}$
cubical cells. The dimensions of each cell correspond to approximately three particle diameters, which typically provides nearly grid-independent results in terms of particle–fluid interaction (Radl & Sundaresan Reference Radl and Sundaresan2014) and the PPPM method used to evaluate the electrostatic forces (Kolehmainen et al.
Reference Kolehmainen, Ozel and Sundaresan2016). The minimum range of the short-range electric field was set slightly smaller than $1~\text{mm}$
, so only the particles in immediately neighbouring cells contribute to the short-range electric field experienced by each other.
$1~\text{mm}$
, so only the particles in immediately neighbouring cells contribute to the short-range electric field experienced by each other.
For accounting the effect of surface charge on the walls the simulated bed was enclosed in a cylindrical outer region with a diameter of $200~\text{mm}$
. The electric potential was fixed at zero at the outer boundaries of the exterior region and (2.25) was applied at the interface of the regions. Vacuum permittivity was assumed in both regions, thus ignoring the effect of polarization of the wall and the particles. The effect of the metal grating at the bottom of the bed was not taken into account but was treated as a glass surface. The total charge accumulated to the metal grating at the bottom of the bed was found relatively small both in the simulations (
$200~\text{mm}$
. The electric potential was fixed at zero at the outer boundaries of the exterior region and (2.25) was applied at the interface of the regions. Vacuum permittivity was assumed in both regions, thus ignoring the effect of polarization of the wall and the particles. The effect of the metal grating at the bottom of the bed was not taken into account but was treated as a glass surface. The total charge accumulated to the metal grating at the bottom of the bed was found relatively small both in the simulations ( ${<}0.15~\text{nC}$
) and in the experiments (
${<}0.15~\text{nC}$
) and in the experiments ( ${<}2.5~\text{nC}$
).
${<}2.5~\text{nC}$
).
A uniform flow velocity boundary condition was invoked at the flow inlet and a constant pressure boundary condition at the outlet. The density and viscosity of the fluid were set equal with those of dry nitrogen at $297.15~\text{K}$
. The initial state of the simulations was full fluidization of 140 400 (
$297.15~\text{K}$
. The initial state of the simulations was full fluidization of 140 400 ( ${\approx}1.5~\text{g}$
) initially uncharged particles.
${\approx}1.5~\text{g}$
) initially uncharged particles.
4.2 Particle properties
Particle size distribution used in the simulations obeys a truncated normal distribution described in table 2. To achieve reasonable simulation times, a low Young’s modulus ( $0.1~\text{MPa}$
) is applied on both the particles and the wall while the Poisson’s ratio is 0.46 for the particles and 0.22 for the wall. Other characteristics of particle–particle and particle–wall contacts are given in table 3.
$0.1~\text{MPa}$
) is applied on both the particles and the wall while the Poisson’s ratio is 0.46 for the particles and 0.22 for the wall. Other characteristics of particle–particle and particle–wall contacts are given in table 3.
Table 3. The characteristic properties for different contact types.
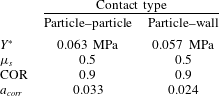
The values of Young’s moduli found in the literature range from 0.5 to 1.2 GPa for polyethylene and from 50 to 90 GPa for glass. This affects the charge transfer rate so that the charge transfer correction factor $a_{corr}$
calculated from (2.12) is in the range of 0.023–0.033 for a particle–particle contact and in the range of 0.017–0.024 for a particle–wall contact. The correction factors used in the simulations (table 3) were calculated according to approximate real Young’s modulus
$a_{corr}$
calculated from (2.12) is in the range of 0.023–0.033 for a particle–particle contact and in the range of 0.017–0.024 for a particle–wall contact. The correction factors used in the simulations (table 3) were calculated according to approximate real Young’s modulus $0.5~\text{GPa}$
for the particles and
$0.5~\text{GPa}$
for the particles and $74~\text{GPa}$
for the wall. This uncertainty when determining
$74~\text{GPa}$
for the wall. This uncertainty when determining $a_{corr}$
is considered acceptable as it affects only the charge transfer rate but not the equilibrium charge of individual particles.
$a_{corr}$
is considered acceptable as it affects only the charge transfer rate but not the equilibrium charge of individual particles.
4.3 Determining the effective work function difference
As discussed before, both the effective work function difference $\unicode[STIX]{x0394}\unicode[STIX]{x1D711}_{wp}$
and the charge transfer cutoff distance
$\unicode[STIX]{x0394}\unicode[STIX]{x1D711}_{wp}$
and the charge transfer cutoff distance $\unicode[STIX]{x1D6FF}_{c}$
are not known and are dependent, for example, on the relative humidity. For this reason, the lumped parameter
$\unicode[STIX]{x1D6FF}_{c}$
are not known and are dependent, for example, on the relative humidity. For this reason, the lumped parameter $\unicode[STIX]{x0394}\unicode[STIX]{x1D711}_{wp}/(\unicode[STIX]{x1D6FF}_{c}e^{+})$
is considered instead of absolute values of
$\unicode[STIX]{x0394}\unicode[STIX]{x1D711}_{wp}/(\unicode[STIX]{x1D6FF}_{c}e^{+})$
is considered instead of absolute values of $\unicode[STIX]{x0394}\unicode[STIX]{x1D711}_{wp}$
. For convenience,
$\unicode[STIX]{x0394}\unicode[STIX]{x1D711}_{wp}$
. For convenience, $\unicode[STIX]{x0394}\unicode[STIX]{x1D711}_{wp}/(\unicode[STIX]{x1D6FF}_{c}e^{+})$
is termed the effective work function difference in the rest of the text.
$\unicode[STIX]{x0394}\unicode[STIX]{x1D711}_{wp}/(\unicode[STIX]{x1D6FF}_{c}e^{+})$
is termed the effective work function difference in the rest of the text.
To reasonably compare simulated and experimental results, the total charge in the simulated bed should saturate to a level similar to that in experiments. To achieve this, a few preliminary simulations were conducted by choosing reasonable values of $e/g$
and calculating the corresponding values of
$e/g$
and calculating the corresponding values of $\unicode[STIX]{x0394}\unicode[STIX]{x1D711}_{wp}/(\unicode[STIX]{x1D6FF}_{c}e^{+})$
from (2.14) and (2.15). To allow comparison with studies using a predefined value for
$\unicode[STIX]{x0394}\unicode[STIX]{x1D711}_{wp}/(\unicode[STIX]{x1D6FF}_{c}e^{+})$
from (2.14) and (2.15). To allow comparison with studies using a predefined value for $\unicode[STIX]{x1D6FF}_{c}$
, work function differences corresponding to
$\unicode[STIX]{x1D6FF}_{c}$
, work function differences corresponding to $\unicode[STIX]{x1D6FF}_{c}=1~\text{nm}$
(Lowell & Rose-Innes Reference Lowell and Rose-Innes1980) and
$\unicode[STIX]{x1D6FF}_{c}=1~\text{nm}$
(Lowell & Rose-Innes Reference Lowell and Rose-Innes1980) and $\unicode[STIX]{x1D6FF}_{c}=500~\text{nm}$
(Laurentie et al.
Reference Laurentie, Traoré and Dascalescu2013) are given in table 4.
$\unicode[STIX]{x1D6FF}_{c}=500~\text{nm}$
(Laurentie et al.
Reference Laurentie, Traoré and Dascalescu2013) are given in table 4.
The work function differences corresponding to the average charge-to-mass ratios at humidity levels of 0–60 % RH were linearly interpolated based on the effective work function differences and the saturated charge-to-mass ratios of the preliminary simulations. The interpolated work function differences were used in the subsequent simulations to produce similar charge-to-mass ratios as in the experiments.
Table 4. The values of $e/g$
used in the preliminary simulations and corresponding effective work function differences with two different values of
$e/g$
used in the preliminary simulations and corresponding effective work function differences with two different values of $\unicode[STIX]{x1D6FF}_{c}$
(basing on the mean particle diameter
$\unicode[STIX]{x1D6FF}_{c}$
(basing on the mean particle diameter $\bar{d}_{p}$
). The resulting charge-to-mass ratios are given in the last column.
$\bar{d}_{p}$
). The resulting charge-to-mass ratios are given in the last column.
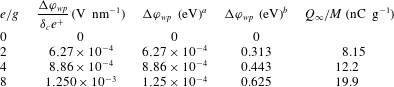
a $\unicode[STIX]{x1D6FF}_{c}=1~\text{nm}$
(Lowell & Rose-Innes Reference Lowell and Rose-Innes1980).
$\unicode[STIX]{x1D6FF}_{c}=1~\text{nm}$
(Lowell & Rose-Innes Reference Lowell and Rose-Innes1980).
b $\unicode[STIX]{x1D6FF}_{c}=500~\text{nm}$
(Laurentie et al.
Reference Laurentie, Traoré and Dascalescu2013).
$\unicode[STIX]{x1D6FF}_{c}=500~\text{nm}$
(Laurentie et al.
Reference Laurentie, Traoré and Dascalescu2013).
4.4 Time step and acceleration factor
The time step used in the simulations is adjusted during run time so that the Courant number of the continuous phase does not exceed 0.5, while the maximum time step is limited to $5\times 10^{-5}~\text{s}$
. Furthermore, each time step is divided into a number of sub-steps to evaluate the collision model.
$5\times 10^{-5}~\text{s}$
. Furthermore, each time step is divided into a number of sub-steps to evaluate the collision model.
Ten different simulations were conducted using acceleration factor $a=10$
(including the preliminary simulations). For comparison, two simulations were also run using acceleration factors 2 and 5 and effective work function differences corresponding to
$a=10$
(including the preliminary simulations). For comparison, two simulations were also run using acceleration factors 2 and 5 and effective work function differences corresponding to $e/g=4$
and
$e/g=4$
and $e/g=8$
. In each case the simulation time was limited to
$e/g=8$
. In each case the simulation time was limited to $at=30~\text{s}$
, which allows the total charge in the bed to effectively saturate.
$at=30~\text{s}$
, which allows the total charge in the bed to effectively saturate.
Although the acceleration factor does not affect the saturation charge significantly, a high charge transfer rate distorts the charge distribution among the particles and causes excessive charge segregation. In order to study the effect of charge segregation, simulations were also performed with fixed charges, assuming that all the particles carry the same charge. Specifically, after running simulations with dynamic tribocharging (with $a=10$
) until the total charge level saturated, the charge of each particle was set to the average value and tribocharging was disabled. The CFD-DEM simulations were then continued with this uniform charge distribution among the particles while maintaining the charge distribution of the wall.
$a=10$
) until the total charge level saturated, the charge of each particle was set to the average value and tribocharging was disabled. The CFD-DEM simulations were then continued with this uniform charge distribution among the particles while maintaining the charge distribution of the wall.
4.5 Determining pressure drop
The pressure drop across the simulated bed was obtained from the difference of the average temporal pressures at the inlet and the outlet. Similarly to the experiments, the pressure drop across an empty simulated bed was subtracted from the overall pressure drop.
The final pressure drop across the bed was determined from the time-averaged pressure drop over the last 0.5 s of each simulation and is compared to the time-averaged pressure drop across an uncharged simulated bed. Although the absolute value of the pressure drop depends, for example, on the chosen drag model, the relative decrease in pressure drop due to particle–wall adhesion was found to be comparable with the experiments.
5 Experimental results
In favourable conditions, one can follow with the bare eye how a stationary layer of particles builds up along the walls. Typically, multiple layers of particles adhere on top of each other (figure 3).
It was found that particles acquire a relatively strong positive net charge in dry conditions but tend to charge negatively when relative humidity exceeds 30 % (figure 4). The charge accumulated on the particles is related to the rate at which particles adhere to the wall: as shown in the inset of figure 4, the motion of particles on the wall ceases rapidly for 0 % and 20 % RH but shows not significant decrease at 30 % RH. At 40 % RH the velocity of the wall layer approaches zero, although at a slower rate than in dry conditions.

Figure 3. Particles adhered to the wall (viewed from the top of the bed). (a) Particles adhered after fluidization at 0 % relative humidity. (b) Adhered particles after simulation corresponding to 0 % RH with an uniform charge distribution among particles.

Figure 4. Final charge-to-mass ratio as a function of relative humidity. The solid curve is drawn to guide the eye and the error bars denote the 95 % confidence intervals. Inset: the approximate root mean square speed of the particles at the wall in different relative humidities, scaled by the superficial velocity of the fluidizing gas.
As particles adhere to the wall, the pressure drop across the bed decreases. The relative decrease in pressure drop compared to the pressure drop across an uncharged bed is shown in figure 5. The inset shows a typical pressure drop in dry conditions, where the effects of tribocharging are the strongest.
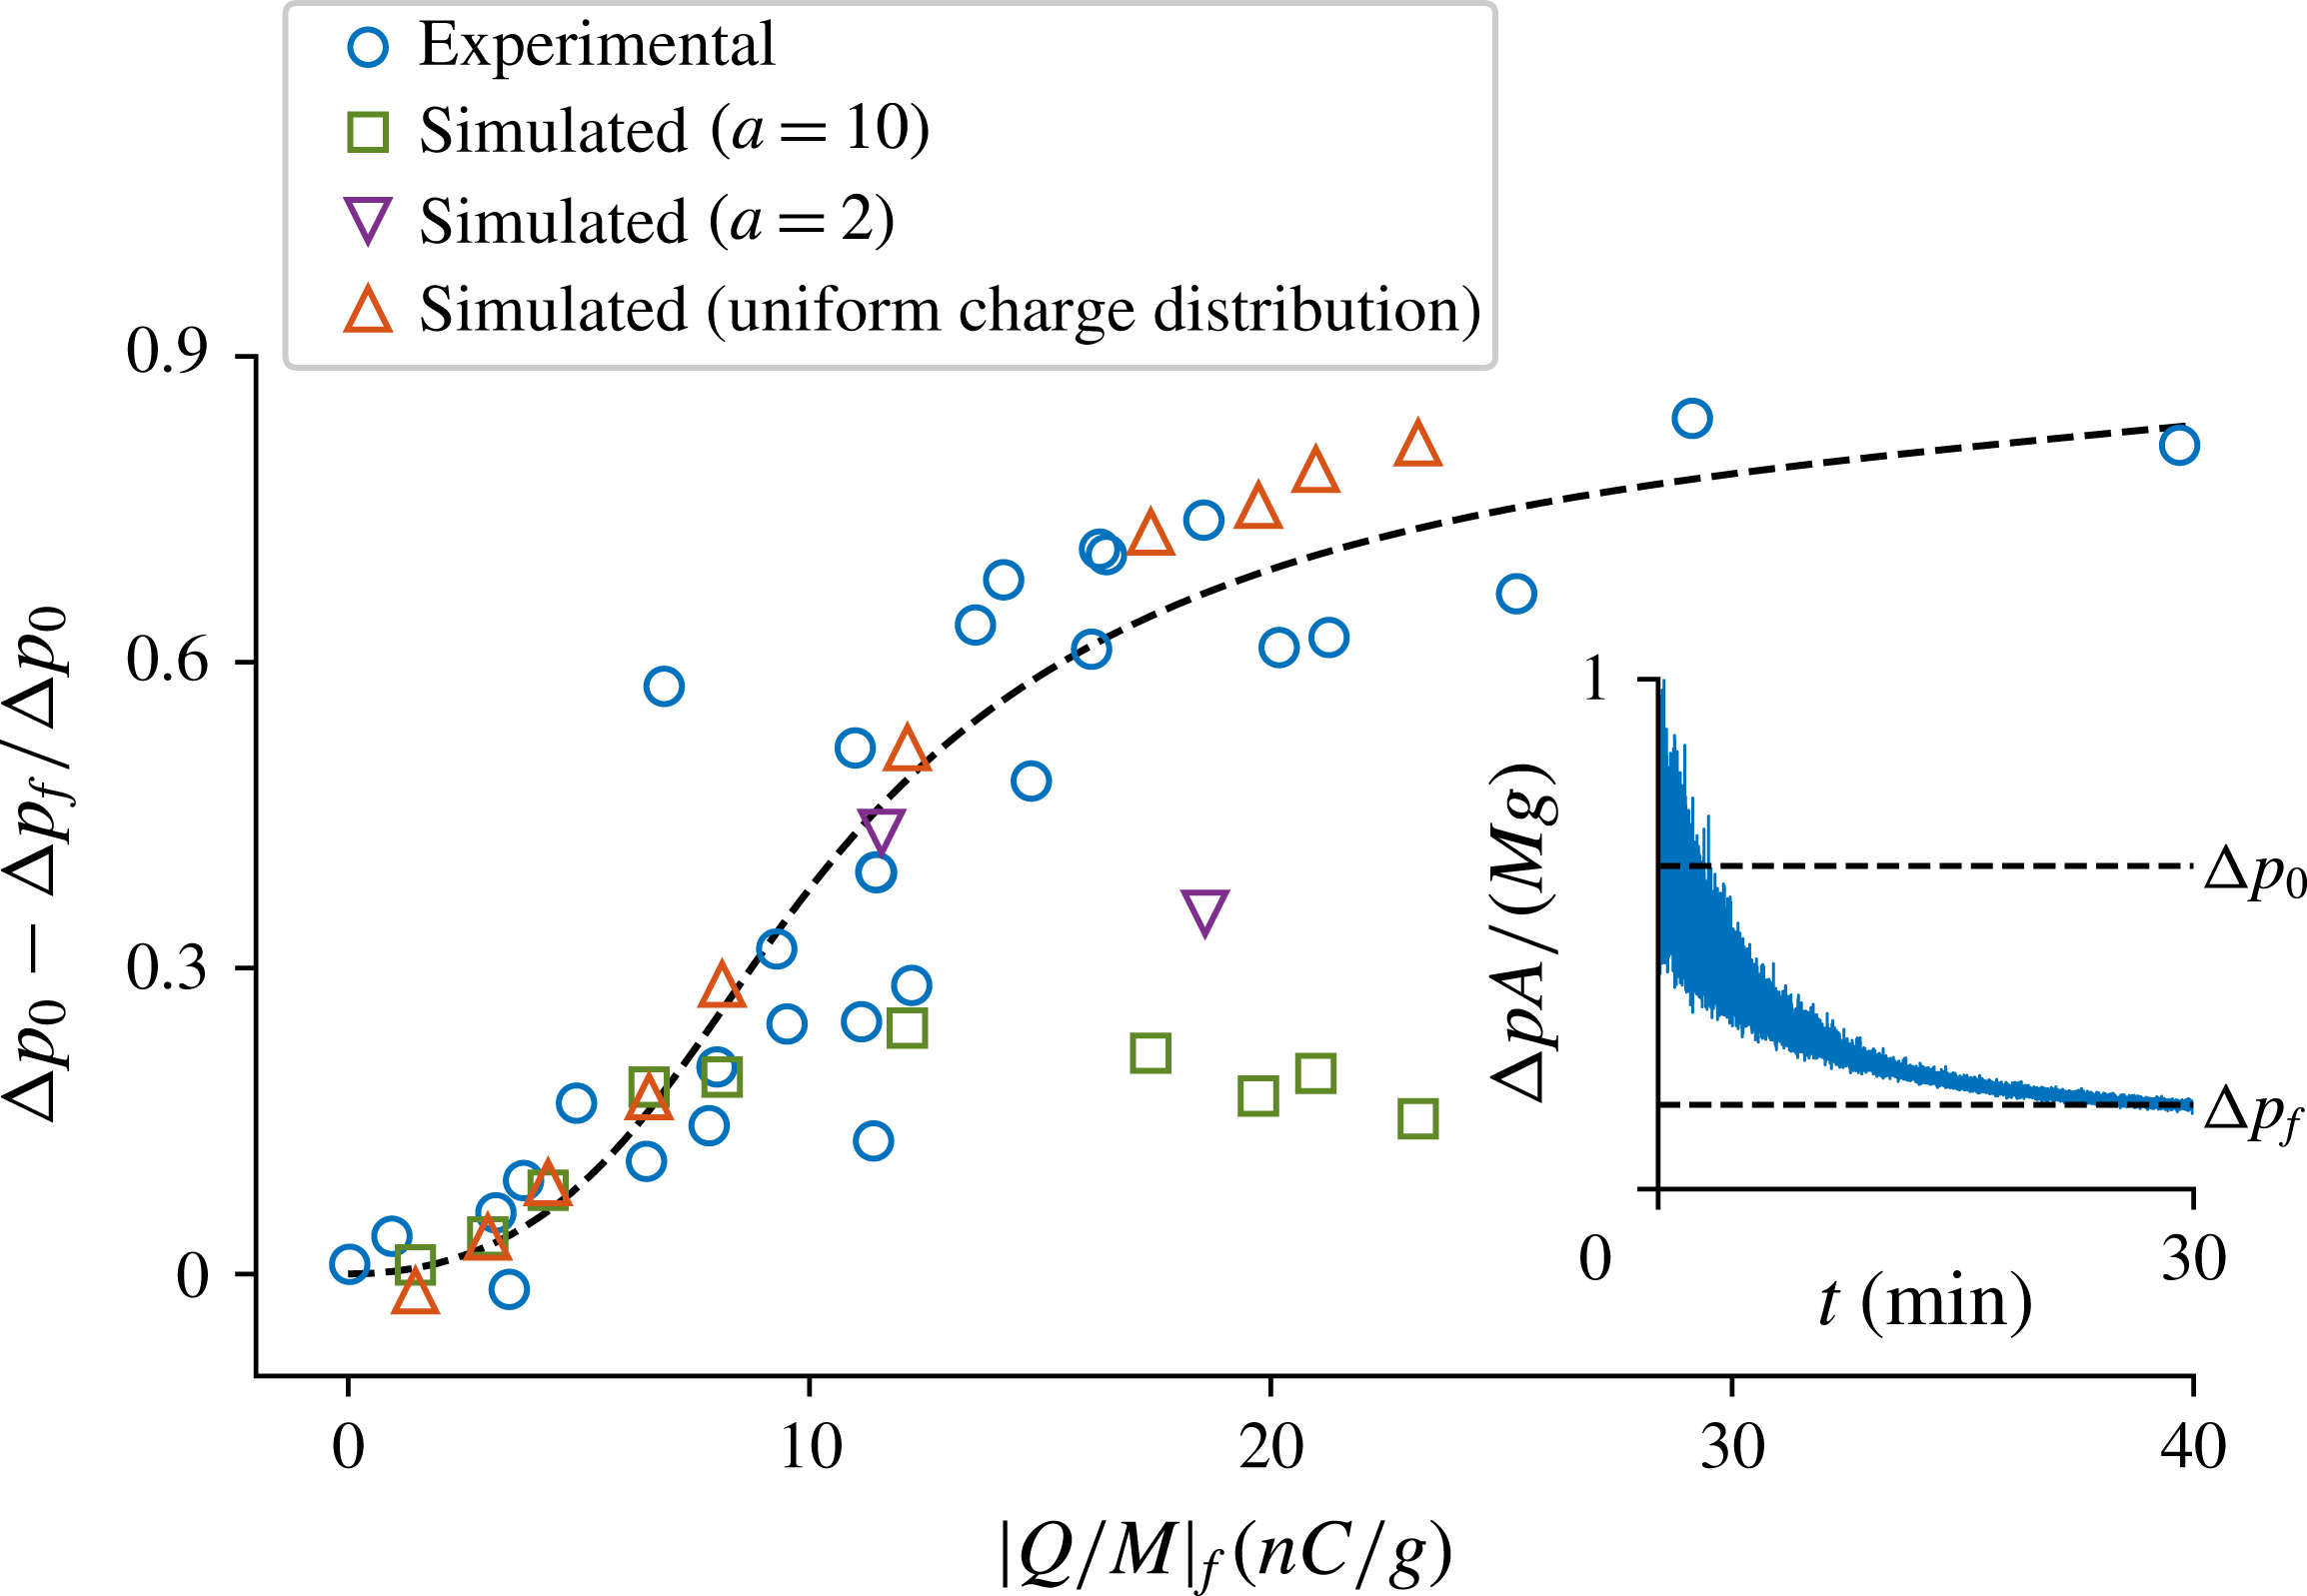
Figure 5. The relative decrease in the pressure drop across the bed as a function of the final absolute charge-to-mass ratio. $\unicode[STIX]{x0394}p_{0}$
is the average pressure drop over an uncharged bed and
$\unicode[STIX]{x0394}p_{0}$
is the average pressure drop over an uncharged bed and $\unicode[STIX]{x0394}p_{f}$
is the final pressure drop. The discrepancy between the experimental results and the simulation results with
$\unicode[STIX]{x0394}p_{f}$
is the final pressure drop. The discrepancy between the experimental results and the simulation results with $a=10$
and
$a=10$
and $a=2$
is explained in 7. Inset: pressure drop measured at 0 % RH (scaled by the total weight
$a=2$
is explained in 7. Inset: pressure drop measured at 0 % RH (scaled by the total weight $Mg$
of the particles and the cross-sectional area
$Mg$
of the particles and the cross-sectional area $A$
of the bed).
$A$
of the bed).
6 Simulation results
The total charge of the simulated bed is found to obey the exponential saturation model (Liao, Hsiau & Huang Reference Liao, Hsiau and Huang2011; Pei, Wu & Adams Reference Pei, Wu and Adams2016; Kolehmainen et al. Reference Kolehmainen, Ozel, Boyce and Sundaresan2017a )
 $$\begin{eqnarray}Q(t)/M=Q_{\infty }/M(1-\text{e}^{-at/\unicode[STIX]{x1D70F}_{Q}}),\end{eqnarray}$$
where $Q(t)$
is the total charge of the particles,
$Q(t)$
is the total charge of the particles, $Q_{\infty }$
is the saturation charge,
$Q_{\infty }$
is the saturation charge, $a$
is the acceleration factor and
$a$
is the acceleration factor and $\unicode[STIX]{x1D70F}_{Q}$
is a time scale depending on the intensity of particle–wall contacts. The total charge is normalized by the total mass
$\unicode[STIX]{x1D70F}_{Q}$
is a time scale depending on the intensity of particle–wall contacts. The total charge is normalized by the total mass $M$
to allow comparison with the experimental charge-to-mass ratios.
$M$
to allow comparison with the experimental charge-to-mass ratios.
The average saturation charge is insensitive to the acceleration factor as shown in figure 6, but the charge distribution is visibly dependent on the acceleration factor. The charge on the majority of the particles is between 0 and $0.1q_{eq}$
, but there is a small peak between
$0.1q_{eq}$
, but there is a small peak between $0.3q_{eq}$
and
$0.3q_{eq}$
and $0.5q_{eq}$
due to the highly charged particles in the vicinity of the wall. The higher the acceleration factor, the further the peaks separate from each other; similar behaviour was also observed by Kolehmainen et al. (Reference Kolehmainen, Ozel, Boyce and Sundaresan2017a
). Both negatively and positively charged particles are present when
$0.5q_{eq}$
due to the highly charged particles in the vicinity of the wall. The higher the acceleration factor, the further the peaks separate from each other; similar behaviour was also observed by Kolehmainen et al. (Reference Kolehmainen, Ozel, Boyce and Sundaresan2017a
). Both negatively and positively charged particles are present when $a\geqslant 5$
, but in the case of
$a\geqslant 5$
, but in the case of $a=2$
the charge distribution is effectively unipolar as seen in figure 6.
$a=2$
the charge distribution is effectively unipolar as seen in figure 6.
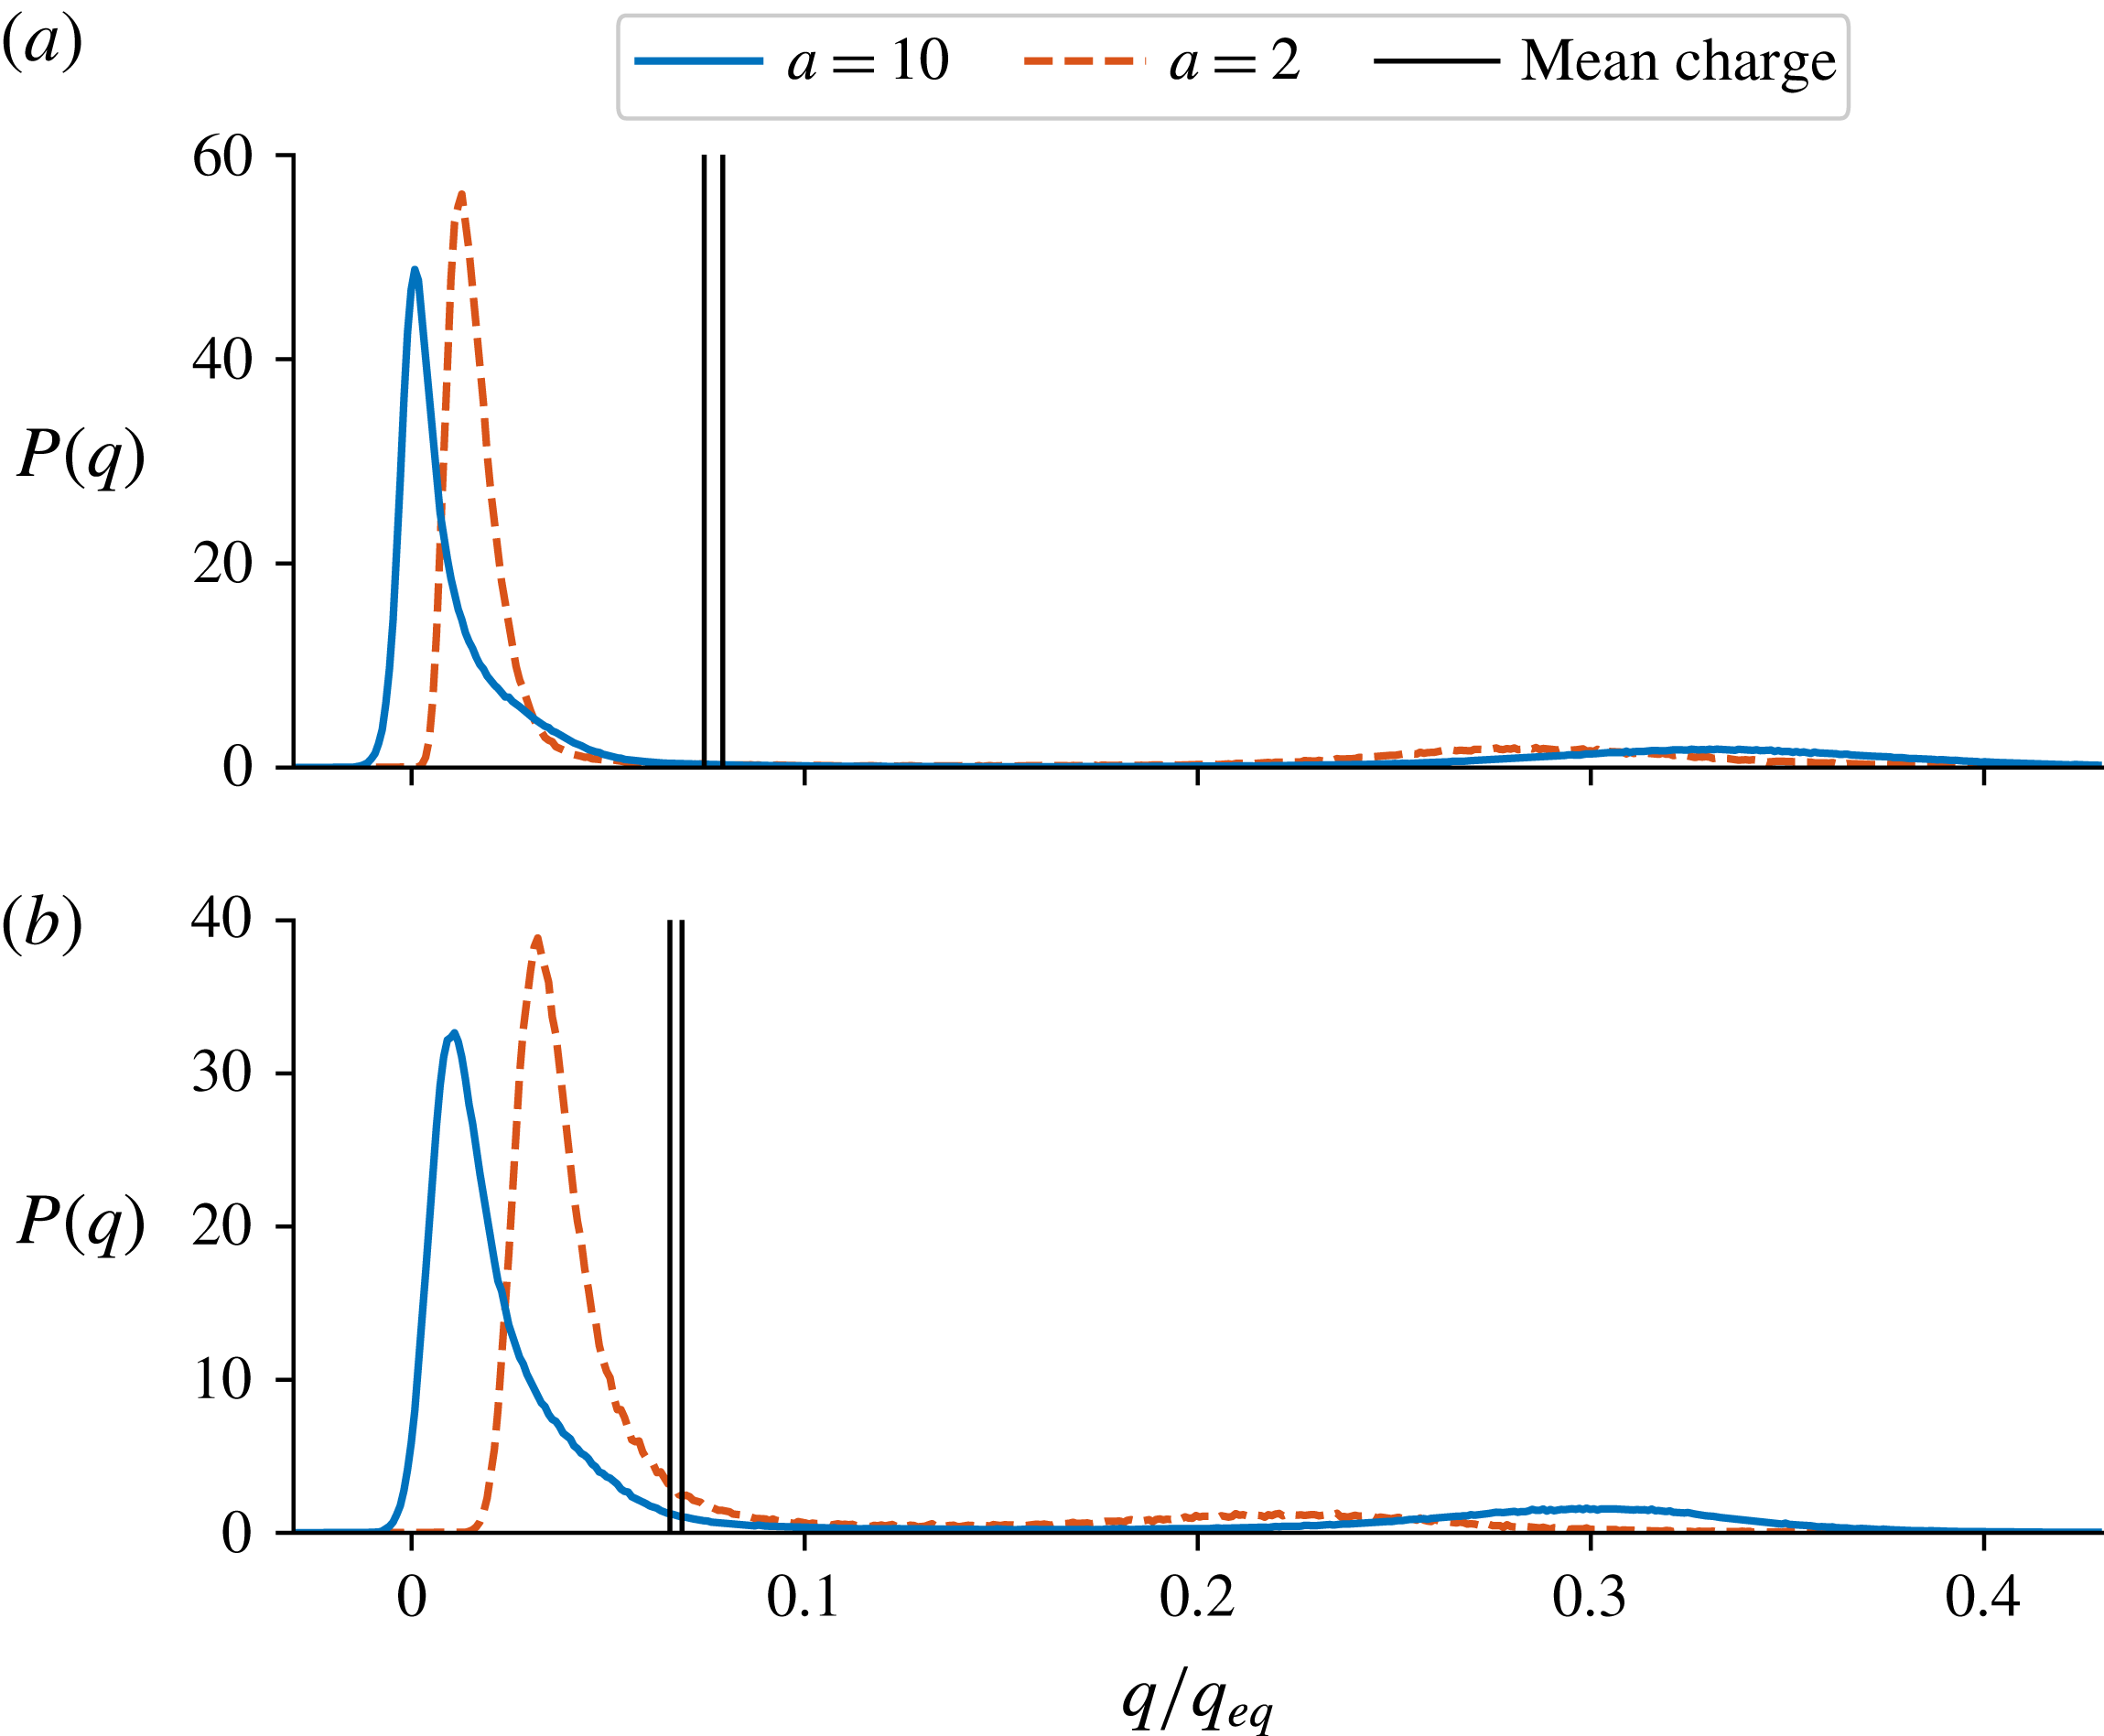
Figure 6. The probability density function of particle charge during the last 0.1 s of each simulation in cases of $e/g=8$
(a) and
$e/g=8$
(a) and $e/g=4$
(b) with different acceleration factors. The solid black lines denote the minimum and maximum values of the mean particle charge among the cases
$e/g=4$
(b) with different acceleration factors. The solid black lines denote the minimum and maximum values of the mean particle charge among the cases $a=2$
,
$a=2$
, $a=5$
and
$a=5$
and $a=10$
.
$a=10$
.
The charge-to-mass ratios obtained from the preliminary simulations are shown in figure 7 as a function of the effective work function difference. The solid black dots denote the work function differences interpolated (or extrapolated where necessary) according to the average experimental charge-to-mass ratios in different humidity levels.
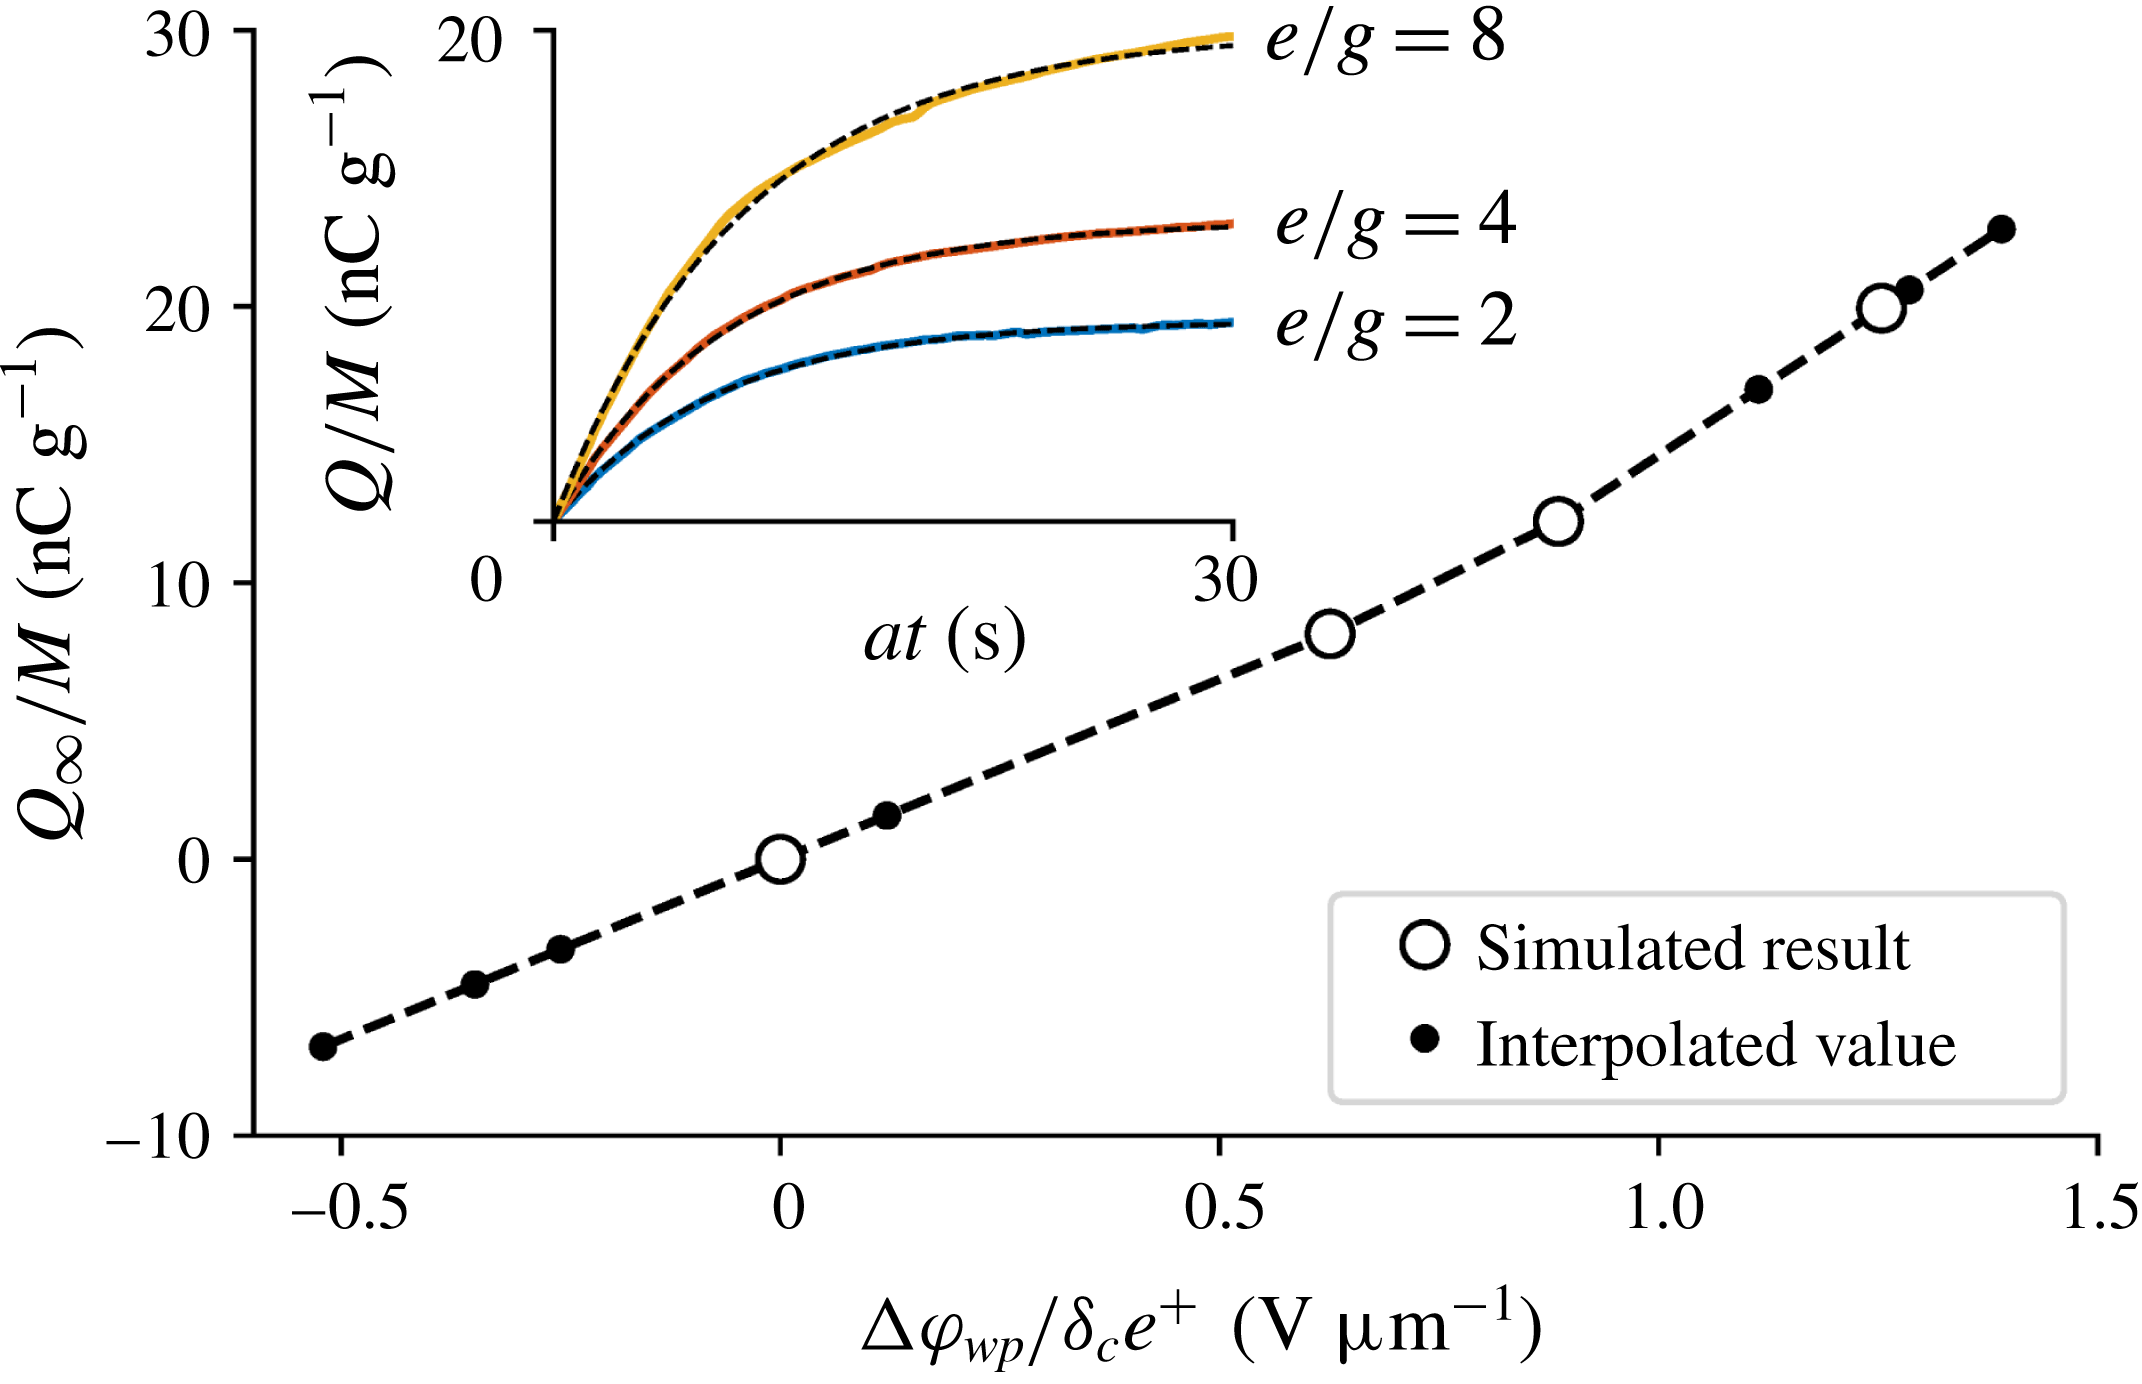
Figure 7. The saturation charges of the preliminary simulations and the interpolated work function differences. Inset: time evolution of the charge-to-mass ratios in the preliminary simulations.
The electrostatic forces in the wall-normal direction drive particles towards the wall. In the cases where $e/g\gtrsim 4$
, a single layer of particles is rapidly drawn on the wall and the charge on the wall layer is segregated from the charge in the core region as depicted in figures 8 and 9. The wall-normal electrostatic force is strong enough to keep the particles on the wall when the fluidizing gas flow is stopped. In the case of fixed uniform charge distribution, multiple layers are left on the wall (figure 3). In contrast, when dynamic tribocharging is enabled, the first layer of particles carries greater-than-average charge (figure 9) and adheres more strongly, but multiple layer adhesion is not observed. Thus, a dynamic tribocharging model with an acceleration factor does not capture the formation of multiple particle layers next to the wall.
$e/g\gtrsim 4$
, a single layer of particles is rapidly drawn on the wall and the charge on the wall layer is segregated from the charge in the core region as depicted in figures 8 and 9. The wall-normal electrostatic force is strong enough to keep the particles on the wall when the fluidizing gas flow is stopped. In the case of fixed uniform charge distribution, multiple layers are left on the wall (figure 3). In contrast, when dynamic tribocharging is enabled, the first layer of particles carries greater-than-average charge (figure 9) and adheres more strongly, but multiple layer adhesion is not observed. Thus, a dynamic tribocharging model with an acceleration factor does not capture the formation of multiple particle layers next to the wall.
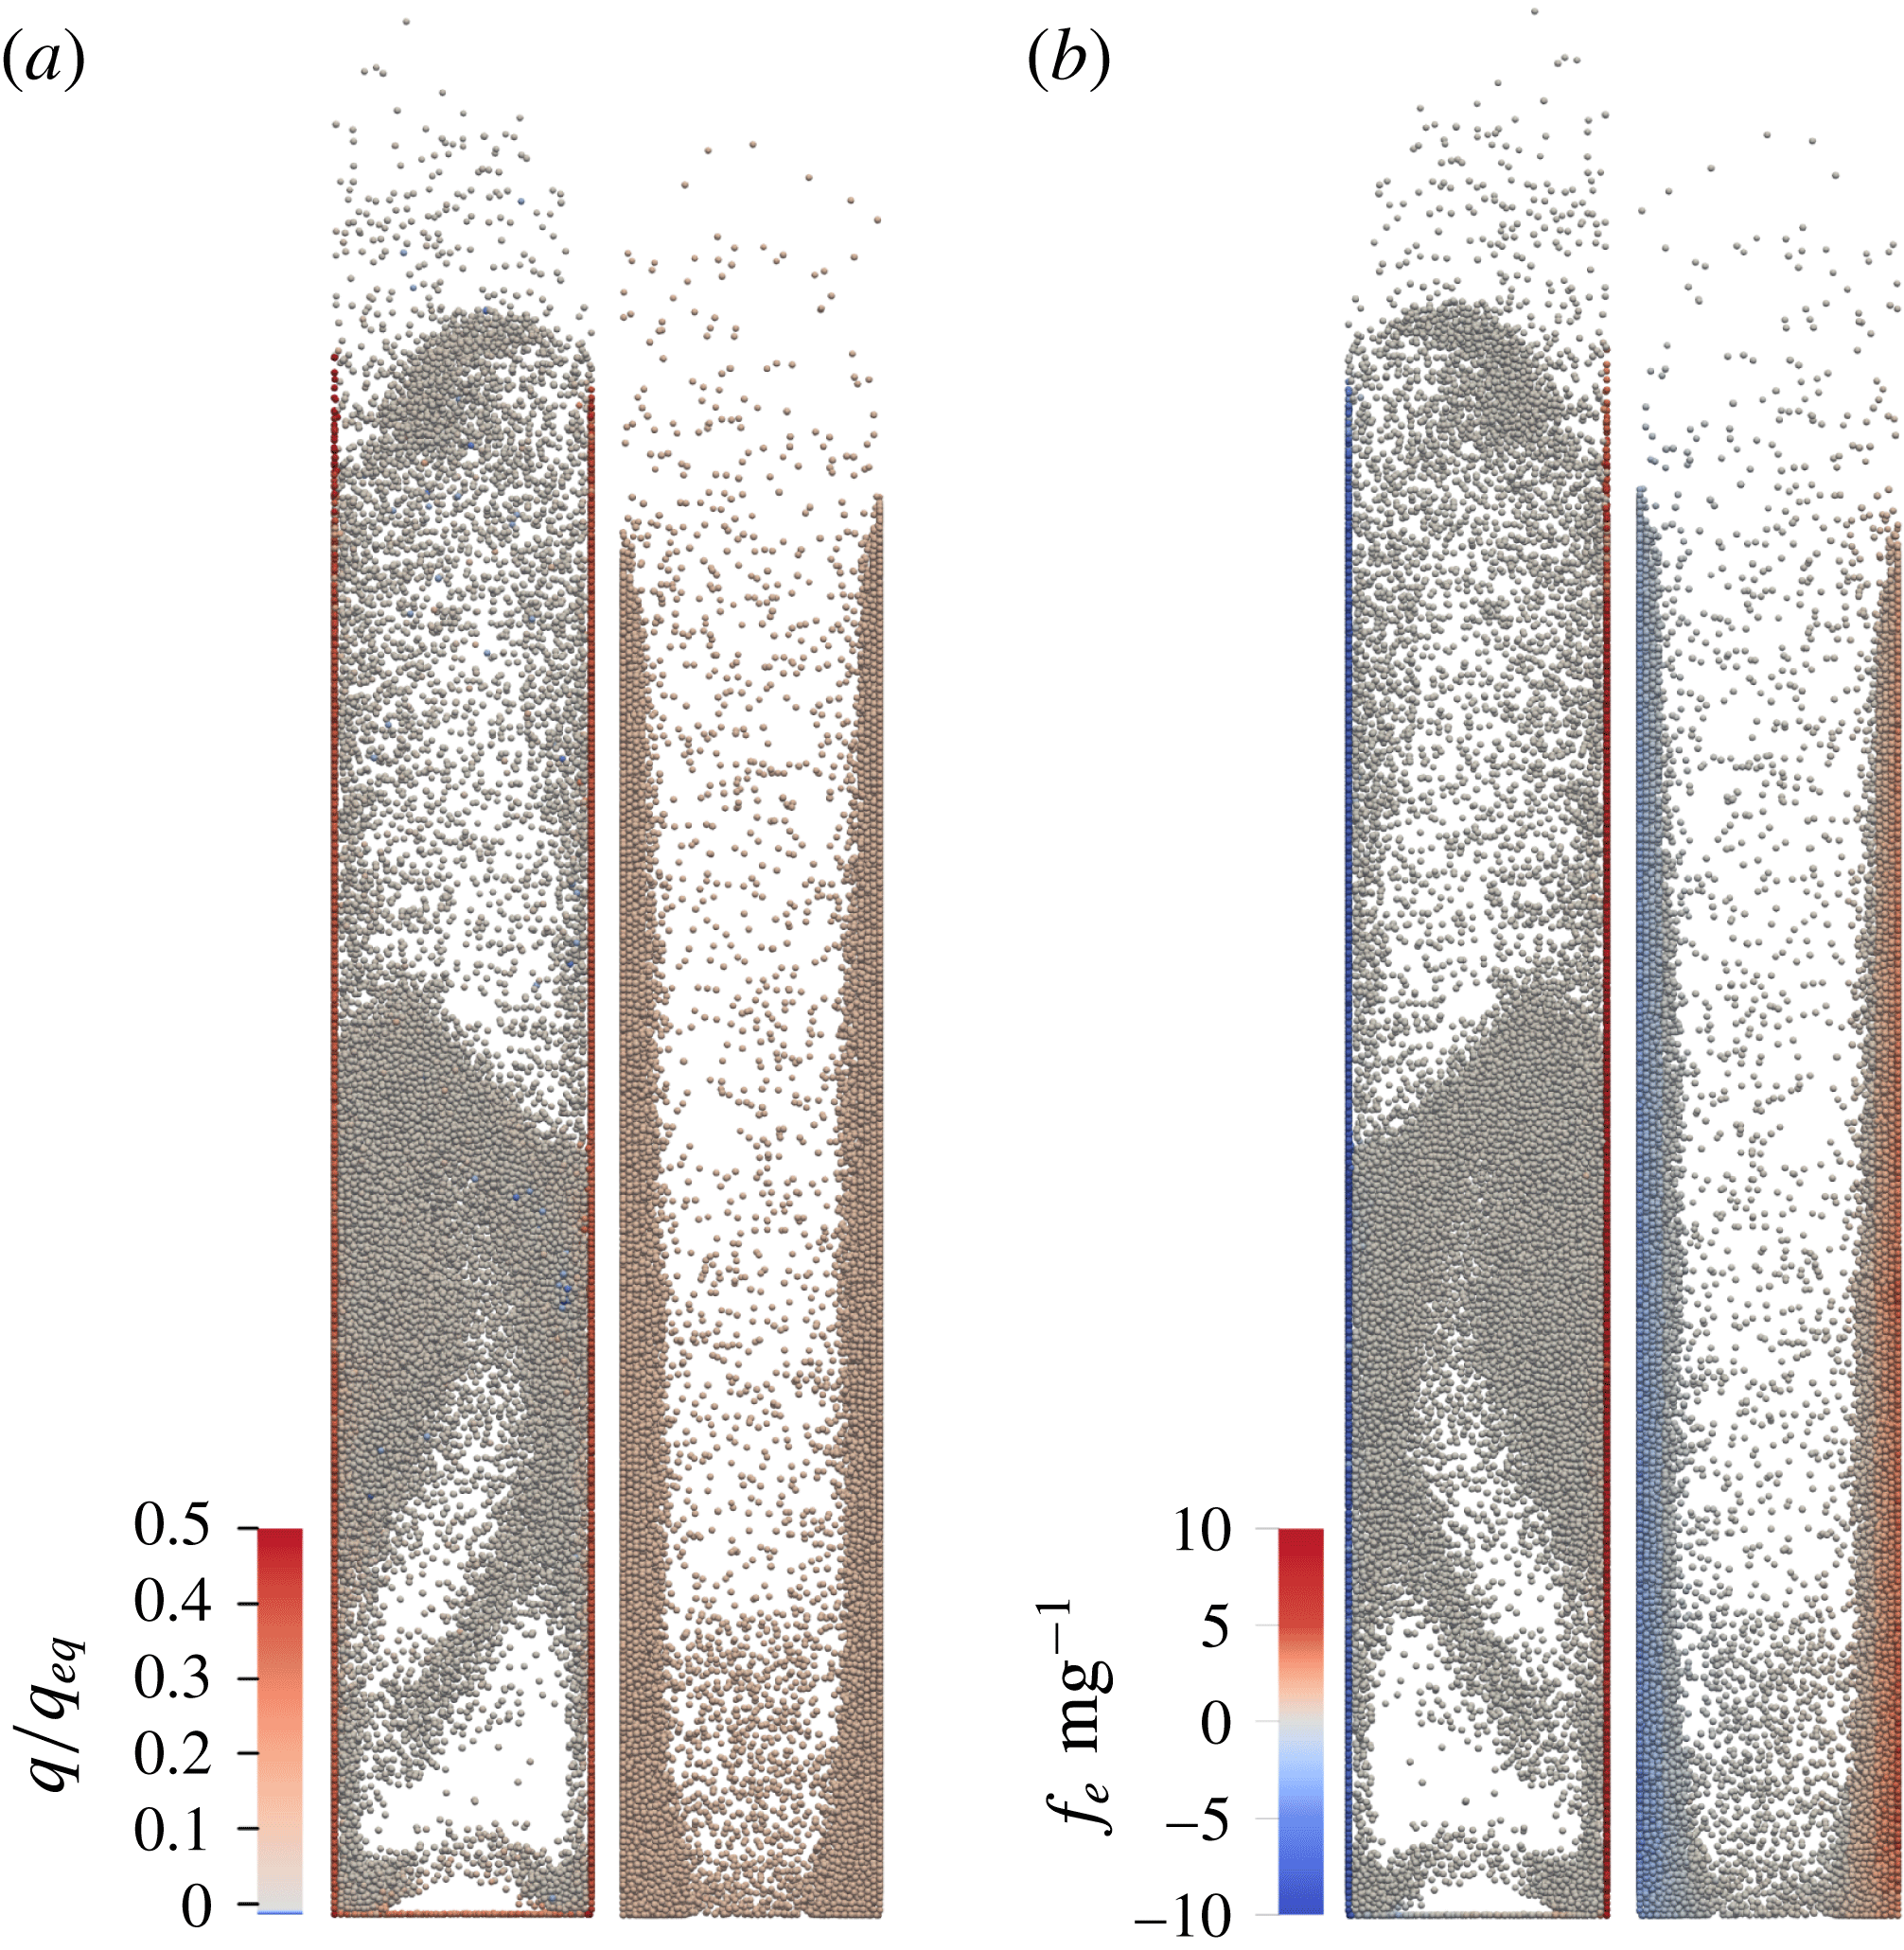
Figure 8. Snapshots from a simulation corresponding to $e/g=8$
. (a) The ratio of particle charge to the equilibrium charge in the cases of dynamic tribocharging with
$e/g=8$
. (a) The ratio of particle charge to the equilibrium charge in the cases of dynamic tribocharging with $a=10$
(left) and fixed uniform charge distribution (right). (b) The ratio of the electrostatic force in vertical direction to the gravitational force in cases corresponding to (a).
$a=10$
(left) and fixed uniform charge distribution (right). (b) The ratio of the electrostatic force in vertical direction to the gravitational force in cases corresponding to (a).
When a relatively high acceleration factor ( $a=10$
) is used, the relative decrease in the pressure drop agrees with the experimental results up to approximately a 20 % decrease of pressure drop (see figure 5). The particle number density near the wall rises when using a low acceleration factor (
$a=10$
) is used, the relative decrease in the pressure drop agrees with the experimental results up to approximately a 20 % decrease of pressure drop (see figure 5). The particle number density near the wall rises when using a low acceleration factor ( $a=2$
, see figure 9), but still the decrease in the pressure drop does not adequately follow the experimental results with higher charge-to-mass ratios. The results obtained with
$a=2$
, see figure 9), but still the decrease in the pressure drop does not adequately follow the experimental results with higher charge-to-mass ratios. The results obtained with $a=5$
are not shown as they are hardly different from the results obtained with
$a=5$
are not shown as they are hardly different from the results obtained with $a=10$
.
$a=10$
.
In the uniform charge case the average electrostatic force in the wall-normal direction experienced by the particles increases, especially near the wall (figure 9). As a result, particles experience appreciable attraction towards the wall over a large distance, resulting in a more realistic outcome in terms of accumulation of multiple particle layers on the wall and the associated decrease in pressure drop. The simulated pressure drop agrees remarkably well with the experimental results also with higher charge-to-mass ratios (figure 5).
The root mean square speed (r.m.s. speed) of the particles on the wall is qualitatively similar to the experimental results. For example in simulations corresponding to 0 % and 20 % RH, the r.m.s. speed on the wall drifts towards zero, although at a significantly faster rate than in the experiments (compare figures 4 and 6). However, differing from the experimental results, the particle motion is not completely ceased but the r.m.s. speed level is approximately $0.04~\text{m}~\text{s}^{-1}$
. In corresponding uniform charge cases the r.m.s. velocity saturates at approximately
$0.04~\text{m}~\text{s}^{-1}$
. In corresponding uniform charge cases the r.m.s. velocity saturates at approximately $0.001$
and
$0.001$
and $0.004~\text{m}~\text{s}^{-1}$
in cases of 0 % and 20 % RH, respectively.
$0.004~\text{m}~\text{s}^{-1}$
in cases of 0 % and 20 % RH, respectively.
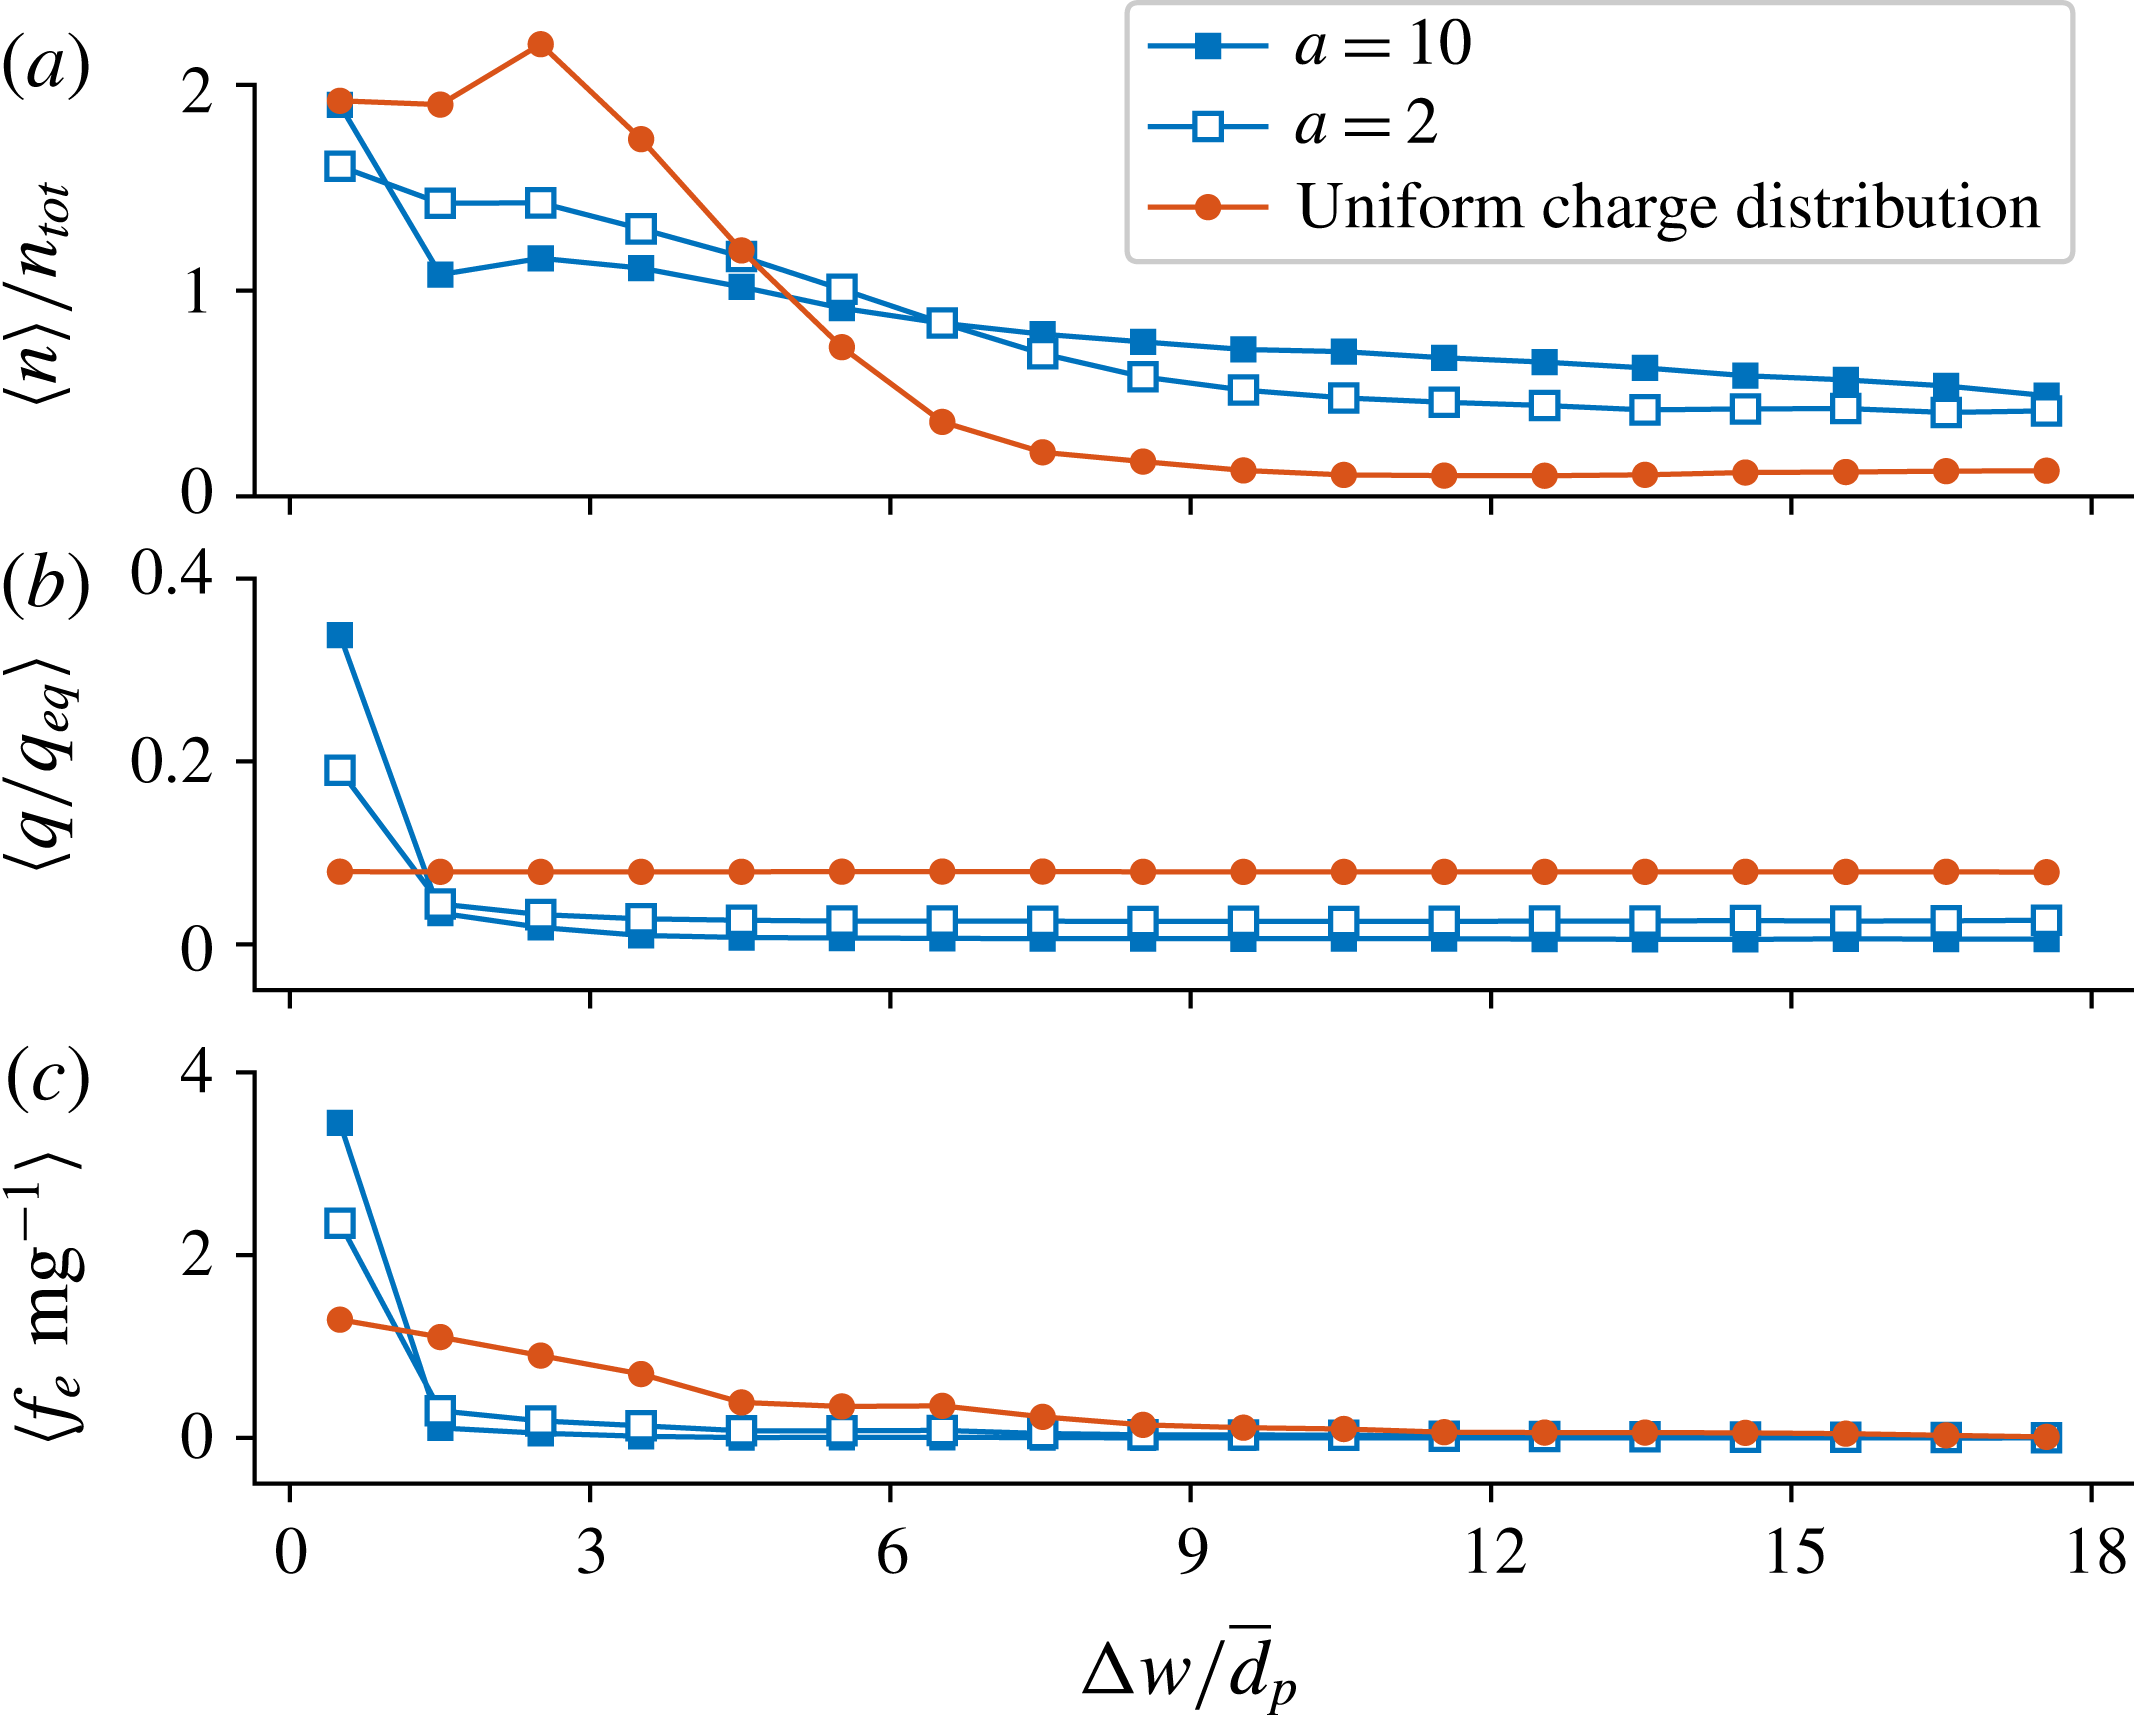
Figure 9. Time-averaged volumetric particle number density $n$
, mean particle charge
$n$
, mean particle charge $q$
and the mean wall-normal electrostatic force
$q$
and the mean wall-normal electrostatic force $f_{e}$
in the case of
$f_{e}$
in the case of $e/g=8$
(averaged over the last 0.1 s of each simulation and over the height of the fluidization column).
$e/g=8$
(averaged over the last 0.1 s of each simulation and over the height of the fluidization column). $n_{tot}$
is the volumetric particle number density over the whole fluidization column,
$n_{tot}$
is the volumetric particle number density over the whole fluidization column, $\unicode[STIX]{x0394}w$
is the distance to the nearest vertical wall and
$\unicode[STIX]{x0394}w$
is the distance to the nearest vertical wall and $\bar{d}_{p}$
is the expected value of the particle diameter.
$\bar{d}_{p}$
is the expected value of the particle diameter.
7 Discussion
The change of charge polarity in the experimental bed at approximately 30 % RH was unexpected, opposing our previous results obtained in vibrated bed experiments with similar particles (Kolehmainen et al. Reference Kolehmainen, Sippola, Raitanen, Ozel, Boyce, Saarenrinne and Sundaresan2017b ); this difference is probably due to different glass material (borosilicate) or different carrier gas (air) used in the earlier experiments. A humidity-dependent reversal of polarity has been earlier observed by Mehrani et al. (Reference Mehrani, Bi and Grace2007) for fines entrained from a fluidized bed of polyethylene particles. Although the origin of this change in polarity is not further considered in this text, it indicates a simultaneous action of more than one simultaneous charge transfer mechanisms.
As the pressure drop over the bed is proportional to the fluidized mass, figure 5 suggests that even 80 % of particles may be supported by the wall or the base in such a narrow bed. The finding that in most of the simulations with dynamic tribocharging the relative decrease in the pressure drop is limited to approximately 20 % is related to the fact that the amount of fluidized mass decreases only until the wall is covered by a single layer of particles.
The qualitative difference between the dynamic tribocharging and uniform charge cases is striking, as seen in figure 8. Excessive charge segregation in the tribocharging case restricts the development of multiple particle layers on the wall: basically, the attractive electrostatic field due to the wall is not strong enough to attach the more weakly charged particles onto the first layer. In addition, the strongly charged first layer exerts a significant repulsive field on the nearby particles. In contrast, the uniform charge case captures the continued decrease in the pressure drop with increasing charge level observed in the experiments. It is thus clear that our simulations with dynamic tribocharging overestimates the extent of charge segregation (i.e. the spread in charge probability density function).
The relatively slow development of the wall layer in the experimental bed in conjunction with the effective mixing of particles will arguably result in a rather narrow charge distribution among the particles: this could reasonably explain the correspondence of the experiments and the simulation results with an uniform charge distribution. This then suggests that the shortcoming of the dynamic tribocharging model can be explained to a good extent by the speed at which charge transfer is allowed to occur between the particles in our simulations. Slower charge transfer in the tribocharging model would enable a larger extent of mixing, but it would increase the computational cost of the CFD-DEM simulations beyond our current resources. Alternative simulation approaches, such as a Euler–Euler model with tribocharging, if developed, could permit slower charge transfer rates.
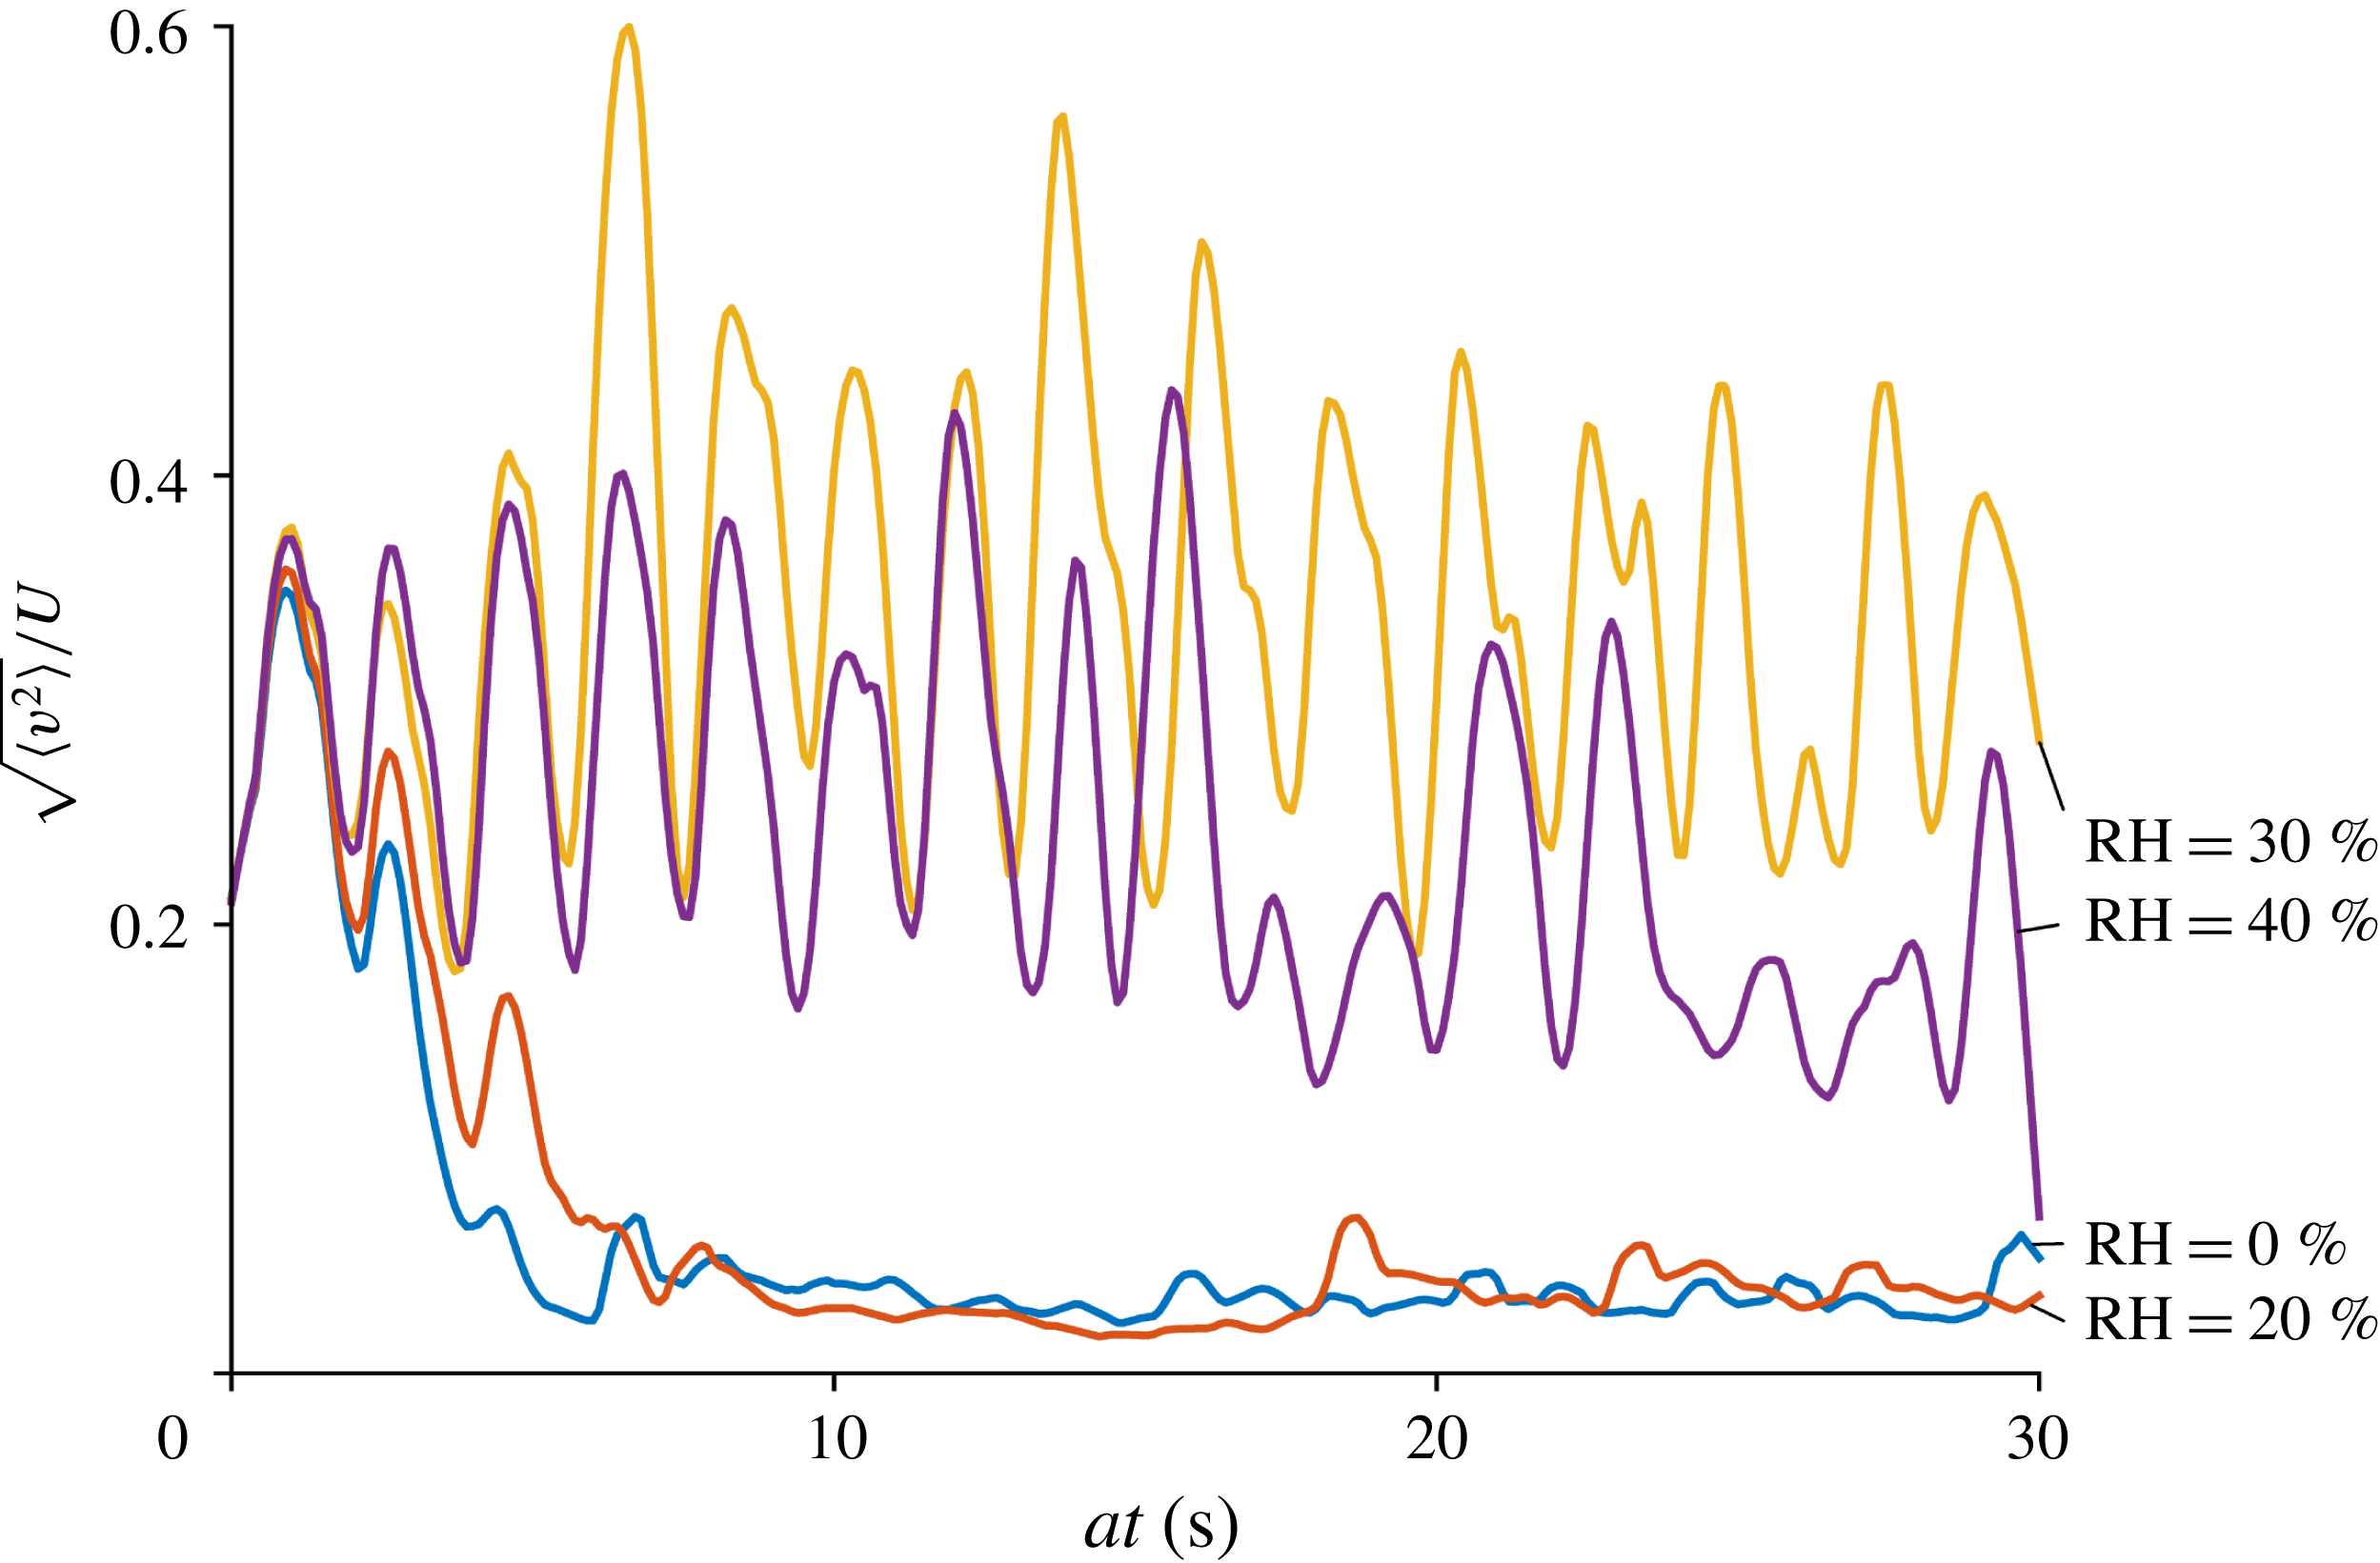
Figure 10. The root mean square speed of the simulated particles on the wall when $a=10$
(in the area corresponding to the imaged area of the experimental bed).
$a=10$
(in the area corresponding to the imaged area of the experimental bed).
Although lowering the acceleration factor results in less pronounced charge segregation, even an acceleration factor as low as $a=2$
does not properly predict agglomeration of multiple layers on the wall. This is attributed to the fact that the charging model tends to over-predict the charging rate in the first place, which was also observed in our previous experiments with a vibrated bed (Kolehmainen et al.
Reference Kolehmainen, Sippola, Raitanen, Ozel, Boyce, Saarenrinne and Sundaresan2017b
). The underlying assumptions of the surface state model may explain the discrepancy between the simulated and experimental charging rates: for example it is assumed that the particles are perfectly spherical, but in reality charge localization at the asperities of the surfaces can significantly alter the electric field in the contact gap and hence the charging rate.
$a=2$
does not properly predict agglomeration of multiple layers on the wall. This is attributed to the fact that the charging model tends to over-predict the charging rate in the first place, which was also observed in our previous experiments with a vibrated bed (Kolehmainen et al.
Reference Kolehmainen, Sippola, Raitanen, Ozel, Boyce, Saarenrinne and Sundaresan2017b
). The underlying assumptions of the surface state model may explain the discrepancy between the simulated and experimental charging rates: for example it is assumed that the particles are perfectly spherical, but in reality charge localization at the asperities of the surfaces can significantly alter the electric field in the contact gap and hence the charging rate.
Regardless of the triboelectric charging model, a notable deficiency of the present simulations is that the particles do not form a completely static structure on the wall. This is indicated by the residual r.m.s. speed shown in figure 10. In reality, sheeting of the wall may significantly limit the net charge transferred to the bed as no tribocharging occurs between the wall and a layer of motionless particles. This aspect is currently not captured by the simulations: a mobile particle will drain charge from the wall whenever the particle–wall contact area increases.
In the case of an unipolar charge distribution, the short-range electrostatic forces are repulsive and there is a lack of attractive forces between the particles. That said, attractive forces not accounted in this study could explain formation of motionless particle layers on the wall. A plausible explanation for such a structure could be a bipolar charge distribution (Salama et al. Reference Salama, Sowinski, Atieh and Mehrani2013; Song & Mehrani Reference Song and Mehrani2017), which in single-component systems is associated with different charging tendencies of differently sized particles (Cartwright et al. Reference Cartwright, Singh, Bailey and Rose1985; Mehrani, Bi & Grace Reference Mehrani, Bi and Grace2005; Forward, Lacks & Sankaran Reference Forward, Lacks and Sankaran2008). Even with tightly monodisperse particles, the effective work function could be somewhat different for the various particles (as opposed to the same value assumed in our simulations), for example, due to the differences in surface heterogeneities. This could lead to bipolar charging even for the monodisperse case (Lee et al. Reference Lee, Waitukaitis, Miskin and Jaeger2015).
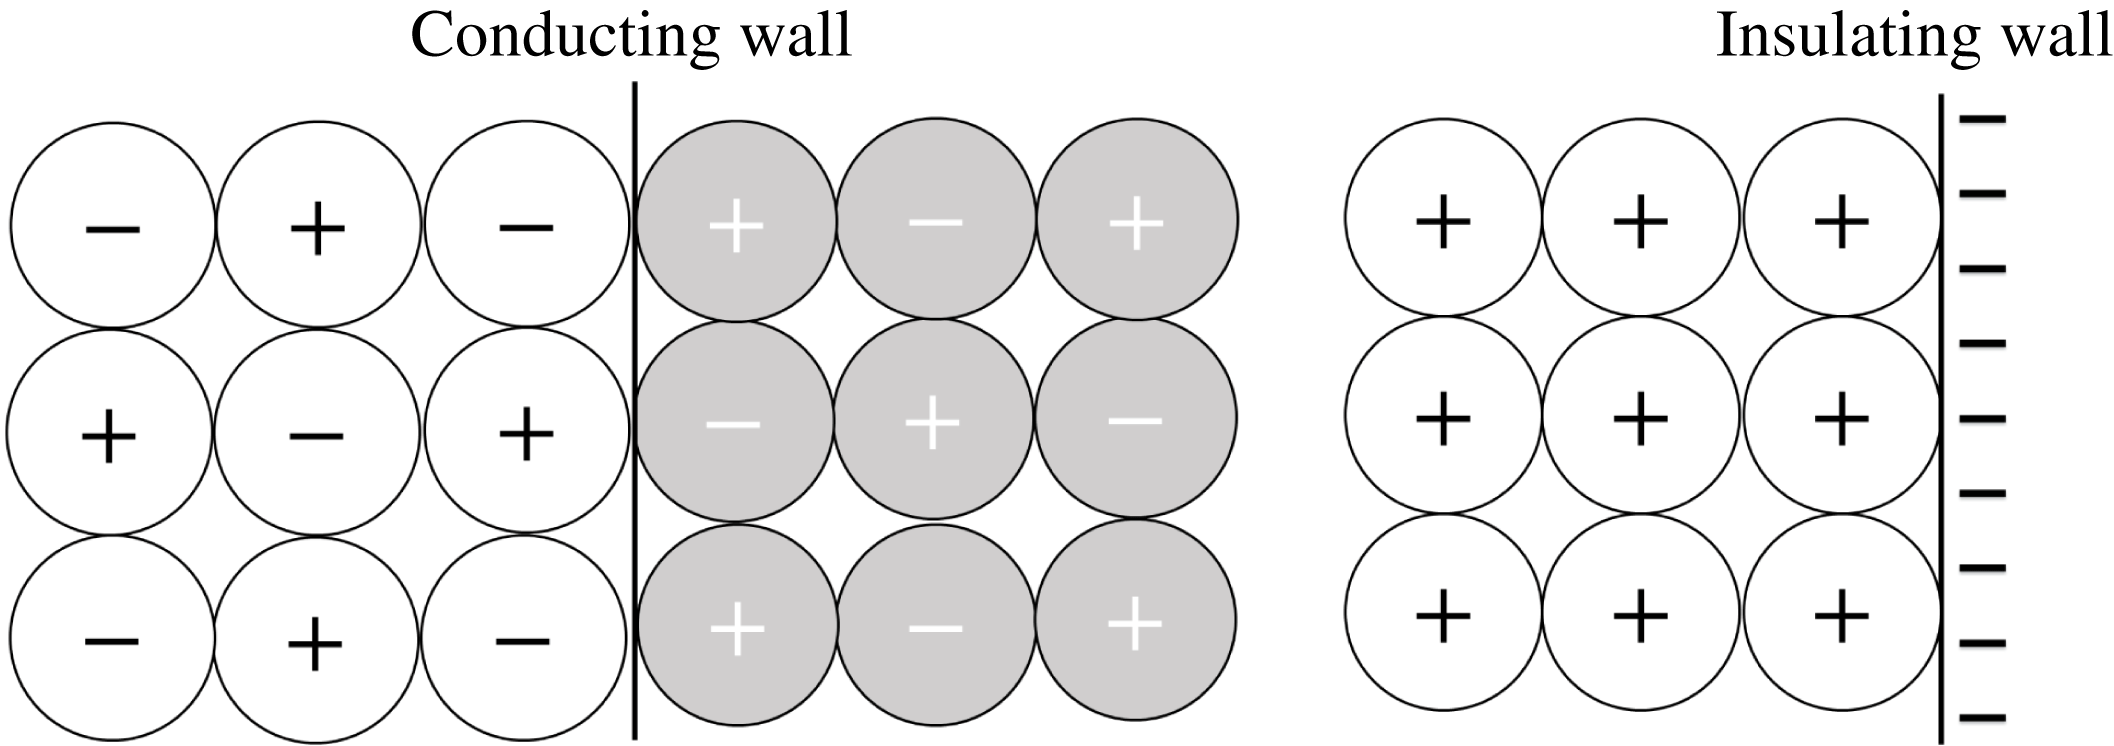
Figure 11. Possible structures of charged particles on a conducting and an insulating wall. The grey particles denote the image charge due to the conducting wall (Song & Mehrani Reference Song and Mehrani2017).
In the case of insulating walls, the surface charge on the wall would arguably prevent oppositely charged particles from attaching on the first layer but allow adhesion of similarly charge particles as depicted in figure 11. On conducting grounded walls, however, particles with both polarities may be attracted on the wall due to the image charge effect (Song & Mehrani Reference Song and Mehrani2017). Other factors such as dielectrophoresis are likely required to explain formation of a motionless particle structures: on close approach, dielectrophoretic forces can pull same-polarity particles with different charge magnitudes together (LaMarche et al. Reference LaMarche, Muzzio, Shinbrot and Glasser2010; Liu et al. Reference Liu, Marshall, Li and Yao2010; Lee et al. Reference Lee, Waitukaitis, Miskin and Jaeger2015; Siu et al. Reference Siu, Pittman, Cotton and Shinbrot2015). In addition to dielectrophoresis, polarization is likely to have a direct effect on triboelectric charging. In terms of the present charging model, polarization affects the electric field developed in the gap between two surfaces, which affects both the charging rate and the saturation charge of the particles.
8 Conclusions
It was found that the charge acquired by polyethylene particles in a fluidized bed made of soda-lime glass walls depends heavily on the humidity of the fluidizing gas. In relatively dry conditions the column walls become sheeted with multiple layers of particles, resulting in a significant decrease in the pressure drop across the bed. Interestingly, the polarity of the charge accumulated on the particles reverses sign at approximately 30 % relative humidity. Complementary simulations were performed to examine whether a tribocharging model, tuned to capture the experimentally measured charge level, would predict the experimentally observed large variation of the pressure drop with charging extent.
A triboelectric charging model in conjunction with the CFD-DEM method was used to simulate the experimental bed. A PPPM method was used to evaluate the electric field acting on each particle while accounting the contribution of the charge on the insulating walls. It was found that artificially increasing the charge transfer rate leads to a wider charge distribution. Particles with high level of charge tend to segregate to the walls, and the remaining particles with less charges are unable to form wall layers that are multiple particle thick; furthermore, the model predicts the experimentally observed pressure drop rather poorly. When the same level of charge is included in the analysis while distributing the charges uniformly on the particles, the pressure drop in the experiment is remarkably well predicted. This suggests that the actual rate of charge transfer in the real system has to be a lot slower than what was used in our simulations, allowing ample opportunities for the charged particles to mix and achieve a narrower charge distribution.
It is computationally unfeasible to simulate very slow charging rates using the Laurentie et al. (Reference Laurentie, Traoré and Dascalescu2013) model coupled with CFD-DEM. Alternative approaches to simulate particle charging could be Euler–Euler method (see Jalalinejad, Bi & Grace Reference Jalalinejad, Bi and Grace2016); multiphase particle in cell method (see Snider Reference Snider2001); or projective integration method (see Gear & Kevrekidis Reference Gear and Kevrekidis2003). These methods avoid the need to solve the charge dynamics at the same time scale as the particle dynamics is solved and could therefore allow for more realistic charging time scales. However, to best of the authors knowledge the Laurentie et al. (Reference Laurentie, Traoré and Dascalescu2013) model has not been incorporated into any of these methods.
Based on the simulations it is apparent that the electrostatic forces largely explain the extent at which particles agglomerate on the wall when the charge distribution among the particles is narrow. In such a case the surface charge on the wall dominates the electric field, attracting particles over a large distance. Differing from the experiments, the simulated particles do not form a static structure on the wall. As tribocharging is dependent on the intensity of particle–wall contacts, this alters the net charge accumulated in the bed as well as the charge distribution.
Additional factors such as dielectrophoresis or size-dependent charging tendency of particles are probably required to explain the development of static particle structures. Analysing the effect of size dependency would require the tribocharging model that can predict it, but currently all the size specific tribocharging models in the literature are only applicable to systems that are made of same material (Duff & Lacks Reference Duff and Lacks2008; Kok & Lacks Reference Kok and Lacks2009; Carter & Hartzell Reference Carter and Hartzell2017). The authors suggest including dielectrophoresis in the current analysis a viable future avenue for research and the interested reader can find examples from the studies of Liu et al. (Reference Liu, Marshall, Li and Yao2010), Lee et al. (Reference Lee, Waitukaitis, Miskin and Jaeger2015), Yoshimatsu et al. (Reference Yoshimatsu, Araújo, Wurm, Herrmann and Shinbrot2017).
Acknowledgements
The authors would like to thank the Academy of Finland Grant 289901 (Finland), the National Science Foundation Grant CBET-1601986 (United States) and ExxonMobil Research and Engineering Company for funding this research.


 Open access