


1. Introduction
The transport of long gas bubbles or liquid drops in confined geometries plays an important role in many engineering and biological settings, such as enhanced oil recovery (Tran et al. Reference Tran, Ahmad, Neogi and Bai2016; Grassia Reference Grassia2019; Majeed et al. Reference Majeed, Kamal, Zhou and Solling2021), coating processes (Yu, Khodaparast & Stone Reference Yu, Khodaparast and Stone2017; Jeong et al. Reference Jeong, Kvasnickova, Boutin, Cébron and Sauret2020), drug delivery (Hernot & Klibanov Reference Hernot and Klibanov2008; Gao et al. Reference Gao, Chan, Gu, Lin, Zhang, Yeo, Alsema, Arora, Chong and Shi2016), biomechanics and biomedical devices (Clanet, Héraud & Searby Reference Clanet, Héraud and Searby2004; Chao, Jin & Fan Reference Chao, Jin and Fan2020; Ma et al. Reference Ma, Sun, Duan, van den Berg, Eijkel and Xie2020; Li et al. Reference Li, Li, Li, Chen, Li and Chen2021). When such a long bubble of length  $L \gg R$ translates at a constant speed
  $U$ in a circular capillary of radius
  $R$, the bubble forms a symmetrical bullet shape, commonly called a Taylor bubble, and a thin film of liquid is generated between the bubble and capillary. Quantifying the deposition of this liquid film and its relationship with the bubble speed, fluid properties and channel geometries provides crucial information for determining the mass, momentum and heat transport in a wide range of multi-phase flow scenarios, and thus has remained as a research focus for decades.
The deposition of Newtonian fluids has been extensively studied regarding various geometries and fluid properties. Pioneering investigations on this topic were conducted by Bretherton (Reference Bretherton1961) and Taylor (Reference Taylor1961). For a long bubble translating in confined geometries with small dimensions where gravity plays a negligible role, the dynamics is characterized by the interplay between the viscosity and surface tension, as captured by the definition of the capillary number,  $Ca = {\mu }U/\sigma$, where
  $\mu$ is the fluid viscosity and
  $\sigma$ is the surface tension (Aussillous & Quéré Reference Aussillous and Quéré2000; Jeong et al. Reference Jeong, Kvasnickova, Boutin, Cébron and Sauret2020). For
  $Ca \ll 1$, Bretherton (Reference Bretherton1961) found that the thickness of the thin liquid film
  $h$ scales as
  $h/R \sim Ca^{2/3}$ in regimes where inertia effects are negligible compared to surface tension and viscous effects. This relation was later extended to cover the range of
  $Ca < 2$ in the scaling analysis of Aussillous & Quéré (Reference Aussillous and Quéré2000), where the radius of curvature of the static meniscus was accounted as
  $R - h$ rather than
  $R$, yielding a semi-empirical equation as
 \begin{equation} \frac{h}{R}=\frac{1.34Ca^{2/3}}{1+2.5\times1.34Ca^{2/3}}. \end{equation}
 So far, the fluid deposition by a confined bubble in non-Newtonian fluids has been much less understood, although a lot of working fluids, such as polymer solutions, colloidal suspensions and biologically relevant fluids, show non-Newtonian behaviours in many practical applications (Abishek, King & Narayanaswamy Reference Abishek, King and Narayanaswamy2015; Moreira et al. Reference Moreira, Rocha, Carneiro, Araújo, Campos and Miranda2020; Li et al. Reference Li, Li, Li, Chen, Li and Chen2021; Zhao et al. Reference Zhao, Ma, Liu, Yao, Yang and Chen2021). Resolving the hydrodynamics of a confined bubble in non-Newtonian fluids presents more complexities than in Newtonian cases because of the spatial and temporal changes of shear stress and the corresponding variations of the rheological properties. Table 1 lists a summary of the experimental, numerical and theoretical studies about the liquid film deposition dynamics in non-Newtonian fluids. In particular, many prior studies assumed a simple power-law model with a stress/shear rate relationship as  $\tau ={\kappa }\dot {\gamma }^{n_p}$ (where
  $n_p$ is the power-law index,
  $\dot {\gamma }$ the shear rate and
  $\kappa$ the consistency factor in Pa s
 $^{n_p}$) to represent the shear-thinning/thickening fluids (Kamişli & Ryan Reference Kamişli and Ryan2001; de Sousa et al. Reference de Sousa, Soares, de Queiroz and Thompson2007), and suggested that the liquid film thickness scales as (Gutfinger & Tallmadge Reference Gutfinger and Tallmadge1965; Hewson, Kapur & Gaskell Reference Hewson, Kapur and Gaskell2009)
 \begin{equation} \frac{h}{R} \sim \widehat{Ca}^{2/(2n_p+1)} \quad \text{with}\ \widehat{Ca} = \kappa(U/R)^{n_p}/(\sigma/R), \end{equation}
where  $\widehat {Ca}$ is a modified capillary number. A numerical prefactor on the right-hand side of (1.2) is suppressed here, but its value would depend on
  $n_p$ (Gutfinger & Tallmadge Reference Gutfinger and Tallmadge1965; Hewson et al. Reference Hewson, Kapur and Gaskell2009). Nevertheless, the power-law model fails to reproduce the low-shear-rate viscosity plateau and has a well-known singularity at zero-shear-rate, leading to an inaccurate velocity profile in multiple free-surface flow scenarios (Bird, Armstrong & Hassager Reference Bird, Armstrong and Hassager1987; Myers Reference Myers2005; Hewson et al. Reference Hewson, Kapur and Gaskell2009; Picchi et al. Reference Picchi, Poesio, Ullmann and Brauner2017).
Table 1. Chronological selection of previous experimental, numerical and theoretical studies on the liquid film thickness of a long bubble translating through non-Newtonian fluids in confined geometries. The non-dimensional groups appearing above are defined as follows:  $Ca_0 = {\mu _0}U/\sigma$,
  $Wi = {\lambda }U/H$,
  $\widehat {Ca}_{HB} = k_{HB}(U/R)^{n_{HB}}/(\sigma /R)$ and
  $Ca_e = {\mu _e}U/\sigma$. Here,
  $\mu _0$ is the zero-shear-rate viscosity,
  $\lambda$ is the relaxation time,
  $H$ is the half of the gap in the Hele–Shaw cell,
  $k_{HB}$ and
  $n_{HB}$ are the consistency factor and the power-law index of the Herschel–Bulkely model, respectively, and
  $\mu _e$ is the effective viscosity defined as
  $\mu _e=\mu (\dot {\gamma }={U}/{h})$. Ro & Homsy (Reference Ro and Homsy1995) used
  $m$ and
  $k$ to represent the degree of shear and normal stress thinning, respectively,
  $S$ is the ratio of the solvent viscosity to the sum of the polymer and solvent viscosity, and
  $\delta$ is the ratio between
  $\lambda$ and the characteristic residence time in the gap. Laborie et al. (Reference Laborie, Rouyer, Angelescu and Lorenceau2017) used
  $a$ and
  $b$ are the fitting parameters and
  $B$ is the non-dimensional number comparing the yield stress to the capillary pressure. Zhao et al. (Reference Zhao, Ma, Liu, Yao, Yang and Chen2021) used
  $W$ to be the width of the rectangular microchannel.

Therefore, recent studies have focused on developing more generalized scaling laws to overcome the limitation of the power-law model. Using the Carbopol solution (1.1 wt%) which shows a strong yield-stress effect, Laborie et al. (Reference Laborie, Rouyer, Angelescu and Lorenceau2017) experimentally investigated the deposition of the yield-stress fluid in circular channels and developed a semi-empirical scaling law for the film thickness, considering the competition of the yield stress, the capillary pressure and the viscous stress (see table 1). Additionally, a recent study by Picchi et al. (Reference Picchi, Ullmann, Brauner and Poesio2021) investigated the motion of a Taylor bubble through an Ellis fluid and identified a scaling law of the film thickness with the generalized effective viscosity defined by the characteristic shear rate in the liquid film. Several recent studies also showed that the predictions using the power-law model can be erroneous at flow settings with a low-shear-rate region and have a small range of applicability compared to the more accurate Ellis and Carreau–Yasuda (C-Y) models (Moukhtari & Lecampion Reference Moukhtari and Lecampion2018; Boyko & Stone Reference Boyko and Stone2021; Picchi et al. Reference Picchi, Ullmann, Brauner and Poesio2021). However, aforementioned studies are still limited to mostly numerical or theoretical perspectives, and a systematic experimental verification of the theoretical predictions is still lacking.
In this work, we report an experimental investigation for the effect of shear-thinning rheology on the film deposition dynamics, bubble speed and bubble shape variations when a bubble is moving in a circular capillary tube filled with non-Newtonian fluids. We consider the range of the zero-shear-rate capillary number,  $Ca_0 = {\mu _0}U/\sigma$ where
  $\mu _0$ is the zero-shear-rate viscosity for non-Newtonian fluids, over six orders of magnitude (
 $7\times 10^{-3} < Ca_0 < 830$). In § 2, we provide the experimental framework to measure the film thickness and bubble shape. The generalized C-Y model is used to describe the full range of rheological properties for carboxymethyl cellulose and Carbopol solutions (§ 3.1). Scaling laws for the film thickness based on different rheological models are compared (§§ 3.2 and 3.3), showing the film thickness and the bubble speed (§ 3.4) scale with an effective capillary number,
  $Ca_e$, containing two dimensionless numbers that describe the fluid rheology. Finally, the bubble front and rear menisci are experimentally characterized and further compared with the lubrication theory considered by Picchi et al. (Reference Picchi, Ullmann, Brauner and Poesio2021) (§ 3.5).
2. Material and experimental set-up
We use carboxymethyl cellulose (CMCell, Sigma Aldrich) and Carbopol (981, Lubrizol) solutions with different mass fractions as non-Newtonian fluids, and pure glycerin ( $\mu = 0.87$ Pa s,
  $\sigma = 63.4\ {\rm mN}\ {\rm m}^{-1}$, Fisher Scientific) as a Newtonian fluid for a baseline comparison. CMCell consists of bentonite as a major component (Benchabane & Bekkour Reference Benchabane and Bekkour2008), while Carbopol is composed of polyacrylic acid resins (Laborie et al. Reference Laborie, Rouyer, Angelescu and Lorenceau2017). We prepare the CMCell solutions with four different mass fractions (0.5, 1.0, 1.5 and 2.0 wt%), and the Carbopol solutions with three different mass fractions (0.1, 0.2 and 0.5 wt%, neutralized using 1 M sodium hydroxide). No elastic behaviours are expected in such a low CMCell mass fraction range given the shear rates in the current experiments (Ghannam & Esmail Reference Ghannam and Esmail1997; Benchabane & Bekkour Reference Benchabane and Bekkour2008). All aqueous solutions were prepared by gradually dissolving a known weight of powders into deionized water in a cylindrical beaker with continuous stirring. The mixing was maintained for 24 h until clear and homogeneous solutions were produced. The surface tension of the working fluid is determined by the pendant drop method (Rotenberg, Boruvka & Neumann Reference Rotenberg, Boruvka and Neumann1983; Song & Springer Reference Song and Springer1996).
2.1. Experimental
Bubble motion experiments were performed in a circular glass capillary tube with a length of 500 mm and an internal radius  $R = 0.47$ mm. The glass capillary was held vertical and the central length of the capillary was contained in a clear rectangular box filled with the working fluid to decrease refractive index difference compared to the glass as well as the optical distortion from the curvature of the tube wall (Yu et al. Reference Yu, Khodaparast and Stone2017; Zhao et al. Reference Zhao, Pahlavan, Cueto-Felgueroso and Juanes2018).
During the experiments, the inlet of the glass capillary tube was connected to a syringe pump (11 Pico Plus Elite, Harvard Apparatus) using a flexible connecting tube. After the glass capillary was pre-filled with a sample solution, a small volume of air was created in the connecting tube. The flow rate was then set to a very small value  $\approx$10
  $\mathrm {\mu }$l min
 $^{-1}$ to steadily transfer the long air bubble (of length
  $L \gg R$) from a flexible connecting tube into the inlet of the glass capillary. When the front of the bubble reached the inlet, the syringe pump was set to the targeted flow rate accordingly. The optical images of the region of interest (ROI) were recorded at the rate of 60 frames per second using a digital camera (20.9 Megapixel, D7500, Nikon) equipped with a long working distance objective lens (12
 $\times$ zoom lens system, Navitar); see the schematic in figure 1(a). The maximum resolution of the image in our experimental configuration is
  $\approx$1.3
  $\mathrm {\mu }$m per pixel, leading to a maximum relative error in the film thickness measurement of less than 12 %. The average velocity of the bubble can be evaluated by tracking the gas–liquid interface at the bubble front tip using the images taken with a lower magnification. An analytical balance (ME104E, Mettler Toledo) was installed at the outlet of the glass capillary to confirm the flow rate. In the current experiment,
  $Bo={\rho }gR^2/\sigma < 0.04$ and
  $Re = {\rho }UR/\mu \ll 1$, so gravity and inertia effects are negligible (Atasi et al. Reference Atasi, Khodaparast, Scheid and Stone2017; Magnini et al. Reference Magnini, Khodaparast, Matar, Stone and Thome2019).

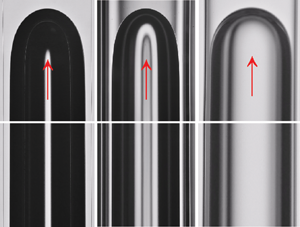
Figure 1. (a) Schematic of the experimental configuration. A cylindrical glass tube (with an inner radius of 0.47 mm) is filled with a sample solution (e.g. glycerin, carboxymethyl cellulose (CMCell; 0.5, 1.0, 1.5 and 2.0 wt $\%$), and Carbopol (0.1, 0.2 and 0.5 wt
 $\%$)). The central part of the circular glass capillary is submerged in a bath of a sample solution to match the refractive index of glass. Inset: schematic of a translating air bubble confined in a circular tube. (b) Typical experimental images of a long bubble as it translates in a circular capillary filled with glycerin (left) at
  $Ca_0 = 7.48 \times 10^{-2}$, CMCell (1.0 wt
 $\%$; centre) at
  $Ca_0 = 3.53 \times 10^{-2}$ and Carbopol (0.2 wt
 $\%$; right) solutions at
  $Ca_0 = 3.53 \times 10^{-2}$. Images contain the front meniscus and the middle part of the bubble, where the film thickness is uniform. The scale bar is 0.5 mm. (c) Schematic for the mass balance analysis regarding the deposition of a liquid film in a circular capillary tube. (d) Comparison of the liquid film thickness obtained by the image visualization,
  $h_i$ and the mass balance analysis of the liquid plug,
  $h_m$ (2.1) for experimental cases over the range of
  $8\times 10^{-3} < Ca_0 < 8\times 10^{2}$. All the data lie along the solid line with a slope of a unity.
2.2. Measurement of the liquid film thickness
The liquid film thickness around the bubble is estimated with the image visualization, in which the film profile around the bubble is obtained from the difference between the position of the bubble surface and the tube wall (see figure 1b). Since the length of the bubble is larger than the size for the field of view in the images, we use a time-strip analysis with ImageJ to ensure an accurate measurement of the uniform liquid film around the bubble.
To confirm the accuracy from the image visualization method, we also measure the film thickness using mass balance analysis. In the mass balance analysis, the film thickness is determined based on the change of the length of the liquid plug  $L_p$. We ensure the initial length of the liquid plug is
  $L_p\approx 7$ cm, so that
  $L_p \gg R$. The plug advances inside the tube, deceasing
  $L_p$ (see figure 1c) due to the deposition of the film on the tube wall. The moving positions of the front and rear menisci of the liquid plug are analysed using ImageJ, which determines the velocity at the front and rear menisci of the liquid plug,
  $U_{pf}$ and
  $U_{pr}$, respectively, ranging from 0.2 to 50 mm s
 $^{-1}$. Assuming a homogeneous deposition of the liquid film near the cylindrical capillary tube wall, a mass balance on the moving plug of length
  $L_P$ yields the relation as (Laborie et al. Reference Laborie, Rouyer, Angelescu and Lorenceau2017)
 \begin{equation} \frac{h}{R}=1-\sqrt{1+\frac{1}{U_{pr}}\frac{\mathrm{d} L_p}{\mathrm{d} t}}=1-\sqrt{\frac{U_{pf}}{U_{pr}}}. \end{equation}
 Figure 1(d) compares the liquid film thickness measured by the image visualization,  $h_i$, and the mass balance analysis,
  $h_m$, when a bubble is translating in the glycerin, 1.0 wt
 $\%$ CMCell and 0.2 wt
 $\%$ Carbopol solutions. The measurement is conducted over a wide range of
  $Ca_0$ (
 $8\times 10^{-3} < Ca_0 < 8\times 10^{2}$). The results show that all the experimental measurement data lie on the line with a slope of unity, confirming the two methods give the same result on each experiment. We note that the deposited film thickness is observed to be invariant by rotation along the axis of the glass capillary since the shear-thinning effect dominates for the Carbopol solution with low mass fractions (figure 1b), while the experiments performed by Laborie et al. (Reference Laborie, Rouyer, Angelescu and Lorenceau2017) showed that the annular Carbopol solution film thickness was non-uniform azimuthally when the yield stress is important. In the following, we will use the image visualization to determine the film thickness,
  $h$.
$h$.
3. Results and discussion
3.1. Rheological properties of CMCell and Carbopol solutions
Rheological measurements of the CMCell and Carbopol solutions are performed with a controlled stress rheometer (DHR-3, TA Instrument) using a parallel-plate geometry (with a diameter of 25 mm) at a controlled temperature of 25  $^{\circ }$C. Under a simple shear, the rheological properties of shear-thinning fluids are classically modelled by the power-law model
  $\mu =\kappa \dot {\gamma }^{n_{p}-1}$ (Kamişli & Ryan Reference Kamişli and Ryan2001; de Sousa et al. Reference de Sousa, Soares, de Queiroz and Thompson2007). However, the power-law model cannot predict the viscosity at the low-shear-rate region (Picchi et al. Reference Picchi, Poesio, Ullmann and Brauner2017, Reference Picchi, Ullmann, Brauner and Poesio2021) where the viscosity approaches to a constant value, known as the zero-shear-rate viscosity. Instead, the Ellis model (Reiner & Leaderman Reference Reiner and Leaderman1960) was proposed to capture such a viscosity plateau with a constitutive equation as
 \begin{equation} \frac{\mu}{\mu_0}=\frac{1}{1+(\tau/\tau_{1/2})^{\alpha-1}}, \end{equation}
where  $\tau _{1/2}$ is the shear stress at which the viscosity is half of the Newtonian limit, while
  $\mu _0$ and
  $\alpha$ are the zero-shear-rate viscosity and the degree of shear-thinning, respectively.
Here, we consider the C-Y model, which has been used to describe emulsions, protein solutions and polymer melts (Myers Reference Myers2005; Picchi et al. Reference Picchi, Poesio, Ullmann and Brauner2017). The C-Y model is more convenient for experimental analysis since it expresses the viscosity as an explicit function of the shear rate (Carreau Reference Carreau1972; Pipe, Majmudar & McKinley Reference Pipe, Majmudar and McKinley2008; Morozov & Spagnolie Reference Morozov and Spagnolie2015). The constitutive equation of the C-Y model is  $\mu =(\mu _0-\mu _\infty )(1+(\lambda \dot {\gamma })^a)^{(n_c-1)/a}+\mu _\infty$, where
  $\mu _0$,
  $\mu _\infty$,
  $n_c$ and
  $a$ are the zero-shear-rate viscosity, infinite-shear-rate viscosity, the power-law index and dimensionless parameter, respectively. Here,
  $\lambda$ is the inverse of a characteristic shear rate at which shear-thinning becomes apparent. Figures 2(a) and 2(b) demonstrate that the C-Y model can well capture the rheological behaviours for both the CMCell and Carbopol solutions in the range of shear rates over five orders of magnitude. We note that
  $\mu _\infty$ is neglected in the following discussion since
  $\mu _\infty /\mu _0< O(10^{-2})$ and therefore the constitutive equation for the C-Y model can be written as
 \begin{equation} \mu\approx\mu_0(1+(\lambda\dot{\gamma})^a)^{(n_c-1)/a}.\end{equation}
Figure 2. (a) Rheogram of the glycerin and carboxymethyl cellulose (CMCell) solutions with different mass fractions: viscosity  $\mu$ versus shear rate
  $\dot {\gamma }$. (b) Rheogram of the Carbopol solutions with different mass fractions:
  $\mu$ versus
  $\dot {\gamma }$. The dashed lines represent a fitting with the Carreau–Yasuda (C-Y) model. (c) Dimensionless parameter
  $a$ versus the power-law index
  $n_c$ in the C-Y model or the degree of shear-thinning
  $\alpha$ in the Ellis model. (d) Ellis number
  $El$ versus Carreau number
  $Cu$ in the current experiments. Error bars are smaller than the symbols.
A very recent theoretical work by Picchi et al. (Reference Picchi, Ullmann, Brauner and Poesio2021) derived the film thickness as a function of the Ellis number  $El$ and the degree of shear-thinning
  $\alpha$ for an Ellis fluid, where
  $El$ is the ratio between the characteristic shear rate of the fluid and the characteristic shear rate in the liquid film as
 \begin{equation} El=\frac{\tau_{1/2}h}{U\mu_0}. \end{equation}
To compare our experimental measurements with the lubrication theory of Picchi et al. (Reference Picchi, Ullmann, Brauner and Poesio2021), we rewrite the C-Y model with a similar form to the Ellis model as
 \begin{equation} \frac{\mu}{\mu_0}=(1+{({Cu\tilde{\dot{\gamma}}})}^a)^{(n_c-1)/a} \quad \text{with} \ Cu = \frac{\lambda{U}}{h} \ \text{and} \ \tilde{\dot{\gamma}}={\frac{\dot{\gamma}}{U/h}},\end{equation}
where the Carreau number  $Cu$ is the ratio between the effective shear rate
  $U/h$ in the film and the cross-over strain rate
  $1/\lambda$ (Datt et al. Reference Datt, Zhu, Elfring and Pak2015), and
  $\tilde {\dot {\gamma }}$ is the dimensionless shear rate. With the rheological data in figure 2(a,b), we used the method of least squares fitting to obtain all the parameters for the Ellis and C-Y models. Notably, the value of
  $a$ in the C-Y model is chosen to impose
  $n_c=1/\alpha$ for an analogy between the Ellis and C-Y models, and we find
  $a\approx 0.45 n_c ^{-1}$, as shown in figure 2(c). Next, for all the experimental cases, once the bubble speed and the film thickness are determined,
  $El$ and
  $Cu$ are calculated as shown in figure 2(d). In the current work,
  $Cu$ is found to be inversely proportional to
  $El$ with an experimentally fitted relation of
  $Cu\approx 1.3El^{-1}$. The rheological parameters of the CMCell and Carbopol solutions are reported in table 2, and we will focus on the effects of
  $Cu$ and
  $n_c$ on the deposition dynamics of the working fluids.
Table 2. Rheological properties of the CMCell and Carbopol solutions with different mass fractions computed by the C-Y model.

We note that Carbopol solutions can exhibit both yield stress and shear-thinning behaviours. However, we use a low mass fraction of Carbopol to diminish the yield stress effect (Spiers, Subbaraman & Wilkinson Reference Spiers, Subbaraman and Wilkinson1975; Ma et al. Reference Ma, Bai, Chang, Yi, Jiao and Du2015), so that only the shear-thinning behaviour dominates. We further justify this consideration by fitting our rheological data of Carbopol with the Herschel–Bulkley model  $\tau =\tau _y+k_{HB}\dot {\gamma }^{n_{HB}}$, where
  $\tau _y$ is the yield stress and
  $k_{HB}$ is the consistency factor. A dimensionless number
  $B=\tau _y R/\sigma$ is suggested to compare the yield stress to the capillary pressure (Deryagin & Levi Reference Deryagin and Levi1964; Laborie et al. Reference Laborie, Rouyer, Angelescu and Lorenceau2017). In our experiments,
  $B$ is
  $O (10^{-3})$ while
  $B$ is
  $O (1)$ in Laborie et al. (Reference Laborie, Rouyer, Angelescu and Lorenceau2017), thus we neglect the yield stress effect in the following discussion.
3.2. Scaling of the film thickness with the modified capillary number
The film thickness measured in the experiments with the CMCell and Carbopol solutions is shown in figures 3(a) and 3(b), respectively, as a function of the zero-shear-rate capillary number  $Ca_0$, as well as the modified capillary number
  $\widehat {Ca}$. As shown in figure 3(a), compared to a Newtonian fluid at the same
  $Ca_0$, the bubble forms a thinner liquid film in both the CMCell and Carbopol solutions because of the shear-thinning effect. The thinner liquid film formed in the Carbopol solutions compared with that in the CMCell solutions at the same
  $Ca_0$ results from that the stronger shear-thinning effect in the Carbopol solutions than that in the CMCell solutions, as indicated by lower power-law indices of the Carbopol solutions compared with those of the CMCell solutions in table 2.

Figure 3. (a) Non-dimensional liquid film thickness h/R as a function of  $Ca_0$. The black line represents prediction of (1.1). (b)
  $h/R$ versus
  $\widehat {Ca}^{2/{2n_p+1}}$, where
  $\widehat {Ca}=\kappa (U/R)^{n_p}/(\sigma /R)$, with
  $\kappa$ and
  $n_p$ ranging from 0.4 to 5.4
  $\textrm {Pa s}^{n_p}$ and 0.16 to 0.51, respectively. The black line represents the prediction of (1.2) with a prefactor of 1. The experimental measurements are shown as open symbols, and error bars are smaller than the symbols.
With  $\widehat {Ca}$ to compare the shear stress from the power-law model and the capillary pressure, (1.2) has been used to predict the film thickness (Gutfinger & Tallmadge Reference Gutfinger and Tallmadge1965; Hewson et al. Reference Hewson, Kapur and Gaskell2009). We note that the values of
  $\kappa$ and
  $n_p$ for
  $\widehat {Ca}$ are obtained by fitting the rheological data with a power-law model considering the range of shear rates exhibiting a shear-thinning behaviour, i.e.
  $\dot {\gamma } = O(10\unicode{x2013}10^3$ s
 $^{-1})$ for CMCell and
  $O(10^{-1}\unicode{x2013}10^2$ s
 $^{-1}$) for Carbopol. As shown in figure 3(b), we report that the data do not precisely follow the power law of
  $2/(2n_p+1)$, as predicted by (1.2). The results imply that all the dynamics of the coating process cannot be captured by using
  $\widehat {Ca}$, since the power-law model alone is not sufficient to describe the rheological behaviours of the working fluids around the bubble. In particular, the deviation of the experimental data for the CMCell solutions is larger than those for the Carbopol solutions when comparing to the prediction of (1.2), which can be attributed to the range of the effective shear rates. In the experiments, considering the effective shear rates in the film
  $\dot {\gamma }=U/h$, we obtain
  $Cu=O(10\unicode{x2013}10^2)$ for the CMCell solutions while
  $Cu=O(10^5)$ for the Carbopol solutions. The experiments for the CMCell solutions include low- to intermediate-shear-rate regions, while the experiments for the Carbopol solutions are performed at intermediate- to comparably high-shear-rate regions. Therefore, the viscosity plateau at low-shear-rate is required to be considered to obtain the better prediction for the case of the CMCell solutions, in addition to the power-law dependence at intermediate-shear-rates. Furthermore, in the vicinity of the uniform film thickness region, the fluid is at rest. However, the shear-thinning effect plays an important role at the bubble front meniscus. Approaching the meniscus, the film starts growing rapidly in the thickness and the shear rate also increases. However, the local shear rate will decrease again in the region of the re-circulating flow ahead of the bubble. Such a change of the local shear rate at different regions requires an accurate viscosity model for a correct representation of the flow physics, which also highlights the importance of a more realistic rheological model in free surface flow analyses.
3.3. Scaling of the film thickness with the effective capillary number
To explore the effect of the shear-thinning rheology on bubble characteristics, the following ordinary differential equation for the bubble profile has been obtained in the theoretical work by Picchi et al. (Reference Picchi, Ullmann, Brauner and Poesio2021) considering an Ellis fluid
 \begin{equation} \frac{\mathrm{d}^3\eta}{\mathrm{d}\xi^3}+\frac{3^\alpha}{(\alpha+2){El}^{\alpha-1}} \frac{\mathrm{d}^3\eta}{\mathrm{d}\xi^3} \left|\frac{\mathrm{d}^3\eta}{\mathrm{d}\xi^3}\right|^{\alpha-1}\eta^{\alpha-1}= \frac{\eta-1}{\eta^3}, \end{equation}
where  $\xi =x/[h(3Ca_0)^{-1/3}]$ and
  $\eta =y/h$. Different from the Newtonian case, the bubble profile
  $\eta$ becomes a function of
  $\xi$,
  $\alpha$ and
  $El$. The two terms in the left-hand side of (3.5) represent the Newtonian and shear-thinning contributions, respectively. The curvature of the parabolic region needs to be matched to the curvature of the bubble spherical cap,
  $1/R$, and once that is done, the thickness of the uniform film region can be deduced.
By introducing the effective capillary number  $Ca_e$ that considers both the zero-shear-rate and the shear-thinning effects, we obtain
 \begin{equation} \frac{h}{R}=P(3Ca_0)^{2/3}=0.643(3Ca_e)^{2/3} \quad \text{with}\ Ca_e=\frac{\mu_eU}{\sigma}, \end{equation}
where  $\mu _e$ is the effective viscosity defined as
  $\mu _e=\mu _0(P/0.643)^{3/2}$, and
  $P$ is the dimensionless curvature related to the capillary pressure as the second derivative of
  $\eta$ with respect to
  $\xi$, i.e.
  $P=\mathrm {d}^2\eta /\mathrm {d}\xi ^2$ at the limit of
  $\eta \gg 1$. Here,
  $P$ is determined by numerically solving (3.5) using the fully implicit solver
  $ode15i$ of Matlab and the exact initial conditions given by Picchi et al. (Reference Picchi, Ullmann, Brauner and Poesio2021), and then taking a limit when
  $\eta \gg 1$ toward the front meniscus. Furthermore, 0.643 is the numerical factor for the Newtonian limit (Bretherton Reference Bretherton1961). In addition, Picchi et al. (Reference Picchi, Ullmann, Brauner and Poesio2021) used the numerical results of
  $P$ from (3.5) to obtain a master fitting curve of
  $\mu _e$ as a function of
  $El$ and
  $\alpha$. Here, we revise the fitting curve with
  $Cu$ and
  $n_c$ considering the experimental rheological data (
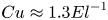 $Cu\approx 1.3{El}^{-1}$ and
  $n_c=1/\alpha$, § 3.1) as follows:
 \begin{equation} \frac{\mu_e}{\mu_0}=\left(\frac{P}{0.643}\right)^{3/2}= \begin{cases} 1 & \text{if} \ Cu \rightarrow 0, \\ \dfrac{10-7n_c}{4}\left(\dfrac{Cu}{1.3}\right)^{n_c-1} \equiv \varTheta & \text{if} \ Cu \gg 1. \end{cases}\end{equation}
The prefactor  $(10-7{n_c})/4$ for
  $Cu \gg 1$ comes from the fitting curve obtained by Picchi et al. (Reference Picchi, Ullmann, Brauner and Poesio2021) at
  $El\rightarrow 0$. When
  $Cu \rightarrow 0$, (3.7) reduces to a Newtonian case. When
  $Cu \gg 1$, the shear-thinning effect dominates, and thus the viscosity depends on
  $n_c$ and
  $Cu$ given that
  $\mu _\infty$ is neglected in the current experiments. For other practical non-Newtonian fluids with non-negligible
  $\mu _\infty$, the limit of
  $Cu \rightarrow \infty$ corresponds to the high-shear-rate viscosity plateau with constant viscosity
  $\mu _\infty$.
For each experiment, we compute the effective shear rate in the film  $U/h$, using the measured bubble speed and film thickness, and thus acquire the effective viscosity
  $\mu _e/\mu _0$ of the CMCell and Carbopol solutions by using the C-Y model (figure 2). We find the experimental values of
  $\mu _e/\mu _0$ agree well with
  $(P/0.634)^{3/2}$, which is numerically calculated from (3.5). Indeed, figure 4(a) provides a plot of the effective viscosity as a function of
  $Cu$ and
  $n_c$ and all the viscosity data collapse around the fitting curve of the master (3.7), as shown in figure 4(b), which suggests a universal scaling for the effective viscosity to define the effective capillary number. Therefore, the comparison of the effective capillary number
  $Ca_e$ obtained from (3.6) against the experimental data show good agreement over the entire range of
  $Ca_e$ (figure 4c). The smaller values of
  $\mu _e$/
 $\mu _0$ for the Carbopol solution demonstrate the greater extent of shear-thinning compared to the CMCell solution, which are also indicated by the higher values of
  $Cu$ for the Carbopol solutions, as shown in table 2. We further recast (3.6) in the following expression proposed by Aussillous & Quéré (Reference Aussillous and Quéré2000) for the range of
  $Ca_e$ (
 $10^{-3}< Ca_e<0.6$) in the current experiments as
 \begin{equation} \frac{h}{R}=\frac{1.34Ca_e^{2/3}}{1+2.5\times1.34Ca_e^{2/3}}.\end{equation}
Figure 4. (a) Non-dimensional effective viscosity  $\mu _e/\mu _0$ as a function of the Carreau number
  $Cu$ and the power-law index
  $n_c$. (b)
  $\mu _e/\mu _0$ of the experimental data as a function of
  $\varTheta$. All the experimental data from the present work show good agreement with the master curve of (3.7). (c) Comparison of the effective capillary number,
  $Ca_e$, between the theoretical and experimental results. All the data lie along the solid line with a slope of a unity. (d) h/R as a function of
  $Ca_e$. The black line represents prediction of (3.8) with
  $Ca_e$ (Aussillous & Quéré Reference Aussillous and Quéré2000; Picchi et al. Reference Picchi, Ullmann, Brauner and Poesio2021). Error bars are smaller than the symbols.
Figure 4(d) shows a plot of the non-dimensional liquid film thickness  $h/R$ as a function of
  $Ca_e$. The values of
  $h/R$ increase consistently with
  $Ca_e$ for the non-Newtonian fluids, as the viscous effect is increasingly important. The experimental data for both the CMCell and Carbopol solutions agree well with (3.8), including the trend in low
  $Ca_e$ and the saturation behaviour at relatively large
  $Ca_e$. Thus, we demonstrate that the liquid film thickness of the shear-thinning fluids can be estimated with the scaling law proposed by Aussillous & Quéré (Reference Aussillous and Quéré2000) using
  $Ca_e$. The better prediction accuracy compared with (1.2) also highlights the importance of a practical rheological model. To the best of our knowledge, our work serves as the first experimental validation of (3.8) with realistic shear-thinning fluids based on
  $Ca_e$, which is helpful to assess the true range of applicability for different scaling laws.
3.4. Scaling of the bubble speed with the effective capillary number
In addition, we experimentally measure the ratio of the bubble speed,  $U$, to the average velocity of the fluid flowing far from the bubble,
  $U_\infty$. The scaling law for the ratio
  $U/U_\infty$ can be derived by applying the mass balance near the thin film region in a reference frame moving with the bubble (Picchi et al. Reference Picchi, Ullmann, Brauner and Poesio2021). Using
  $Ca_e$, we obtain
 \begin{equation} \frac{U}{U_\infty}=\frac{1}{(1-h/R)^2}=\frac{1}{\left(1- \dfrac{1.34Ca_{e}^{2/3}}{1+2.5\times1.34Ca_{e}^{2/3}}\right)^2}.\end{equation}
 The experimentally obtained  $U/U_\infty$ collapse well with (3.9) (figure 5), showing that
  $Ca_e$, as a function of
  $Cu$ and
  $n_c$, can be used to describe the evolution of the bubble speed with the rheological parameters of the shear-thinning fluids.

Figure 5. Ratio of the bubble speed to the average velocity of the fluid far from the bubble  $U/U_\infty$, as a function of
  $Ca_e$ obtained from (3.6). Error bars are smaller than the symbols.
3.5. Characteristics of the bubble front and rear menisci
We further investigate the shape variations of the bubble translating in the CMCell solution, in which the front and rear menisci of the bubble could be identified clearly compared to those in the Carbopol solution. In this section, the bubble shape profiles near the front and rear menisci are computed by solving (3.5) as a function of  $El$ and
  $\alpha$. Then we plot in figure 6 the numerically obtained profiles considering
  $Cu$ and
  $n_c$ to be given by the correlations
  $Cu \approx 1.3 El^{-1}$ and
  $n_c=1/\alpha$, and these correlations having already been introduced back in § 3.1. Using the experimentally obtained bubble profiles, we first identify the points at which the local film thickness increase by one pixel (
 $\approx 1.3\ \mathrm {\mu }$m) compared with the uniform film thickness. Such a thickness increase corresponds to
  ${\approx }1.7$–
 $8.5\,\%$ of the uniform thickness of the deposited film. Then, these points are overlapped with those corresponding to the same thickness increase in the numerically obtained bubble profiles, as shown in figure 6. We note that the bubble profiles at the front and the rear menisci are solved separately by integrating (3.5) with a different set of boundary conditions. At the bubble front, we assume that the thin film region extends to
  $\xi \rightarrow -\infty$ (i.e.
  $\eta (-\infty )=1$), and the front meniscus is obtained by integrating (3.5) towards positive
  $\xi$. However, at the rear meniscus, the thin film region is at
  $\xi \rightarrow +\infty$, and the profile at the rear meniscus is obtained by integrating (3.5) towards negative
  $\xi$ starting from the boundary condition
  $\eta (+\infty )=1$ (Bretherton Reference Bretherton1961; Picchi et al. Reference Picchi, Ullmann, Brauner and Poesio2021).

Figure 6. Bubble front meniscus as a function of (a) the Carreau number  $Cu$ with the power-law index
  $n_c = 0.48$ and (b)
  $n_c$ with
  $Cu = 13.8$. Bubble rear meniscus as a function of (c) the Carreau number
  $Cu$ with the power-law index
  $n_c = 0.48$ and (d)
  $n_c$ with
  $Cu = 13.8$.
For the bubble front meniscus, figure 6(a) shows good agreement between the experimental results and the numerical predictions (Picchi et al. Reference Picchi, Ullmann, Brauner and Poesio2021) of the shape changes when  $Cu$ increases at fixed
  $n_c=0.48$. Although the bubble maintains the rounded shape similar to that in the Newtonian fluids, the delayed transition from the uniform film to the parabolic region characterized by a constant dimensionless curvature becomes significant due to the higher effective shear rate in the film. Considering the viscosity field obtained from the numerical simulations by Moreira et al. (Reference Moreira, Rocha, Carneiro, Araújo, Campos and Miranda2020), the appearance of high viscosity in the film is due to the almost stagnant liquid, while in the axis of the channel, it is due to a low velocity gradient. In between, as
  $Cu$ can be interpreted as the ratio between the representative shear rate in the film to the onset of the shear-thinning effects, larger values of
  $Cu$ (i.e. lower
  $El$) indicate stronger shear-thinning effects and thus the weight of the second term on the left-hand side of (3.5) increases, resulting in the delayed transition to the parabolic region for the bubble shape. A similar trend is observed when decreasing
  $n_c$ at fixed
  $Cu=13.8$, as shown in figure 6(b). The decrease of
  $n_c$ indicates stronger shear-thinning effects and thus the transition to the parabolic region is also expected to be delayed. We note that the numerical solution of (3.5) starts to deviate from the experimental data as
  $Ca_0 > 0.3$ (figure 6b) since the lubrication approximation will no longer strictly hold for the relatively large
  $Ca_0$. We note that such a delayed transition from the thin film to the parabolic profile is also theoretically observed in the case where a charged oil droplet moves through a charged capillary. When the electrostatic interaction between the capillary wall and the droplet surface is attractive, the visco-electro-osmotic balance might not only reduce the film thickness, but also delay the transition because of the cooperation of the electro-osmotic and capillary pressure (Grassia Reference Grassia2020, Reference Grassia2022).
For the bubble rear meniscus, (3.5) is solved following the initial and boundary conditions given by Picchi et al. (Reference Picchi, Ullmann, Brauner and Poesio2021). The general observation of the rear meniscus is similar to that of the Newtonian case, where the bubble profile exhibits one main crest and one main valley (Magnini et al. Reference Magnini, Beisel, Ferrari and Thome2017) with a high degree of undulations, as shown in figure 6(c,d). Although the experimental results do not agree with the numerical solutions very well, the general trends are consistent with the results of Picchi et al. (Reference Picchi, Ullmann, Brauner and Poesio2021), considering the effect of the shear-thinning rheology. As the shear-thinning effect becomes more important with increasing  $Cu$ or decreasing
  $n_c$, the bubble profile stretches along
  $\xi$. Unlike the front meniscus, where the viscosity profile is regular, the axial velocity gradient near the rear meniscus should be considered when computing the shear rate due to the undulations (Picchi et al. Reference Picchi, Ullmann, Brauner and Poesio2021). Therefore, an accurate description of the viscosity field at the rear meniscus of the bubble requires a further correction for the axial derivative of the velocity in future work.
4. Conclusion
In this work, we provide an experimental framework to study the motion of a long bubble translating in a circular capillary tube filled with non-Newtonian shear-thinning fluids. The Carreau–Yasuda rheological model is used to describe the rheological properties of the CMCell and Carbopol solutions, with full consideration for the viscosity plateaus at the very low- or high-shear-rates and the shear-thinning behaviour at the intermediate-shear-rates. We show that the deposited film thickness and the bubble speed cannot be scaled by the modified capillary number based on the simple power-law rheological model. Instead, the extended Bretherton's law holds well if the effective capillary number is considered, as a function of the Carreau number and power-law index in the Carreau–Yasuda rheological model. In addition, we investigate the shear-thinning effect on the variation of the bubble profile near the front and rear menisci. Based on a recent theoretical work by Picchi et al. (Reference Picchi, Ullmann, Brauner and Poesio2021), we systematically compare the experimental measurements to the numerical prediction for the bubble profile. Stronger shear-thinning effect, indicated by large Carreau number and smaller power-law index, delays the transition from the uniform film to the parabolic region at the bubble front while stretches the undulations at the rear meniscus. The numerical prediction of the bubble profile works well for the bubble front but with less accuracy for the bubble rear given the complexity of the velocity field. We believe our results serve as an experimental validation of the recent modelling approach, which provides confidence in applying these models to a variety of problems involving lubrication and coating flows with shear-thinning fluids. The influences of other rheological properties, such as viscoelasticity and the resulting coupling with the channel geometry, on the deposition dynamics will be the focus of our future investigation.
Acknowledgements
We acknowledge Professor R.H. Ewoldt and Y. Wang in Mechanical Science and Engineering at the University of Illinois at Urbana-Champaign for fruitful discussion about the rheology analysis. Rheological experiments were carried out in part in the Materials Research Laboratory Central Research Facilities, University of Illinois.
Funding
We acknowledge the support from American Chemical Society Petroleum Research Fund Grant No. 61574-DNI9 (to J.F.).
Declaration of interests
The authors report no conflict of interest.


 Open access