






1. Introduction
Heat transfer by turbulent forced convection occurs when a cold fluid flows over a hot wall, or vice versa. Forced thermal convection has countless applications in engineering, and it is the fundamental principle upon which heat exchangers are designed and built (Incropera et al. Reference Incropera, DeWitt, Bergman and Lavine1996; Kakac, Liu & Pramuanjaroenkij Reference Kakac, Liu and Pramuanjaroenkij2002). Heat exchangers are a key component in any energy conversion system – for instance, the radiators in our homes, heat pumps, fuel cells, nuclear plants and solar receivers. In aerospace engineering, two notable applications are aircraft and rocket engines, where components are subjected to extreme heat loads and internal cooling is necessary to guarantee the material integrity.
Most studies on forced thermal convection regard the temperature field as a passive scalar, neglecting its feedback effect on the velocity field through the variation of the transport properties of the fluid. Notable experimental and numerical studies relying on the constant-property assumption are those by Sparrow, Lloyd & Hixon (Reference Sparrow, Lloyd and Hixon1966), Xia et al. (Reference Xia, Rowin, Jelly, Marusic and Hutchins2022), Alcántara-Ávila, Hoyas & Pérez-Quiles (Reference Alcántara-Ávila, Hoyas and Pérez-Quiles2021) and Abe & Antonia (Reference Abe and Antonia2017), together with the more recent direct numerical simulations (DNS) studies performed by our group (Pirozzoli, Bernardini & Orlandi Reference Pirozzoli, Bernardini and Orlandi2016; Pirozzoli & Modesti Reference Pirozzoli and Modesti2023).
The constant-property assumption is valid if temperature variations are of the order of a few per cent because the thermodynamic variables and fluid properties can be assumed to be constant (Cebeci & Bradshaw Reference Cebeci and Bradshaw1984). However, most engineering applications feature large temperature differences. For instance, in aircraft engines, the air passing through the cooling channels of turbine blades has mean temperature  $T_m \approx 400$ K, whereas the wall temperature reaches $T_w\approx 800$ K, hence their ratio is well beyond the range of validity of the constant-property assumption. This range of temperature variations is common in engineering applications; however, the constant-property assumption is used in most academic research and exploited in engineering practice.
Preliminary design of cooling/heating ducts is based mainly on predictive formulas for the Nusselt number and the pressure drop, which are used for sizing the cooling passages. Among the most classical engineering formulas, we recall those by Dittus & Boelter (Reference Dittus and Boelter1985) and Gnielinski (Reference Gnielinski1976) for the Nusselt number, and Prandtl's friction formula for the pressure drop (Nikuradse Reference Nikuradse1933). Although their use is widespread in engineering design, these formulas are based on the constant-property assumption and do not directly account for the effect of variable fluid properties, which is usually included using empirical corrections (Sleicher & Rouse Reference Sleicher and Rouse1975; Yeh & Stepka Reference Yeh and Stepka1984).
The most popular empirical corrections for heat transfer prediction in water are those by Dittus & Boelter (Reference Dittus and Boelter1985) and Sieder & Tate (Reference Sieder and Tate1936), which account for the fluid viscosity variations through an empirical corrective factor  $(\mu _b/\mu _w)^n$ applied to the Nusselt number resulting from formulas obtained for the constant-property case, where $\mu _m$ and $\mu _w$ are the viscosities of the fluid evaluated at the mean and wall temperatures, respectively. Also for gases, many empirical predictive formulas for the Nusselt number are available, and they have been reviewed extensively by Petukhov (Reference Petukhov1970) and Yeh & Stepka (Reference Yeh and Stepka1984). However, they all have a structure similar to that used for water, relying on a correction factor based on the mean-to-wall temperature ratio $(T_m/T_w)^n$, with exponent $n$ depending on the type of gas and on the cooling/heating ratio. Similar corrections are also used to estimate the friction factor, and they suggest drag reduction in the case of wall heating, for both liquids (Sieder & Tate Reference Sieder and Tate1936) and gases (Yeh & Stepka Reference Yeh and Stepka1984), compared to the adiabatic case. However, these corrections are fluid-dependent and available for only a limited number of fluids, and their accuracy is often questionable.
More recently, some authors have studied forced thermal convection in fluids with variable properties using DNS. Zonta, Marchioli & Soldati (Reference Zonta, Marchioli and Soldati2012) performed DNS of water flow in a plane channel with a heated wall and a cold wall, and found a reduction of the Reynolds shear stress and of the friction coefficient at the heated wall, despite the lower viscosity, which increases the local Reynolds number. Lee et al. (Reference Lee, Jung, Sung and Zaki2013) performed DNS of turbulent boundary layers with temperature-dependent viscosity representative of water, and investigated the effect of wall heating on the friction and heat transfer coefficients. They reported a 26 % drag reduction for water with freestream-to-wall temperature ratio 0.77, at freestream temperature approximately  $300$ K, and the drag reduction mechanism was attributed to a reduction of the wall-shear stress, in agreement with the findings of Zonta et al. (Reference Zonta, Marchioli and Soldati2012). Lee et al. (Reference Lee, Jung, Sung and Zaki2014) used the same DNS dataset to assess heat transfer modifications due to variable viscosity effects, and proposed a correction to the classical Kader fitting for the mean temperature profile (Kader Reference Kader1981). Patel, Boersma & Pecnik (Reference Patel, Boersma and Pecnik2016, Reference Patel, Boersma and Pecnik2017) studied the effects of variable density and viscosity in liquid-like and gas-like fluids using DNS. They utilized compressibility transformations, originally developed for high-speed boundary layers (Modesti & Pirozzoli Reference Modesti and Pirozzoli2016; Trettel & Larsson Reference Trettel and Larsson2016), to map velocity and temperature profiles to the constant-property case, reporting good agreement with the constant-property profiles. Kaller et al. (Reference Kaller, Pasquariello, Hickel and Adams2019) conducted a wall-resolved large-eddy simulation of flow in a duct with one heated side, filled with water, and observed reduced friction near the heated wall, which was also accompanied by weakened secondary flows. The effect of density variations is also important in the context of mixed convection, although the common practice is to rely on the Boussinesq approximation (Pinelli et al. Reference Pinelli, Uhlmann, Sekimoto and Kawahara2010; Yerragolam et al. Reference Yerragolam, Howland, Stevens, Verzicco, Shishkina and Lohse2024), whereas studies that account for a non-Oberbeck–Boussinesq effect are more limited (Zonta Reference Zonta2013). The effect of variable physical properties is also important in pure natural convection (Gray & Giorgini Reference Gray and Giorgini1976), particularly in experimental studies, where it is challenging to achieve high Rayleigh numbers while satisfying the Oberbeck–Boussinesq approximation. To the best of our knowledge, there is no counterpart of the Grossmann–Lohse theory (Grossmann & Lohse Reference Grossmann and Lohse2000) for Rayleigh–Bénard convection with variable properties.
Although studies focusing on the effect of density and viscosity variations in forced thermal convection are available, predictive formulas for the heat transfer and friction coefficients are invariably based on empirical fitting of experimental data, and the few numerical studies available did not discuss in detail the prediction of these coefficients. In this study, we aim to develop a more solid theoretical framework to estimate the mean friction drag and heat transfer in the presence of variation of the transport properties, focusing on the case of air as the working fluid. For that purpose, we use DNS data of plane turbulent channel flow at a moderate Reynolds number to develop improved formulas for friction and heat transfer prediction.
2. Methodology
We solve the compressible Navier–Stokes equations using our flow solver STREAmS (Bernardini et al. Reference Bernardini, Modesti, Salvadore and Pirozzoli2021, Reference Bernardini, Modesti, Salvadore, Sathyanarayana, Posta and Pirozzoli2023); additional details on the numerical method are reported in Appendix A. The streamwise momentum equation is forced in such a way as to maintain a constant mass flow rate. Periodicity is exploited in the streamwise and spanwise directions, and isothermal no-slip boundary conditions are used at the channel walls. Let  $h$ be the half-width of the channel, with DNS carried out in a computational domain $L_x\times L_y\times L_z=6{\rm \pi} h \times 2 h\times 2{\rm \pi} h$. A uniform bulk cooling or heating term is added to the entropy equation to guarantee that the mixed mean temperature, defined as
 \begin{equation} T_m = \frac{1}{2h \rho_b u_b}\int_{0}^{2h}\bar{\rho}\, \bar{u}\,\bar{T} \,\mathrm{d}y,\quad \rho_b=\frac{1}{2h}\int_{0}^{2h}\bar{\rho}\,\mathrm{d}y,\quad u_b = \frac{1}{2h \rho_b}\int_{0}^{2h}\bar{\rho}\, \bar{u} \,\mathrm{d}y, \end{equation}
remains exactly constant in time. Here,  $\rho _b$ and $u_b$ are the bulk density and velocity, respectively. In the following, an overline is used to indicate Reynolds averaging in time and in the homogeneous spatial directions, and a prime is used to denote fluctuations thereof. As is common in variable-density flows, we also use Favre averages, denoted with a tilde as $\tilde {f}=\overline {\rho f}/\bar {\rho }$, and a double prime will indicate fluctuations thereof.
A  $+$ superscript is used to denote normalization by wall units, namely by friction velocity $u_{\tau } = (\tau _w/\bar {\rho }_w)^{1/2}$ (where $\tau _w= \mu _w\,{\rm d} \tilde {u}/{\rm d} y\vert _w$ is the mean wall shear stress), and the associated viscous length scale $\delta _v=\nu _w/u_\tau$, where the subscript $w$ denotes quantities evaluated at the wall. For inner normalization of the mean temperature, we use the friction temperature $\theta _{\tau } = q_w/(\rho _w c_p u_{\tau })$, where $q_w = \lambda _w \,{\rm d} \tilde {T}/{\rm d} y\vert _w$ is the mean wall heat flux, $c_p=\gamma /(\gamma -1) R$ is the specific heat capacity at constant pressure, $R$ is the air constant, and $\lambda _w$ is the thermal conductivity at the wall, evaluated as $\lambda = \mu c_p/\textit {Pr}$, with Prandtl number set to $\textit {Pr}=0.72$.
Twenty DNS have been carried out at bulk Mach number  $M_b=u_b/c_m=0.2$ (where $c_m$ is the speed of sound at the mixed mean temperature) and bulk Reynolds number $\textit {Re}_b=2\rho _b u_b h/\mu _m\approx 9000\unicode{x2013}70\,000$ (see table 1), where $\mu _m = \mu (T_m)$ is the dynamic viscosity evaluated at the mixed mean temperature, as obtained from Sutherland's law (White Reference White1974). The Mach number is low enough that compressibility effects are negligible, as it turns out, in order to isolate variable-property effects. We consider various mean-to-wall temperature ratios, namely $T_m/T_w=0.4,0.5,0.7,0.8,1.5,2,2.5,3$, resulting in friction Reynolds numbers in the range $\textit {Re}_\tau =u_\tau h/\nu _w\approx 150\unicode{x2013}3200$, where $\nu _w$ is the kinematic viscosity at the wall. For the case of mean-to-wall temperature ratio $T_m/T_w=0.5$, we also study the effect of varying the dimensional wall temperature, considering cases with $T_w=800$ and $293.15$ K. This temperature range is rather wide and covers most applications of forced air convection of which we are aware. Cases with wall heating approach the condensation temperature of air ( $\approx$90 K), and cases with wall cooling feature temperature variations in the range $220\ {\rm K} \lesssim T \lesssim 1000\ {\rm K}$, involving temperature values beyond those normally found in heat exchangers. For each value of the mean-to-wall temperature ratio, we have two flow cases, denoted with the letters L and H, depending on whether the Reynolds number is comparatively ‘low’ or ‘high’ (see table 1). For two flow cases with mean-to-wall temperature ratio $T_m/T_w=0.5$ and $T_m/T_w=2$ we also consider a ‘very high’ Reynolds number case, denoted with VH. In the present study, we consider pure forced convection, neglecting the effect of buoyancy because in forced air convection applications the Richardson number is typically very small. For instance, cooling channels of turbine blades have bulk velocity $u_b\approx 30\unicode{x2013}60$ m s $^{-1}$ and temperature variations of order $400$ K, leading to Richardson numbers of the order $\textit {Ri}\approx 10^{-5}$.
Table 1. Flow parameters for plane channel flow DNS. Box dimensions are  $6{\rm \pi} h \times 2h \times 2{\rm \pi} h$ for all flow cases; $\textit {Re}_b = 2 \rho _b h u_b / \nu _m$ is the bulk Reynolds number, and $\textit {Re}_{\tau } = h u_{\tau } / \nu _w$ is the friction Reynolds number; $\textit {Re}_{\tau,cp} = y_{cp}(h)/\delta _v$ is the equivalent friction Reynolds number, defined in equation; $T_m$ and $T_w$ are the mixed mean temperature and the wall temperature, respectively; $C_f = 2 \tau _w /(\rho _b u_b^2)$ is the friction coefficient; $\textit {St}=q_w/[\rho _b C_p u_b (T_w-T_m)]$ is the Stanton number; $\textit {Nu}=\textit {St}\,\textit {Re}_b\,\textit {Pr}$ is the Nusselt number; $\Delta x$ and $\Delta z$ are the mesh spacings in the streamwise and spanwise directions, and $\Delta y_w$ is the mesh spacing at the wall; and the $*$ superscript indicates normalization with equivalent constant-property viscous length scale $\delta _{v,cp}$, defined in (4.16c).

3. Instantaneous temperature field
We begin our analysis by inspecting the instantaneous velocity and temperature fields of flow cases H05-A (wall heating) and H3 (wall cooling) in figure 1. Both cases exhibit the qualitative features that characterize wall turbulence, with high-speed cold (or hot) flow structures protruding towards the walls, and low-speed hot (or cold) fluid regions protruding towards the channel centre. Despite sharing the general features of wall turbulence, we also note a significant effect of the thermodynamic and fluid property variations between cases with wall heating and wall cooling. First, we observe that the friction Reynolds number values reported in table 1 are not indicative of actual separation of scales in constant-property flows. For instance, flow case with wall heating H05-A ( $T_m/T_w=0.5$) has a relatively low friction Reynolds number ( $\textit {Re}_\tau =360$), but it exhibits finer eddies than one would expect at this Reynolds number. This effect can be traced to strong viscosity variations within the near-wall and core flow regions. The opposite is true for wall cooling; for instance, flow case H3 ( $T_m/T_w=3$) has a higher friction Reynolds number ( $\textit {Re}_\tau =1420$), but small scales are absent and the flow appears to be a ‘low-pass filtered’ version of the heated case, in which only large structures survive. In fact, in flow case H3 we observe large structures extending from one wall to beyond the channel centreline, whereas those are masked by smaller eddies in flow case H05-A.
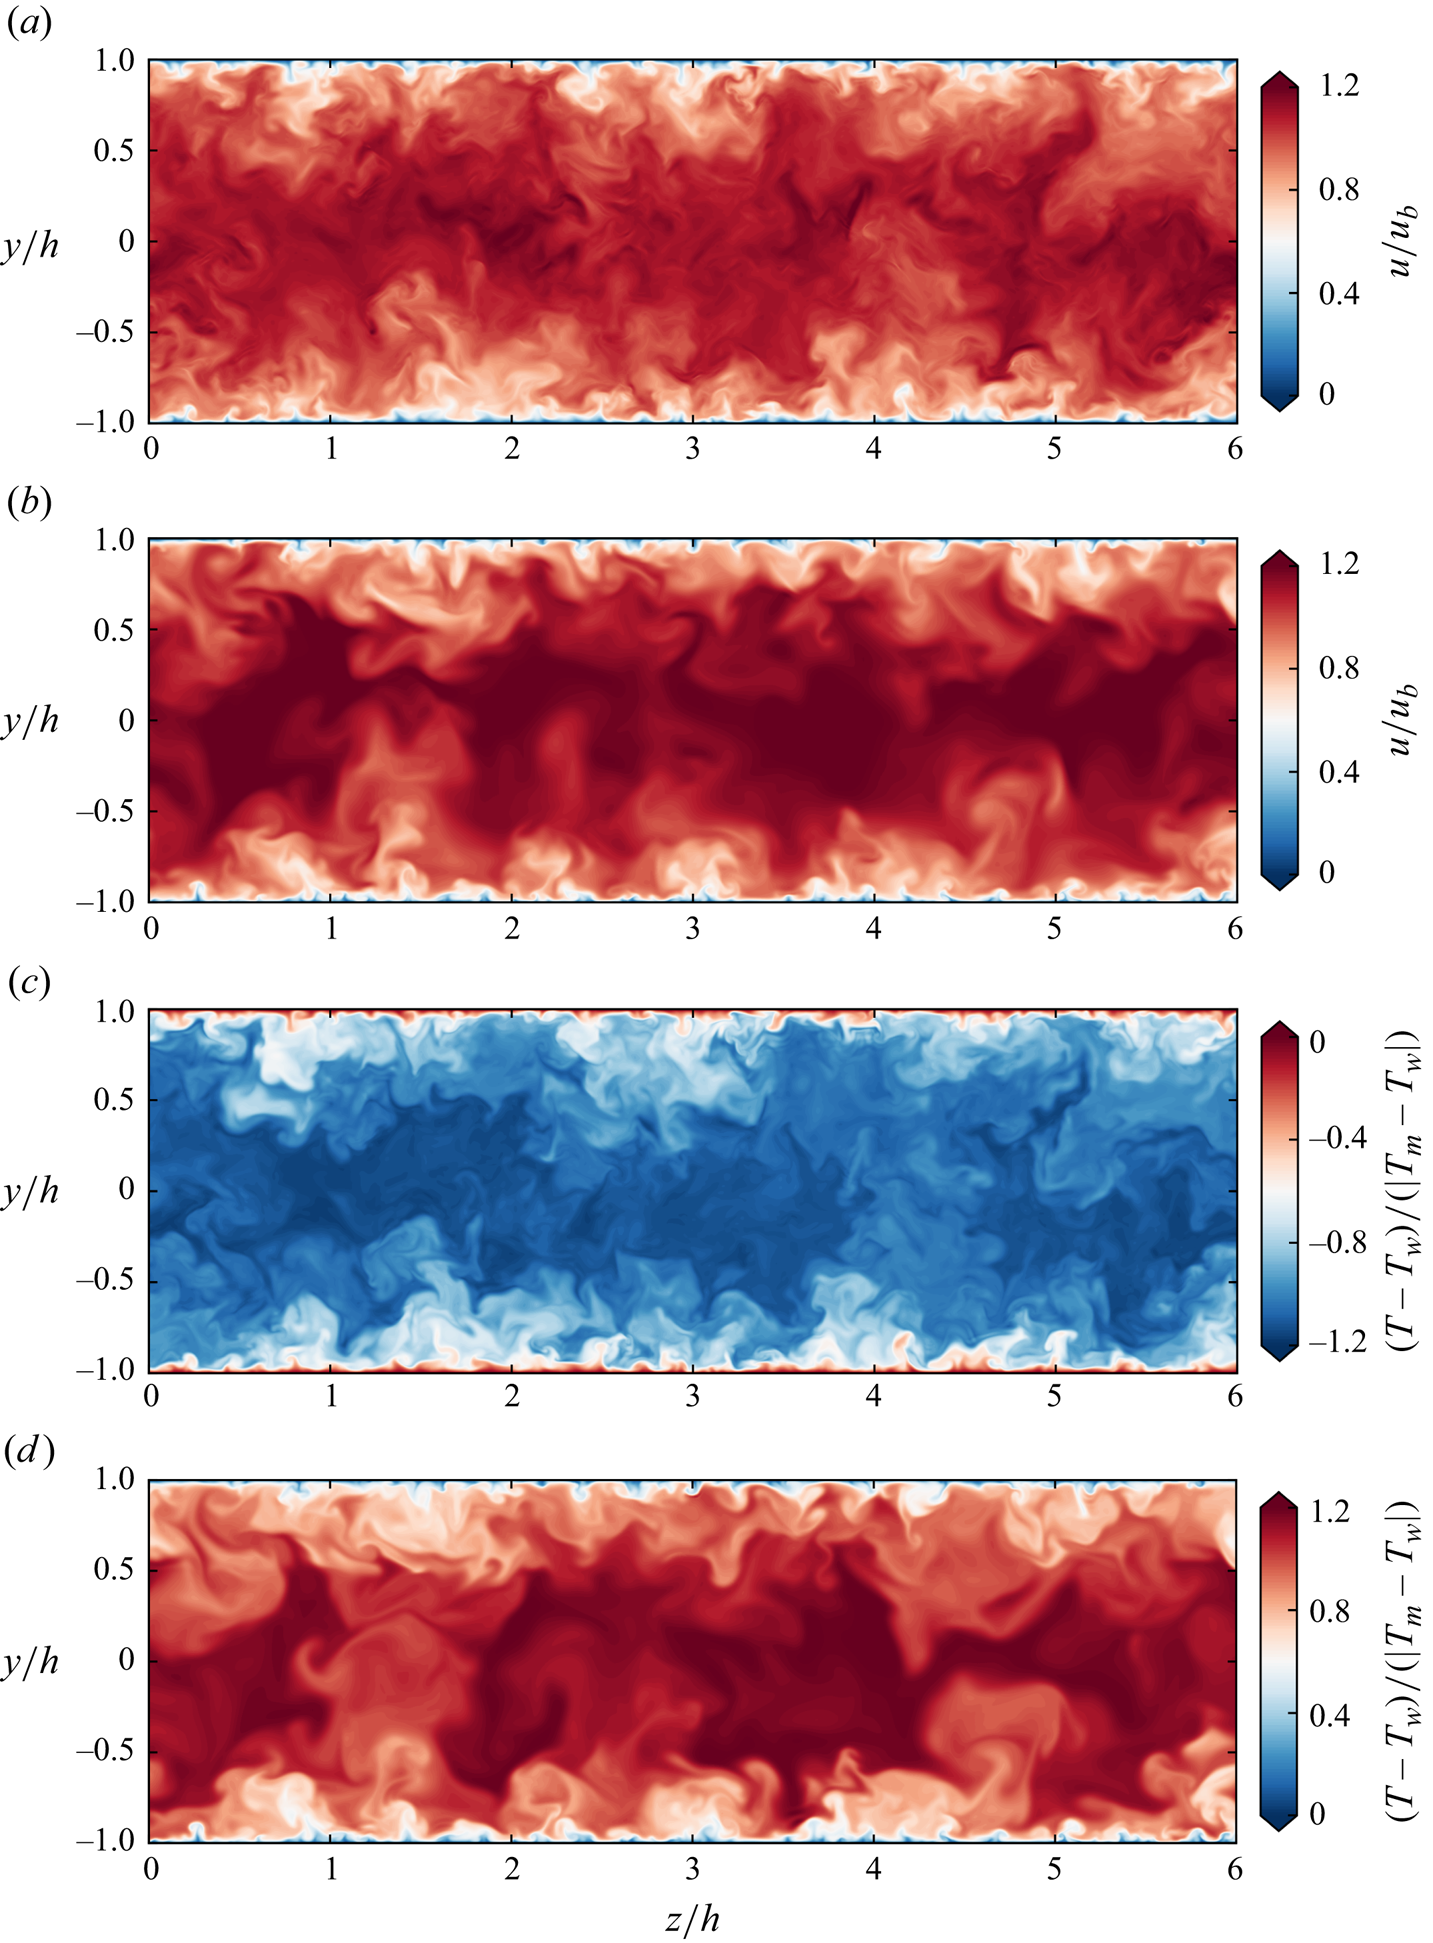
Figure 1. Instantaneous (a,b) velocity and (c,d) temperature fields in a cross-stream plane, for flow cases (a,c) H05-A (wall heating,  $\textit {Re}_\tau =360$, $T_m/T_w=0.5$) and (b,d) H3 (wall cooling, $\textit {Re}_\tau =1420$, $T_m/T_w=3$).
We note that the instantaneous velocity and temperature fields are highly correlated, which is to be expected due to the similarity of the underlying equations and the near-unity value of the Prandtl number, hence the Reynolds analogy holds qualitatively also for the case of variable fluid properties. Close scrutiny of the kinematic and thermal fields reveals that temperature has finer structures as compared to velocity, which is due partly to the Prandtl number being lower than unity, and partly to the effect of the pressure gradient term in the momentum equation (A1b), which is absent in the energy equation (A1c) (Pirozzoli et al. Reference Pirozzoli, Bernardini and Orlandi2016). The occurrence of sharper eddy boundaries in passive scalars compared to the velocity field, even at unit Prandtl number, is a well-known feature that has been reported by several authors (Kim, Guezennec & Stretch Reference Kim, Guezennec and Stretch1990; Abe & Antonia Reference Abe and Antonia2017), and it has been associated with the unmixedness of the scalar, as the absence of the pressure gradient results in reduced heat transport as compared to momentum transport.
4. Mean flow field and variable-property transformations
We begin the mean flow analysis by comparing the mean velocity and temperature profiles to the equivalent statistics for the constant-property case. For that purpose, we rely both on DNS data of constant-property plane channel flow with passive scalar transport at  $\textit {Pr}=0.71$ from Pirozzoli et al. (Reference Pirozzoli, Bernardini and Orlandi2016), and on synthetic composite profiles, which are obtained by matching inner-layer velocity and temperature profiles with the corresponding outer-layer distributions. The inner-layer profiles are obtained by integrating the eddy viscosity of Musker (Reference Musker1979) for the velocity, and the eddy diffusivity proposed by Pirozzoli (Reference Pirozzoli2023) for the temperature profile. In the outer layer, we use Clauser's hypothesis of uniform eddy viscosity (Clauser & Francis Reference Clauser and Francis1956) and uniform eddy diffusivity (Pirozzoli et al. Reference Pirozzoli, Bernardini and Orlandi2016). A complete derivation of the composite profiles is available in Pirozzoli & Modesti (Reference Pirozzoli and Modesti2024). Figure 2 shows that the composite profiles of mean temperature and velocity for the constant-property case are essentially indistinguishable from the DNS data, with the advantage that the synthetic profiles are available at any Reynolds number and Prandtl number.
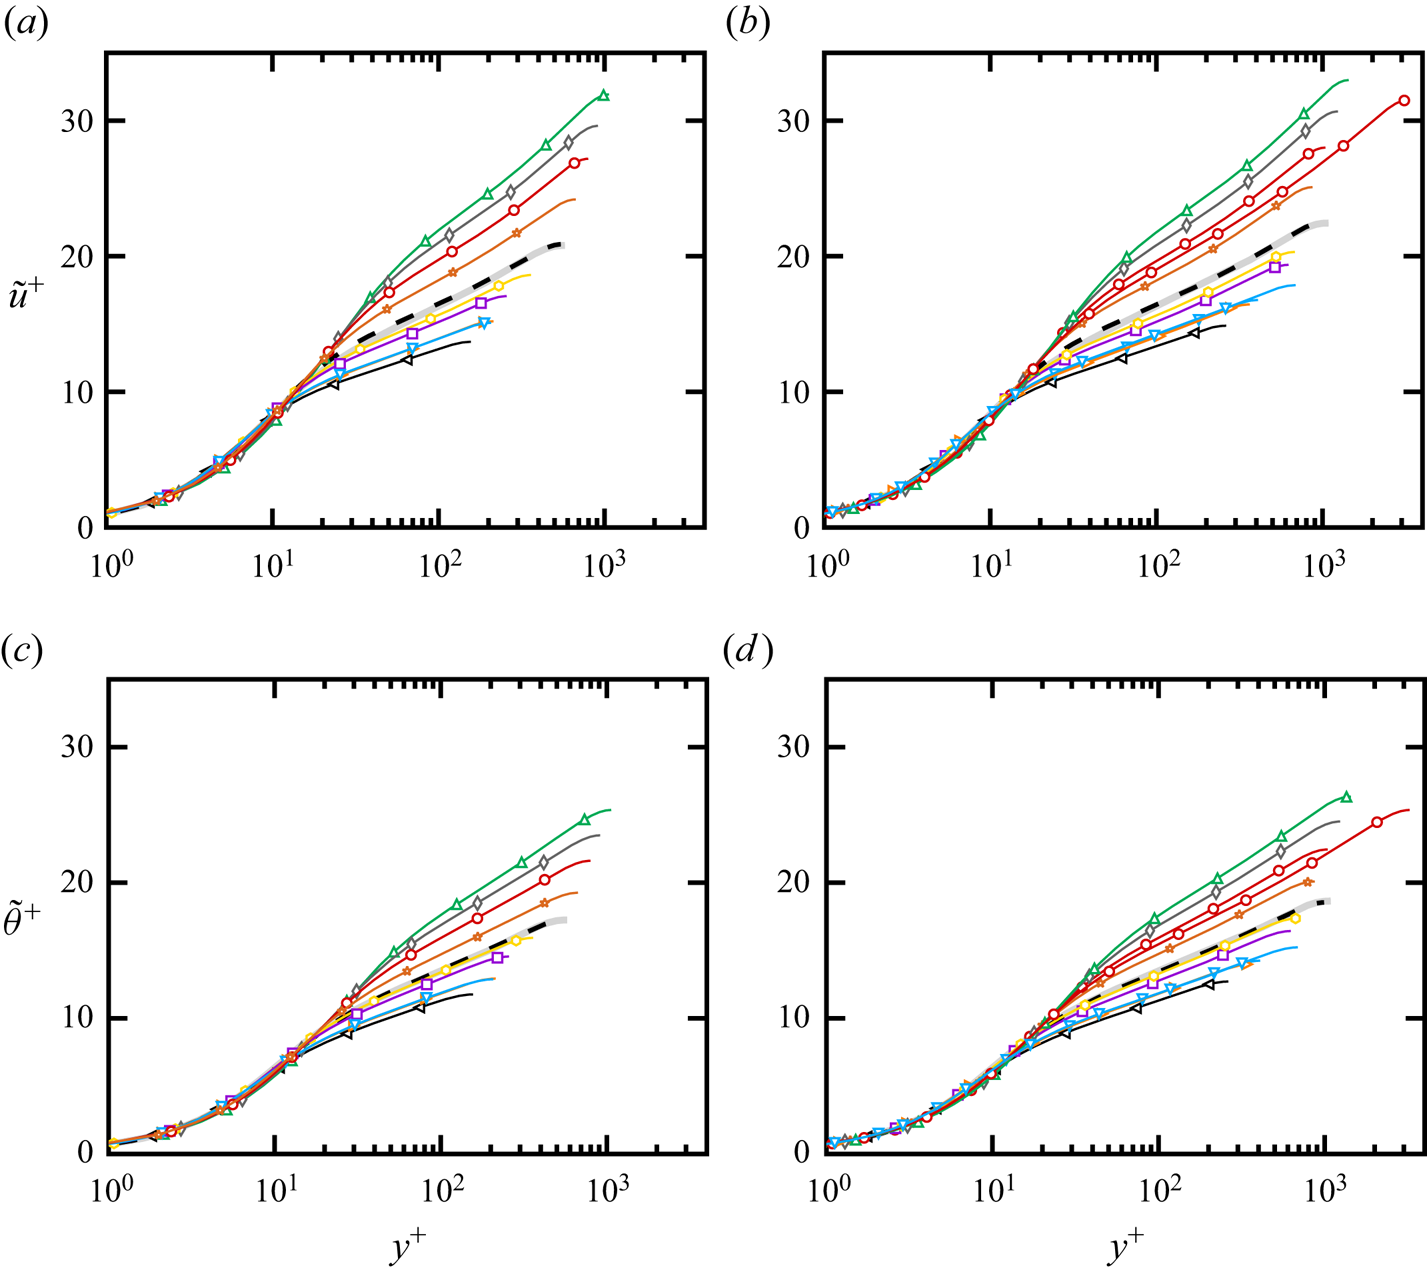
Figure 2. (a,b) Mean velocity and (c,d) mean temperature profiles for (a,c) L flow cases and (b,d) H flow cases. Symbols indicate DNS data for different mean-to-wall temperature ratios:  $T_m /T_w = 0.4$ (left triangles), $T_m /T_w = 0.5$, $T_w=800$ K (downward triangles), $T_m /T_w = 0.5$, $T_w=273.25$ K (right triangles), $T_m /T_w = 0.7$ (squares), $T_m /T_w = 0.8$ (hexagons), $T_m /T_w = 1.5$ (stars), $T_m /T_w = 2$ (circles), $T_m /T_w = 2.5$ (diamonds), $T_m /T_w = 3$ (upward triangles). The grey solid lines indicate the mean velocity and temperature profiles of the constant-property case at $\textit {Pr}=0.72$, obtained using the composite profiles of Pirozzoli & Modesti (Reference Pirozzoli and Modesti2024). The dashed black lines indicate DNS of constant-property channel flow from Pirozzoli et al. (Reference Pirozzoli, Bernardini and Orlandi2016) at $\textit {Pr}=0.71$.
We note that the statistics of the variable-property DNS are substantially different from those in the constant-property case when scaled in classical wall units. All the flow cases exhibit deviations from the reference, starting from the buffer region, and becoming more evident in the logarithmic region, where both the logarithmic slope and the additive constant deviate from the constant-property references. Hence we conclude that in the variable-property case, the law-of-the-wall for both the mean velocity and temperature is not universal, but rather depends on the specific mean-to-wall temperature ratio.
In analogy with what is done for compressible flows, we assume that the effects of density and viscosity variations can be accounted for using suitable convolution integrals (Modesti & Pirozzoli Reference Modesti and Pirozzoli2016)
 \begin{equation} y_{cp}=\int_0^y f_{cp} \, {\mathrm d} y, \quad u_{cp}=\int_0^{\tilde{u}} g_{cp} \, {\mathrm d}\tilde{u}, \quad \theta_{cp}=\int_0^{\tilde{\theta}} h_{cp} \, {\mathrm d}\tilde{\theta}, \end{equation}
with kernel functions  $f_{cp}$, $g_{cp}$, $h_{cp}$ to be specified such that the flow properties are mapped to the universal, constant-property case, denoted with the ‘ $cp$’ subscript. In order to account for the variable-property effect, we consider the streamwise mean momentum balance equation
 \begin{equation} \overline{\mu'\,\frac{\mathrm{d} u'}{\mathrm{d} y}} + \bar{\mu}\,\frac{\mathrm{d} \tilde{u}}{\mathrm{d} y} - \bar{\rho}\,\widetilde{u''v''} = \bar{\rho}_w u_{\tau}^2 (1-\eta), \end{equation}
where  $\eta =y/h$. Following Hasan et al. (Reference Hasan, Larsson, Pirozzoli and Pecnik2023), we then introduce an eddy viscosity for the turbulent shear stress, such that $-\bar {\rho }\,\widetilde {u''v''} = \bar {\rho }\nu _T\,\mathrm {d}\tilde {u}/\mathrm {d} y$. Substituting the transformations (4.1a–c) into the streamwise mean momentum balance equation, and assuming $\overline {\mu '\,\mathrm {d} u'/\mathrm {d} y}\approx 0$, one obtains
 \begin{equation} \frac{\bar{\mu}}{\mu_w}\,\frac{f_{cp}}{g_{cp}}\left(1 + \frac{\nu_T}{\nu}\right)\frac{\mathrm{d}u_{cp}^+}{\mathrm{d} y_{cp}^+} = 1-\eta. \end{equation}
Comparing (4.3) with the constant-property counterpart
 \begin{equation} \left(1 + \frac{\nu_{T,cp}}{\nu_{cp}}\right)\frac{\mathrm{d}u_{cp}^+}{\mathrm{d} y_{cp}^+} = 1-\eta, \end{equation}
we find the following relation between the two kernel functions  $f_{cp}$ and $g_{cp}$:
 \begin{equation} \frac{\bar{\mu}}{\mu_w}\,\frac{f_{cp}}{g_{cp}}\left(1+\frac{\nu_T}{\nu}\right)=1+\frac{\nu_{T,cp}}{\nu_{cp}}. \end{equation}
A second condition is needed, which we find by enforcing that van Driest scaling (van Driest Reference van Driest1951) holds in the logarithmic region, as done by Trettel & Larsson (Reference Trettel and Larsson2016). With this condition, we find
 \begin{equation} f_{cp}=\frac {\mathrm{d}}{\mathrm{d} y} \left( \frac y{R^{1/2} N} \right),\quad g_{cp}=\left(\frac{1 + \nu_T/\nu}{1+\nu_{T,cp}/\nu}\right)R N\,\frac {\mathrm{d}}{\mathrm{d} y} \left( \frac y{R^{1/2} N} \right), \end{equation}
where  $N=\bar {\nu }/\nu _w$ and $R=\bar {\rho }/\bar {\rho }_w$. The kernel functions (4.6a,b) are formally equivalent to the velocity transformation derived by Hasan et al. (Reference Hasan, Larsson, Pirozzoli and Pecnik2023) for a high-speed turbulent boundary layer, with eddy viscosities to be specified. Using the model eddy viscosity of Musker (Reference Musker1979) for the baseline case of constant-property flow, herein we extend the model to account for variable-property effects by including an ad hoc correction depending on the mean-to-wall temperature ratio
 \begin{equation} \frac{\nu_{T,cp}}{\nu} = \frac{(\kappa y_{cp}^+)^3}{(\kappa y_{cp}^+)^2 + C_{v1}^2},\quad \displaystyle\frac{\nu_T}{\nu} = \frac{(\kappa y_{cp}^+)^3}{(\kappa y_{cp}^+)^2 + C_{v1}^2 + \varphi(T_m/T_w)}, \end{equation}
where  $\kappa =0.387$ is the assumed Kármán constant, and $C_{v1}=7.3$. Fitting the present DNS data (only flow cases at ‘high Reynolds numbers’, denoted as H, have been taken into account), we have determined empirically the following expressions for the additive function $\varphi$:
 \begin{equation} \varphi(T_m/T_w) =\begin{cases} -32\log{(T_m/T_w)} - 59(1-T_m/T_w)^2, & T_m/T_w<1,\\ 5.6(1-T_m/T_w), & T_m/T_w>1. \end{cases} \end{equation}
Similarly to what is done for the mean velocity, a transformation for the mean temperature profile is obtained starting from the mean energy balance equation
 \begin{equation} \underbrace{\overline{\lambda'\,\frac{\mathrm{d} \theta'}{\mathrm{d} y}}}_{\textit{fluctuating conduction}} +\underbrace{\bar{\lambda}\,\frac{\mathrm{d} \tilde{\theta}}{\mathrm{d} y}}_{\textit{mean conduction}} \underbrace{{}- C_p\bar{\rho}\,\widetilde{\theta''v''}}_{\textit{turbulent convection}} + \underbrace{\varPsi}_{\textit{dissipation}} = \underbrace{q_w (1-\mathcal{R})}_{\textit{total heat flux}}, \end{equation}
where
 $$\begin{gather} \mathcal{R}(\eta) =\frac{1}{\rho_b} \int_0^\eta \bar{\rho}(\eta)\,\mathrm{d}\eta, \quad \varPsi = \int_0^y \epsilon \, \mathrm{d} y -\int_0^y \frac{\rho}{\rho_b}\int_0^1\epsilon \, \mathrm{d}\eta\,\mathrm{d} y, \end{gather}$$
 $$\begin{gather}\epsilon = \displaystyle\overline{\sigma_{ij}\,\frac{\partial u_i}{\partial x_j}} - \overline{u_i\,\frac{\partial p}{\partial x_i}}. \end{gather}$$
The relative importance of the different terms in (4.6) is analysed in figure 3, for representative flow cases with wall heating and wall cooling. Figure 3 shows that the mean temperature balance of variable-property flows is qualitatively similar to what is found in passive scalar convection, with mean conduction dominating the near-wall region, and turbulent convection dominating the overall balance away from the wall. However, notable differences are the nonlinearity of the total heat flux (on account of the definition of  $\mathcal {R}$) and the presence of additional terms that are small but not zero. Indeed, very close to the wall, we find a small contribution from the fluctuating conduction term, which, however, remains much smaller than the mean conduction. We recall that in the mean momentum equation (4.2) the fluctuating diffusion term $\overline {\mu '\,\mathrm {d} u'/\mathrm {d} y}$ was neglected, which yields a similar contribution to momentum balance as $\overline {\lambda '\,\mathrm {d} T'/\mathrm {d} y}$ yields to the temperature balance (not shown). The dissipation remains negligible for all cases considered here, due to the small Mach number under scrutiny, confirming that all flow cases can be regarded as representative of incompressible flow. We also note that the total stress $\mathcal {R}(\eta )$ in (4.10) is indistinguishable from the sum of the components, indicating excellent statistical convergence of the results.
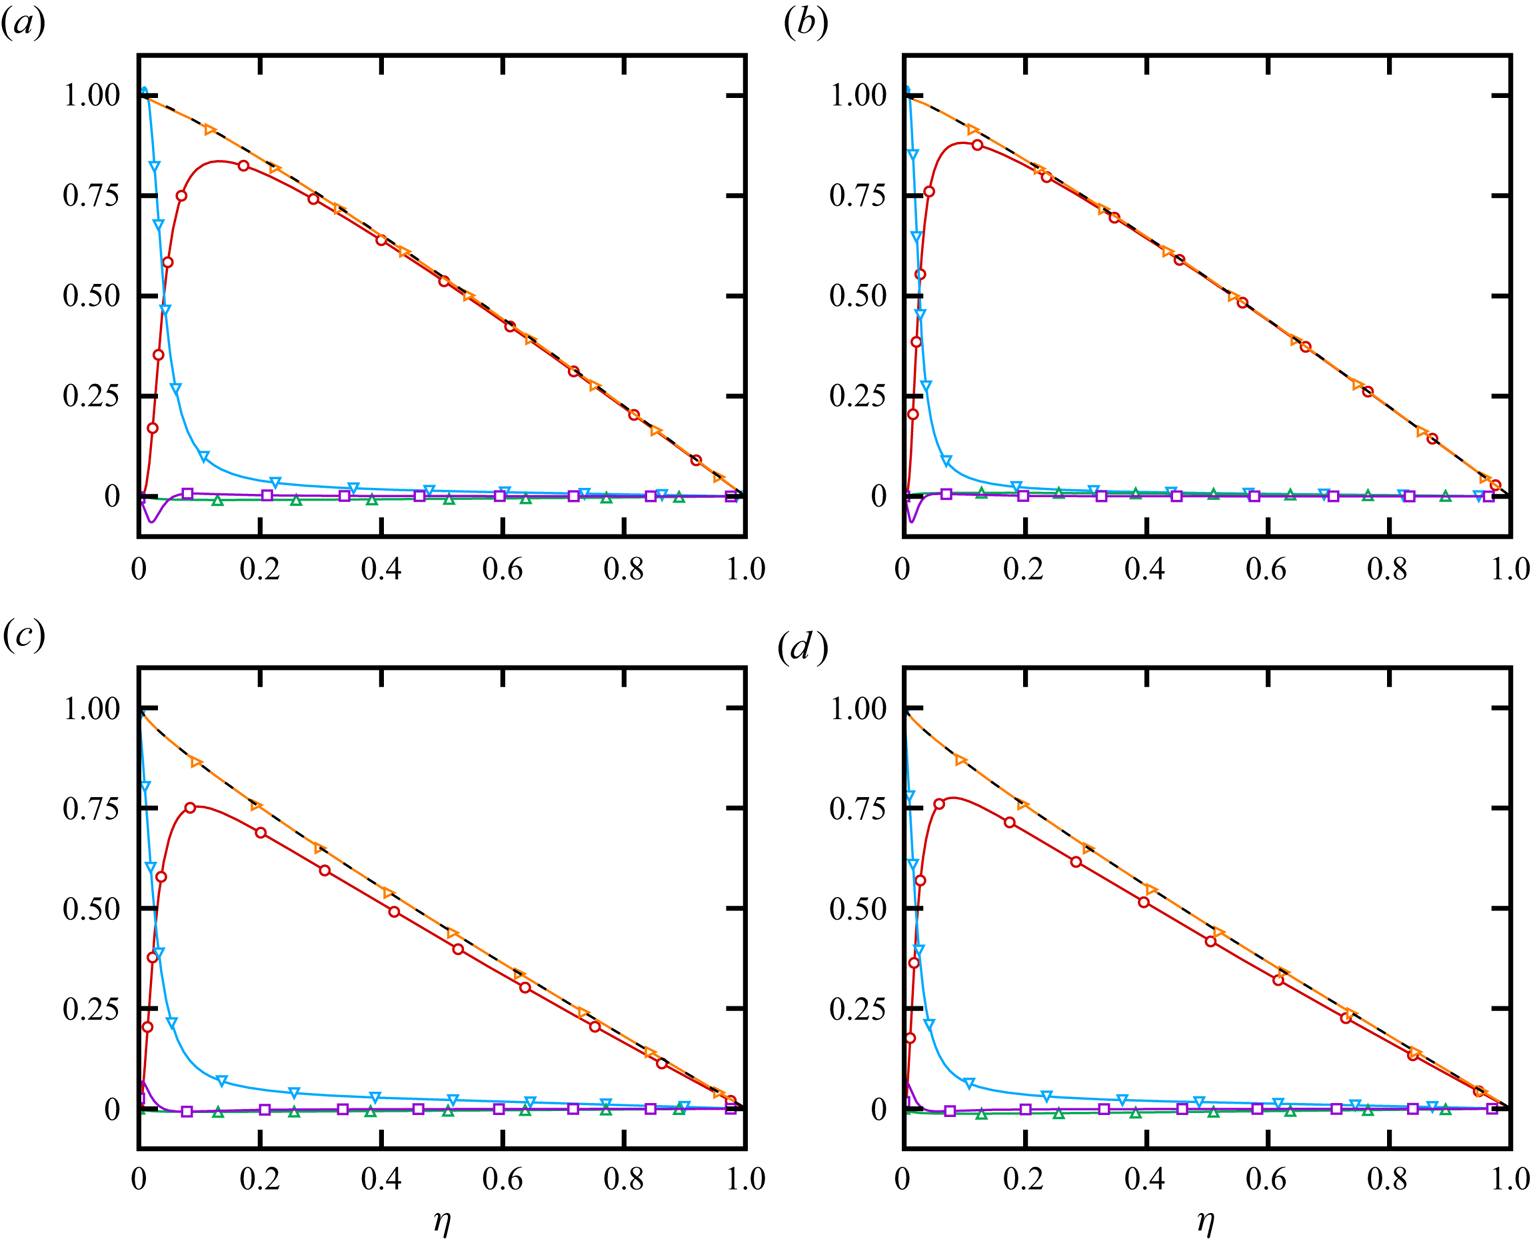
Figure 3. Mean energy balance as in (4.9) for flow cases (a) L05-A ( $\textit {Re}_\tau =212$, $T_m/T_w=0.5$), (b) H05-A ( $\textit {Re}_\tau =360$, $T_m/T_w=0.5$), (c) L3 ( $\textit {Re}_\tau =1051$, $T_m/T_w=3$), and (d) H3 ( $\textit {Re}_\tau =1420$, $T_m/T_w=3$). The symbols indicate mean conduction (downward triangles), fluctuating conduction (squares), turbulent convection (circles), dissipation (upward triangles), total heat flux $\mathcal {R({\eta })}$ in (4.9) (dashed black line), and sum of the different contributions (right triangles).
Based on the DNS data, we then assume  $\varPsi \approx 0$ and $\overline {\lambda '\,\mathrm {d} \theta '/\mathrm {d} y}\approx 0$, and in analogy with what is done for the turbulent shear stress, we model the turbulent heat flux by introducing a thermal eddy diffusivity, such that
 \begin{equation} \widetilde{\theta''v''}\,\frac{1-\eta}{1-\mathcal{R}} =-\alpha_T\, \frac{\mathrm{d}\tilde{\theta}}{\mathrm{d} y}. \end{equation}
Following the same procedure as used for the mean momentum equation, we then determine the corresponding kernel function
 \begin{equation} h_{cp}=\left(\frac{1 + \alpha_T/\alpha}{1+\alpha_{T,cp}/\alpha}\right)\frac{1-\eta}{1-\mathcal{R}}\,R N\,\frac {\mathrm{d}}{\mathrm{d} y} \left( \frac y{R^{1/2} N} \right), \end{equation}
where  $\alpha =\lambda /(\rho c_p)$ is the thermal diffusivity coefficient. Following Pirozzoli (Reference Pirozzoli2023), we model the turbulent diffusivity as
 \begin{equation} \displaystyle\frac{\alpha_{T,cp}}{\alpha} = \frac{(\kappa_\theta y_{cp}^+)^3}{(\kappa_\theta y_{cp}^+)^2 + C_{v3}^2},\quad \displaystyle\frac{\alpha_T}{\alpha} = \frac{(\kappa_\theta y_{cp}^+)^3}{(\kappa_\theta y_{cp}^+)^2 + C_{v3}^2 + \beta(T_m/T_w)}, \end{equation}
with constants  $\kappa _\theta =0.459$, $C_{v3}= 10$. As for the mean velocity, the dependency of the eddy thermal diffusivity on mean-to-wall temperature ratio is accounted for empirically by fitting the DNS data, to obtain
 \begin{align} \beta(T_m/T_w) =\begin{cases} (1-T_m/T_w)[141 - 507(T_m/T_w) + 608(T_m/T_w)^2], & T_m/T_w<1,\\ -28\log{(T_m/T_w)} + 1.6(1-T_m/T_w)^2, & T_m/T_w>1. \end{cases} \end{align}
To summarize, the kernel functions (4.6a,b) and (4.12) are rooted in the mean momentum balance and temperature balance equations, with eddy viscosity and eddy conductivity to be specified. This is, in our opinion, more robust that relying entirely on data-driven transformations (Volpiani et al. Reference Volpiani, Iyer, Pirozzoli and Larsson2020). Nonetheless, we are not aware of any exact result in turbulence theory that does not include constants to be determined from experience or simulation, and the present case is no exception. Here, the constants  $\kappa$, $\kappa _{\theta }$, $C_{v1}$ and $C_{v3}$ were determined once and for all for constant-property flow (Pirozzoli et al. Reference Pirozzoli, Romero, Fatica, Verzicco and Orlandi2021; Pirozzoli & Modesti Reference Pirozzoli and Modesti2023). The only added ingredients here are the functions $\varphi$ in (4.8) and $\beta$ in (4.14), which account empirically for the dependency on the bulk-to-wall temperature ratio. We note that both (4.8) and (4.14) show different functional dependency for heating and cooling, which is aligned with empirical formulas for the Nusselt number and friction coefficient reported in the literature (Petukhov Reference Petukhov1970; Yeh & Stepka Reference Yeh and Stepka1984), featuring different coefficients or functions for the two cases.
In figure 4, we plot the transformed mean velocity and temperature profiles using the kernel functions (4.6a,b) and (4.13a,b), and compare the results with the reference constant-property case. The universality of the various distributions is quite remarkable, given the wide range of variation of the flow properties that we are considering. The accuracy of the velocity and temperature transformations also supports the validity of the assumptions made to derive the kernel functions for the convolution integrals (4.1a–c). We point out that the coefficients inferred from DNS have been calibrated only for flow cases H, and they are successfully applied to lower or higher Reynolds numbers with similar accuracy, showing substantial independence from the Reynolds number. These transformations allow us to define an equivalent channel height  $h_{cp}$, which we use to introduce an equivalent constant-property friction Reynolds number,
 \begin{equation} \textit{Re}_{\tau,cp} = \frac{h_{cp}}{\delta_{v}}, \quad h_{cp} = \int_0^hf_{cp}\,\mathrm{d} y. \end{equation}
The equivalent channel height  $h_{cp}$ is larger than $h$ for heating, and smaller for cooling, leading to higher or lower equivalent constant-property friction Reynolds numbers, respectively. The definition given in (4.15a,b) can also be used to define an equivalent constant-property friction velocity, and an equivalent viscous length scale, namely
 \begin{equation} \textit{Re}_{\tau,cp} = \frac{u_{\tau,cp}h}{\bar{\nu}_w}, \quad u_{\tau,cp}=\frac{\bar{\nu}_w}{\delta_{v,cp}}, \quad \delta_{v,cp} = \frac{h}{h_{cp}}\,\delta_v. \end{equation}
Values of the equivalent constant-property Reynolds numbers are reported in table 1, which can be used as a guide to interpret the instantaneous flow field in figure 1, where flow cases with heating show finer eddies than for cooling because their effective Reynolds number is higher.
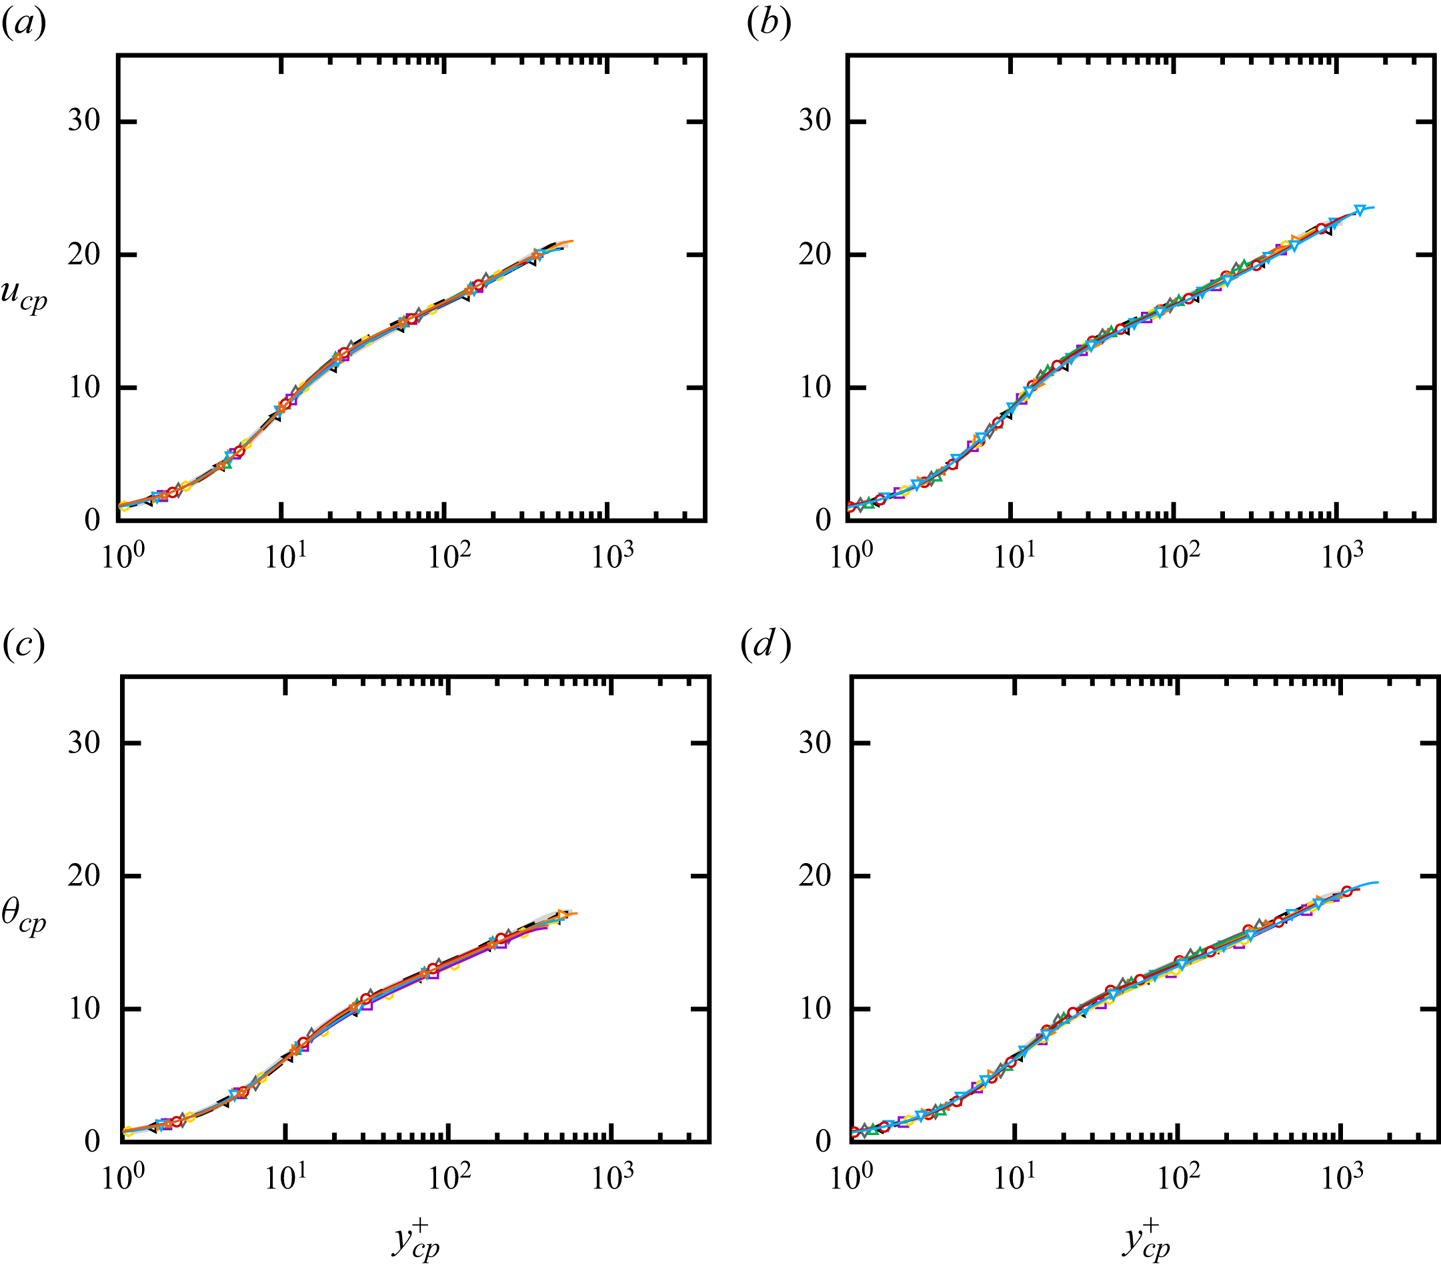
Figure 4. (a,b) Mean velocity and (c,d) mean temperature profiles transformed using (4.1a–c) with kernel functions (4.6a,b) and (4.13a,b), for (a,c) L flow cases and (b,d) H flow cases. Symbols indicate DNS data for different mean-to-wall temperature ratios:  $T_m /T_w = 0.4$ (left triangles), $T_m /T_w = 0.5$, $T_w=800$ K (downward triangles), $T_m /T_w = 0.5$, $T_w=273.25$ K (right triangles), $T_m /T_w = 0.7$ (squares), $T_m /T_w = 0.8$ (hexagons), $T_m /T_w = 1.5$ (stars), $T_m /T_w = 2$ (circles), $T_m /T_w = 2.5$ (diamonds), $T_m /T_w = 3$ (upward triangles). The grey solid lines indicate the reference mean velocity and temperature profiles of the constant-property case at $\textit {Pr}=0.72$, obtained using the synthetic velocity profile of Musker (Reference Musker1979) and the synthetic temperature profile of Pirozzoli (Reference Pirozzoli2023). The dashed black lines indicate DNS of constant-property channel flow from Pirozzoli et al. (Reference Pirozzoli, Bernardini and Orlandi2016) at $\textit {Pr}=0.71$.
5. Wall friction and heat transfer
The variable-property transformations developed in the previous section are very useful, especially as they enable the prediction of the heat transfer and friction coefficients. For that purpose, the only required inputs are the reference constant-property mean velocity and mean temperature profiles. As discussed previously, in the current work we consider the composite profiles developed in the work of Pirozzoli & Modesti (Reference Pirozzoli and Modesti2024). However, different choices are possible, and one could, for instance, use the model for the mean velocity by Nagib & Chauhan (Reference Nagib and Chauhan2008), and the model for the mean temperature by Kader (Reference Kader1981), although the latter might result in less accurate temperature profiles due to inconsistencies in the near-wall region. Starting from those, application of theinverses of transformations (4.1a–c),
 \begin{equation} y=\int_0^y \frac{1}{f_{cp}} \, {\mathrm d}y_{cp}, \quad \tilde{u}=\int_0^{u_{cp}} \frac{1}{g_{cp}} \, {\mathrm d}u_{cp}, \quad \tilde{\theta}=\int_0^{\theta_{cp}} \frac{1}{h_{cp}} \, {\mathrm d}\theta_{cp}, \end{equation}
allows us to determine the actual variable-property profiles, for any given mean-to-wall temperature ratio and Reynolds number. The key technical difficulty is that the kernel functions  $f_{cp}$, $g_{cp}$, $h_{cp}$ depend on the actual temperature in the variable-property case, hence an iterative procedure is necessary, as for compressible flow (Kumar & Larsson Reference Kumar and Larsson2022; Hasan et al. Reference Hasan, Larsson, Pirozzoli and Pecnik2024). The iterative procedure is presented in Algorithm 1, and it can be summarized as follows.
(i) Generate the constant-property profiles for a target friction Reynolds number $\textit {Re}_{\tau,cp}$.
(ii) Initialize kernel functions
$f_{cp}$, $g_{cp}$, $h_{cp}$ using the constant-property temperature profile.(iii) Calculate the backward convolution integrals (5.1a–c) to find
$y$, $u$, $\theta$.(iv) Update the kernels
$f_{cp}$, $g_{cp}$, $h_{cp}$ using the newly calculated temperature $\theta$.(v) Calculate the friction coefficient, the Stanton number and
$\textit {Re}_{\tau,cp}$.(vi) Update the constant-property profiles based on the updated
$\textit {Re}_{\tau,cp}$.


Note that two nested loops are required for this iterative algorithm. This is because the constant-property profiles are also recalculated at each step in order to converge towards the target friction Reynolds number  $\textit {Re}_{\tau,cp}$.
Algorithm 1 Inverse variable-property transformation, where  $\varepsilon_{\textit{Re}_{\tau}}$ and $\varepsilon$ are the tolerances for the iterative algorithm, which in our case are set to $10^{-9}$ and $10^{-10}$, respectively.
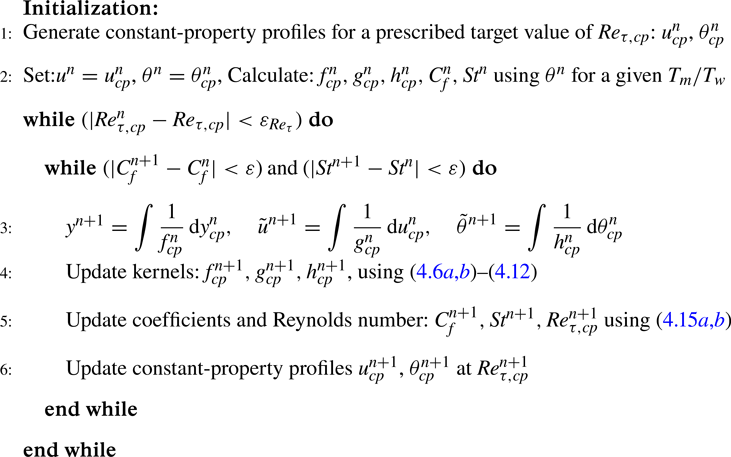
Figure 5 shows the resulting friction coefficient  $C_f=2\tau _w/(\rho _bu_b^2)$ and the Stanton number $\textit {St} = q_w/[\rho _b C_p u_b(T_w-T_m)]$. Whereas the data for the constant-property case (black pentagons) fall on top of the corresponding theoretical curves (light grey), we find significant deviations thereof in cases with property variations. In particular, we note that cases with a heated wall yield reduced friction and heat flux, whereas cases with a cooled wall yield an increase of momentum and heat transfer, with a scatter around the constant-property case of $\pm$25 % for both the friction coefficient and the Stanton number. We also report the heat transfer in terms of Nusselt number $\textit {Nu} = \textit {Re}_b\,\textit {St}\,\textit {Pr}$, although this representation tends to hide differences within a few per cent, thus the Stanton number should be preferred for accurate evaluation of theories. Theoretical predictions relying on use of the variable-property transformations (4.1a–c) are shown in the figure with solid lines of matching colours, and of course those are not universal as well. Notably, figure 5 shows that the resulting predictions match the DNS data to within 1–2 % accuracy for all cases, for both the friction and heat transfer coefficients, as shown quantitatively in figure 6. We further find that the analogy between momentum and heat transfer holds also in the case of variable-property flows, as the Reynolds analogy factor stays close to the constant property case, although this information alone is obviously not sufficient to recover the heat transfer and friction coefficients from the constant-property case. Note that the Reynolds analogy factor is not unity even in the constant-property case because $\textit {Pr}=0.72$.
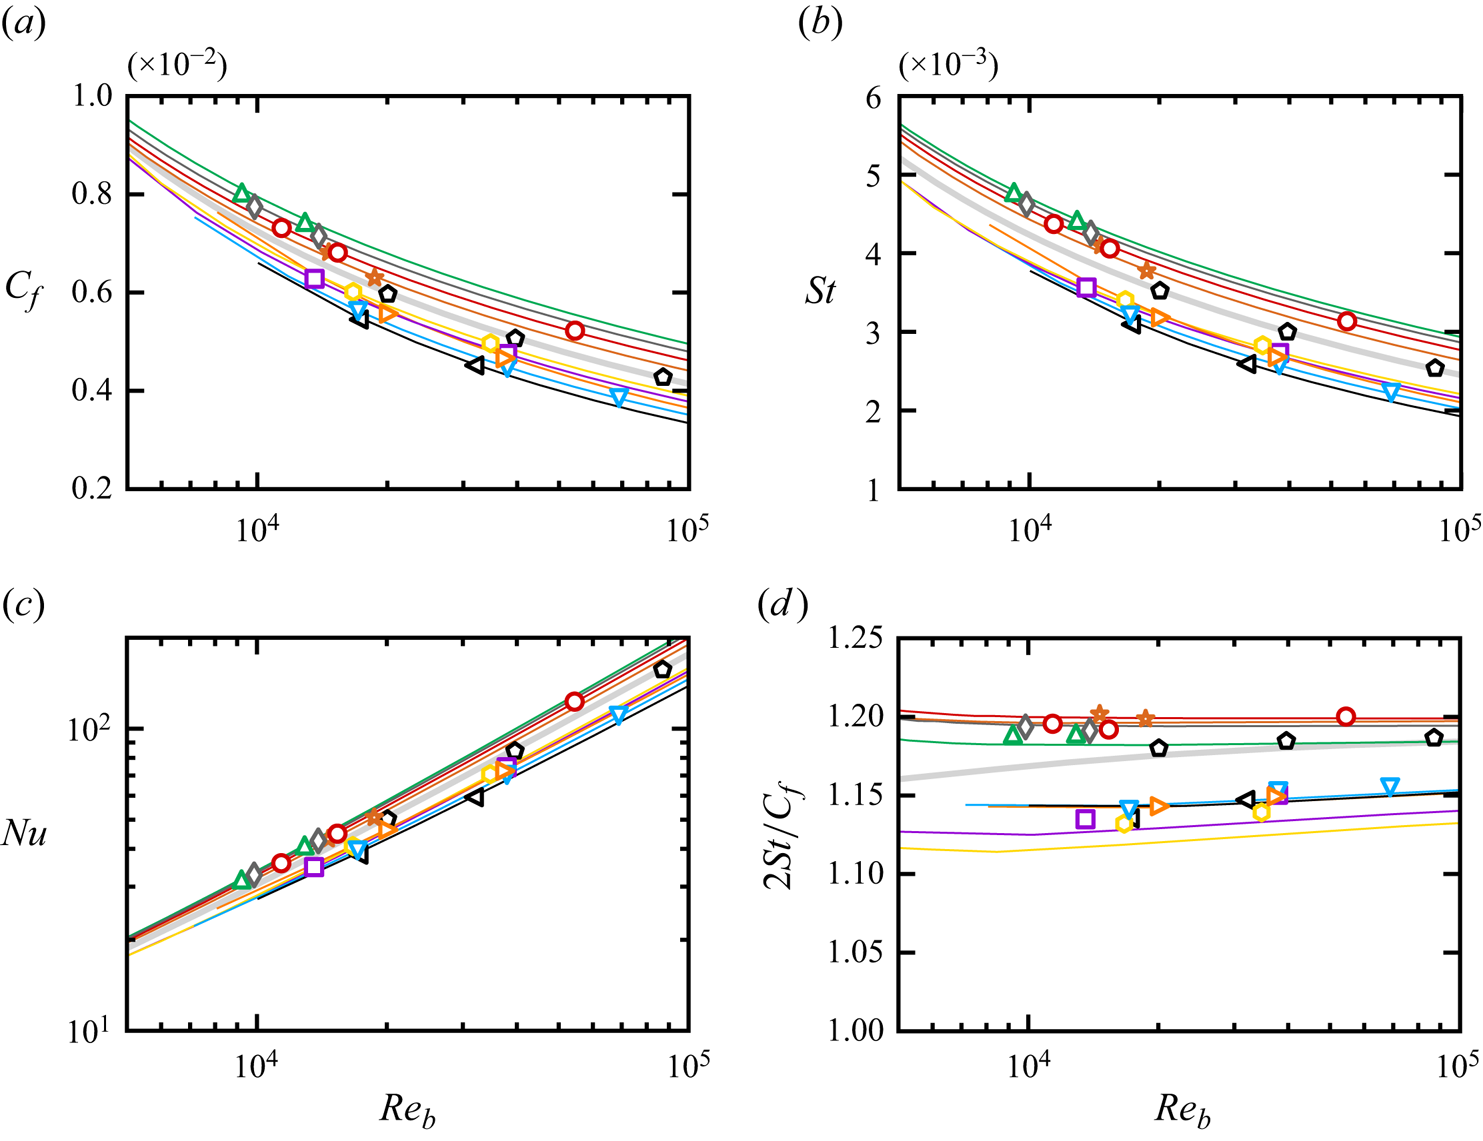
Figure 5. (a) Friction coefficient, (b) Stanton number, (c) Nusselt number and (d) Reynolds analogy factor as functions of the bulk Reynolds number  $\textit {Re}_b=2h\rho _bu_b/\mu _m$. Solid lines indicate predictions obtained by inverting the variable-property transformations (4.1a–c), and symbols indicate DNS data for different mean-to-wall temperature ratios, with matching colours: $T_m /T_w = 0.4$ (black left triangles), $T_m /T_w = 0.5$, $T_w=800$ K (orange downward triangles), $T_m /T_w = 0.5$, $T_w=273.25$ K (blue right triangles), $T_m /T_w = 0.7$ (purple squares), $T_m /T_w = 0.8$ (gold hexagons), $T_m /T_w = 1.5$ (brown stars), $T_m /T_w = 2$ (red circles), $T_m /T_w = 2.5$ (grey diamonds), $T_m /T_w = 3$ (green upward triangles). Black pentagons refer to DNS data of passive scalars in plane channel flow with $\textit {Pr}=0.71$ from Pirozzoli et al. (Reference Pirozzoli, Bernardini and Orlandi2016).

Figure 6. Percentage difference between DNS data and predicted (a) friction coefficient and (b) Stanton number as functions of the bulk Reynolds number  $\textit {Re}_b=2h\rho _bu_b/\mu _m$. Symbols indicate DNS data for different mean-to-wall temperature ratios: $T_m /T_w = 0.4$ (left triangles), $T_m /T_w = 0.5$, $T_w=800$ K (downward triangle), $T_m /T_w = 0.5$, $T_w=273.25$ K (right triangles), $T_m /T_w = 0.7$ (squares), $T_m /T_w = 0.8$ (hexagons), $T_m /T_w = 1.5$ (stars), $T_m /T_w = 2$ (circles), $T_m /T_w = 2.5$ (grey diamonds), $T_m /T_w = 3$ (upward triangles).
6. Conclusions
Currently, predicting heat transfer through forced convection in real fluids depends heavily on fitting experimental data obtained decades ago, leading to uncertainties of up to 20–30 %. This significant variability is clearly reflected in the current DNS data. To address this uncertainty, we have developed a robust framework for estimating momentum and heat transfer coefficients. Our approach is grounded in the first principles of momentum and energy balance rather than empirical methods, offering the advantages of accuracy and generalizability. Similar to approaches used in high-speed turbulent boundary layers, our method relies on transformation kernels for velocity and temperature distributions.
Preliminary tests indicate that transformation kernels informed by DNS data can generate velocity and temperature distributions with excellent universality compared to the constant-property case. Evaluating momentum and heat transfer coefficients involves integrating the estimated velocity and temperature profiles obtained through the backward application of these transformation kernels, requiring an iterative procedure. Our results indicate that the method can accurately predict heat transfer and friction coefficients within 1–2 % compared to DNS data. Additionally, the developed method can determine mean temperature and velocity profiles alone, providing valuable information for establishing wall functions in simulations employing wall-modelled approaches.
We also acknowledge that cooling ducts in practical applications often feature rough walls rather than smooth ones (Chung et al. Reference Chung, Hutchins, Schultz and Flack2021; De Maio et al. Reference De Maio, Latini, Nasuti and Pirozzoli2023; Zhong, Hutchins & Chung Reference Zhong, Hutchins and Chung2023). This raises questions about the applicability of the current transformations to complex surface patterns. In such cases, the effects of density and viscosity variations lead to a much more intricate flow physics compared to constant-property flows. Several mechanisms and parameters remain to be studied, including the precise mechanisms responsible for friction and heat transfer variation, the impact on turbulence length scales, the dependency of Prandtl number and heat capacity on the temperature, and the influence of the working fluid. We plan to investigate these aspects in future studies.
We believe that the proposed approach could have important implications in closely related fields, as mixed and natural convection. In principle, we see no reason why the same approach should not be applicable to these flow problems, as the transformations are rooted in the mean momentum and thermal balance, which are universal.
Acknowledgements
We acknowledge CHRONOS for awarding us access to Piz Daint, at the Swiss National Supercomputing Centre (CSCS), Switzerland. We also acknowledge EuroHPC for access to LEONARDO based at CINECA, Casalecchio di Reno, Italy.
Declaration of interests
The authors report no conflict of interest.
Data availability
The DNS data are available at http://newton.dma.uniroma1.it. Model coefficients can be generated at http://www.thermoturb.com.
Appendix A
We solve the fully compressible Navier–Stokes equations for a perfect heat-conducting gas,
 $$\begin{gather} \frac{\partial \rho}{\partial t} + \frac{\partial\rho u_i}{\partial x_i} = 0 , \end{gather}$$
 $$\begin{gather}\frac{\partial \rho u_i}{\partial t} + \frac{\partial\rho u_i u_j}{\partial x_j} =- \frac{\partial p}{\partial x_i} + \frac{\partial\sigma_{ij}}{\partial x_j} + f \delta_{i1} , \end{gather}$$
 $$\begin{gather}\frac{\partial \rho s}{\partial t} + \frac{\partial\rho u_j s}{\partial x_j} = \frac{1}{T}\left(- \frac{\partial q_j}{\partial x_j} + \sigma_{ij}\,\frac{\partial u_i}{\partial x_j}\right) + Q, \end{gather}$$
where  $u_i$, $i=1,2,3$, is the velocity component in the $i$th direction, $\rho$ is the density, $p$ is the pressure, $s=c_v\log (\,p\rho ^{-\gamma })$ is the entropy per unit mass, and $\gamma =c_p/c_v=1.4$ is the specific heat ratio. The components of the heat flux vector $q_j$ and of the viscous stress tensor $\sigma _{ij}$ are
 $$\begin{gather} \sigma_{ij}=\mu\left(\frac{\partial u_i}{\partial x_j} + \frac{\partial u_j}{\partial x_i} -\frac{2}{3}\,\frac{\partial u_k}{\partial x_k}\,\delta_{ij}\right), \end{gather}$$
 $$\begin{gather}q_j=-k\,\frac{\partial T}{\partial x_j}, \end{gather}$$
where the dependence of the viscosity coefficient on temperature is accounted for through Sutherland's law, and  $k=c_p\mu /\textit {Pr}$ is the thermal conductivity, with $\textit {Pr}=0.72$. Use of the entropy equation to replace the energy equations is here dictated from the possibility to relax the acoustic time step limitation with semi-implicit time stepping Modesti & Pirozzoli (Reference Modesti and Pirozzoli2018), thus yielding a computational efficiency comparable to a variable-property incompressible solver.
The forcing term  $f$ in (A1b) is evaluated at each time step in order to discretely enforce constant mass flow rate in time. Similarly, a uniform bulk heating/cooling term is added to the entropy equation to make the mixed mean temperature exactly constant in time. Since we solve for the entropy equation, this is achieved by correcting the local temperature at each grid point and each Runge–Kutta sub-step as follows:
 \begin{equation} T(x,y,z,t) \rightarrow T(x,y,z,t) - T_m(t) + T_m^*, \end{equation}
where  $T_m(t)$ is the mixed mean temperature before the correction, and $T_m^*$ is the target value. The updated temperature value is then used to re-evaluate the entropy at the current time.


 Open access

