


1. Introduction
Binary droplet collisions exhibit a wide range of outcomes, including bouncing, permanent coalescence and eventual breakup (Ashgriz & Poo Reference Ashgriz and Poo1990; Qian & Law Reference Qian and Law1997; Pan et al. Reference Pan, Tseng, Chen, Huang, Wang and Lai2016, Reference Pan, Huang, Hsieh and Lu2019). Understanding the underlying fluid physics of collision outcomes, and the transitions between them, is both of significant fundamental interest and tremendous practical importance. A canonical regime map showing the most common collision outcomes for equal-sized binary droplet collisions in terms of an impact parameter  ${B}=b/D_o$ (see figure 1a) and Weber number ${We} = \rho D_ou_r^{2}/\sigma$ is shown in figure 1(b). Here, $\rho$, $D_o$, $u_r$, $\sigma$ and $b$ are the density, initial droplet diameter, relative velocity, surface tension and dimensional offset between the droplets (as shown in figure 1a), respectively. In this work, we are primarily interested in the transition from coalescence (C) to stretching separation (SS), which occurs when two equal-size droplets collide at sufficient ${We}$ and ${B}$, as illustrated by the red dashed line in figure 1(b). In SS, the droplets temporarily coalesce and stretch by the non-interaction regions, before breaking up.

Figure 1. (a) Schematic of the geometry of a collision; the shaded regions indicate the non-interaction regions. (b) A typical regime map for binary droplet collisions, showing the most common collision outcomes. The C–SS transition (red dashed line) is of interest here (cf. figure 8); the C–reflexive separation (RS) transition (purple dotted line) is considered in § 3.4.
In many applications, such as nuclear reactors (Moretto et al. Reference Moretto, Tso, Colonna and Wozniak1992), spray drying (Tsapis et al. Reference Tsapis, Dufresne, Sinha, Riera, Hutchinson, Mahadevan and Weitz2005) and fuel sprays in combustion engines (Wang et al. Reference Wang, Fu, Kung and Law2005), uncontrolled collisions occur. Consequently, the particular collision outcome attained alters the droplet size distribution and hence affects the process performance. On the other hand, particular collision outcomes may be targeted, such as when studying chemical reaction kinetics (Lee et al. Reference Lee, Kim, Nam and Zare2015; Davis et al. Reference Davis, Jacobs, Houle and Wilson2017) and in encapsulation (Planchette, Lorenceau & Brenn Reference Planchette, Lorenceau and Brenn2010). In the former, temporary C (e.g. SS) is desired to ensure short mixing time for understanding intermediate states in reaction dynamics, whereas permanent C is generally required in the latter. Predicting the C–SS transition is therefore of both fundamental interest and practical importance.
Acquiring a complete description of the physics underpinning the C–SS transition is challenging owing to the various interconnected factors involved, including the offset distance, inertia and capillary and viscous forces. Different conditions, captured by  ${B}$, ${We}$ and the Ohnesorge number ( ${Oh}=\mu /\sqrt {\rho \sigma D_o}$), can lead to different stretching dynamics, see the two extremes in figure 2(a,b): high impact ${We}$ of low ${Oh}$ droplets (high deformability) and low impact ${We}$ of high ${Oh}$ droplets (low deformability), respectively. The highly deformable collision shows significant flattening and rim development (see $t = 0.87$ ms), whereas the slightly deformable case maintains an almost cylindrical shape.

Figure 2. (a) Highly deformable SS, with  ${We}=90$, ${Oh}=0.02$ and ${B}=0.37$. (b) Slightly deformable SS, with ${We}=40$, ${Oh}=0.16$ and ${B}=0.51$. Both cases in (a) and (b) capture the onset of SS.
Although the C–SS transition has been reported since the 1960s (e.g. Gunn Reference Gunn1965), the lack of comprehensive experimental measurements characterising the dynamics at this transition is a significant limitation of the literature. Previous studies have focused on experimentally defining the C–SS transition for nearly inviscid droplets (water) and providing phenomenological models by balancing inertia with the resisting capillary forces. However, the criterion of separation in this balance has always been a matter of debate with different authors and groups proposing different subjective criteria. Park (Reference Park1970) suggested a criterion, which assumes that separation occurs only if the angular momentum exceeds the surface tension in the regions of the interaction. Brazier-Smith, Jennings & Latham (Reference Brazier-Smith, Jennings and Latham1972) suggested a different criterion, which states that separation occurs only if the rotational energy is greater than the additional surface energy required to reform the initial droplets from the coalesced droplet. Another criterion was suggested by Arkhipov, Vasenin & Trofimov (Reference Arkhipov, Vasenin and Trofimov1983), which hypothesises that separation occurs only if the rotational energy, based on the angular velocity and the moment of inertia, is greater than the surface energy of the regions of non-interaction. Ashgriz & Poo (Reference Ashgriz and Poo1990) argued that the criteria of these models, which are based on the comparison of the rotational energy with surface energy, are not experimentally observed since separation happens before the development of any significant rotation. Therefore, Ashgriz & Poo (Reference Ashgriz and Poo1990) proposed a new criterion, which states that separation occurs only if the effective kinetic energy exceeds the surface energy in the regions of interaction. The effective kinetic energy is defined by the kinetic energy of the non-interaction regions in addition to that obtained from the regions of interactions using only the component of the drop velocities in the separating direction. Ashgriz & Poo (Reference Ashgriz and Poo1990) showed that their model performs better than the other models. Evidently, there is a need for an experimentally set criterion for the C–SS transition.
Since the 1990s (e.g. Jiang, Umemura & Law Reference Jiang, Umemura and Law1992), the focus of the literature has shifted to the role of viscosity. In particular, it has been reported that, for a given  ${We}$, increasing the droplet viscosity (i.e. ${Oh}$) shifts the C–SS transition to higher impact parameters (e.g. Jiang et al. Reference Jiang, Umemura and Law1992; Gotaas et al. Reference Gotaas, Havelka, Jakobsen, Svendsen, Hase, Roth and Weigand2007b; Planchette, Lorenceau & Brenn Reference Planchette, Lorenceau and Brenn2012; Kuschel & Sommerfeld Reference Kuschel and Sommerfeld2013; Sommerfeld & Kuschel Reference Sommerfeld and Kuschel2016), that is, the red dashed line in figure 1(b) translates upwards. Some studies have developed viscous models to predict the C–SS transition by balancing inertial forces with the resisting capillary and viscous forces (Jiang et al. Reference Jiang, Umemura and Law1992; Pan et al. Reference Pan, Huang, Hsieh and Lu2019; Suo & Jia Reference Suo and Jia2020). However, the viscous forces have always been treated by adjustable parameters subject to arbitrary choices, while the inertial and the regions of resistant capillary forces continued to be subjectively specified without consideration of the difference in the intermediate geometries that might arise from different combinations of ${We}$, ${B}$ and ${Oh}$, as seen in the second and third columns of figure 2.
In this paper, we uncover unique behaviours of the C–SS transition via extensive experimental measurements. Prominently, we show that this transition is inertial for a wide range of  ${Oh}$, where viscosity has no effect. Remarkably, a viscous effect exists for ${Oh}$ values above the inertial range that we have identified. We also observe that SS occurs only if the stretched droplets reach a particular non-dimensional critical length, regardless of ${We}$, ${Oh}$ and ${B}$. We use this experimentally observed critical length to propose a simple but robust model for the C–SS transition, in which all numerical parameters are directly specified by readily obtainable experimental data (i.e. the model does not contain any arbitrarily chosen free parameters). The proposed model is shown to be consistent with both our experiments and previous experimental data for various fluids sourced from the literature.
2. Experimental method
Our experimental set-up and methodology are described in detail by Al-Dirawi & Bayly (Reference Al-Dirawi and Bayly2019, Reference Al-Dirawi and Bayly2020). Briefly, fluid was driven through custom-made monodisperse (110, 160 and 210  $\mathrm {\mu }$m) nozzles to create a continuous jet; square-wave signals applied to piezos built into the nozzle caused the jet to breakup into a stream of equal-sized droplets. Two streams were created, which intersected at a tunable angle (enabling a varying ${We}$) to engender equal-size binary droplet collisions. The collisions were imaged in two perpendicular vertical planes, as seen in figure 3. The nozzles were mounted on translation stages, which were adjusted to ensure that the droplets collided at the plane imaged by the front-view high-speed camera; alignment was ensured by strobe imaging using a standard CCD USB camera (labelled ‘camera’ in figure 3). The collision dynamics were recorded using a Photron AX200 high-speed camera at 30 000 f.p.s., with a resolution in the range from 13 to 20 $\mathrm {\mu }$m px $^{-1}$ and a field of view of $256 \times 384$ pixels.

Figure 3. A sketch of our experimental set-up.
The fluids studied were deionised water, an 83 % aqueous Glycerol solution and several aqueous solutions of hydroxypropyl methylcellulose (HPMC), with mass concentrations of 2 % to 8 %. For these fluids,  $\mu \in [1,85]$ mPa s and $\sigma \in [46, 72]$ mN m $^{-1}$, with $D_o \in [200,600]$ $\mathrm {\mu }$m and ${Oh} \in [0.005,0.475]$ in our experiments. Solutions of HPMC show Newtonian rheology within the range of mass concentrations used in this work. The experiments cover wide ranges of ${We} \in [20,140]$ and ${B} \in [0,1]$. The offset ${B}$ was varied by applying a frequency shift between the two streams of droplets, as explained by Gotaas et al. (Reference Gotaas, Havelka, Jakobsen and Svendsen2007a).
3. Results
3.1. Collision dynamics
For collisions below the critical impact parameter for SS ( ${B}_c$), the stretched-droplet system deforms to a maximum length ( ${L_{max}}$) when all its kinetic energy has been converted into surface energy and viscous loss, before retracting, see the second and third columns in figure 4; quantitative measurements showing retraction are provided (see supplementary material available at https://doi.org/10.1017/jfm.2021.674). Note that the first column in figure 4 is an example of RS, which occurs for much lower impact parameters than SS, as seen in figure 1(b). Indeed, given sufficiently large impact parameters (i.e. ${B} \geq {B}_c$), the non-interaction regions (see figure 1a) are large enough that the stretching energy (mainly the kinetic energy of the non-interaction regions) leads to SS, as seen in the last column of figure 4 (Ashgriz & Poo Reference Ashgriz and Poo1990; Pan et al. Reference Pan, Huang, Hsieh and Lu2019).

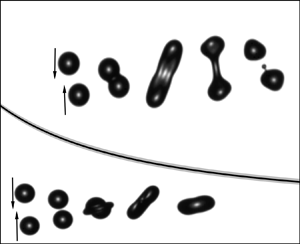
Figure 4. Dynamics of 2 % HPMC ( ${Oh} = 0.021$) droplet collisions at ${We} = 56$ for different impact parameters ${B}$, from head-on collision exhibiting RS (first column), through C (second and third columns), to the onset of SS (fourth column). The latter transition (between the second/third and fourth columns) is of primary interest here.
3.2. Critical length for SS
For  ${B} > {B}_c$, SS is achieved by a pinching process that becomes significant after the stretched-droplet system realises its maximum length ( ${L_{max,c}}$), see the last column of figure 4 at $t \geq 0.54$ ms. The dynamics after maximum stretching is similar to those of ligament breakup. In cylindrical ligaments, breakup or retraction to equilibrium depends on the aspect ratio, the critical value of which depends in turn on ${Oh}$ (Castrejón-Pita, Castrejón-Pita & Hutchings Reference Castrejón-Pita, Castrejón-Pita and Hutchings2012). Similarly, a transition between C and SS is expected if the system, at the maximum stretching, achieves a certain critical aspect ratio. Owing to the collision dynamics, the stretched droplet is not quite cylindrical at the instant of ${L_{max,c}}$, so a normalised critical length ( $\tilde {L}_{max,c} = {L_{max,c}}/D_o$) is used here in place of the aspect ratio. Remarkably, our experiments for all ${Oh} \in [0.005,0.475]$ and ${We} \in [20,140]$ investigated reveal that $\tilde {L}_{max,c} \approx 3.35$, regardless of ${B}_c$, as shown in figure 5. Note that recent numerical work has suggested that this normalised critical length is a function of the Weber number, which was empirically determined (by fitting) to be $\tilde {L}_{max,c} = 3 + 0.006{We}$ (Saroka & Ashgriz Reference Saroka and Ashgriz2015). This fit was based on relatively narrow range of data, for ${Oh}<6.7\times 10^{-3}$, ${We} \in [20,50]$ and ${B} \in [0.95,0.5]$. It is also plotted (red dashed line) in figure 5, from which it can be seen to be inconsistent with our experimental data (note the error bar displayed), especially at high ${We}$ values.

Figure 5. Critical maximum length leading to separation in terms of  ${We}$ and ${Oh}$, for various ${B}_c \in [0.55,0.3]$. The error bar represents the propagation of the measurement uncertainty arising from the resolution (note that all points have the same order of error). The fit of Saroka & Ashgriz (Reference Saroka and Ashgriz2015), $\tilde {L}_{max,c} = 3 + 0.006{We}$, is included for comparison.
It is interesting to compare our constant critical length for SS with critical aspect ratios of liquid ligaments reported in the literature. To allow for this comparison, an aspect ratio equivalent to our critical length needs to be determined. Based on volume conservation for a cylinder with  $\tilde {L}_{max,c} = 3.35$, we calculated our equivalent aspect ratio as 5.13. However, reported critical aspect ratios of cylindrical ligaments within the range of ${Oh}$ investigated in this work are of the order of 20 (figure 5 in Castrejón-Pita et al. Reference Castrejón-Pita, Castrejón-Pita and Hutchings2012). This significant difference may be attributable to the initial shape of the collision-generated ligament (at maximum deformation), which has an initial contraction resulting from the geometry of the off-centred collision, see the arrows in the last column of figure 4 at $t = 0.54$ ms. Planchette et al. (Reference Planchette, Hinterbichler, Liu, Bothe and Brenn2017) reported a significantly smaller critical aspect ratio of approximately 3 for cylindrical ligaments with ${Oh} \leq 0.1$, resulting from the RS of droplets colliding head-on (first column of figure 4). This small aspect ratio may be due to the presence of a reflexive flow induced by the retraction of a rimmed-lamellar disk, which assists the pinch-off at the centre and delays the retraction of the ends of the formed cylinder. Note that comparisons with aspect ratios of liquid column breakup owing to the Rayleigh instability, which suggest a critical aspect ratio equal to ${\rm \pi}$ (Rayleigh Reference Rayleigh1878), and of the linear instability of liquid threads being pinched from a nozzle (Henderson et al. Reference Henderson, Segur, Smolka and Wadati2000; Dong, Carr & Morris Reference Dong, Carr and Morris2006), are not appropriate owing to the different geometries involved. In the former, there are no rounded ends that lead to retraction; in the latter, there is only one rounded end that leads to retraction of the thread. The comparisons made here reveal that SS shows a unique equivalent critical aspect ratio.
3.3. Model for the C–SS transition
The normalised critical length,  $\tilde {L}_{max,c}$, can be used as a criterion to predict the C–SS transition ${B}_c ({We},{Oh})$, given that obtaining $\tilde {L}_{max} ({B},{We},{Oh})$ is feasible. Figure 6(a) presents $\tilde {L}_{max}$ as a function of ${B}$ for various combinations of ${We}$ and ${Oh}$. Remarkably, for all cases regardless of ${We}$ and ${Oh}$, two distinct behaviours are seen for $\tilde {L}_{max}$, depending on ${B}$: (I) $\tilde {L}_{max}$ remains constant for ${B} \leq 0.2$ with a value equal to $\tilde {L}_{max} \vert _{B = 0}$; and (II) a region of linear proportionality for ${B} > 0.2$ and slightly greater than ${B}_c$. Given these two behaviours, we can write $\tilde {L}_{max}\vert _{B>0.2} = a + s{B}$, where $a = \tilde {L}_{max}\vert _{B=0} - 0.2s$; $a$ and $s$ are the intercept and the slope of the linear fits in region II, respectively. At ${B} = {B}_c$, $\tilde {L}_{max}\vert _{B>0} = \tilde {L}_{max,c} \approx 3.35$. Therefore, the C–SS transition is given by
 \begin{equation} {B}_c = \frac{3.35 - \tilde{L}_{max}\vert_{B=0} + 0.2s}{s}. \end{equation}
However, as can be seen from figure 6(a), the values of  $\tilde {L}_{max}\vert _{B=0}$ and $s$ depend on ${We}$ and ${Oh}$. Thus, in order to use (3.1) for predicting the C–SS transition as a function of ${We}$ and ${Oh}$, $\tilde {L}_{max}\vert _{B=0}$ and $s$ need to be quantified as a function of ${We}$ and ${Oh}$.

Figure 6. (a) Influence of the impact parameter,  ${B}$ on the maximum length that the coalesced droplets attain, for a wide range of ${We}$ and ${Oh}$ (solid symbols, C, and hollow, SS). (b) The change in slope of $\tilde {L}_{max}(B)$ with ${We}$ for ${B}>0.2$ up to the threshold of SS, for a wide range of ${Oh}$.
Quantifying  $\tilde {L}_{max}\vert _{B = 0}$ as a function of ${We}$ and ${Oh}$ can be achieved via an energy balance in the compression phase, between the instant of collision and the instant of maximum deformation ( $t = 0.27$ ms in the first column of figure 4). The energy balance is accomplished assuming a pancake shape at the maximum deformation for head-on collisions with a diameter equal to $\tilde {L}_{max}\vert _{B = 0}$ (as proposed by Willis & Orme Reference Willis and Orme2003). Hence, $\tilde {L}_{max}\vert _{B = 0}$ is given by
 \begin{equation} \tilde{L}_{max}\vert_{B = 0} = \sqrt{\frac{(1-\alpha){We} + 48}{12 \left( 1 + \dfrac{8}{3\tilde{L}^{3}_{max} \vert_{B = 0}} \right)}}. \end{equation}
Here,  $\alpha$ is the ratio of the viscously lost energy in the compression phase to the initial kinetic energy. This ratio was evaluated using experimental measurements in an energy balance by Planchette et al. (Reference Planchette, Hinterbichler, Liu, Bothe and Brenn2017). Based on their extensive experimental measurements, and confirmed by measurements in this work, there are three regimes for $\alpha$ depending on ${Oh}$, as shown in figure 7. At ${Oh}\lessapprox 0.02$, $\alpha$ generally increases with ${Oh}$ from 0.50 to $0.65 \pm 0.05$. For ${Oh} \in [0.02,0.14]$, $\alpha$ remains constant at $0.65 \pm 0.05$, therefore exhibiting ‘inertial behaviour’ (independent of viscosity). For ${Oh} > 0.14$, the value of $\alpha$ varies greatly, but is generally above 0.65. This behaviour of $\alpha$ is confirmed by our experiments. Further technical details (including the derivations of (3.2)) are provided as supplementary material.

Figure 7. The measured ratio of viscous loss, in the compression phase at  ${B}=0$, to the initial kinetic energy for a wide range of ${Oh}$.
Regarding quantifying  $s$ as a function of ${We}$ and ${Oh}$, figure 6(b) shows $s$ versus ${We}$ for a wide range of ${Oh}$. The slope linearly increases with ${We}$, while ${Oh}$ has a negligible effect, given that all data collapse on to a single line. Therefore, for any combination of ${We}$ and ${Oh}$, $s$ can be described using a linear fit to the data in figure 6(b),
 \begin{equation} s = 0.049{We} + 2.58. \end{equation}
Estimating  $\tilde {L}_{max}\vert _{B = 0}({We},{Oh})$ from (3.2), and using (3.3) enables the C–SS transition to be determined from (3.1), yielding a model that depends only on ${Oh}$ via $\alpha$. As the latter is constant ( $\alpha =0.65 \pm 0.05$) for an order-of-magnitude-wide range of ${Oh}$, from 0.02 to 0.14, the model suggests that SS shows pure inertial behaviour within this wide range of ${Oh}$. Therefore, the C–SS transition is fixed over this range of ${Oh}$. It is important to appreciate that all numerical values in the proposed model are not subject to arbitrary choices, but are instead directly specified by the experimental data, via relatively simple measurements. In particular, the model contains no arbitrarily chosen free fitting parameters.
Figure 8 shows all the available experimental data, both from our experiments and the literature, in terms of  ${We}$. As seen, all data within the inertial range collapse on to the transition predicted by the model using $\alpha =0.65$. It should be noted that this fixed transition is slightly higher in terms of ${B}$ than the transition of near-inviscid (e.g. water) droplets, as can be seen in the inset figure. However, when using the appropriate value of $\alpha$ for water (which is 0.5, as specified by figure 7), the model is still able to accurately predict the near-inviscid C–SS transition. Here, it is important to mention that the frequently used model of Ashgriz & Poo (Reference Ashgriz and Poo1990) fails to accurately predict the transition for water as it underestimates ${B}_c$, as shown in the inset figure. This underestimation was also noted in numerical work by the original author in Saroka & Ashgriz (Reference Saroka and Ashgriz2015). Overall, the small difference between the transition of water and the fixed (inertial) transition of $\alpha =0.65$ might indicate an inertial transition for a wider range of ${Oh}\in [0.006, 0.140]$.

Figure 8. The C–SS transition, demonstrating the inertial behaviour for a wide range of  ${Oh}$. The inset image shows the C–SS transition for ${Oh}$ higher and lower than the inertial range. The red Oh scale represents the inertial range ( $\alpha = 0.65$). The performance of the model (3.1) is also shown in both figures. The black line represents the model with $\alpha = 0.65$, while the red shaded region around it represents the scattering of $\pm 0.05$ in the plateau of $\alpha ({Oh})$. The error bars represent the uncertainty of the transition location.
For collisions of droplets with  ${Oh}>0.14$, the transition moves towards higher impact parameters, consistent with the behaviour reported in the literature (Gotaas et al. Reference Gotaas, Havelka, Jakobsen, Svendsen, Hase, Roth and Weigand2007b; Kuschel & Sommerfeld Reference Kuschel and Sommerfeld2013; Sommerfeld & Kuschel Reference Sommerfeld and Kuschel2016). For example, the data for 8 % HPMC ( ${Oh} = 0.214$) shows a higher transition than observed for the inertial case. Using the data of Sommerfeld & Pasternak (Reference Sommerfeld and Pasternak2019), sunflower oil ( ${Oh} = 0.475$) produces an even higher boundary in terms of ${B}$, as seen inset in figure 8. Note that the proposed model remains valid for ${Oh}>0.14$ when an appropriate $\alpha$ is used. For example, using $\alpha =0.85$ for 8 % HPMC and $\alpha = 0.97$ for sunflower oil (not reported in Sommerfeld & Pasternak Reference Sommerfeld and Pasternak2019) show excellent agreement. Here, $\alpha =0.97$ for sunflower oil was measured from experiments that were designed to match the relevant ${Oh}=0.475$, using 450 $\mathrm {\mu }$m droplets of an 83 % aqueous Glycerol solution.
3.4. Comparison with the role of  ${Oh}$ in RS

Using our findings, we can also shed light on the different roles that  ${Oh}$ plays in SS and RS. The role of ${Oh}$ in the latter has been investigated in depth by many authors (e.g. Qian & Law Reference Qian and Law1997; Roisman Reference Roisman2004; Roisman et al. Reference Roisman, Planchette, Lorenceau and Brenn2012; Planchette et al. Reference Planchette, Hinterbichler, Liu, Bothe and Brenn2017). Although purely inertial behaviour is seen in the compression phase of head-on collisions (Planchette et al. Reference Planchette, Hinterbichler, Liu, Bothe and Brenn2017), increasing ${Oh}$ within this inertial range shifts the RS regime to significantly higher ${We}$ (from 30 to 190, figure 2 in Huang, Pan & Josserand Reference Huang, Pan and Josserand2019). As noted above, such a shift is not seen for the C–SS transition. The difference between these two behaviours can be attributed to viscous loss in the relaxation phase of RS (as the rimmed-lamellar disk retracts and the cylinder forms – see the first column in figure 4, when $t > 0.27$ ms), which is not present in SS. The viscous loss increases with ${Oh}$ and contributes to the total viscous losses that affect the collision outcome (Planchette et al. Reference Planchette, Hinterbichler, Liu, Bothe and Brenn2017).
4. Conclusions
In this work, we have comprehensively demonstrated the effect of Ohnesorge number on the C–SS transition in binary droplet collisions. Although the literature indicates that increasing viscosity shifts the C–SS transition toward higher Weber numbers, both our experimental and analytical results conclusively show that the C–SS transition is actually inertial for an order-of-magnitude-wide  ${Oh}$ range. Surprisingly, a viscous effect exists for ${Oh}$ values both above and below the inertial range identified in this work. We also showed that SS only occurs if the stretched droplets exceed a certain critical dimensionless length (3.35), which enabled the development of a simple but robust model to capture the C–SS transition. The proposed model contains no arbitrarily chosen free parameters; all numerical parameters have been directly specified by readily obtainable experimental data, which is consistent with both our own experiments and existing experimental data found in the literature. Whilst this work is restricted to equal-sized droplet collisions, the effect of size ratio and the three-dimensional evolution on the dynamics would be compelling future work, with the latter potentially enabling an improved mechanistic understanding of our observations to be derived. Nevertheless, our findings have important consequences for applications that rely on targeted collision outcomes, including emulsion fabrication, the dropwise study of chemical reactions and (bio)material printing. Moreover, they are of fundamental importance to other industrial applications such as spray drying, inhaler design, painting, combustion engines, coating and nuclear operations.
Supplementary data
Supplementary material is available at https://doi.org/10.1017/jfm.2021.674.
Funding
This work was supported by the EPSRC project ‘Evaporative Drying of Droplets and the Formation of Micro-structured and Functional Particles and Films’ (grant no. EP/N025245/1), a Royal Society Enhancement Award (grant no. RGF $\backslash $EA $\backslash $181002), the University of Leeds and the EPSRC Centre for Doctoral Training in Fluid Dynamics at the University of Leeds (grant no. EP/L01615X/1).
Declaration of interests
The authors report no conflict of interest.


 Open access