


1. Introduction
Multiphase flow in porous media occurs in a wide variety of natural and engineered settings, including carbon geosequestration, geoenergy resources recovery, subsurface contaminant control, drug delivery and flow in fuel cells (Berg et al. Reference Berg2013; Pak et al. Reference Pak, Butler, Geiger, van Dijke and Sorbie2015; Reynolds & Krevor Reference Reynolds and Krevor2015; Blunt Reference Blunt2017; Zhao et al. Reference Zhao, Pahlavan, Cueto-Felgueroso and Juanes2018; Iglauer et al. Reference Iglauer, Paluszny, Rahman, Zhang, Wülling and Lebedev2019; Zhang et al. Reference Zhang, Lebedev, Jing, Yu and Iglauer2019; Zhao et al. Reference Zhao2019; Gjennestad, Winkler & Hansen Reference Gjennestad, Winkler and Hansen2020; Gao et al. Reference Gao, Raeini, Blunt and Bijeljic2021; Zhang et al. Reference Zhang, Bijeljic, Gao, Lin and Blunt2021). For the last 85 years, multiphase flow has been quantified assuming that each fluid phase has its own pathway and the flow rate has a linear relationship with pressure gradient, governed by an empirical extension of Darcy's law (Muskat & Meres Reference Muskat and Meres1936; Muskat Reference Muskat1938; Blunt Reference Blunt2017),
 \begin{equation} q_{i}={-}\frac{k_{ri}K}{ \mu _{i}} (\boldsymbol{\nabla} P_{i}- \rho _{i}g) , \end{equation}
where  $q_{i}$ is the Darcy flux, defined as the volume of phase $i$ flowing per unit area per unit time, $K$ is the absolute permeability of the sample, $k_{ri}$ is the relative permeability, $\mu _{i}$ is the viscosity, $\boldsymbol {\nabla } P_{i}$ is the pressure gradient for phase $i$ and $\rho _{i}g$ is the contribution of gravity, which is ignored in this study.
The capillary number  $Ca$ is defined as $Ca = \mu q_t / \sigma$, where $\mu$ is the average viscosity of the two fluids, $q_t$ is the total Darcy flux of the two phases and $\sigma$ is the interfacial tension. It is well known that $Ca$ has a linear relationship with pressure gradient $\boldsymbol {\nabla } P$ at low flow rate, $\boldsymbol {\nabla } P \sim Ca$ (Blunt Reference Blunt2017; Gao et al. Reference Gao, Lin, Bijeljic and Blunt2020; Zhang et al. Reference Zhang, Bijeljic, Gao, Lin and Blunt2021).
Recent research has shown that there is nonlinear flow even at low capillary numbers where the capillary force is still dominant at the pore scale (Rassi, Codd & Seymour Reference Rassi, Codd and Seymour2011; Sinha & Hansen Reference Sinha and Hansen2012; Armstrong & Berg Reference Armstrong and Berg2013; Rücker et al. Reference Rücker2015; Gao et al. Reference Gao, Lin, Bijeljic and Blunt2020). We observe a so-called intermittent regime with  $\boldsymbol {\nabla } P \sim Ca^{a}$, $1 > a > 0$: the pressure gradient has a power-law relation with flow rate. At the pore scale, some regions of the void space, which provide additional connectivity, are intermittently occupied by both phases, as confirmed through high-resolution X-ray imaging and confocal microscopy (Datta, Dupin & Weitz Reference Datta, Dupin and Weitz2014; Gao et al. Reference Gao, Lin, Bijeljic and Blunt2017; Reynolds et al. Reference Reynolds, Menke, Andrew, Blunt and Krevor2017; Spurin et al. Reference Spurin, Bultreys, Bijeljic, Blunt and Krevor2019a, Reference Spurin, Bultreys, Bijeljic, Blunt and Krevorb; Gao et al. Reference Gao, Lin, Bijeljic and Blunt2020). This phenomenon is associated with non-thermal and non-periodic fluctuations in pressure and fluid occupancy representing a nonlinear disordered dynamics (Rücker et al. Reference Rücker, Georgiadis, Armstrong, Ott, Brussee, van der Linde, Simon, Enzmann, Kersten and Berg2021). Tallakstad et al. (Reference Tallakstad, Knudsen, Ramstad, Løvoll, Måløy, Toussaint and Flekkøy2009) was the first to observe this behaviour and suggested that $a \approx 0.5$ from two-phase flow experiments in a quasi-two-dimensional porous medium. Sinha et al. (Reference Sinha, Bender, Danczyk, Keepseagle, Prather, Bray, Thrane, Seymour, Codd and Hansen2017) also proposed $a = 0.5$ through an analysis of experiments and simulations. Gao et al. (Reference Gao, Lin, Bijeljic and Blunt2020) found a threshold capillary number for the onset of intermittency $Ca^{i}$ of approximately $10^{-5}$ in two-phase steady-state flow tests on a water-wet (hydrophilic) sandstone sample with a water fractional flow (ratio of the volumetric flow rate of water to the total flow rate of oil and water) $f_{w} = 0.5$, where the exponent $a$ was approximately 0.6. Recently, Zhang et al. (Reference Zhang, Bijeljic, Gao, Lin and Blunt2021) quantified the onset of intermittency as a function of fractional flow for fluids with different viscosity ratio and different rock types. To date, however, only two studies have investigated non-hydrophilic media, which have suggested that there may be more intermittency under these conditions (Zou et al. Reference Zou, Armstrong, Arns, Arns and Hussain2018; Rücker et al. Reference Rücker2019).
In many natural and engineered settings, including soils containing organic material, gas diffusion layers in fuel cells, surgical masks and rock that has been in contact with hydrocarbons, the solid surfaces of the porous material are not uniformly hydrophilic. It is more common to encounter a range of local contact angles, both above and below  $90^{\circ }$, representing a mixed-wet state (AlRatrout, Blunt & Bijeljic Reference AlRatrout, Blunt and Bijeljic2018). However, there have been no quantitative studies of the onset of intermittency under these conditions.
In this paper, we conduct 174 steady-state immiscible two-phase flow experiments through an altered-wettability Bentheimer sandstone sample with different water fractional flows ( $f_{w} = 0.2$, 0.4, 0.5, 0.6, 0.7 and 0.8), where the capillary number varies from ${\sim }10^{-7}$ to ${\sim }10^{-4}$ during a waterflood displacement. We label the sample ‘hydrophobic’, although the pore surfaces locally have a range of contact angle with both hydrophilic and hydrophobic regions (Lin et al. Reference Lin, Bijeljic, Berg, Pini, Blunt and Krevor2019). We also performed high-resolution pore-scale imaging on a replicate sample for 14 flow rates and fractional flows covering both the linear and intermittent flow regimes. We use energy balance to predict accurately the boundary of the onset of intermittency, which is consistent with our experimental results and in situ pore-scale X-ray images.
2. Materials and methods
We studied two Bentheimer sandstone samples (samples A and B, drilled from the same block). First, the samples were completely saturated with brine. The absolute permeability of the samples was measured during single-phase brine flow to be  $K = 1.85\,(\pm 0.02) \times 10^{-12}\ {\rm m}^{2}$ (Zhang et al. Reference Zhang, Bijeljic, Gao, Lin and Blunt2021). Then, crude oil from the Middle East was injected and the samples were left in the crude oil for two months at $80\,^\circ {\rm C}$ and 3 MPa pressure. Direct contact of the crude oil with parts of the solid surface altered the wettability from water-wet to a more mixed-wet to oil-wet state, which we will call, for convenience, ‘hydrophobic’ (Lin et al. Reference Lin, Bijeljic, Berg, Pini, Blunt and Krevor2019, Reference Lin, Bijeljic, Foroughi, Berg and Blunt2021). Decane was injected at $3~{\rm ml}~{\rm min}^{-1}$ for 60 min to replace the crude oil. Sample A (5.97 mm diameter and 27.88 mm length) was mounted in a specially designed flooding system (Gao et al. Reference Gao, Lin, Bijeljic and Blunt2017, Reference Gao, Lin, Bijeljic and Blunt2020). The water (brine) phase was 15 wt% KI (potassium iodide) brine, and the oil phase was $n$-decane, both injected by high-precision ISCO pumps through a dual injection port (Zhang et al. Reference Zhang, Bijeljic, Gao, Lin and Blunt2021). The measured viscosity of the brine was 0.821 mPa s, the $n$-decane viscosity was 0.838 mPa s (PubChem, Open Chemistry database), while the interfacial tension was measured to be $\sigma = 47~{\rm mN}~{\rm m}^{-1}$.
During the experiments, a high-precision pressure transducer (Keller PD-33) recorded the pressure difference between the inlet and outlet of the sample. Similar to the experimental protocol in Zhang et al. (Reference Zhang, Bijeljic, Gao, Lin and Blunt2021), we started the two-phase flow experiment from a low water fractional flow and low flow rate:  $f_w$ of 0.2 at $0.02~{\rm ml}~{\rm min}^{-1}$ total flow rate ( $Ca = 2.1 \times 10^{-7}$). The pressure gradient was recorded after 12 h when it stabilized, and then the flow rate increased from low to high and the pressure gradients at steady state were recorded. A total of 29 flow rates were considered for each $f_w$: the highest flow rate was $4.5~{\rm ml}~{\rm min}^{-1}$ ( $Ca = 4.8 \times 10^{-5}$). Note that the time for the pressure gradient to stabilize depended on the flow rate: it took up to 12 h for the low flow rate ( $0.02~{\rm ml}~{\rm min}^{-1}$), while as little as 5 min for the highest rates (greater than $3~{\rm ml}~{\rm min}^{-1}$). The $n$-decane was injected at $3~{\rm ml}~{\rm min}^{-1}$ for 30 min again to return to the initial saturation after each sequence of experiments at the same fractional flow. We repeated this injection sequence for other fractional flows: 0.4, 0.5, 0.6, 0.7, and 0.8; in total 174 flow experiments were conducted.
For sample B (6.15 mm diameter and 50.13 mm length), we have followed the same experimental protocol as for sample A but replaced the water phase with 30 wt% KI brine for a better X-ray contrast; the viscosity of the brine was measured as 0.819 mPa s (Gao et al. Reference Gao, Raeini, Blunt and Bijeljic2019). The flooding system was placed in a Zeiss XRM-510 X-ray microscope for high-resolution in situ imaging (Zhang et al. Reference Zhang, Lebedev, Sarmadivaleh, Barifcani and Iglauer2016; Lebedev et al. Reference Lebedev, Zhang, Sarmadivaleh, Barifcani, Al-Khdheeawi and Iglauer2017; Gao et al. Reference Gao, Raeini, Blunt and Bijeljic2019; Lin et al. Reference Lin, Bijeljic, Berg, Pini, Blunt and Krevor2019). The scan setting was  $3.58~\mathrm {\mu }{\rm m}$ voxel size, 0.5 s exposure time, 75 kV X-ray energy and 1601 projections with a flat panel detector. The scan time was around 1 h. We selected and repeated 14 test points: 0.1, 0.2 and 0.8 ${\rm ml}~{\rm min}^{-1}$ flow rates for $f_w = 0.2$; 0.1, 0.2, 0.8 and 1.25 ${\rm ml}~{\rm min}^{-1}$ flow rates for $f_w = 0.5$; 0.1, 0.2, 0.8 and 1.25 ${\rm ml}~{\rm min}^{-1}$ flow rates for $f_w = 0.7$; and 0.1, 0.2 and 0.8 ${\rm ml}~{\rm min}^{-1}$ flow rates for $f_w = 0.8$.
3. Results
The results, for all water fractional flows  $f_{w}$, clearly show a transition from a linear $a = 1$ to a nonlinear regime $a < 1$ when the capillary number increases (figure 1). We found that the exponent $a$ and threshold capillary number $Ca^{i}$ are both functions of the fractional flow (see table 1). The lowest value $a = 0.50 \pm 0.01$ occurs when $f_{w} = 0.4$, indicating the strongest intermittency, defined as the deviation from a linear Darcy law; $f_{w} = 0.8$ had the highest exponent $a = 0.58 \pm 0.01$, indicating weaker intermittency. The range of $a$ is smaller when compared with similar experiments on a water-wet sample, where $a$ varied from 0.44 to 0.74 (Zhang et al. Reference Zhang, Bijeljic, Gao, Lin and Blunt2021). Moreover, the lower fractional flows have smaller threshold capillary numbers $Ca^{i}$ for the onset of intermittency: $Ca^{i}$ increased from $10^{-5.7}$ to $10^{-5.1}$ as the water fractional flow $f_{w}$ increased from 0.2 to 0.8; this is the opposite trend to the water-wet results.

Figure 1. Summary of the measured pressure gradient  $\boldsymbol {\nabla } P$ as a function of capillary number $Ca$, for different water fractional flows $f_{w}$: 0.2, 0.4, 0.5, 0.6, 0.7 and 0.8.
Table 1. Summary of the exponent  $a$ for $\boldsymbol {\nabla } P \sim Ca^{a}$, threshold capillary number $Ca^{i}$ for the onset of intermittency, and the associated oil-phase capillary number $Ca_{1}^{i}$ and water-phase capillary number $Ca_{2}^{i}$, from figure 1.

In the high-resolution images (figure 2), it is evident that large pores are occupied by water, as expected for media that are no longer water-wet (Gao et al. Reference Gao, Lin, Bijeljic and Blunt2020). We used an automated method to calculate contact angles directly on the images at the three-phase (oil–water–solid) contact line (AlRatrout et al. Reference AlRatrout, Raeini, Bijeljic and Blunt2017) for  $f_{w} = 0.5$, $0.1~{\rm ml}~{\rm min}^{-1}$ injection rate, $Ca = 10^{-6}$. The average contact angle is $103^{\circ }$, with a standard deviation of $22^{\circ }$, representing, on average, a hydrophobic medium (mixed-wet or oil-wet) (Lin et al. Reference Lin, Bijeljic, Berg, Pini, Blunt and Krevor2019). However, the sample is not uniformly hydrophobic: locally, there are contact angles both less than $90^{\circ }$ (hydrophilic) and greater than $90^{\circ }$ (hydrophobic).

Figure 2. Example two-dimensional cross-sections of three-dimensional images showing phase configurations in the same area of the rock sample at the same flow rate ( $0.2~{\rm ml}~{\rm min}^{-1}$) but different water fractional flows: $f_{w} = 0.2$ (a,b) and 0.8 (c,d). The capillary number is $10^{-5.7}$. (a) and (c) are greyscale images, and (b) and (d) are segmented images, where blue is water, red is oil and yellow represents intermittent regions that were periodically occupied by both oil and water during the 1 h scan time.
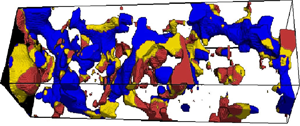
At the pore scale, it has been shown, in uniformly water-wet systems, that the nonlinear flow behaviour is caused by intermittent filling of regions of the pore space alternately by both phases; the oil and water no longer travel through fixed flow pathways and become quasi steady-state (Gao et al. Reference Gao, Lin, Bijeljic and Blunt2020). We use our images to quantify regions of the pore space that are always occupied by oil during the scan time of 1 h, always occupied by water, and intermittent regions, identified by intermediate greyscale values, which are occupied by both oil and water during the scan time. As an example, figure 2 shows that there is more intermittency for the lower water fractional flows, consistent with the threshold capillary numbers and exponents listed in table 1. figure 3 demonstrates how the degree of intermittency increases with flow rate. In the Darcy regime, the volume of any intermittent regions is negligible and the two phases flow through fixed flow pathways. In the intermittent regime, a significant fraction of the pore space is periodically occupied by both phases, facilitating flow; more pathways open up as the capillary number increases, leading to a nonlinear relationship between flow rate and pressure gradient.

Figure 3. Three-dimensional views of the segmented phases on a  $100 \times 100 \times 400$ voxels sub-volume of the full image for $f_{w} = 0.7$ and $Ca = 10^{-6.0}$, $10^{-5.1}$ and $10^{-4.9}$. Water is blue, oil is red and intermittent regions are shown in yellow.
4. Quantification of the transition from linear to intermittent flow
We now quantify the onset of intermittency using an energy balance argument. We generalize our previous work Zhang et al. (Reference Zhang, Bijeljic, Gao, Lin and Blunt2021) by identifying oil as the wetting phase (which we label phase 1) and water as non-wetting (which we label phase 2). We hypothesize that intermittency first occurs when the work done due to fluid injection over a characteristic pore scale  $l$ is sufficient to create a fluid meniscus. Note that this is not the same as equating the pressure drop across a pore to the capillary pressure, which occurs at higher flow rates. We define $l$ as a characteristic distance between pores. The average pore volume associated with a pore is thus $\phi l^3$, where $\phi$ is the porosity. The change in pressure $P$ over a distance $l$ is equal to $-l\boldsymbol {\nabla } P$, where $\boldsymbol {\nabla } P$ is the pressure gradient. The mechanical work of fluid injection, $P\boldsymbol {\nabla } V$, can be written as $- \phi l^4 \boldsymbol {\nabla } P$. The energy to create an interface in a pore of typical radius $r$ is $\sigma r^2$, which, at the onset of intermittency, we assume is equal to $- \phi l^4 \boldsymbol {\nabla } P$. We ignore the change in surface energy due to changes in the fluid–solid interfacial areas.
To estimate the pressure gradient, we assume Darcy-like flow on average with a total flow rate  $q_t^i$ and a limiting mobility $f_w/\mu _{1}$, which represents flow of the wetting phase (1, oil) into and out of regions of the pore space filled with the non-wetting phase (2, water) with an effective relative permeability, at least in the viscous-flow limit of $f_w$. Hence from (1.1) we estimate $\boldsymbol {\nabla } P \approx -\mu _{1} q_t^i/ K f_w$. We then expect the onset of intermittency when
 \begin{equation} \sigma r^2 = \frac{\mu_{1} q_t^i \phi l^4}{K f_w}. \end{equation}
This can be rearranged to write the threshold water (non-wetting) phase capillary number  $Ca^i_2 = \mu _2 f_w q_t^i/\sigma$ and oil (wetting) phase capillary number $Ca^i_{1} = \mu _{1} (1-f_w) q_t^i/\sigma$ as
 \begin{equation} Ca^i_{2} = Y^i (f_w)^2 \end{equation}
and
 \begin{equation} Ca^i_{1} = Y^i f_w (1-f_w) {\frac{\mu_{1}}{\mu_{2}}}, \end{equation}
and the dimensionless number  $Y^i$ is defined by
 \begin{equation} Y^i = { \frac{\mu_{2}}{\mu_{1}}} {\frac{K r^2}{\phi l^4}}. \end{equation}
 For Bentheimer sandstone, the mean pore radius  $r$ is $24~\mathrm {\mu }{\rm m}$ (Blunt Reference Blunt2017) and $l$ has a value of approximately $150~\mathrm {\mu }{\rm m}$ (Gao et al. Reference Gao, Lin, Bijeljic and Blunt2020), which is the mean pore-to-pore distance obtained from pore-network analysis (Raeini, Bijeljic & Blunt Reference Raeini, Bijeljic and Blunt2017). Then we calculate $Y^i$ to be ${\approx }10^{-5}$.
In figure 4, our results for sample A (table 1) are plotted on a phase diagram as a function of  $Ca_1$ and $Ca_{2}$ (Datta et al. Reference Datta, Dupin and Weitz2014). Equations (4.2) and (4.3) accurately predict the onset of intermittency for all fractional flows.

Figure 4. The phase diagram showing linear flow (empty symbols) and nonlinear flow (filled symbols) for sample A as a function of oil capillary number  $Ca_{1}^{i}$ and water capillary number $Ca_{2}^{i}$. The black dashed line is the predicted transition from Darcy to intermittent flow using (4.2) and (4.3).
Furthermore, we quantify the fraction of the pore space that is intermittently occupied based on the pore-scale images for sample B (figure 5). In the Darcy regime, it has zero intermittent phase or a small amount of intermittent occupancy that is insufficient to perturb the linear Darcy law (Gao et al. Reference Gao, Lin, Bijeljic and Blunt2020). Once nonlinear behaviour emerges, the fraction of the pore space periodically occupied by both phases increases up to 28 % in the cases studied. In figure 5, we also show a good agreement between our theory and previously published work for mixed-wet Bentheimer sandstone from Zou et al. (Reference Zou, Armstrong, Arns, Arns and Hussain2018), with a different viscosity ratio (the oil–water viscosity ratio was 1.46), where the three experiments are all in the predicted intermittent regime or near the threshold line. It should be noted that in previous work we showed that the energy balance theory also accurately predicted the onset of intermittency for a wide range of data in the literature on water-wet samples for different rock types and viscosity ratios (Zhang et al. Reference Zhang, Bijeljic, Gao, Lin and Blunt2021).

Figure 5. The replotted phase diagram showing the fraction of the pore space that has intermittent occupancy; the squares are for sample B, and the triangles are data from the literature (Zou et al. Reference Zou, Armstrong, Arns, Arns and Hussain2018). The dashed line is the predicted transition from Darcy to intermittent flow using (4.2) and (4.3).
5. Conclusions
We have measured the pressure gradient and imaged the nonlinear pore-scale dynamics as a function of capillary number for different water fractional flows on hydrophobic porous media with a wide range of local contact angle during steady-state immiscible two-phase displacement. The Darcy flow regime and the transition to intermittent flow regime have been observed. Using energy balance, we have proposed the threshold line for the onset of intermittent flow, (4.2) and (4.3), which accurately matches the experimental results and is consistent with the pore-scale images. The work provides a quantification of nonlinear flow that is likely to be encountered in many processes, including carbon dioxide storage, subsurface gas production, in porous fibrous layers within fuel cells, microfluidics devices used in drug delivery, and catalysis, which involve multiphase fluid flow in porous materials.
Acknowledgements
We are grateful to Dr S. Berg for many useful discussions on this work.
Funding
We gratefully acknowledge funding from the Shell Digital Rocks programme at Imperial College London.
Declaration of interests
The authors report no conflict of interest.


 Open access