


1. Introduction
The settling of particles has attracted considerable scientific attention owing to its critical importance in environmental and industrial contexts, such as the settling of sediment in natural water bodies, the dispersion of atmospheric pollutants and the transport of materials in pipelines (Baas et al. Reference Baas, Baker, Buffon, Strachan, Bostock, Hodgson, Eggenhuisen and Spychala2022). The settling dynamics of multiple particles is modulated by various factors, including fluid and particle properties and the spatial distribution of particles.
The settling behaviour of a single particle at low Reynolds numbers ( $Re <1$) was first examined by Stokes in 1850, laying the foundation for the study of sedimentation (Stokes Reference Stokes1850). A key parameter for a particle ascending or descending in a Newtonian fluid is the solid-to-fluid density ratio, $\rho _s/\rho _f$, along with the Galileo number, $Ga = \nu ^{-1} (\lvert \rho _s/\rho _f-1 \rvert gd^3)^{1/2}$ (Jenny, Dusek & Bouchet Reference Jenny, Dusek and Bouchet2004), which quantifies the relative significance of buoyancy–gravity effects to viscous effects. Here, $\rho _s$ and $\rho _f$ are the particle and fluid densities, $g$ denotes gravitational acceleration, $d$ is the particle diameter and $\nu$ is the kinematic viscosity of the fluid.
The interaction between two settling particles often involves the so-called drafting, kissing and tumbling (DKT) phenomena. During the initial stage of DKT, a leading particle induces a wake that generates lower drag on the trailing particle. As a result, the trailing particle accelerates towards the leading particle, a phenomenon known as drafting, which reduces the separation between the two particles. As the trailing particle gets closer to the leading particle, it may come into contact, resulting in the kissing phenomenon. During this phase, the parallel arrangement of the particles is disrupted due to the contact, leading to disturbances in their relative positions. If the disturbances caused by the kissing are significant, the particles may undergo tumbling motions, which switch the leading and trailing positions of the particles.
The occurrence of DKT phenomena in settling particle pairs has been observed through experiments conducted several decades ago (Fortes, Joseph & Lundgren Reference Fortes, Joseph and Lundgren1987) and explored with numerous numerical simulations (e.g. Feng, Hu & Joseph Reference Feng, Hu and Joseph1994; Ghosh & Stockie Reference Ghosh and Stockie2015; Ghosh & Kumar Reference Ghosh and Kumar2020a,Reference Ghosh and Kumarb; Hui et al. Reference Hui, Xu, Wu, Zhang, Wu and Liu2022; Ghosh, Chhabra & Sharma Reference Ghosh, Chhabra and Sharma2023). Two-dimensional simulations by Ghosh & Stockie (Reference Ghosh and Stockie2015) focused on the settling of two circular particles separated vertically by two diameters at Reynolds numbers  $Re = 3$, 14 and 80. They showed the occurrence of drafting, kissing and tumbling at $Re$ values of 14 and 80, while only drafting and kissing were observed at $Re = 3$. Recently, Li et al. (Reference Li, Liu, Zhao, Yin and Lu2022) investigated the influence of Reynolds number and initial particle separation on the interaction between two settling particles. They noted that, at low Reynolds numbers of $O(1\unicode{x2013}10)$, the attractive force between particles is significant only when the initial angles are sufficiently small, suggesting that the particles are nearly vertically aligned. At relatively high Reynolds numbers of around 100, the attractive interaction between particles becomes significant regardless of the initial angle.
In the settling of distributed particles, other processes can emerge and modulate the collective dynamics; this is the case of clustering and hindered settling (Baas et al. Reference Baas, Baker, Buffon, Strachan, Bostock, Hodgson, Eggenhuisen and Spychala2022). Hindered settling results in non-cohesive particles adopting lower settling velocities than individual grains, of up to several orders of magnitude in dense suspensions (Richardson & Zaki Reference Richardson and Zaki1954a,Reference Richardson and Zakib), and becomes more pronounced with smaller grain sizes (Baas et al. Reference Baas, Baker, Buffon, Strachan, Bostock, Hodgson, Eggenhuisen and Spychala2022). Experiments by Parthasarathy & Faeth (Reference Parthasarathy and Faeth1990a,Reference Parthasarathy and Faethb) at  $Ga \in [40, 430]$, with solid volume fractions $\phi _s<0.0001$, revealed changes in the turbulence, which impacted the particle dynamics. Numerical simulations by Kajishima & Takiguchi (Reference Kajishima and Takiguchi2002) on the gravity-driven settling of spherical particles at $Re \in [50, 400]$, with a solid volume fraction of $\phi _s = 0.0002$, showed that particle clustering enhanced turbulence. Uhlmann & Doychev (Reference Uhlmann and Doychev2014) explored a multiparticle settling system at $Ga = 121$ and 178 and noted that the particles exhibited steady vertical and oblique motions. Increased $Ga$ led to enhanced particle clustering and higher average settling velocity.
Despite the significant progress in describing the interaction of particle pairs in the context of DKT phenomena, our understanding of settling in non-distributed particle clusters is limited. Characterizing the behaviour of such clusters is essential for bridging the knowledge gap between the settling dynamics of a few and that of distributed particles. In this study, we investigate the continuous settling of aligned particles in a quiescent fluid medium, focusing on varying the initial particle spacing and  $Ga$ in the range of 16 to 976. By examining phenomena at low values of $Ga$ with varying initial particle spacing, we provide insight into the collective behaviour of the particles and pair dispersion, the influence of particle and fluid parameters on the dynamics of reduced complexity particle arrangements and how they control particle dispersion.
2. Experimental set-up
We conducted experiments in a polycarbonate tank of 600 mm height,  $250\ {\rm mm} \times 250\ {\rm mm}$ cross-section and 6 mm thickness. Spherical glass particles of $d = 4$ mm diameter and $\rho _s = 2200$ kg m $^{-3}$ were released at the free surface of quiescent fluid media consisting of water, ethanol, a water–glycerine mixture containing 60 % glycerine by weight (G60) and oil, all of which were filled to the tank level and kept at 25 $^{\circ }$C. The corresponding $Ga$ and $\rho _s/\rho _f$ values were 976 and 2.2 for water, 778 and 2.8 for ethanol, 95 and 1.9 for the G60 mixture, and 16 and 2.4 for oil. The experimental set-up (figure 1a) allowed characterization of the particle motions without wall effects.

Figure 1. (a) Schematic of the experimental set-up illustrating the two synchronized particle tracking systems, and (b) view of the customized particle release system.
A customized apparatus was built to dispense particles at a steady consistent falling frequency. The apparatus comprises a particle holder, a circular path in cross-section to confine particle positions and a 1 mm thick bar connected to a linear actuator. The particle path initiates from a sufficiently long vertical line, attaches to a short bent line and finishes with another short vertical line (figure 1b). Initially, particles are vertically aligned, moving individually through the remaining path and descending through the reservoir once the bar propels them. The curved path restricts the particles from sliding off without being propelled, causing them to descend one after the other at a constant frequency matching that of the linear actuator. We investigated particle release frequencies of  $f_p=4$, 6 and 8 Hz. The initial dimensionless spacing between consecutive particles, $l_0/d$, varied from 11 to 19 for water, 15 to 26 for ethanol, 9 to 14 for the G60 mixture, and 7 to 10 for oil, which was modulated by the release frequency. The particles were released at the centre of the tank and 1 mm above the free surface to avoid any disruptions caused by the particle release mechanism. Additionally, a thin plate was placed at the fluid surface to minimize minor surface fluctuations.
The parameter selection captured a range of behaviours while maintaining practical feasibility. The particle diameter (4 mm) allowed accurate tracking and avoided excessive settling times. The particle density ( $\rho _s = 2200$ kg m $^{-3}$) is commonly used in particle-tracking experiments due to its well-defined properties, and in addition is relevant to sedimentation in a wide range of environments. The release frequencies (4, 6 and 8 Hz) allowed for exploration of various dynamic regimes and interactions. It is worth noting that there is an extensive parameter space to explore in the future, particularly the impact of particle size and shape on settling.
The motion of the particles was tracked using four synchronized, high-speed 2.3 megapixel cameras, positioned in two perpendicular pairs (figure 1a). Each camera covered a  $250\ {\rm mm} \times 350\ {\rm mm}$ field of view with an overlapping region of $250\ {\rm mm} \times 50\ {\rm mm}$ at the mid-height of the tank. As a result, the spatial resolution ranged from 4.2 to 4.7 pixels mm $^{-1}$, depending on the lateral position of the particles. A feature-finding and linking approach was used for accurate particle tracking. Features of particles detected in a given frame were connected with corresponding features in the previous frame. In cases where a feature in the previous frame could not be linked, we computed the length and direction of the major and minor axes, which allowed robust linking. Through this method, we could track the particles comprehensively and without missing any. To ensure the accuracy of tracking, we captured calibration board images at five different planes parallel to the field of view for each camera. These calibration images served as a reference for determining the spatial coordinates of the tracked particles. Complementary flow measurements around the particles were obtained in selected regions using particle image velocimetry (PIV) with a 2.3 megapixel high-speed camera at a sampling frequency of 200 Hz and illuminated with a 532 nm laser. The final interrogation window size was $16\ {\rm pixels} \times 16\ {\rm pixels}$ with 50 % overlap, resulting in a vector grid spacing of $\Delta x/d=\Delta z/d=0.3$.
3. Results
The settling of aligned particles released continuously at a specific frequency encompasses the dynamics observed in the settling of two settling particles, where drafting, kissing and tumbling can occur. In a continuous stream of initially aligned particles, drafting is expected to be more prominent, potentially leading to a cascade of trajectory instabilities that depend on the properties of the fluid medium. Examining the collective behaviour of particle trajectories and characterizing pair dispersion is essential for understanding these interconnected phenomena, which will be discussed next.
3.1. Bulk behaviour of the particle trajectories
No collisions occurred during the settling of particles in water or ethanol, regardless of the falling frequency. However, in the G60 water–glycerine mixture and oil media, some collisions occurred at release frequencies of 6 and 8 Hz, with more collisions at the higher frequency; however, these did not impact the bulk trajectory-related quantities.
Figure 2 illustrates the trajectories of nearly 800 particles at a release frequency of 4 Hz in each medium. The trajectories of particles with  $Ga$ larger than 225 in water and ethanol exhibited significant lateral dispersion, characterized by meandering-like motions. Conversely, particles in G60 and oil with $Ga$ smaller than 150 displayed minimal lateral dispersion, following predominantly straight trajectories. These features align with previous studies of single particles (Jenny et al. Reference Jenny, Dusek and Bouchet2004), wherein the trajectory corresponds to a three-dimensional chaotic regime in water and ethanol, while demonstrating a steady regime in G60 and oil.

Figure 2. Superimposed particle trajectories in (a) water, (b) ethanol, (c) G60 (water–glycerine mixture) and (d) oil at a particle frequency release of 4 Hz. Colours denote different trajectories.
Characterization of the average vertical velocity component of the particles,  $w$, within the range $z = 20$ and 450 mm (figure 3) evidences the modulation of the particle interaction; there, the reference time is set when a particle passes the $z = 20$ mm plane. It is worth mentioning that particle collisions are not considered. The terminal velocity of an individual particle, $w_T$, is included as a reference and is a function of $Ga$,
$Ga$,  $\nu$ and $d$ (Goossens Reference Goossens2020), as $w_T = [(729+3Ga^2)^{1/2}-27]\nu /d$. The associated particle Reynolds numbers, $Re_p$, for the water, ethanol, G60 and oil media are around 1700, 1300, 140 and 12. This places them into the inertial regime of Richardson & Zaki (Reference Richardson and Zaki1954a) for water and ethanol, and the transitional regime for G60 and oil. In terms of the sizes of natural silica sediment settling in water, these are equivalent to pebbles (water and ethanol), very coarse sand (G60) and medium sand (oil).

Figure 3. Mean vertical velocity of the particles,  $w$, in (a) water, (b) ethanol, (c) G60 and (d) oil at various $f_P$. Dotted horizontal lines show terminal velocity for a single particle, and vertical lines denote $w/w_T=1$. (e) Drag coefficient ratio relative to a single particle, $C_d/C_{d0}$, for the four fluids.
The effect of particle release frequency ( $f_p=4$, 6 and 8 Hz) on the average vertical velocity component, $w$, is evident in comparison with the terminal velocity $w_T$ indicated by dashed lines (figure 3). In most cases, except for the G60 medium, $w$ increases monotonically and eventually reaches a terminal value. Importantly, these velocities exceed the single-particle $w_T$. It is worth noting that, although the particles in the G60 medium do not reach asymptotic values, their velocities still surpass $w_T$. Additionally, in all media, $w$ approaches $w_T$ more rapidly as the falling frequency increases, indicating increased coordination among multiple particles when they are closer together. This effect is particularly evident in cases with minor lateral motions (figure 2c,d), where particles exhibit better coordination. The cases with reduced particle separation, i.e. $f_p=8$ Hz, demonstrate higher collective velocity (figure 3c,d).
The observed enhanced particle coordination, which leads to greater asymptotic velocities, indicates reduced drag, as represented by the drag coefficient  $C_d$, which is influenced by the media and particle separation as modulated by the release frequency. Figure 3(e) compares particle drag relative to that of a single particle, $C_{d0}$, for each medium and release frequency. Notably, the oil medium exhibits maximum drag reduction under the closest particle separation, aligning with the conditions of maximum particle coordination, where lateral displacements are minimal, and particles are in close proximity. The monotonic trend of decreasing $C_d$ with closer particle separation suggests the potential for even lower drag, although further inspection is required to characterize this phenomenon fully.
The average lateral velocity component of the particles,  $v_L=(u^2+v^2)^{1/2}$, is presented in figure 4 to complement the description of collective particle velocity. Here, $u$ and $v$ represent velocities in the $x$ and $y$ directions with respect to an arbitrary coordinate system. The settling of collective particles at relatively large $Ga$ (figure 4a,b) exhibited lateral velocities approximately one order of magnitude larger than those with smaller $Ga$ (figure 4c,d) across the entire interrogation volume. Notably, a common trend in $v_L$ is observed in water, ethanol and G60, with distinct maximum values indicated in figure 4(a–c). However, in the case of oil, $v_L$ remained nearly constant, indicating minor lateral velocity (figure 4d).

Figure 4. Mean lateral velocity component of the particles,  $v_L$, in (a) water, (b) ethanol, (c) G60 and (d) oil at various $f_P$. (e) Maximum $v_L$, and (f) bulk terminal velocity. Red symbols include cases with particle collisions.
Figure 4(e,f) shows the maximum lateral velocity  $v_{L_{max}}$ and collective terminal velocity $w_{TC}$ normalized by $w_T$ as a function of initial particle spacing, $l_0$. It is noteworthy that particles released with smaller initial spacing exhibit more restricted lateral motions, as evidenced by the lower values of $v_{L_{max}}$ in figure 4(e). Conversely, the opposite trend is observed in the vertical component, with particles released closer together showing increased vertical velocities. Also worthy of note are the minimal effects of particle collisions (figure 4f) on the overall bulk behaviour.
A measure of particle coordination is evidenced in figure 5, which presents the top view of the centre of mass, [ $x_c, y_c$], of the particles along the vertical span. The centre of mass at a given height, $z$, is calculated as $[x_c(z), y_c(z)] = ({1}/{N})\big [\sum _{i=1}^{N} x_i(z), \sum _{i=1}^{N} y_i(z)\big ]$, where $x_i(z)$ and $y_i(z)$, obtained at 1 mm intervals vertically, represent the positions of the $i$th particle along the $x$ and $y$ axes at a given vertical position $z$, and $N$ is the total number of particles.

Figure 5. Top view of the particles’ centre-of-mass motion in the (a–c) water, (d–f) ethanol, (g–i) G60 and (j–l) oil media at particle release frequencies of 4, 6 and 8 Hz. The inset in panel (a) shows particle scatter at  $z=100$ mm; the centre is marked with a red dot.
The inset in figure 5(a) displays a scatter plot of [ $x_i, y_i$] at $z=100$ mm, with a red dot indicating the position of [ $x_c, y_c$]. A notable characteristic of this quantity is its in-plane trajectory. In water and ethanol, [ $x_c, y_c$] exhibited the largest deviation from the centre at the lowest falling frequency, corresponding to a larger particle spacing (figure 5a,d). This is indicative of significant lateral particle motion due to large $Ga$, as observed in figure 4(a,b), and the preferential direction in which particles are coordinated and influenced by preceding particles. In the absence of a preferential direction, [ $x_i, y_i$] should exhibit a uniform distribution at any given horizontal plane, and $[x_c, y_c] \rightarrow [0, 0]$ regardless of the magnitude of the lateral velocity. In the G60 and oil media, the [ $x_c, y_c$] of particles remained close to the release vertical axis due to their straight trajectories (see the last two columns, figure 5g–l).
3.1.1. Particle pair dispersion
The particle pair dispersion,  $R^2 = \langle (r(t)-r_0)^2 \rangle$, is described for various initial separations, $r_0$, in all scenarios. Here, $\langle {\cdots }\rangle$ denotes the averaging operator, and $r(t)$ represents the distance between two particles over time. The vertical component of $R^2$ followed an $R^2\propto t^2$ scaling, although with varying dependence on the initial separation and particle release frequency. For brevity, selected $R^2$ trends for each fluid medium are shown in figure 6, for the $f_p=6$ Hz case.

Figure 6. Vertical pair dispersion,  $R^2_z$, for various initial particle separations, $r_0$, for (a) water, (b) ethanol, (c) G60 and (d) oil at a particle falling frequency of $f_p=6$ Hz.
Particles in water and ethanol showed similar  $R^2$ trends with consistent magnitude and behaviour, exhibiting relatively low dependence on the initial separation, $r_0$. The pair dispersion in these fluids followed an initial ballistic regime characterized by a quadratic dependence on time ( $t^2$), followed by a slower rate of increase at longer times. In contrast, particles in the G60 mixture and oil media displayed a ballistic regime that experienced minor changes during the settling process. Importantly, the behaviour of particles in these two media was strongly affected by $r_0$, which is discussed further below.
In the context of isotropic homogeneous turbulence, the pair dispersion of tracer particles in the ballistic regime follows a power-law scaling with the initial separation (Batchelor Reference Batchelor1950). This relationship can be expressed as the ratio of two pair dispersions with different initial separations, denoted as  $R^{2*}$, which is related to the corresponding ratio of the initial separations, denoted as $r_0^*$, by $R^{2*} \sim (r_0^*)^{2/3}$. Here, we examined the pair dispersion ratio relative to the minimum separation, $R^{2*}_z = R^2_{r_{0i}}/R^2_{r_{0 min}}$, where $R^2_{r_{0i}}$ represents the pair dispersion for a specific initial separation, $r_{0i}$, and $r_{0 min}$ is the minimum separation. We also define the initial separation ratio as $r_0^* = r_{0i}/r_{0 min}$. To focus on the contributing effects, the calculation of $R^{2*}_{r_{0i}}$ is limited to the ballistic regime. The corresponding trends are presented in figure 7, using logarithmic scales for clarity.

Figure 7. Vertical pair dispersion ratio,  $R^{2*}_z$, with respect to the initial separation ratio, $r_0^*$, for (a) water, (b) ethanol, (c) G60, and (d) oil at various $f_P$. A log scale is used on both axes.
An interesting observation is the presence of a distinct scaling relationship,  $R^{2*}_z \propto (r_0^*)^{2/3}$, for initial separation values $r_0\lesssim 2$ in the settling of particles in water and ethanol. In these cases, the pair dispersion ratio, $R^{2*}_z$, exhibits a weak dependence on larger separations (see figure 7a,b). However, the scaling behaviour is fundamentally different for the G60 water–glycerine mixture and oil media. The pair dispersion ratio in these media follows a relatively linear relationship, $R^{2*}_z \sim r_0^*$, over significantly larger particle separations. Notably, this linear relationship persists throughout all the particle trajectories in the G60 medium.
Figure 8 illustrates the lateral pair dispersion,  $R^2_L$, for particles released at a frequency of 4 Hz. Although there are some similarities with the vertical pair dispersion, notable differences are observed. In water, ethanol and the G60 mixture, the ballistic scaling regime transitions to a constant value within a relatively short interval. However, particles in oil exhibit a distinct behaviour, with the ballistic scaling occurring after a negligible initial lateral dispersion that lasts a comparatively short time. In addition, the dependence on particle initial separation is more pronounced in the case of oil (see figure 8d).

Figure 8. Lateral pair dispersion,  $R^2_L$, for various initial separations, $r_0$, for (a) water, (b) ethanol, (c) G60 and (d) oil at particle falling frequency of $f_p=4$ Hz.
Characterizing the lateral pair dispersion ratio,  $R_L^{2*}$, with normalized particle initial separation, $r_0^*$, for different particle release frequencies provides an understanding of the relationship between these two quantities, as summarized in figure 9. There is a weaker dependence of $R_L^{2}$ on $r_0^*$ compared to the vertical pair dispersion, irrespective of $f_P$. Notably, for the cases of $f_P=4$ Hz in water and ethanol, a positive scaling between $R_L^{2}$ and $r_0^*$ is observed in the lower separation range. However, the reason for the distinct change in behaviour for higher $f_P$ is unclear, and further inspection of the induced flow characteristics may provide additional insights into this phenomenon.

Figure 9. Lateral pair dispersion ratio,  $R^{2*}_L$, with respect to the initial separation ratio, $r_0^*$, for (a) water, (b) ethanol, (c) G60, and (d) oil. A log scale is used on both axes.
3.1.2. On flow around the particles
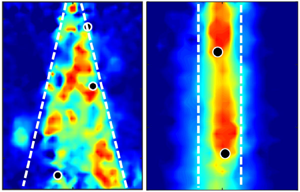
Figure 10 provides insight into flow surrounding the settling particles, showing a connection between particle coordination and the induced flow. In general, particles exhibit different degrees of interaction modulated by the upstream wakes of particles. In water, particles disperse laterally close to the surface and show less impact from wakes, while in oil, particles exhibit a nearly aligned arrangement regardless of the particle release frequency ( $f_P$). This alignment contributes to their higher terminal velocity and increased drag (figure 3c,d). In water, characterized by higher $Ga$, the settling of particles induces vertical and lateral flows and vortical motions. In contrast, at relatively lower Galileo numbers in oil, the particles generate primarily vertical flow along their trajectories, with higher values at greater falling frequencies. The interaction between particles and the surrounding fluid in each medium likely plays a crucial role in the different scaling behaviours observed between $R^2_z$ and $r_0$ (figure 7).

Figure 10. Instantaneous velocity field around particles: (a) water,  $f_P=8$ Hz; (b) oil, $f_P=4$ Hz; and (c) oil, $f_P=8$ Hz. (d–f) The associated vertical velocity distribution.
4. Discussion
The observed higher velocities and more rapid attainment of terminal velocities in the presence of multiple particles indicate enhanced coordination among particles. This phenomenon suggests that, at these low particle concentrations, the close proximity and interactions between particles in these media promote collective behaviour, resulting in more efficient settling and increased velocities than single or highly separated particles. Our results reveal a different behaviour to multiple grains at higher particle concentrations, where hindered settling lowers the bulk particle settling velocity compared to single grains (Richardson & Zaki Reference Richardson and Zaki1954a,Reference Richardson and Zakib; Baas et al. Reference Baas, Baker, Buffon, Strachan, Bostock, Hodgson, Eggenhuisen and Spychala2022). Further investigation of the inter-particle forces and hydrodynamic interactions that govern these particle dynamics at differing particle concentrations and separations may uncover the dominant processes.
The disparities in particle trajectories and dispersion observed between different media underscore the significant role played by fluid properties. The minimal lateral dispersion and predominantly straight trajectories observed in the G60 water–glycerine mixture and oil media indicate a heightened resistance to lateral motion, which can be attributed to the higher viscosity and/or distinct fluid flow characteristics. These findings point to the crucial role of fluid properties, including viscosity and density, in dictating the settling behaviour and particle dynamics. The disparities in lateral pair dispersion and lateral velocities across various media indicate the interplay between lateral and vertical motions. Notably, in media where particles exhibit substantial lateral dispersion, the lateral motions likely influence the overall settling behaviour and particle trajectories considerably. Particle size and shape are likely key parameters influencing the settling. Indeed, non-spherical particles, or particles of different sizes, may exhibit distinct settling characteristics due to variations in their interactions with the fluid medium.
Overall, the particle behaviours quantified herein, such as distinct particle coordination and modified velocities in the presence of multiple particles and their relative location, highlight the importance of collective interactions in governing the settling process. This phenomenon is relevant in many natural environments and engineered systems, from sedimentation processes in aquatic ecosystems to particle separation techniques in industrial applications. Understanding the behaviour of multiple particles within different fluids and at sediment concentrations is prerequisite to assessing the behaviour of a wide range of particles, from clays, to organic material to microplastics within natural ecosystems. Investigating how fluid properties influence particle behaviours offers crucial insight into the fundamental principles governing particle–fluid interactions. Indeed, the distinctions in vertical and lateral dispersion and trajectories among different media underscore the pivotal role of fluid properties in shaping particle settling patterns.
5. Conclusions
The present experimental investigation on the settling behaviour of spherical particles arranged in vertically aligned patterns within quiescent media at low particle concentrations has provided new insights into the influence of particle release frequency, fluid media and particle initial separation. The statistical analysis of particle trajectories has revealed distinct characteristics for different scenarios, shedding light on the underlying dynamics.
In the cases of relatively larger Galileo numbers (water and ethanol media), the centre of mass of the particles exhibited a preferential in-plane path, indicating a dominant vertical motion. Conversely, for lower Galileo numbers (G60 water–glycerine mixture and oil media), particles exhibited minimal lateral particle motion, resulting in negligible variation in the centre-of-mass trajectory.
Regarding the pair dispersion of particles, a ballistic regime was observed in all scenarios, although the duration and dependence on initial particle separation varied. The dimensionless vertical pair dispersion demonstrated a 2/3 scaling relationship with a dimensionless initial particle separation in water and ethanol. This indicates a coherent behaviour, where particle dispersion increases with initial particle separation but at a slower rate compared to linear scaling. The G60 water–glycerine mixture and oil media showed a linear scaling relationship between the dimensionless vertical pair dispersion and dimensionless initial particle separation, showing that particle dispersion increases proportionally to the initial separation.
No significant trends were observed across the media and particle release frequencies regarding lateral pair dispersion, suggesting that these factors do not strongly influence lateral motion and dispersion.
These findings contribute to a fundamental understanding of particle interactions and dispersion in quiescent media at low particle concentrations, with applications in many environmental and industrial flows.
Funding
This research was funded by the National Science Foundation, grant no. PDM-2207026. We are grateful to S.W. Kieffer for discussions about the environmental relevance of the study and providing support from C.R. Walgreen Jr. endowed funds to UIUC.
Declaration of interests
The authors report no conflict of interest.


 Open access