


1. Introduction
Evaporation of sessile droplets has attracted a lot of attention over the past decades due to its ubiquitousness and huge relevance for various applications, such as inkjet printing (Park & Moon Reference Park and Moon2006), surface patterning (Kuang, Wang & Song Reference Kuang, Wang and Song2014) and microfabrication (Kong etal. Reference Kong, Tamargo, Kim, Johnson, Gupta, Koh, Chin, Steingart, Rand and McAlpine2014), among others. In particular, the pioneering work of Deegan etal. (Reference Deegan, Bakajin, Dupont, Huber, Nagel and Witten1997), unveiling the mystery of the so-called coffee-stain effect, has inspired many scientific studies on evaporating droplets over the past 20 years.
While the evaporation of single-component droplets is relatively well understood (Hu & Larson Reference Hu and Larson2002; Popov Reference Popov2005; Ristenpart etal. Reference Ristenpart, Kim, Domingues, Wan and Stone2007; Cazabat & Guéna Reference Cazabat and Guéna2010; Gelderblom etal. Reference Gelderblom, Marin, Nair, van Houselt, Lefferts, Snoeijer and Lohse2011; Marin etal. Reference Marin, Gelderblom, Lohse and Snoeijer2011; Lohse & Zhang Reference Lohse and Zhang2015; Chong etal. Reference Chong, Li, Ng, Verzicco and Lohse2020), multicomponent droplets show far more complex dynamics during the drying process. This is due to the complicated coupling of the mutual interactions between species (Brenn etal. Reference Brenn, Deviprasath, Durst and Fink2007; Chu & Prosperetti Reference Chu and Prosperetti2016; Diddens etal. Reference Diddens, Tan, Lv, Versluis, Kuerten, Zhang and Lohse2017) and the resulting flow structures (Kim etal. Reference Kim, Boulogne, Um, Jacobi, Button and Stone2016; Karpitschka, Liebig & Riegler Reference Karpitschka, Liebig and Riegler2017; Marin etal. Reference Marin, Karpitschka, Noguera-Marin, Cabrerizo-Vilchez, Rossi, Kahler and Valverde2019). Essentially, the selective evaporation of each component is the reason underlying the complexity: the preferred evaporation of one component as compared to the other(s) can result in inhomogeneous liquid distributions. Christy, Hamamoto & Sefiane (Reference Christy, Hamamoto and Sefiane2011) first reported the sequential flow transitions in an evaporating ethanol–water binary droplet, which showed an evaporation-induced Marangoni instability in the early life stage. Many subsequent studies (Bennacer & Sefiane Reference Bennacer and Sefiane2014; Zhong & Duan Reference Zhong and Duan2016; Diddens etal. Reference Diddens, Tan, Lv, Versluis, Kuerten, Zhang and Lohse2017) show that the solutal Marangoni stress driven by the surface tension gradient dominates the flow structure in evaporating multicomponent microdroplets. Very recently, Edwards etal. (Reference Edwards, Atkinson, Cheung, Liang, Fairhurst and Ouali2018) and Li etal. (Reference Li, Diddens, Lv, Wijshoff, Versluis and Lohse2019) also found gravity-driven flows in different binary microdroplet systems, which are triggered by the density gradients from the selective evaporation. This is the first evidence that buoyancy-driven Rayleigh convection can overcome Marangoni flow in controlling the flow structure in such evaporating liquid-mixture droplets with Bond number  $Bo\ll 1$.
For a specific category of multicomponent systems with a metastable phase regime, the phenomena are even more intriguing and complex. Tan etal. (Reference Tan, Diddens, Lv, Kuerten, Zhang and Lohse2016, Reference Tan, Diddens, Versluis, Butt, Lohse and Zhang2017, Reference Tan, Wooh, Butt, Zhang and Lohse2019b) systematically studied a ternary ‘ouzo’ system, which involves not only complex flow behaviours, but, remarkably, multiple phase transitions, i.e. oil microdroplet nucleation and phase separation. Additionally, in a dissolution system, the interaction between host liquid and droplet liquids can also lead to segregation of the components inside the droplet (Dietrich etal. Reference Dietrich, Rump, Lv, Kooij, Zandvliet and Lohse2017; Tan etal. Reference Tan, Diddens, Mohammed, Li, Versluis, Zhang and Lohse2019a). Recently, Li etal. (Reference Li, Lv, Diddens, Tan, Wijshoff, Versluis and Lohse2018) reported an unexpected segregation triggered by selective evaporation within a miscible 1,2-hexanediol–water binary droplet, in which 1,2-hexanediol is almost non-volatile compared to water. The insufficient replenishment of water from the droplet interior towards the contact line by the weak convection inside the droplet causes the local accumulation of 1,2-hexanediol in the contact line region, which eventually leads to segregation (Karpitschka Reference Karpitschka2018; Kim & Stone Reference Kim and Stone2018).
In the current work, we added a small amount (0.5 wt %) of silicone oil to the 1,2-hexanediol–water binary solution, which forms oil–water microemulsions in the mixture system (Alany etal. Reference Alany, Rades, Agatonovic-Kustrin, Davies and Tucker2000), aiming to utilize silicone oil to trigger the extraction of 1,2-hexanediol. Surprisingly, we observed the plumes of separated 1,2-hexanediol arising along the droplet surface originating from the rim, which resemble those shapes emerging in a Rayleigh–Taylor instability (Rayleigh Reference Rayleigh1882; Taylor Reference Taylor1950). To understand the mechanism of the plume formation and the evaporation behaviour of this multicomponent droplet, we studied the drying system experimentally and theoretically.
The paper is organized as follows. In § 2, we introduce the employed experimental methods. In § 3, the experimental results and our interpretations thereof are presented. We then apply multicomponent-diffusion models to the experimentally analysed cases (§ 4). The paper ends with a summary and an outlook for future work (§ 5).
2. Experimental methods
2.1. Solution and substrate
The droplet system we used consisted of Milli-Q water (Reference A $+$, Merck Millipore, 25
  $^\circ$C), 1,2-hexanediol (Sigma-Aldrich,
  $\geqslant$98 %) and silicone oil (Sigma-Aldrich, viscosity 1000 cSt). First, 10 wt % of 1,2-hexanediol aqueous solution was prepared and then 0.5 wt % of silicone oil was added. For this we mix 30 mg silicone oil with 5970 mg 1,2-hexanediol aqueous solution in a glass container and sonicate it for 10 min. We performed evaporation experiments on a hydrophobized glass slide coated by octadecyltrichlorosilane (OTS, Sigma-Aldrich,
  $>$90 %) (Peng etal. Reference Peng, Xu, Hughes and Zhang2014). Before usage, the substrates were cleaned sequentially by 15 min sonication in 99.8 % ethanol and 5 min in Milli-Q water, and subsequently dried with compressed N
 $_2$ flow for 30 s. The droplet in each experiment was deposited by a glass syringe with a full metal needle (Hamilton, 10
  ${\rm \mu}$l, Model 701 NWG SYR, Cemented NDL).
2.2. Confocal microscopy
Confocal microscopy was employed to visualize the distribution of water and 1,2-hexanediol within the mixture droplet. The observations were carried out by using an inverted Nikon A1 confocal laser scanning microscope system (Nikon Corporation, Tokyo, Japan) with a 10 $\times$ dry objective (Nikon, Plan Fluor 10
 $\times$/0.30, OFN25, DIC, L/N1). The droplet was labelled with two different dyes, i.e. Nile Red and Dextran. Nile Red is a lipophilic dye that dissolves only in 1,2-hexanediol and was excited by a laser at a wavelength of 561 nm, whereas Dextran preferentially dissolves in water and was excited simultaneously by a laser at a wavelength of 488 nm. Three-dimensional images were obtained by reconstruction from a series of consecutive
  $Z$-stack images scanned in the direction from the substrate to the top of the droplet. The scan started as soon as the droplet was deposited on the glass substrate. Operating in Galvano mode, the scan rate for the two-dimensional images was one frame per second (f.p.s.), while each
  $Z$-stack scan loop for three-dimensional images took approximately 30 s to complete. This time scale is much smaller than that of evaporation, such that the variation of the flow pattern within the droplet during the scans was negligible.
2.3. Micro particle image velocimetry
For flow visualization, we performed micro particle image velocimetry ( ${\rm \mu}$PIV) by adding fluorescent particles (Fluoro-Max; red fluorescent polymer microspheres, Ex/Em 530 nm/607 nm, diameter 0.52
  ${\rm \mu}$m) to the working fluids at a concentration of
  $2\times 10^{-2}$ vol %. The
  ${\rm \mu}$PIV measurements were implemented on the same confocal microscope with a 10
 $\times$ dry objective (Nikon, Plan Fluor 10
 $\times$/0.30, OFN25, DIC, L/N1). The particles were excited by a laser at a wavelength of 561 nm and the fluorescent signals were captured at a frame rate of 25 f.p.s. The droplet was illuminated from the bottom and the fluorescent signal was also captured by the objective from the bottom.
2.4. Geometrical measurement
The evaporation process was recorded by a charge-coupled device (CCD) camera (MQ013MG-E2, XiQ) coupled to a microscope (12 $\times$ Ultrazoom, NAVITAR), which was illuminated by a light-emitting diode (LED) light (MWWHL4 Warm White Mounted LED, THORLABS) from the opposite side of the droplet. In the experiments, droplets evaporated into air under stable laboratory conditions. The relative humidity
  $RH$ and the ambient temperature
  $T$ were monitored in each measurement, which were
  $45\,\% \pm 3$ % and
  $22\pm 1\,^\circ$C, respectively.
3. Rayleigh–Taylor instability arising from segregation
3.1. Experimental observations and interpretations
Evaporation processes of silicone-oil-seeded 1,2-hexanediol–water droplets with opposite orientations are displayed in figure 1. The upper ( $a{\rm i}$–
 $a{\rm v}$) and lower (
 $b{\rm i}$–
 $b{\rm iv}$) rows show the evolution of a sessile droplet and a pendent droplet, respectively. At the beginning of the recording (approximately 30 s after droplet deposition), the segregation of 1,2-hexanediol already appeared for both droplets (figure 1
 $a{\rm i},\!b{\rm i}$), as revealed by the yellow colour.

Figure 1. Confocal images of evaporation behaviours for both sessile ( $a{\rm i}$–
 $a{\rm v}$) and pendent (
 $b{\rm i}$–
 $b{\rm iv}$) droplets in a semi-side view taken at different time instants. The confocal microscope scanned the rectangular box with the volume
  $1225~{\rm \mu} \textrm {m}\times 1280~{\rm \mu} \textrm {m}\times 250~{\rm \mu} \textrm {m}$. (
 $a{\rm i},b{\rm i}$) For both droplets, when the evaporation began, the 1,2-hexanediol separated at the contact line and formed a ring-like pattern. (
 $a{\rm ii}$–
 $a{\rm iii}$) In the sessile droplet, through the growth of the segregation, the separated 1,2-hexanediol rose up with plumes. (
 $a{\rm iii}'$) Top view of the droplet at
  $t_0 + 334$ s; this is transformed into a binary image to increase the contrast of colours. (
 $a{\rm iv}$) The plumes merged with each other at the apex of the droplet. (
 $a{\rm v}$) Eventually, 1,2-hexanediol fully covered the surface and stopped the evaporation. (
 $b{\rm ii}$–
 $b{\rm iii}$) In the pendent droplet, the segregation of 1,2-hexanediol expanded with the ring-like shape. (
 $b{\rm iv}$) Once the separated 1,2-hexanediol occupied the entire surface area, the evaporation stopped.
For the sessile droplet in figure 1( $a{\rm ii}$), in the segregation process, plumes formed, rising from the contact line towards the apex of the droplet. In figure 1(
 $a{\rm iii}$), the shape of the plumes resembles those shapes emerging in a Rayleigh–Taylor instability (Sharp Reference Sharp1984; Boffetta & Mazzino Reference Boffetta and Mazzino2017; Zhou Reference Zhou2017a,b). The plumes later coalesce with each other, eventually fully covering the whole surface of the droplet and thereby ceasing the evaporation process. However, for the pendent droplet, the separated ring only monotonically grows without any plume formation. This observation clearly demonstrates that the flow structure on the droplet interface is controlled by gravity. The mechanism of the formation of the buoyancy-driven flow structure is interpreted along the schematics in figure 2. In equilibrium, the silicone oil forms oil-in-water microemulsions owing to the existence of 1,2-hexanediol as a surfactant (Alany etal. Reference Alany, Rades, Agatonovic-Kustrin, Davies and Tucker2000). After the droplet has been deposited on the substrate, some oil droplets nucleate on the solid surface, as was also observed experimentally in figure 2(c). The reason is that the silicone oil has a much lower interfacial energy with OTS glass than the 1,2-hexanediol–water mixture. This can be seen by comparing the equilibrium contact angle of a pure silicone oil droplet on the OTS glass with that of the 1,2-hexanediol–water mixture droplet. The former is only 10
 $^\circ$, whereas the latter is 40
 $^\circ$. Early on in the evaporation process, the oil droplets in the oil–water emulsions in the bulk of the droplet aggregate due to the depletion of water. These oil droplets together with those which have already nucleated on the substrate trigger the extraction of 1,2-hexanediol from the aqueous solution such that the 1,2-hexanediol phase separates from the water phase.

Figure 2. Schematics of the silicone-oil-seeded binary droplets with opposite orientations. ( $a{\rm i}$) Within the bulk of the droplet, there is an oil–water microemulsion. Because of the preferential evaporation of water near the contact line, 1,2-hexanediol is extracted by silicone oil and starts separating in this region. The non-volatile 1,2-hexanediol segregation shields the evaporation of water at the rim. (
 $a{\rm ii}$) The weak surface tension gradient cannot lead to a strong Marangoni flow on the surface. Instead, in the long term, buoyancy drives the arising plumes (Rayleigh–Taylor instability). (
 $b{\rm i}$) When we orientate the droplet upside down, a similar segregation of 1,2-hexanediol occurs near the contact line. (
 $b{\rm ii}$) However, the segregation rim continuously grows due to the selective evaporation of water but no plumes appear due to the inverted direction of gravity. (
 $c$) The nucleated oil droplets on the substrate (bottom optical view).
For a sessile droplet drying on a flat substrate with a contact angle smaller than 90 $^\circ$, the evaporative flux is maximal at the contact line (Deegan etal. Reference Deegan, Bakajin, Dupont, Huber, Nagel and Witten1997). Hence, the extraction starts from the edge of the droplet due to the fast evaporation of water in that region, leading to a 1,2-hexanediol ring that hinders the further evaporation from the contact line region. The non-volatile ring impedes the build-up of the concentration gradient, which results in a suppression of the surface tension gradient, which therefore cannot play a dominant role in controlling the flow. Instead, because of the lower density of 1,2-hexanediol as compared to the mixture, the separated phase of 1,2-hexanediol at the bottom of the droplet rises up to the apex, driven by buoyancy.
3.2. Evidence of suppression of Marangoni flow from  ${\rm \mu}$PIV measurements

To prove our interpretation, we performed  ${\rm \mu}$PIV measurements to characterize the flow field within the evaporating silicone-oil-seeded (SOS) 1,2-hexanediol–water droplet. Figure 3(
 $a{\rm i}$) schematically illustrates that the segregation of 1,2-hexanediol suppresses the Marangoni flow in the contact line region. Figure 3(
 $b{\rm i}$) displays a snapshot of the velocity field in the focal plane near the substrate at an early stage of the evaporation process,
  $t = T_0/30$ (
 $T_0$ is the droplet's lifetime). The velocity map shows chaotic and very weak flow motions. Figure 3(
 $c{\rm i}$) shows the evolution of the mean radial velocity and the absolute mean velocity (inlet plot). The mean radial velocity
  $\skew3\bar {U}_{r,sos}$ is less than 1
  ${\rm \mu}$m s
 $^{-1}$, and the absolute mean velocity
  $\skew3\bar {U}_{sos}$ in the early stage is around
  $1~{\rm \mu}$m s
 $^{-1}$. For comparison, we also measured the flow field for a 1,2-hexanediol–water binary droplet (without the silicone-oil seeding), which reveals the absence of density-driven flow (Li etal. Reference Li, Lv, Diddens, Tan, Wijshoff, Versluis and Lohse2018). In that case the velocity map in figure 3(
 $b{\rm ii}$) shows much more intense outward radial flows close to the contact line than in the case with silicone-oil seeding.

Figure 3. The  ${\rm \mu}$PIV measurements of the velocity fields of a silicone-oil-seeded 1,2-hexanediol–water (SOS) droplet and a 1,2-hexanediol–water (no-SOS) binary droplet (Li etal. Reference Li, Lv, Diddens, Tan, Wijshoff, Versluis and Lohse2018). (
 $a{\rm i},a{\rm ii}$) Schematics of both droplets at the early life stage. (
 $b{\rm i},b{\rm ii}$) The
  ${\rm \mu}$PIV snapshot of the velocity field in the focal plane near the substrate at the beginning of the evaporation process. The arrows display the local velocity, and the radial velocity is colour coded. (
 $b{\rm i}$) The map shows that there is no visible coherent radial flow. Note that the colour scale bar for
  $U_{r,sos}$ ranges from
  $-2$ to
  $+2~{\rm \mu}$m s
 $^{-1}$, indicating a weak Marangoni flow in a SOS droplet. (
 $b{\rm ii}$) The liquid flows radially towards the edge of the no-SOS droplet from the interior. The radial flow is most intense (
 ${\sim }20~{\rm \mu}$m s
 $^{-1}$) near the contact line, implying a strong Marangoni flow there. The colour scale bar for
  $U_{r,no\textit {-}sos}$ covers a 10 times larger range than that for
  $U_{r,sos}$. (
 $c{\rm i},c{\rm ii}$) The evolution of the radial velocity
  $U_{r}$ in the focal plane near the substrate for both droplets. The insets show the evolution of absolute mean flow velocity
  $U$.
$U$.
During the early lifetime, the mean radial flow velocity  $\skew3\bar {U}_{r,no\textit {-}sos}$ (figure 3
 $c{\rm ii}$) is more than 5
  ${\rm \mu}$m s
 $^{-1}$, which is one order of magnitude higher than that in the former case. The measured velocities for both cases imply Reynolds numbers
  $Re_{sos} = \rho R_d\skew3\bar {U}_{sos}/ \mu \sim 10^{-4}$ and
  $Re_{no\textit {-}sos} = \rho R_d\skew3\bar {U}_{no\textit {-}sos}/\mu \sim 10^{-3}$, where
  $\rho \approx 10^3~\textrm {kg}~\textrm {m}^{-3}$,
  $R_d \approx 10^{-3}~\textrm {m}$ and
  $\mu \approx 10$ mPa s are the liquid density, droplet radius and liquid viscosity, respectively. We estimate the Marangoni time scale in the two cases by using the mean velocity of the radial flow:
  $t_{Ma,sos} \sim R_d/\skew3\bar {U}_{r,sos} \approx 10^{-3}~\textrm {m}/10^{-6}~\textrm {m~s}^{-1} = 10^3$ s and
  $t_{Ma,no\textit {-}sos} \sim R_d/\skew3\bar {U}_{r,no\textit {-}sos} \approx 10^{-3}~\textrm {m}/10^{-5}~\textrm {m~s}^{-1} = 10^2$ s. By looking at the rising time of the plumes from figure 1, we obtain the Rayleigh time scale of the Rayleigh–Taylor instability
  $t_{Ra} \sim 10^2$ s (estimated time of the plumes rising up from the rim to the apex of the droplet). In the silicone-oil-seeding case, the Rayleigh time scale is much smaller than the Marangoni time scale:
  $t_{Ra}/t_{Ma,sos} \ll 1$, which indicates that the buoyancy flow is dominant. In the non-silicone-oil-seeding case, the two time scales are comparable:
  $t_{Ra}/t_{Ma,no\textit {-}sos} \approx 1$, which substantiates that gravity-driven flow is balanced by Marangoni flow, thereby playing no controlling role. We argue that, in the silicone-oil-seeded 1,2-hexanediol–water droplet, the instantaneous segregation hinders the evaporation near the contact line, which suppresses the most intensive Marangoni flow in that region, leading to a weak flow motion in the whole droplet. Therefore, on a relatively long time scale, the buoyancy force due to the density difference dominates the flow, causing Rayleigh–Taylor instability.
We estimate the most unstable wavelength of the Rayleigh–Taylor instability in our system to be  $\lambda _m \approx 4{\rm \pi} (\nu ^2/(g_s {At}))^{1/3} \approx 10^{3}~{\rm \mu}$m (Olson & Jacobs Reference Olson and Jacobs2009). In this expression,
  $g_s = g \sin (\theta )$ is the net acceleration imposed on the interface of the droplet, where
  $g \approx 9.8~\textrm {m~s}^{-2}$ is the gravitational acceleration and
  $\theta \approx 35^\circ$ is the droplet contact angle (see figure 7
 $d{\rm i},\!d{\rm ii}$);
  $At$ is the Atwood number given by
  $At = (\rho _m - \rho _H)/(\rho _m + \rho _H) \approx 2.3\times 10^{-2}$, where
  $\rho _m = 997~\textrm {kg}~\textrm {m}^{-3}$ and
  $\rho _H = 952~\textrm {kg}~\textrm {m}^{-3}$ are the density of the mixture and of pure 1,2-hexanediol, respectively (Romero etal. Reference Romero, Páez, Arteaga, Romero and Negrete2007) and
  $\nu = (\mu _m + \mu _H)/(\rho _m + \rho _H)$ is the averaged kinematic viscosity, where
  $\mu _m \approx 2$ mPa s and
  $\mu _H \approx 80$ mPa s are the dynamic viscosities of the mixture and of pure 1,2-hexanediol, respectively (Jarosiewicz, Czechowski & Jadzyn Reference Jarosiewicz, Czechowski and Jadzyn2004). Here
  $At \ll 1$, the low-density liquid, which is 1,2-hexanediol, moves into the heavy fluid in the upper layer (Sharp Reference Sharp1984). The estimated wavelength
  $\lambda _m$ is comparable to the spatial distance between two plumes
  $\lambda \approx 10^3~{\rm \mu}$m in figure 1(
 $a{\rm iii}$), supporting our interpretation of the plumes as Rayleigh–Taylor instability.
3.3. Evaporation-triggered extraction of 1,2-hexanediol by seeding oils
To evaluate the applicability of different oils for the extraction effect, we seeded the 1,2-hexanediol–water binary solution with several kinds of oils at the concentration of 0.5 wt %, namely silicone oils with viscosities of 12 500 cSt and 100 cSt. As shown in figure 4(a,b), the 1,2-hexanediol–water droplets seeded with the three different oils all show similar plumes rising up from the rim of the sessile droplet towards the apex during the evaporation process. The consistency clearly demonstrates that the evaporation can trigger the early extraction of 1,2-hexanediol by the oil–water emulsions in these solutions, leading to the segregation of 1,2-hexanediol and the resulting flow structures.

Figure 4. Confocal images of segregation patterns for droplets seeded with different oils, namely ( $a$) silicone oil with 12 500 cSt viscosity, (
 $b$) silicone oil with 100 cSt viscosity, and (
 $c$) 1,2-hexanediol–water binary droplet deposited by a plastic syringe and a disposable needle. The confocal microscope scan covered a rectangular box with the section area of
  $1225~{\rm \mu} \textrm {m} \times 1280~{\rm \mu} \textrm {m}$.
We also tested a series of concentration ratios of the seeding oil: 0.5, 0.1, 0.05 and 0.025 wt %. Our observation shows that the effect holds for the concentration of silicone oil down to 0.025 wt %. The robustness of the extraction effect even at tiny silicone oil concentrations obviously raises the question of the control of oil contamination in such liquid systems. This issue had been addressed before by Berklaar etal. (Reference Berklaar, Dietrich, Kip, Kooij, Zandvliet and Lohse2014) in a study on nanobubble nucleation. They found that the polydimethylsiloxane (PDMS) coating in a plastic syringe and a disposable needle can contaminate the solution to form nanobubble-like objects on the substrate, which in fact were silicone oil nanodroplets. In their study, the concentration ratio between PDMS (Sylgard 184, Dow Corning) and water was 0.1 ml/0.4 l, which is  ${\approx }0.025$ wt %.
To see whether we can trigger similar contamination effects also here, in a test experiment, we used the same plastic syringe (5 ml, Discardit, BD) and disposable needle (Microlance, BD) to deposit a 1,2-hexanediol–water binary droplet on the substrate. Indeed, similar Rayleigh–Taylor-like patterns as in our other experiments with silicone oil also occur in such a droplet during the evaporation process (as shown in figure 4 $c$), which confirms that even minute PDMS contamination can cause the early extraction of 1,2-hexanediol during the evaporation process.
3.4. Reversed segregation by evaporation on a lubricated film
In the previous sections, we experimentally demonstrated that gravitational effects dominate the flow structure in the droplet system, due to the suppression of Marangoni flow by the instantaneous segregation of 1,2-hexanediol close to the contact line. We argued that the early phase separation is caused by the coupling of the extraction effect by the seeding oil and the maximal evaporation rate at the contact line. In order to validate this argument, we suppress the local evaporative flux at the contact line by introducing a non-volatile wetting ridge, which can be achieved by letting the droplet evaporate on a lubricated surface (Schellenberger etal. Reference Schellenberger, Xie, Encinas, Hardy, Klapper, Papadopoulos, Butt and Vollmer2015; Gao etal. Reference Gao, Liu, Ye, Schönecker, Kappl, Butt and Steffen2019).
We performed the experiment in which the silicone-oil-seeded droplet evaporates on a lubricated surface of silicone oil (Sigma-Aldrich, viscosity 1000 cSt). The lubricated surface was made by spin coating of silicone oil on a solid glass substrate (Gerhard Menzel GmbH,  $76~\textrm {mm} \times 26~\textrm {mm}$ ), with a typical thickness of
  $18 \pm 1~{\rm \mu}$m (Hack etal. Reference Hack, Costalonga, Segers, Karpitschka, Wijshoff and Snoeijer2018). The equilibrium contact angle
  $\theta$ of the droplet on this lubricated surface is 38
 $^\circ$ (see figure 7
 $d{\rm i},\!d{\rm ii}$), which is close to the contact angles in the first two cases. In the experiment, we still only dyed the 1,2-hexanediol and water with the same method mentioned in § 2. Thus the silicone oil film is not visible in the confocal movie (available online at https://doi.org/10.1017/jfm.2020.449).
One wonders whether there is an intercalated film in between the droplet and the substrate. To find out, we performed interferometry (Daniel etal. Reference Daniel, Timonen, Li, Velling and Aizenberg2017). The measurements do not show any interference patterns, which suggests that there is no stable intercalated film. Within a second, the droplet re-wets the substrate by rupturing the thin film after the deposition. We estimate the spreading coefficient  $S = \gamma _{da} - \gamma _{do} - \gamma _{oa} \approx 24~\text {mN}~\textrm {m}^{-1} - 20~\text {mN}~\textrm {m}^{-1} - 21~\text {mN}~\textrm {m}^{-1} < 0$, where
  $\gamma$ is the interfacial tension, and the subscripts
  $a$,
$a$,  $o$ and
  $d$ indicate the air and oil phases, and the droplet, respectively. The result
  $S<0$ is consistent with no oil-engulfment covering on the surface of the droplet. In the beginning of the evaporation (figure 5
 $a{\rm i}$), the droplet is homogeneously mixed, which reveals the green colour. Later on, as shown in figure 5(
 $a{\rm ii}$), the segregation of 1,2-hexanediol (yellow colour) starts appearing at the upper part of the droplet rather than from the edge. Also note that in this third case the segregation behaviour is different from the first two cases, as it appears more homogeneously and slowly. The reason is that the segregation in this third case is triggered by the nucleated oil droplets in the bulk instead of those on the substrate, which have a much higher number density in the early phase of the nucleation process and which play the essential role to trigger the early segregation. In figure 5(
 $a{\rm iii}$), the evaporation ceases with the shielding of separated 1,2-hexanediol. This observation shows a different route of segregation, which indicates a faster evaporation rate from the upper surface than from the contact line.

Figure 5. The dynamic behaviour of a silicone-oil-seeded 1,2-hexanediol–water droplet evaporating on a silicone oil thin film. ( $a{\rm i}$–
 $a{\rm iii}$) Confocal microscopy images for a scanned box with volume
  $1225~{\rm \mu} \textrm {m} \times 1280~{\rm \mu} \textrm {m} \times 250~{\rm \mu} \textrm {m}$. (
 $a{\rm i}$) At the beginning, the droplet is homogeneously mixed. (
 $a{\rm ii}$) The segregation of 1,2-hexanediol started appearing on the upper surface of the droplet instead of the contact line area. (
 $a{\rm iii}$) The evaporation ceased when the droplet surface was shielded by 1,2-hexanediol. (
 $b{\rm i}$–
 $b{\rm iii}$) Schematic of the evaporation process. The red colour represents the silicone oil thin film. It forms a meniscus at the contact line.
The explanation is that the thin film forms a wetting ridge covering on the contact line region, as illustrated in figure 5( $b{\rm i}$), which hinders the evaporative flux from there (Gao etal. Reference Gao, Liu, Ye, Schönecker, Kappl, Butt and Steffen2019). Consequently, only the water molecules on the upper surface of the droplet evaporate into the surrounding air, which leads to a high concentration of 1,2-hexanediol at the top of the droplet. Then the highly concentrated 1,2-hexanediol on the upper surface nucleates and segregates from the mixture (figure 5
 $b{\rm ii}$). At the end of the evaporation, there is still water entrapped by the shielding thanks to the segregated 1,2-hexanediol and the silicone oil meniscus, as illustrated in figure 5(
 $b{\rm iii}$).
To further support the argument that the wetting ridge suppresses the local evaporative flux at the contact line, we also employed  ${\rm \mu}$PIV measurement for the silicone-oil-seeded 1,2-hexanediol–water droplet evaporating on a silicone oil thin film, as shown in figure 6. The flow field was measured at the focal plane
  ${\approx }10~{\rm \mu}{\rm m}$ above the substrate. Figure 6(
 $a$) displays the bottom-view image at the beginning of the evaporation process. Two circular rings can be observed. As indicated by the black and the yellow arrows, the outer ring and inner ring represent the drop–oil–solid contact line and the drop–oil–air contact line, respectively. Figure 6(
 $b$) shows the typical velocity field of the flow structure. The radial velocity
  $U_{r}$ is colour-coded. One can see that the radial flow is comparable to the radial velocity in the first case (figure 3
 $b{\rm i}$), which is much weaker as compared to the Marangoni flow in the binary droplet (figure 3
 $b{\rm ii}$). Moreover, the outward radial flow from the interior ceases at the horizontal position of the drop–oil–air contact line. Near the contact line of the droplet, the radial flow even reverses inwardly (revealed by blue colour in figure 6
 $b$). The flow reversal reflects the fact that the liquid in the contact line region can only flow inwardly to maintain the decreasing contact angle and the pinning contact line at this early stage of the droplet's lifetime (see figure 7
 $d{\rm i},\!e{\rm i}$). This is direct evidence that the evaporative flux near the contact line is suppressed by the oil wetting ridge. As shown in figure 6(
 $c$), the mean radial flow decreases and then changes direction due to the shrinking of the contact area (figure 7
 $d{\rm i},\!e{\rm i}$).

Figure 6. The  ${\rm \mu}$PIV measurement of a silicone-oil-seeded 1,2-hexanediol–water droplet evaporating on a silicone oil thin film. (
 $a$) The
  ${\rm \mu}$PIV image focusing on the bottom of the droplet (
 ${\approx }10~{\rm \mu}{\rm m}$ above the substrate). Note that the two circular rings indicate the drop–oil–solid contact line (marked by the black arrow) and the drop–oil–air contact line (marked by the yellow arrow). (
 $b$) Flow field of
  ${\rm \mu}$PIV at
  $t = T_0/30$, where
  $T_0$ is the droplet's lifetime. The black dashed line indicates the horizontal position of the drop–oil–air contact line. (
 $c$) The evolution of the mean radial velocity
  $\skew3\bar {U}_{r}$ and the mean absolute velocity
  $\skew3\bar {U}$. (
 $d$) Schematics of a silicone-oil-seeded 1,2-hexanediol–water droplet evaporating on a silicone oil thin film.

Figure 7. Morphology evolution of the evaporating droplets in three different scenarios: sessile, pendent and on the lubricated film. ( $a$–
$a$– $c$) Recorded images of the droplets in the three cases, with annotations of the geometrical parameters, i.e. contact angle
  $\theta$ and footprint radius
  $R$. Note that for the droplet on the lubricated surface (
 $c$), we fit the large part of the surface with a spherical curve (see the yellow dashed line), and define the contact angle and footprint radius of the fitting shape as
  $\theta$ and
  $R$. (d,e) The contact angle
  $\theta$ and footprint radius
  $R$ as a function of scaled time
  $\hat {t} = t/\tau _c$ and scaled droplet volume
  $\hat {V} = (V - V_f)/(V_0 - V_f)$.
4. Evaporation process and its quantitative understanding
A thorough insight into the evaporation process requires a quantitative understanding. Although the evaporation of a multicomponent droplet is far more complicated than that of a single-component droplet, the essence of the system is still limited by the diffusion of vapour molecules of each component into the surrounding air (Langmuir Reference Langmuir1918; Diddens etal. Reference Diddens, Tan, Lv, Versluis, Kuerten, Zhang and Lohse2017). In this session, we first introduce a diffusion model to describe the evaporative rate for multicomponent droplets. Then we show the geometrical measurement for the three different cases: (a) a silicone-oil-seeded 1,2-hexanediol–water sessile droplet; (b) a silicone-oil-seeded 1,2-hexanediol–water pendent droplet; and (c) a silicone-oil-seeded 1,2-hexanediol–water droplet on a lubricated surface. Finally, we compare a modified multicomponent-diffusion model with the influence of segregation considered with our measurement and discuss the results.
4.1. Multicomponent-diffusion model
Popov (Reference Popov2005) proposed an analytical description for the diffusion-controlled evaporation of a sessile droplet with one single component, which was later experimentally confirmed by Gelderblom etal. (Reference Gelderblom, Marin, Nair, van Houselt, Lefferts, Snoeijer and Lohse2011) and Sobac & Brutin (Reference Sobac and Brutin2011). For the evaporation of multicomponent droplets, we use the method put forward by Brenn etal. (Reference Brenn, Deviprasath, Durst and Fink2007), considering the total evaporation rate of the mixture droplet as the sum of the evaporation rates of each individual component. In our droplet mixture system, only the diffusive flux of water contributes to the total evaporation rate. However, non-volatile components in the system also affect the vapour–liquid equilibrium: the existence of 1,2-hexanediol and silicone oil changes the saturated concentration of water vapour at the liquid–air interface. Raoult's law is used to calculate the difference:  $c_{w,s} = X_w c_{w,s}^{0}$, where
  $X_w$ is the liquid mole fraction of the water component at the interface and
  $c_{w,s}^{0} = 2.08 \times 10^{-2}$ kg m
 $^{-3}$ is the saturated vapour concentration of the pure water at room temperature. However, Raoult's law applies only to an ideal solution and thus ignores any interaction between the components. To overcome this limitation, a so-called activity
  $a_i$ for each component is introduced to describe this interaction (Chu & Prosperetti Reference Chu and Prosperetti2016),
  $a_i = \psi _i X_i$, where
  $\psi _i$ is the activity coefficient. In our case, the mole fraction of silicone oil is negligible (
 ${<}0.1$ %); thus, we consider only the interaction between water and 1,2-hexanediol. Therefore, the saturated concentration of water vapour at the interface becomes
  $c_{w,s} = a_w c_{w,s}^{0}$.
By using Raoult's law together with the water activity  $a_{w}$ (Marcolli & Peter Reference Marcolli and Peter2005) to modify the one-liquid model (Popov Reference Popov2005), we obtain a theoretical model to express the evaporation rate for the water in our system:
 \begin{equation} \frac{\textrm{d}M}{\textrm{d}t} = -{\rm \pi} DR(a_w c_{w,s}^{0}-c_{w,\infty})f(\theta), \end{equation}
with
 \begin{equation} f(\theta) = \frac{\sin(\theta)}{1+\cos(\theta)}+4\int_{0}^{\infty} \frac{1+\cosh(2\theta\varepsilon)}{\sinh(2{\rm \pi}\varepsilon)} \tanh[({\rm \pi}-\theta)\varepsilon]\,\textrm{d}\varepsilon, \end{equation}
where  $D = 24.6 \times 10^{-6}~\text {m}^2~\textrm {s}^{-1}$ is the diffusion coefficient of water vapour in air at room temperature, and
  $R$ and
  $\theta$ are the footprint radius and contact angle of the droplet, respectively.
Besides controlling the evaporation rate, the model also yields the terminal state of the evaporation, which is when the saturated water vapour concentration equals the environmental concentration,  $c_{w,s} = c_{w,\infty }$. Theoretically, the evaporation ceases when the active mole fraction of water equals the relative humidity of the surrounding air,
  $a_w = \psi _w X_w= RH$. From the relative humidity
  $RH$ measured in each experiment, we can analytically calculate the ‘theoretical final volume’
  $V_f$ (as shown in appendix A) of each measured droplet as
 \begin{equation} V_f = \left(\frac{M_w}{M_H}\frac{RH}{\psi_w-RH}+\frac{\rho_w}{\rho_H}\right) \left(\frac{1-C}{C}+\frac{\rho_w}{\rho_H}\right)^{-1}V_0,\end{equation}
in which  $M_H$ and
  $M_w$ are the molecular mass of 1,2-hexanediol and that of water,
  $\rho _H$ and
  $\rho _w$ are their liquid densities at room temperature, and
  $C$ is the initial mass concentration of 1,2-hexanediol in each measurement. We rescale the measured droplet volume and time, by introducing non-dimensional volume
  $\hat {V} = (V-V_f)/(V_0-V_f)$ and time
  $\hat {t} = t/\tau _c$ (Gelderblom etal. Reference Gelderblom, Marin, Nair, van Houselt, Lefferts, Snoeijer and Lohse2011), in order to compare the different sets of experimental data. Here
  $V$ is the droplet volume measured in every time interval,
  $V_0$ is the initial volume of each measurement and
  $V_f$ is the estimated final volume by (4.3); and
  $\tau _c$ is the characteristic time scale of droplet lifetime,
  $\tau _c = \rho _{l}R^2/(D{\rm \Delta} c)$ (Gelderblom etal. Reference Gelderblom, Marin, Nair, van Houselt, Lefferts, Snoeijer and Lohse2011), where
  $\rho _{l}$ is the density of the liquid and
  ${\rm \Delta} c$ the water vapour concentration difference between the air–liquid interface and the surrounding air.
4.2. Evaporation modes and volumetric measurement
In figure 7 we show the measured contact angle  $\theta$ and the footprint radius
  $R$ of (a) a sessile droplet, (b) a pendent droplet and (c) a droplet on a lubricated surface. Figure 7(
 $a$–
$a$– $c$) shows a snapshot of each droplet. Note that, due to the existence of the oil meniscus in the third case (figure 7
 $c$), we define the contact angle and footprint radius by fitting the droplet profile with a spherical cap, shown as the yellow dashed line. Figure 7(d,e) shows the evolution of the two parameters as a function of the scaled time
  $\hat {t} = t/\tau _c$ and volume
  $\hat {V} = (V - V_f)/(V_0 - V_f)$. We observe a sliding contact line during the evaporation for both sessile and pendent droplets. For the sessile droplet, the contact angle remains almost constant during most of the lifetime, but for the pendent droplet, the contact angle always decreases. For the droplet on the thin film, the evaporation follows the stick–slide mode (Nguyen & Nguyen Reference Nguyen and Nguyen2012; Stauber etal. Reference Stauber, Wilson, Duffy and Sefiane2014, Reference Stauber, Wilson, Duffy and Sefiane2015), i.e. it first evaporates with a pinning contact line, and then shrinks with decreasing contact angle.
In figure 8( $a$), we show the volumetric evolutions for the three cases. The evaporation lifetime is normally affected by both the evaporation modes and environmental conditions. In figure 8(
 $b$) we compare the volumetric evolution for the three cases by rescaling them with
  $\hat {t} = t/\tau _c$ and
  $\hat {V} = (V - V_f)/(V_0 - V_f)$. The deviation between the curves clearly implies that the evaporation kinetics is affected not only by the evaporation modes and environmental conditions, but also by the segregation patterns. Note that the first case with the Rayleigh–Taylor instability (blue square symbols in figure 8
 $b$) shows the fastest volumetric decrease among the three cases (compare the slopes of the curves). The percentages of entrapped water compared to the initial amount of water in the final residual of the three droplets were around 16 %, 30 % and 27 %, respectively, estimated from the final volume of droplets. We argue that the fastest evaporation rate coinciding with the lowest water entrapment percentage in the first case is because of the Rayleigh–Taylor instability, causing a better mixing of the components than in the other two cases.

Figure 8. ( $a$) Volumetric evolutions of a sessile droplet, a pendent droplet and a droplet on a lubricated surface. (
 $b$) Scaled droplet volume
  $\hat {V} = (V - V_f)/(V_0 - V_f)$ as a function of scaled time
  $\hat {t} = t/\tau _c$.
4.3. Evaporative flux profile and modified diffusion model
To further quantify the mass transfer process, we first use the Sherwood number  $Sh$ derived by Dietrich etal. (Reference Dietrich, Wildeman, Visser, Hofhuis, Kooij, Zandvliet and Lohse2016) in a diffusion-limited case, and extend it to a mixture system by including Raoult's law and activity coefficient:
 \begin{equation} Sh = \frac{\langle\dot{M}\rangle_A R_{eq}}{D(a_w c_{w,s}^{0}-c_{w,\infty})}, \end{equation}
where  $\langle \dot {M}\rangle _A$ is the actual mass loss rate (measured in experiments), averaged over the droplet surface area
  $A$, and
  $R_{eq} = (3V/(2{\rm \pi} ))^{1/3}$ is the equivalent radius. For sessile droplets, if the mass transfer occurs purely via diffusion, the Sherwood number is (Dietrich etal. Reference Dietrich, Wildeman, Visser, Hofhuis, Kooij, Zandvliet and Lohse2016)
 \begin{equation} Sh_d = \frac{f(\theta)}{\sin\theta \left(1 + \tan^2\dfrac{\theta}{2}\right) \left(\dfrac{2}{2-3\cos\theta + \cos^3\theta}\right)^{1/3}},\end{equation}
which depends only on the droplet contact angle  $\theta$. Note that the Sherwood number here scales mass transfer with respect to a diffusive spherical droplet.
In figure 9, we plot the experimental data for the three cases by rescaling them based on (4.4) with an assumption that the mixture liquid components distribute homogeneously. The overestimation of the Sherwood number following from the single-component diffusive model (black curve) as compared to the experiments indicates that the assumption of homogeneous mixing does not hold for the three cases, which clearly is due to the segregation of 1,2-hexanediol. Specifically, for both sessile (blue squares) and pendent (red squares) droplets, the experimental data and theoretical model show good agreement at the beginning of the evaporation process and they deviate from each other later on. The reason for this deviation is that the distribution of compositions is no longer homogeneous when segregation of 1,2-hexanediol occurs, i.e. the assumption of an evenly mixed system overestimates the local concentration of water on the surface. For the droplet on a lubricated surface (yellow squares), the model overpredicts the evaporation rate for the whole process, even from the very beginning. This is due to the fact that the non-volatile oil meniscus hinders the evaporation of water near the contact line during the entire droplet lifetime.

Figure 9. Sherwood number as a function of contact angle of a sessile droplet (blue), a pendent droplet (red) and a droplet on a lubricated surface (yellow). The black solid line represents the theoretical Sherwood number  $Sh_d$, which is described by (4.5).
To get a quantitative description of the evaporation rate in the mixture droplets, we further modify the mixture model (4.1) by considering the effect of segregation patterns on the evaporative flux profile of each droplet. For the first two cases, as sketched in figure 10( $a{\rm i},\!a{\rm ii}$), the hindrance of the local evaporative flux originates from the non-volatile 1,2-hexanediol segregation. In the limit of small contact angle (
 $\theta < 40^\circ$), the local evaporative flux on the drop–air interface can be described as
  $j(r,\theta ) \sim (R_s - r)^{-{({\rm \pi} -2\theta )}/{(2{\rm \pi} - 2\theta )}}$, which is maximal at
  $r = R_s$ (Deegan etal. Reference Deegan, Bakajin, Dupont, Huber, Nagel and Witten1997; Sobac & Brutin Reference Sobac and Brutin2014), where
  $R_s$ is the distance between the centre of the droplet and the front of the segregation. Hence we obtain the total evaporative flux of the droplet with segregation by replacing
  $R$ with
  $R_s$ in (4.1):
 \begin{equation} \frac{\textrm{d}M}{\textrm{d}t} = \int^{R_s}_{0} j(r,\theta)\sqrt{1+(\partial_rh)^2}\,2{\rm \pi} r\,\textrm{d} r = -{\rm \pi} DR_s(a_w c_{w,s}^{0}-c_{w,\infty})f(\theta_s), \end{equation}
where  $\theta _s$ is the tangential angle at the front of the segregation (see figure 10
 $a{\rm i}$). As the angle is small,
  $0 \leq \theta _s \leq 40^\circ$, we approximate
  $f(\theta _s) \approx 4/{\rm \pi}$ (Hu & Larson Reference Hu and Larson2002; Sobac& Brutin Reference Sobac and Brutin2011) in our calculation for convenience. This approximation was shown to be appropriate in colloidal suspension droplets with similar configurations (Sobac & Brutin Reference Sobac and Brutin2014).

Figure 10. Schematic view of the evaporation of ( $a{\rm i}$) a sessile droplet, (
 $a{\rm ii}$) a pendent droplet and (
 $a{\rm iii}$) a droplet on a lubricated surface. (
 $b{\rm i}$–
 $b{\rm iii}$) Temporal evaporation rate of each droplet in (
 $a{\rm i}$–
 $a{\rm iii}$), respectively, during the evaporation process. The black solid line represents the prediction of the theoretical model.
In order to calculate  $R_s$, the volume of the segregated liquid is required. From the confocal imaging, we observe an almost instantaneous segregation of 1,2-hexanediol. Hence we assume that the water mostly depletes in the segregation region (the yellow part in figure 10
 $a{\rm i}$) and remains nearly constant in the mixture region (the blue part in figure 10
 $a{\rm i}$). The mass in the segregation region
  ${\rm \Delta} M_s$ can be calculated by multiplying the volume of the region
  ${\rm \Delta} V_s$ and the density of 1,2-hexanediol
  $\rho _H$:
 \begin{equation} {\rm \Delta} M_s = \rho_H {\rm \Delta} V_s = \rho_H \int^{R}_{R_s} 2{\rm \pi} rh(r)\,\textrm{d} r =\frac{{\rm \pi} \theta}{4R} (R^2-R^2_s )^2, \end{equation}
where  $h(r) = ((R^2-r^2)/(2R))\theta$ is the local height calculated from the parabolic approximation at distance
  $r$ from the centre of the droplet. The separated 1,2-hexanediol is caused by the depletion of water,
  ${\rm \Delta} M_w = \rho _w {\rm \Delta} V$, where
  ${\rm \Delta} V$ is the volume loss measured from the experiment and
  $\rho _w$ is the density of water. According to the initial mass concentration of 1,2-hexanediol
  $C$, we then have
 \begin{equation} {\rm \Delta} M_s = \frac{C}{1-C}{\rm \Delta} M_w = \frac{C}{1-C}\rho_w{\rm \Delta} V. \end{equation}
By combining (4.7) and (4.8), we obtain
 \begin{equation} R_s = R\left(1-\sqrt{{\rm \Delta} V\frac{C}{1-C}\frac{\rho_w}{\rho_H}\frac{4}{{\rm \pi} \theta R^3}}\right)^{1/2}. \end{equation}
 By substituting (4.9) into (4.6), we can theoretically calculate the evaporation rate without any adjustable parameters. Note that we approximate  $a_w(X_w)$ by taking the initial water mole fraction
  $X_w$ as a constant for the whole process. For the third case where the droplet evaporates on the thin film, the evaporative flux profile is changed by the hindrance of the oil wetting ridge. As shown in figure 10(
 $a{\rm iii}$), the evaporative flux profile is identical to the first two cases: it is maximal at the drop–oil–air contact line. Therefore, the total evaporation flux rate can also be described by (4.6). Then
  $R_s$ is the horizontal distance from the centre of the droplet to the triple-phase contact line. We can measure
  $R_s$ by determining the position of the triple-phase contact line from the bottom-view image, as shown in figure 6(
 $a$). We use
  $a_w(X_w)$ with a temporal water mole fraction
  $X_w$ calculated from the volumetric measurement.
In figure 10( $b{\rm i}$–
 $b{\rm iii}$), we show the measured evaporation rate corresponding to each case and compare them with the theoretical prediction by (4.6). For both sessile and pendent droplets (figure 10
 $b{\rm i}$–
 $b{\rm ii}$), the experimental data and theoretical model show good agreement for a large part of the process and deviate from each other only in the late stage of the lifetime. The main reason for this deviation at the very end of the evaporation process is that the water entrapped by the segregation of 1,2-hexanediol does not homogeneously distribute in the droplet, i.e. the assumption of an evenly mixed system overestimates the local concentration of water on the surface. For the droplet on a lubricated surface, the model gives a good description of the evaporation rate.
Finally, note that, in the second half of the lifetime, the model underestimates the evaporation rate. This can be explained by the fact that, near the triple-phase contact line, the wetting edge is not thick enough to completely hinder the evaporation of water. Water can still evaporate into the air in that region by first diffusing through the thin layer of oil.
5. Summary and outlook
In this work, we experimentally studied the evaporation behaviour of a silicone-oil-seeded 1,2-hexanediol–water droplet. The observation shows an instantaneous segregation of 1,2-hexanediol in the sessile droplet followed by the formation of plumes of the segregated fluid. By orientating the droplet upside down, the absence of plumes indicates that the observed instability is indeed controlled by gravity, confirming the interpretation as a Rayleigh–Taylor instability. We have shown that through hindering the strong evaporation near the contact line by segregation of non-volatile 1,2-hexanediol, the Marangoni effect can be significantly suppressed, thus allowing the buoyancy force to play a dominant role in the flow structure. Following the idea of suppressing evaporation locally by coverage with a non-volatile component, we can manipulate the segregation to start preferentially from the top rather than the edge of the droplet by letting the droplet evaporate on a lubricated surface.
Since the evaporation of droplets shows complex physicochemical behaviour, i.e. segregation of 1,2-hexanediol, it is difficult to obtain knowledge of the local concentration. We theoretically apply a scaling analysis to the experimental investigation of droplets in three cases, namely a sessile droplet, a pendent droplet and a droplet on a lubricated surface. This shows different evaporation modes of contact line behaviour in each case. By comparing the measurement of the evaporation rate with the multicomponent-diffusion model, we show that the segregation of the non-volatile component significantly delays the evaporation of water and even leads to entrapment of water in the residue of the droplets.
To the best of our knowledge, this work is the first observation of the Rayleigh–Taylor instability in a microdroplet system triggered by evaporation. It is another example showing that Rayleigh convection can overcome Marangoni effects to control the flow structure in a milli-sized droplet with  $Bo<1$. As we have demonstrated that the mixing effect is highly influenced by the flow pattern, our findings may be crucial for many applications involving uniform surface coating and particle assembly. We have also shown that such a surprising phenomenon can be triggered by various different seeding oils, even at very low concentrations. We think that it is important for the community to realize that during evaporation processes that involve several different components, each component – even in minute amounts – may dramatically influence the overall behaviour.
Moreover, droplets need not always evaporate on a solid surface: there are many applications involving droplets drying on lubricated surfaces. In particular, in the inkjet printing process, a primary layer is printed on surfaces prior to the deposition of ink drops, in order to destabilize the pigments to improve the print quality (Hack etal. Reference Hack, Costalonga, Segers, Karpitschka, Wijshoff and Snoeijer2018). Our study of a silicone-oil-seeded mixture droplet evaporating on a lubricated surface provides an effective way to manipulate the segregation in such drying systems by utilizing the non-volatile meniscus to impede the evaporation from the edge.
Many questions still remain open. The difficulty to accurately predict the droplet lifetime originates from the lack of means to accurately monitor the local distribution of the liquid components. The complexity arises not only from the segregation of 1,2-hexanediol, but also from the later plume formation. How does one predict the onset of the Rayleigh–Taylor instability in this geometry of a spherical cap? Does the unstable wavelength between the plumes depend on the size or the contact angle of the droplets? To answer these questions, further studies on the parameter space are worthwhile. By considering the limitation of experimental measurements, a detailed insight may even require numerical simulations.
Acknowledgments
We thank P. Lv for inspiring discussions. We also thank the anonymous referees for their helpful suggestions to improve this paper. This work is part of an Industrial Partnership Programme (IPP) of the Netherlands Organization for Scientific Research (NWO). This research programme is co-financed by Canon Production Printing Holding B.V., University of Twente and Eindhoven University of Technology. D.L. gratefully acknowledges support by his ERC Advanced Grant DDD (project number 740479).
Declaration of interests
The authors report no conflict of interest.
Supplementary movie
Supplementary movie is available at https://doi.org/10.1017/jfm.2020.449.
Appendix A. Derivation of theoretical final volume
The molar fraction of water in a binary mixture is defined as the number of moles of water divided by the number of moles of both liquids. Here we neglect the tiny mole fraction ( ${<}0.1$ %) of silicone oil. The mole fraction of water is
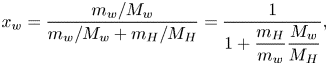 \begin{equation} x_w = \frac{m_w/M_w}{m_w/M_w + m_H/M_H} = \frac{1}{1 + \dfrac{m_H}{m_w}\dfrac{M_w}{M_H}}, \end{equation}
where  $m_w$ is the mass of water and
  $m_H$ is the mass of 1,2-hexanediol. Here we assume that the density of the mixture is linear with the solute concentration, which means that the total volume of the mixture is the sum of the individual liquid volumes (Battino Reference Battino1971). This is a reasonable approximation for 1,2-hexanediol–water mixtures. Then the initial density is given by
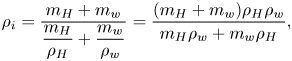 \begin{equation} \rho_{i} = \frac{m_H + m_w}{\dfrac{m_H}{\rho_H} + \dfrac{m_w}{\rho_w}} = \frac{(m_H + m_w)\rho_H \rho_w}{m_H \rho_w + m_w \rho_H}, \end{equation}
where  $\rho _i$ is the initial density of the mixture, and
  $\rho _H$ and
  $\rho _w$ are the density of 1,2-hexanediol and water, respectively. We introduce the initial mass percentage
  $C$ of the solute, whose value can be between 0 and 1. Then we have
 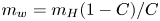 $m_w = m_H(1-C)/C$ at the beginning before evaporation. By substituting this into (A 2), the equation reduces to
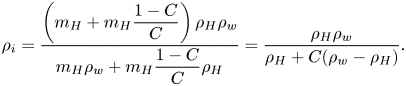 \begin{equation} \rho_{i} = \frac{\left(m_H + m_H\dfrac{1-C}{C}\right)\rho_H \rho_w} {m_H \rho_w + m_H\dfrac{1-C}{C} \rho_H} = \frac{\rho_H \rho_w}{\rho_H + C(\rho_w - \rho_H)}.\end{equation}
The 1,2-hexanediol mass in the droplet is now given by  $V_i \rho _i C$, which is constant during the drying process due to the non-volatility of 1,2-hexanediol. Volume
  $V_i$ is defined as the initial droplet volume. Therefore the amount of water that has evaporated is given by
  $(V_i - V)\rho _w$, and the total mass of water left in the droplet is the initial mass minus the evaporated mass,
  $V_i \rho _i (1 - C) - (V_i - V)\rho _w$. By substituting the water mass into (A 1), the mole fraction of water in the droplet is expressed as
 \begin{equation} x_w = \frac{1}{1 + \dfrac{V_i\rho_i C}{V_i\rho_i(1 - C) - (V_i - V)\rho_w}\dfrac{M_w}{M_H}}. \end{equation}
 From the theory, it is predicted that the droplet stops evaporating at the moment when the active mole fraction of water is equal to the relative humidity of the surrounding air,  $a_w = \psi _w x_w = RH$. Then we obtain the theoretical final mole fraction
  $x_w = RH/\psi _w$, where
  $RH$ and
  $\psi _w$ are the relative humidity and activity coefficient of water (Marcolli & Peter Reference Marcolli and Peter2005), respectively. By substituting
  $x_w$ into (A 4), we can analytically calculate the theoretical final volume
  $V_f$ as
 \begin{equation} V_f = \left(\frac{M_w}{M_H}\frac{RH}{\psi_w - RH} + \frac{\rho_w}{\rho_H}\right)\left(\frac{1 - C}{C} + \frac{\rho_w}{\rho_H}\right)^{-1} V_0.\end{equation}


 Open access