


1. Introduction
The wetting phenomena of liquids sitting on top of solid substrates have attracted great scientific attention in past decades (De Gennes Reference De Gennes1985; Bonn Reference Bonn2001; Quéré Reference Quéré2008; Yuan & Lee Reference Yuan and Lee2013; Mitra et al. Reference Mitra, Nguyen, Doroodchi, Pareek, Joshi and Evans2016; Wang et al. Reference Wang, Orejon, Takata and Sefiane2022; Wang, Wu & Nestler Reference Wang, Wu and Nestler2023). The scientific significance of the wetting phenomenon lies in its natural importance, such as lotus effect (Marmur Reference Marmur2004) and coffee-ring pattern (Deegan et al. Reference Deegan, Bakajin, Dupont, Huber, Nagel and Witten1997), as well as the broad technical applications, e.g. inkjet printing in printed electronics (Määttänen et al. Reference Määttänen, Ihalainen, Bollström, Toivakka and Peltonen2010). It appears that in most previous studies (Cahn Reference Cahn1977; De Gennes Reference De Gennes1985; Puri & Binder Reference Puri and Binder1994; Jacqmin Reference Jacqmin2000; Tanaka Reference Tanaka2001; Sefiane, David & Shanahan Reference Sefiane, David and Shanahan2008; Badillo Reference Badillo2015; Zhang, Tang & Wu Reference Zhang, Tang and Wu2022b), one-component liquids or binary fluids have been focused on regarding the investigation of wetting phenomena, such as water on top of a solid substrate (Wenzel Reference Wenzel1936). However, in most realistic circumstances, the liquid droplet involved in the wetting effect contains more than one component. Typical examples are a water–coffee droplet and an inkjet printing droplet including several components of electrolytes (Turkoz et al. Reference Turkoz, Perazzo, Kim, Stone and Arnold2018; Cadilha Marques et al. Reference Cadilha Marques, Weller, Erozan, Feng, Tahoori and Aghassi-Hagmann2019). Moreover, in some cases (Attinger, Zhao & Poulikakos Reference Attinger, Zhao and Poulikakos2000; Govor et al. Reference Govor, Reiter, Bauer and Parisi2004), the components in the droplet are immiscible with each other, such as water–oil (Tan et al. Reference Tan, Diddens, Lv, Kuerten, Zhang and Lohse2016). These situations are within the scope of the wetting phenomenon of multicomponent and multiphase systems, which have not yet been fully addressed in the literature, although some recent efforts have been devoted to this direction (Wang et al. Reference Wang, Reiter, Kellner, Brillo, Selzer and Nestler2018; Bala et al. Reference Bala, Pepona, Karlin, Kusumaatmaja and Semprebon2019; Aland & Auerbach Reference Aland and Auerbach2021; Chen et al. Reference Chen, Shu, Liu and Zhang2021; Yuan et al. Reference Yuan, Shi, Zhan and Chai2022). In this work, we aim to develop a model for the wetting effect of fluids containing three components and discuss two scenarios in which the components are miscible and immiscible.
For the wetting phenomenon of one- and two-component fluids, distinct types of models have been developed in the literature, such as sharp interface model (Chamakos et al. Reference Chamakos, Kavousanakis, Boudouvis and Papathanasiou2016; Du et al. Reference Du, Chamakos, Papathanasiou and Min2021), phase-field model (Yue & Feng Reference Yue and Feng2012; Ben Said et al. Reference Ben Said, Selzer, Nestler, Braun, Greiner and Garcke2014; Cai et al. Reference Cai, Marschall, Wörner and Deutschmann2015; Wu et al. Reference Wu, Wang, Selzer and Nestler2019b, Reference Wu, Wang, Ma, Selzer and Nestler2020, Reference Wu, Wang, Huang, Selzer and Nestler2022; Zhu et al. Reference Zhu, Kou, Yao, Li and Sun2020), lattice Boltzmann (Attar & Körner Reference Attar and Körner2009; Bala et al. Reference Bala, Pepona, Karlin, Kusumaatmaja and Semprebon2019), volume of fluid (Hirt & Nichols Reference Hirt and Nichols1981; Malgarinos et al. Reference Malgarinos, Nikolopoulos, Marengo, Antonini and Gavaises2014), level-set methods (Zheng & Zhang Reference Zheng and Zhang2000; Buscaglia & Ausas Reference Buscaglia and Ausas2011) and thin-film models (Thiele Reference Thiele2018). The sharp interface method has mathematically a zero interfacial thickness. The advantage of the sharp interface model lies in the direct application of physical principles. For instance, Young's law
 \begin{equation} \cos\theta=(\gamma_{\delta S}-\gamma_{\alpha S})/\gamma_{\alpha\delta} \end{equation}
is applied to determine the macroscopic equilibrium contact angle  $\theta$ at the triple junction of droplet–surrounding–substrate. Here, $\gamma _{\delta S}$, $\gamma _{\alpha S }$ and $\gamma _{\alpha \delta }$ are the interfacial tensions of surrounding–substrate, liquid–substrate and liquid–surrounding, respectively. Another example in the sharp interface approach is the application of Young–Laplace pressure
 \begin{equation} {\rm \Delta} P=\gamma_{\alpha\delta}/R \end{equation}
for the boundary condition at the droplet–surrounding interface, where the droplet is in equilibrium with the surrounding phase. The droplet radius is represented by  $R$ and its reciprocal denotes the mean curvature. However, the sharp interface model becomes less efficient when the droplet spreads and evaporates, where the interface and the triple junction move with time. In these cases, one has to make a huge effort to track the position of the interface as well as the triple junction to apply the corresponding boundary conditions. The sharp interface model seems to be tricky when it comes to multi-droplet scenarios where numerous interfaces need to be considered. In a second approach, the diffuse interface method is proved to be not only more efficient, but also more physically correct, as the droplet–surrounding interface is assigned a finite width, typically of the order of nanometres. To distinguish the droplet from the surrounding phase, the composition or the so-called phase-field order parameter $\phi$ is introduced which varies continuously from the equilibrium value in the droplet to that in the surrounding. Benefiting from the establishment of the free energy functional $\mathcal {F} (\phi, \boldsymbol {\nabla }\phi )$ for the diffuse interface model by Cahn (Cahn & Hilliard Reference Cahn and Hilliard1958), the equilibrium states in the bulk and on the substrate both are depicted by the minimization of the free energy functional of the system, which is calculated by the variational approach via the Euler–Lagrange equation:
 \begin{equation} \delta \mathcal{F}/\delta \phi=0. \end{equation}
For one-component phases within the diffuse interface model, this variational approach gives rise to the equilibrium wetting state which has been shown to be consistent with Young's law of the sharp interface model. Considering droplet kinetics before reaching equilibrium, two kinds of diffuse interface approaches, namely Allen–Cahn and Cahn–Hilliard models, have been successfully adopted in the literature to study the wetting effect of one-component phases (Ben Said et al. Reference Ben Said, Selzer, Nestler, Braun, Greiner and Garcke2014; Wu et al. Reference Wu, Wang, Selzer and Nestler2019b). In these methods for one-component phases or two-component systems, only one single phase-field variable  $\phi$ is necessary to depict the free energy functional of the system.
For multicomponent and multiphase systems, the droplet and surrounding can be dissolved with other components, but there is a paucity of literature studying the corresponding wetting phenomenon in detail. In a previous multiphase-field approach by Ben Said et al. (Reference Ben Said, Selzer, Nestler, Braun, Greiner and Garcke2014), the wetting phenomenon of  $\mathcal {N}$ immiscible phases ( $\mathcal {N}\geq 3$) was studied. The outstanding strength of this model lies in the utilization of the Allen–Cahn type of phase-field model in combination with the obstacle potential, which significantly reduces the computational time, allowing one to perform large-scale three-dimensional (3-D) simulations. The static wetting angle at the substrate has been captured based on the natural boundary condition. However, neither diffusion mechanism nor fluid dynamics is considered. Moreover, in this model, the Young–Laplace pressure has been overlooked. A recent work by Bala et al. (Reference Bala, Pepona, Karlin, Kusumaatmaja and Semprebon2019) based on the lattice Boltzmann model addressed the wetting effect of three immiscible fluid phases on a solid substrate. The wetting contact angles on the solid substrate have been described by three distinct methods. The difficulty of the multiphase and multicomponent approach for the diffuse interface model lies in the replication of the interfacial energies, since the paths for the free energy minimization on the free energy landscape are challenging to obtain analytically, as pointed out in Bala et al. (Reference Bala, Pepona, Karlin, Kusumaatmaja and Semprebon2019). Moreover, this study is only restricted to the two-dimensional (2-D) case, while the 3-D simulation turns out to be more realistic for taking the curvature of the third dimension into account, but indeed is more computationally time-expensive. Notably, these studies exclusively cover the wetting phenomenon of immiscible fluids. The previously mentioned circumstances are still not fully understood where the components are miscible, such as water–coffee or water–alcohol droplets.
Different diffuse interface models in the literature have been developed for the wetting effect of ternary fluids. From the aspect of thermodynamics, careful attention should be paid when extending the wetting model of binary fluids to the ternary case. Kim (Reference Kim2007) and Boyer et al. (Reference Boyer, Lapuerta, Minjeaud, Piar and Quintard2010) proposed a ternary phase-field method based on the Cahn–Hilliard model. The Cahn–Hilliard type of phase-field model is a kind of diffusion equation based on the chemical potential gradient rather than the composition gradient in Fick's law. In this way, in the Cahn–Hilliard model, the mass is naturally conserved. For a fluid with  $K$ components, the chemical potential has $K-1$ independent variables because of the constraint for the volume concentration $\sum _{j=1}^{K} \phi _{j}=1$ due to incompressibility. Most importantly, for multicomponent fluids, the chemical potentials are constrained by the Gibbs–Duhem relation (Alhasan & Tree Reference Alhasan and Tree2022), which leads to a thermodynamically consistent mobility consistent with the Onsager theorem (Balluffi, Allen & Carter Reference Balluffi, Allen and Carter2005), as is demonstrated in the current work. This is in contrast to the case of constant mobility (Kim Reference Kim2007; Boyer et al. Reference Boyer, Lapuerta, Minjeaud, Piar and Quintard2010). The thermodynamic consistency due to the Gibbs–Duhem relation is in contrast to the Lagrange multiplier approach for the chemical potentials adopted in Kim (Reference Kim2007) and Boyer et al. (Reference Boyer, Lapuerta, Minjeaud, Piar and Quintard2010). As demonstrated by Jacqmin (Reference Jacqmin1996) for binary fluids and shown in the following for ternary fluids, the chemical potential plays a key role in the thermodynamic pressure, which contributes to the capillary force together with the Kortweg stress in the Navier–Stokes equation. The occurrence of the Kortweg stress and the thermodynamic pressure for multicomponent and multiphase fluids is a key difference from the one-component and one-phase Navier–Stokes flow. Only if the thermodynamic pressure is validated is the subsequent fluid dynamics for multicomponent fluids physically justified. As pointed out by Jacqmin (Reference Jacqmin2000), the pressure of a two-phase flow is different from the so-called ‘true pressure’ of one-phase flow. However, the validation of the fluid statics for the thermodynamic pressure of ternary fluids is scarce in the literature. In addition, the solid–liquid interaction, namely the wetting effect of liquid on solid, is not considered in Kim (Reference Kim2007) and Boyer et al. (Reference Boyer, Lapuerta, Minjeaud, Piar and Quintard2010). By considering the wetting boundary condition, an Allen–Cahn type of phase-field model for ternary fluids has been developed by He et al. (Reference He, Li, Huang, Hu, Li and Wang2020) and Jain, Mani & Moin (Reference Jain, Mani and Moin2020). As aforementioned, the advantage of the second-order Allen–Cahn model is its computational efficiency compared with the fourth-order Cahn–Hilliard model. However, the mass is not conserved in the Allen–Cahn model because of the curvature effect. Different ways have been adopted to amend this deficiency (Jeong & Kim Reference Jeong and Kim2017; Aihara, Takaki & Takada Reference Aihara, Takaki and Takada2019; Wu et al. Reference Wu, Wang, Selzer and Nestler2019a; Yang & He Reference Yang and He2022). One way is, for example, to remove the mean curvature in the evolution equation (He et al. Reference He, Li, Huang, Hu, Li and Wang2020, Reference He, Huang, Xu, Hu and Li2023). In this way, the thermodynamic pressure and the chemical potential in terms of the mean curvature (consequently in the capillary force) are overlooked; the real dynamics of the Allen–Cahn model should be different from that of the Cahn–Hilliard model. Mathematically, the Allen–Cahn model follows the energy dissipation law for $L^{2}$ gradient flow and the Cahn–Hilliard model obeys the energy dissipation law for the $H^{-1}$ gradient flow.
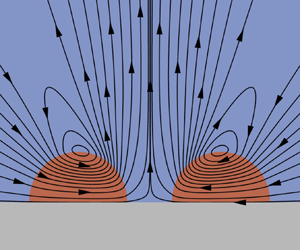
The dynamics of wetting has attracted great interest in the community of fluid dynamics. The diffuse interface model for the wetting dynamics of binary fluids dates back to the work of Jacqmin (Reference Jacqmin2000), Cahn (Reference Cahn1977) and De Gennes (Reference De Gennes1985). This diffuse interface model is based on the Cahn–Hilliard–Navier–Stokes equation. As demonstrated in Jacqmin (Reference Jacqmin2000), only numerical solution in two and three dimensions is possible even if this model is simplified to the Laplace equation for the chemical potential and the bi-harmonic equation for the stream function when the contact angle is 90 $^\circ$ and the viscosity ratio is 1. In the last 20 years, many other diffuse interface models (Ding & Spelt Reference Ding and Spelt2007; Carlson, Do-Quang & Amberg Reference Carlson, Do-Quang and Amberg2009; Yue, Zhou & Feng Reference Yue, Zhou and Feng2010; Sui, Ding & Spelt Reference Sui, Ding and Spelt2014; Prokopev, Vorobev & Lyubimova Reference Prokopev, Vorobev and Lyubimova2019; Huang, Lin & Ardekani Reference Huang, Lin and Ardekani2020; Gallo, Magaletti & Casciola Reference Gallo, Magaletti and Casciola2021) for the wetting effect are based on Jacqmin's approach. However, a significant difference of Jacqmin's approach from that of Cahn (Reference Cahn1977) and De Gennes (Reference De Gennes1985) is the surface composition. The surface composition is engendered by the joint equilibrium of bulk and surface and obtained somehow by the intersection of the wall free energy with the bulk free energy. In Jacqmin's approach, the minima of the wall free energy are always identical to that of the bulk free energy, which leads to the same surface and bulk compositions. However, in Cahn/de Gennes methods, the surface composition differs from the bulk composition. The surface composition gives rise to an additional contribution to the interface energies (De Gennes Reference De Gennes1985), making the situation more complex but indeed more generalized. Only a binary numerical model considers the effect of the surface composition on the wetting effect (Wang & Nestler Reference Wang and Nestler2021) and, to the best knowledge of the authors, no ternary model so far takes the surface composition into account. Moreover, it has been shown that the Marangoni flow plays a vital role in the dynamics of wetting (Wang et al. Reference Wang, Orejon, Takata and Sefiane2022). Because of the singularity at the triple junction (Huh & Scriven Reference Huh and Scriven1971), it seems to be difficult for the sharp interface model to address the Marangoni effect in the process of dynamic wetting. Using a diffuse interface model, we present distinct flow patterns of dynamic wetting in comparison with the analysis of Huh & Scriven (Reference Huh and Scriven1971) and cast light on the Marangoni effect for dynamic wetting.
We develop a ternary phase-field model for the wetting phenomenon of droplets which contain either two miscible or three immiscible components. For the miscible case, we designate two kinds of phase diagrams, namely a symmetric and an asymmetric one, to emphasize the crucial impact of different thermodynamics for the sessile droplets. By varying the composition and the size of the droplet, we validate the present model by comparing the simulation results with Young's law in both two and three dimensions, as well as with the Young–Laplace relationship. Our present results show that the initial composition in combination with the phase diagram leads to different paths of free energy minimization, which engenders distinct wettabilities of the fluids on a solid substrate. Our model also allows one to scrutinize the surface composition, enabling one to relate the interfacial energies with the composition. In the case of miscible fluids, we further study the process of evaporation to be compared with the power law observed in experiments. Furthermore, we consider three immiscible fluids with different wettabilities on the substrate in both two and three dimensions. A similar consideration for the phase diagram of ternary fluids has been published by He et al. (Reference He, Li, Huang, Hu, Li and Wang2020). However, this work is based on the Allen–Cahn model via removing the mean curvature in the evolution equation, which is in contrast to the thermodynamically consistent Cahn–Hilliard model. The thermodynamic pressure as well as the dynamics which is important for the flow patterns of dynamic wetting should be intrinsically different although both models reduce the energy of the system.
The rest of the paper is structured as follows. In § 2, we review the Cahn/de Gennes wetting models for a two-component and two-phase system. In § 3, we present phase diagrams for miscible and immiscible fluids. In § 4, we derive the bulk and surface equilibrium conditions. Based on the results in § 4, we show the calculation of the interfacial energies in § 5. In § 6, we depict the kinetic equations based on the Cahn–Hilliard model and its coupling with the Navier–Stokes equations. In § 7, we present criteria for calculating the contact angles. In § 8, we present the effect of the droplet composition on the contact angle for different types of phase diagrams shown in § 3, and validate the surface composition. In § 9, we study the process of evaporation with different saturation rates. In §§ 10 and 11, we validate the present model for fluid statics and fluid dynamics. In § 12, we show the simulation results for three immiscible fluids. We conclude the paper in § 13.
2. Cahn/de Gennes model for two-component two-phase flow
For a system with two components and two immiscible phases, the free energy functional is written as (Cahn Reference Cahn1977; De Gennes Reference De Gennes1985)
 \begin{equation} \mathcal{F}(\phi,\boldsymbol{\nabla}\phi)= \int_\varOmega \left[f(\phi) + \kappa(\nabla \phi)^{2} \right] {\rm d}\varOmega + \int_{S} \varGamma(\phi)\,{\rm d} S,\quad \forall\ \boldsymbol x \in \varOmega \cup S, \end{equation}
where the bulk free energy density  $f(\phi )$ as a function of the composition $\phi$ has two local minima (equilibrium states) at $\phi _{e}^{\delta }$ and $\phi _{e}^{\alpha }$ to model two immiscible fluids. The composition $\phi$ is space $\boldsymbol x$ and time $t$ dependent defined on the bulk domain $\varOmega$ and the solid substrate $S$. Typical examples for the free energy density are double-well potential (Jacqmin Reference Jacqmin2000), obstacle potential (Nestler, Garcke & Stinner Reference Nestler, Garcke and Stinner2005) or the regular solution model (Wang et al. Reference Wang, Choudhury, Selzer, Mukherjee and Nestler2012). The interface tension $\gamma _{\alpha \delta }$ of the immiscible liquids is calculated by
 \begin{equation} \gamma_{\alpha\delta}=\int_{{X}} \left[{\rm \Delta} f+ \kappa(\nabla \phi)^{2} \right]{\rm d} X, \end{equation}
where the excess energy density  ${\rm \Delta} f$ is defined as $f(\phi )-f(\phi _{e}^{\alpha })-\mu ^{e}(\phi -\phi _{e}^{\alpha })$, $\mu ^{e}$ representing the chemical potential at equilibrium, and $X$ traces the integration path from the bulk of the droplet to the surrounding bulk region.
The second part of (2.1) describes the wall free energy whose density  $\varGamma (\phi )$ is an interpolation over the individual interfacial tensions:
 \begin{equation} \varGamma(\phi)= \gamma_{\alpha S} h(\phi) + \gamma_{\delta S} [1-h(\phi)],\quad \forall\ \boldsymbol x \in S, \end{equation}
where the interpolation function  $h(\phi )$ fulfils $h(\phi _{e}^{\alpha })=1$ and $h(\phi _{e}^{\delta })=0$. By this interpolation, the liquid–substrate interfacial energy is $\gamma _{\alpha S}$, when the liquid composition is $\phi =\phi _{e}^{\alpha }$; and the surrounding–substrate interfacial energy is $\gamma _{\delta S}$, when the surrounding composition is $\phi =\phi _{e}^{\delta }$. Various formulations for $h(\phi )$ have been used in previous literature (Carlson et al. Reference Carlson, Do-Quang and Amberg2009; Diewald et al. Reference Diewald, Kuhn, Blauwhoff, Heier, Becker, Werth, Horsch, Hasse and Müller2016; Xu Reference Xu2016; Wu et al. Reference Wu, Wang, Selzer and Nestler2019b). Apart from the interpolation concept over individual interfacial tensions, a second-order polynomial has been used (Cahn Reference Cahn1977; De Gennes Reference De Gennes1985):
 \begin{equation} \varGamma(\phi)=a_{0} + a_{1} \phi+\frac{a_{2}}{2}\phi^{2},\quad \forall\ \boldsymbol x \in S. \end{equation}
Here,  $a_{0}$, $a_{1}$ and $a_{2}$ depict the attractive and repulsive interactions between the liquid and the substrate. A significant difference between (2.3) and (2.4) is that in the former case, the effective interfacial energies $\gamma _{\delta S}$ and $\gamma _{\alpha S}$ are independent of surface composition. While in the latter case, $\gamma _{\alpha S}$ and $\gamma _{\delta S}$ depend on the surface composition $\phi _{S}^{a}$ ( $a = \alpha$, $\delta$), which is determined by a series of partial differential equations resulting from the joint equilibrium of the bulk and the surface as
 \begin{equation} 2\kappa \nabla^{2} \phi = f^\prime(\phi) \quad \forall \boldsymbol x\in\varOmega;\quad 2\kappa \boldsymbol{\nabla} \phi \boldsymbol{\cdot} \boldsymbol n =\varGamma^\prime(\phi) \quad \forall\ \boldsymbol x\in S, \end{equation}
where  $\boldsymbol n$ is the normal vector of the solid substrate. After simplification, we obtain the following implicit equation for the surface composition $\phi _{S}^{a}$:
 \begin{equation} 2\sqrt{\kappa {\rm \Delta} f}=\varGamma^\prime(\phi),\quad \forall\ \boldsymbol x \in\varOmega\cap S, \end{equation}
where the left-hand side is typically a ‘W’-shaped curve (see supplementary figure S1 available at https://doi.org/10.1017/jfm.2023.561) and the right-hand side is a linear function of  $\phi$ if (2.4) is applied. The intersection of the two curves $2\sqrt {\kappa {\rm \Delta} f}$ and $\varGamma ^\prime (\phi )$ determines the surface composition $\phi _{S}^{\alpha }$ and $\phi _{S}^{\delta }$ (see figure S1). In this way, the interfacial energies have two contributions: one is the wall free energy density $\varGamma (\phi _{S}^{a})$ ( $a=\alpha$, $\delta$) and the other one is the excess free energy which is calculated by an integration from the surface composition $\phi _{S}^{a}$ to the bulk composition $\phi _{e}^{a}$. This result is in contrast to the independence of the interfacial energies on the surface composition if (2.3) is applied. The interfacial energies with the excess free energy at the solid–liquid interface represent a large difference of Cahn's approach from Jacqmin's wetting model (Jacqmin Reference Jacqmin2000). For fluids with three components, the variation of the wettabilities due to the occurrence of the surface composition is much more complex than the binary case and is examined in the following.
3. Model of ternary fluids
We consider a fluid mixture consisting of three components, of which the compositions are denoted by  $\boldsymbol \phi = (\phi _{1}(\boldsymbol x, t), \phi _{2}(\boldsymbol x, t), \phi _{3}(\boldsymbol x, t))$. The compositions are space $\boldsymbol x$ and time $t$ dependent and are restricted within the Gibbs simplex $G=\{ \boldsymbol {\phi }\in \mathbb {R}^{3}:\sum _{j=1}^{3}\phi _{j}=1, \phi _{j}\geq 0 \}$ in accordance with the assumption of incompressible fluids. This constraint results from the definition of the volume concentration $\phi _{i}=v_{i}^{o}/v_{m}$, where $v_{i}^{o}$ and $v_{m}$ are the molar volumes of the $i$ component and the mixture, respectively. By the Flory–Huggins model (Flory Reference Flory1953), the free energy density of the system is formulated as a function of temperature $T$ and composition $\boldsymbol \phi$ as
 \begin{equation} f(\boldsymbol\phi,T)= (R_{g}T/v_{m}) \left(\sum_{j=1}^{3} \frac{\phi_{j}\ln \phi_{j}}{N_{j}}+ \sum_{j< k}\chi_{jk} \phi_{j} \phi_{k}+\sum_{j< k< l}\chi_{jkl}\phi_{j}\phi_{k}\phi_{l}\right),\quad \forall\ \boldsymbol x \in \varOmega, \end{equation}
where the first logarithm term denotes entropy contribution and the last two polynomial terms are related to the enthalpy of the mixture. The Flory–Huggins parameters  $\chi _{jk}$ depict the double interaction between species $j$ and $k$, while $\chi _{jkl}$ scales the more complex triple interaction between all three species $j$,
$j$,  $k$ and $l$ (Zhang et al. Reference Zhang, Wu, Wang, Guo and Nestler2021). Especially for distinct polymer species, the entropy of the mixture can be altered by the degree of polymerization $N_{j}$ which, otherwise, is set to unity for very small molecular species, such as water or metal. In this work, the selection criteria for the interaction parameters $\chi _{jk}$ and $\chi _{jkl}$, the temperature $T$ as well as $N_{j}$ are made to model two different situations:
(S1) Two phases consisting of component 1 and component 2 are completely miscible, forming an $\alpha$ phase droplet, like water–alcohol or water–coffee. Meanwhile, the $\alpha$ phase is immiscible with the component-3-rich $\delta$ phase, like vapour. For two phases in equilibrium, as demonstrated in figures 1(I) and 1(II), there are two local minima in the free energy landscape. These two free energy minima states respectively represent the droplet of $\alpha$ phase and the $\delta$ surrounding phase. The equilibrium compositions $\boldsymbol \phi _{{e}}^{\alpha }=( \phi _{1}^{\alpha }, \phi _{2}^{\alpha }, \phi _{3}^{\alpha })$, $\boldsymbol \phi _{e}^{\delta }=(\phi _{1}^{\delta }, \phi _{2}^{\delta }, \phi _{3}^{\delta })$ between the immiscible $\alpha$ and $\delta$ phases are defined by the common tangent construction as
(3.2)\begin{gather} \boldsymbol\mu^{e}\equiv(\mu_{1}^{e},\mu_{2}^{e},\mu_{3}^{e}) = \left.\frac{\partial f}{\partial \boldsymbol\phi}\right\rvert_{\boldsymbol\phi=\boldsymbol \phi_{e}^{\alpha}} =\left.\frac{\partial f}{\partial \boldsymbol\phi}\right\rvert_{\boldsymbol\phi=\boldsymbol \phi_{e}^{\delta}}; \end{gather}(3.3)Here,\begin{gather}f(\boldsymbol \phi_{e}^{\alpha})-f(\boldsymbol \phi_{e}^{\delta})= \langle \boldsymbol\mu^{e}, \boldsymbol \phi_{e}^{\alpha}-\boldsymbol \phi_{e}^{\delta} \rangle, \quad \forall\ \boldsymbol x \in \varOmega. \end{gather}$\mu _{i}^{e}$, $i=1, 2, 3$, denotes the equilibrium chemical potential of component $i$ and $\langle \ \rangle$ is the dot product operator. Equations (3.2) and (3.3) are solved by the Newton iteration method and the equilibrium compositions are illustrated by the black solid lines in figure 1. The difference of figure 1(I) from figure 1(II) is that the miscibility of components 1 and 2 is symmetric with respect to the composition of $\phi _{2}=0.5$. In this case, the component 1 and 2 molecules have high similarity and their interaction with component 3 is identical. Figure 1(II) represents another case, where components 1 and 2 have different interaction parameters or degrees of polymerization ($N_{i}$). Consequently, the miscibility shifts to the side of the component-2-rich phase in figure 1(II).
$\alpha$ phase droplet, like water–alcohol or water–coffee. Meanwhile, the $\alpha$ phase is immiscible with the component-3-rich $\delta$ phase, like vapour. For two phases in equilibrium, as demonstrated in figures 1(I) and 1(II), there are two local minima in the free energy landscape. These two free energy minima states respectively represent the droplet of $\alpha$ phase and the $\delta$ surrounding phase. The equilibrium compositions $\boldsymbol \phi _{{e}}^{\alpha }=( \phi _{1}^{\alpha }, \phi _{2}^{\alpha }, \phi _{3}^{\alpha })$, $\boldsymbol \phi _{e}^{\delta }=(\phi _{1}^{\delta }, \phi _{2}^{\delta }, \phi _{3}^{\delta })$ between the immiscible $\alpha$ and $\delta$ phases are defined by the common tangent construction as
(3.2)\begin{gather} \boldsymbol\mu^{e}\equiv(\mu_{1}^{e},\mu_{2}^{e},\mu_{3}^{e}) = \left.\frac{\partial f}{\partial \boldsymbol\phi}\right\rvert_{\boldsymbol\phi=\boldsymbol \phi_{e}^{\alpha}} =\left.\frac{\partial f}{\partial \boldsymbol\phi}\right\rvert_{\boldsymbol\phi=\boldsymbol \phi_{e}^{\delta}}; \end{gather}(3.3)Here,\begin{gather}f(\boldsymbol \phi_{e}^{\alpha})-f(\boldsymbol \phi_{e}^{\delta})= \langle \boldsymbol\mu^{e}, \boldsymbol \phi_{e}^{\alpha}-\boldsymbol \phi_{e}^{\delta} \rangle, \quad \forall\ \boldsymbol x \in \varOmega. \end{gather}$\mu _{i}^{e}$, $i=1, 2, 3$, denotes the equilibrium chemical potential of component $i$ and $\langle \ \rangle$ is the dot product operator. Equations (3.2) and (3.3) are solved by the Newton iteration method and the equilibrium compositions are illustrated by the black solid lines in figure 1. The difference of figure 1(I) from figure 1(II) is that the miscibility of components 1 and 2 is symmetric with respect to the composition of $\phi _{2}=0.5$. In this case, the component 1 and 2 molecules have high similarity and their interaction with component 3 is identical. Figure 1(II) represents another case, where components 1 and 2 have different interaction parameters or degrees of polymerization ($N_{i}$). Consequently, the miscibility shifts to the side of the component-2-rich phase in figure 1(II).(S2) Three phases consisting of the three components 1, 2 and 3 are immiscible with each other (Zhang, Wang & Nestler Reference Zhang, Wang and Nestler2022a), for instance, a water–oil–vapour system. In this case, three local minima on the free energy landscape manifest the equilibrium compositions in each immiscible phase, as depicted by the black dots in the phase diagram of figure 1(III). For convenience, component 1-, 2- and 3-rich phases are called
$\alpha$, $\beta$ and $\delta$ phases, respectively.


Figure 1. Free energy density landscapes and phase diagram. (I,II) Miscible ternary system. The parameters for (I) are  $(N_{1}, N_{2}, N_{3}) = (2, 2, 1)$, $(\chi _{1},\chi _{2},\chi _{3}, \chi _{123})=(0.5, 3.5, 3.5, 1.5)$ and $T=2$. The parameters for (II) are $(N_{1}, N_{2}, N_{3}) = (5, 1, 1)$, $(\chi _{1},\chi _{2},\chi _{3}, \chi _{123})=(0.5, 6.0, 4.5, 1.5)$ and $T=2$. The black solid lines depict the binodal composition in the phase consisting of components 1 and 2 ( $\alpha$ phase) and in the component-3-rich phase ( $\delta$ phase). The dashed lines show the spinodal curves. (III) Immiscible ternary system with the simulation parameters $(N_{1}, N_{2}, N_{3}) = (1, 1, 1)$, $(\chi _{1},\chi _{2},\chi _{3}, \chi _{123})=(2.5, 2.5, 2.5, 4.0)$ and $T=2$. The equilibrium compositions in $\alpha$ (component-1-rich), $\beta$ (component-2-rich) and $\delta$ (component-3-rich) phases are illustrated by the black circles at the left, right and top positions, respectively. Colour legend: red for high free energy density values and blue for low values.
4. Bulk and surface thermodynamics
The free energy functional of the system reads
 \begin{equation} \mathcal{F}(\boldsymbol\phi, \boldsymbol{\nabla} \boldsymbol\phi) =\int_\varOmega \left[f(\boldsymbol\phi, T) + \sum_{j=1}^{3} \kappa_{j} (\nabla \phi_{j})^{2} \right] {\rm d}\varOmega + \int_{S} \varGamma(\boldsymbol\phi)\,{\rm d} S,\quad \forall\ \boldsymbol x \in \varOmega \cup S. \end{equation}
Here,  $\kappa _{i}$ stands for the gradient energy coefficient. Considering an $a$–
$a$– $b$ interface ( $a=\alpha$, $\beta$, $\delta$, $b=\alpha$, $\beta$, $\delta$, $a\neq b$),
 \begin{equation} \delta \mathcal{F}/\delta \boldsymbol\phi=\boldsymbol \mu^{e},\quad \forall\ \boldsymbol x \in \varOmega. \end{equation}
Substituting (4.1) into (4.2) yields the following coupled ordinary differential equations:
 \begin{equation} \mu_{i}^{e} = \partial f/\partial \phi_{i}-2\kappa_{i} \nabla^{2}\phi_{i},\quad \forall\ \boldsymbol x \in \varOmega,\quad i=1,2,3. \end{equation}
An integration of (4.3) with the condition that the composition gradient vanishes at the boundary leads to
 \begin{equation} \sum_{j=1}^{K}\kappa_{j} \left(\nabla\phi_{j}\right)^{2}={\rm \Delta} f,\quad \forall\ \boldsymbol x \in \varOmega, \end{equation}
where the excess energy density  ${\rm \Delta} f=f(\boldsymbol \phi )-f(\boldsymbol \phi _{e}^{a})- \boldsymbol \mu ^{{e}}\boldsymbol {\cdot }(\boldsymbol \phi - \boldsymbol \phi _{e}^{a})=f(\boldsymbol \phi )-f(\boldsymbol \phi _{e}^{b})- \boldsymbol \mu ^{{e}}\boldsymbol {\cdot }(\boldsymbol \phi - \boldsymbol \phi _{e}^{b})$ and $K$ is the total number of components in the system. Note that the equilibrium chemical potentials are generally not zero, as shown in the phase diagram. This is in contrast to the conventional way of a double-well potential for two-phase flow (Jacqmin Reference Jacqmin2000) and a multi-well potential (He et al. Reference He, Li, Huang, Hu, Li and Wang2020) for multiphase flow, where the chemical potential is zero at equilibrium. The integration of the equilibrium equation leads to a new potential in the form of $f(\boldsymbol \phi )-\sum _{j=1}^{K}\mu _ {j}^{e}\phi _{j}$. Based on the Euler formulation for one-component phase (Sundman, Lukas & Fries Reference Sundman, Lukas and Fries2007), we write its generalization for a system with $\varLambda$ phase and $K$ component as $\sum _{\nu =1}^{\varLambda }(f-\sum _{j=1}^{K}\mu _{j}^{e} \phi _{j})v^{\nu }=0$ due to the additive property of extensive variables, where $v^{\nu }$ is the molar volume of the respective phase $\nu$. Because of incompressibility, the summation of the molar volume is constant, $\sum _{\nu =1}^{\varLambda } v^{\nu }=\text {constant}$. This leads to a necessary condition for the phase equilibrium $f-\sum _{j=1}^{K}\mu _{j}^{e} \phi _{j}=\text {constant}$. This result motivates us to define a thermodynamic potential $P\equiv f-\sum _{j=1}^{K}\mu _{j} \phi _{j}$, which is the Legendre transformation of the chemical potential. Here, the chemical potential for the $j$th component $\mu _{j}$ is not necessary to be $\mu _{j}^{e}$. The thermodynamic potential characterizes the phase state away from the equilibrium. The significance of the thermodynamic potential is its contribution to the capillary force together with the Kortweg stress.
The minimization of the free energy functional at the substrate  $S$ requires that
 \begin{equation} \delta \mathcal{F}/\delta \phi_{i}=0,\quad \forall\ \boldsymbol x \in S,\quad i=1,2,3. \end{equation}
With the expression for the free energy functional, the equilibrium condition at the substrate is rewritten as (see supplementary section S.II.3)
 \begin{equation} 2 \kappa_{i} \boldsymbol{\nabla}\phi_{i}\boldsymbol{\cdot} \boldsymbol{n}-\partial_{\phi_{i}}\varGamma= 0,\quad \forall\ \boldsymbol x \in S \quad i=1,2,3. \end{equation}
The joint equilibrium of bulk and substrate, as a result of (4.4) and (4.6), determines the surface composition  $\boldsymbol \phi _{S}^{a}$ ( $a = \alpha$, $\beta$, $\delta$), which is analogous to (2.6) for the binary system. The details for the surface composition of the ternary system are discussed in the following section for the validation of the model.
5. Interfacial tension and wall free energy density
The interfacial tension of an  $a$–
$a$– $b$ interface ( $a=\alpha$, $\beta$, $\delta$, $b=\alpha$, $\beta$, $\delta$, $a\neq b$) is the excess free energy across the interface, which is expressed as
 \begin{equation} \gamma_{ab} = \int_{X}\left[f(\boldsymbol\phi)-f(\boldsymbol\phi_{e}^{a})- \boldsymbol\mu^{e}\boldsymbol{\cdot}(\boldsymbol \phi-\boldsymbol \phi_{e}^{a}) + \sum_{{j=1}}^{K} \kappa_{j}\left( \nabla\phi_{j}\right)^{2}\right] {\rm d} X. \end{equation}
The integral path  $X$ is achieved by minimizing the interfacial tension $\gamma _{ab}$. With the bulk equilibrium condition, the surface tension is rewritten as
 \begin{equation} \gamma_{ab}=\int_{\boldsymbol\phi_{e}^{a}}^{\boldsymbol\phi_{e}^{b}} 2\sqrt{{\rm \Delta} f}\,{\rm d} s,\end{equation}
where  ${\rm d} s=\sqrt {\sum _{j=1}^{K}\kappa _{j} ({\rm d}\phi _{j})^{2}}$. The path integral starts from one equilibrium composition ${\boldsymbol \phi _{e}^{a}}=(\phi _{1}^{a},\phi _{2}^{a}, \phi _{3}^{a})$ to the other one ${\boldsymbol \phi _{e}^{b}}=(\phi _{1}^{b},\phi _{2}^{b},\phi _{3}^{b})$ by minimizing the interfacial tension.
The interfacial tension between an  $a$ phase ( $a=\alpha$, $\beta$, $\delta$) and the substrate $S$ has two contributions. One is the excess free energy due to the presence of the surface composition, which leads to a non-uniform composition from $\boldsymbol \phi _{S}^{a}$ to $\boldsymbol \phi _{e}^{a}$. The second part is the wall free energy $\varGamma (\boldsymbol \phi _{S}^{a})$, which depends on the composition on the substrate. Thus, the interfacial tension is expressed as
 \begin{equation} \gamma_{aS } =\varGamma(\boldsymbol \phi_{S}^{a}) + \int^{\boldsymbol\phi_{e}^{a}}_{{\boldsymbol\phi_{S}^{a} }} 2\sqrt{{\rm \Delta} f}\,{\rm d} s . \end{equation}
The wall free energy density is assumed to be described by a second-order polynomial function with coefficients  $g_{ij}$ as
 \begin{equation} \varGamma (\boldsymbol \phi) = \sum_{i=1}^{K} \sum_{j=1}^{K} g_{ij} \phi_{i}^{j-1},\quad \forall\ \boldsymbol x \in S.\end{equation}
Here, the parameters  $g_{i2}$ represent an attraction of the liquid by the solid; the parameters $g_{i3}$ depict a certain reduction of the liquid–liquid attractive interactions near the surface (De Gennes Reference De Gennes1985). The constants $g_{i1}$ are reference values for the wall free energy and make no contribution to the contact angle.
6. Kinetics equation
The compositions in the domain  $\varOmega$ and at the substrate $S$ both evolve with time to minimize the free energy functional. There are different types of kinetics equations, such as Cahn–Hilliard and Allen–Cahn. In this work, we adopt the Cahn–Hilliard model for the time evolution of the composition $\boldsymbol \phi$ in $\varOmega$ until the time $T{t}$. In § 9, we consider the droplet wetting coupling with evaporation. The diffusion mechanism in the evaporation process can be more conveniently described by the Cahn–Hilliard model, in comparison with the Allen–Cahn approach. The diffusion equation for the composition $\phi _{i}$ reads
 \begin{equation} \partial{t}\phi_{i}={-}\boldsymbol{\nabla} \boldsymbol{\cdot} \boldsymbol j_{i} =\boldsymbol{\nabla}\boldsymbol{\cdot} (L_{i} \boldsymbol{\nabla} \mu_{i}). \end{equation}
The contribution of  $\boldsymbol {\nabla }\mu _{j}$ to the time evolution of $\phi _{i}$ ( $j\neq i$) will be introduced by considering the Gibbs–Duhem relation. In comparison with the diffusion flux in terms of the composition gradient $\boldsymbol j_ {i}=- D_{i}\boldsymbol {\nabla } \phi _{i}$, the mobility $L_{i}$ is expressed as $L_{i}=D_{i} \phi _{i} v_{m}/(R_{g}T)$. The parameter $D_{i}$ denotes the diffusivity of component $i$. From the Gibbs–Duhem relation $\sum _{j=1}^{K}\phi _{j} \boldsymbol {\nabla } \mu _{j}=0$, we derive the chemical potential gradient for the multicomponent system as
 \begin{equation} \boldsymbol{\nabla} \mu_{i}=\sum_{j=1}^{K}(\delta_{ij}-\phi_{j})\boldsymbol{\nabla}\mu_{j}, \end{equation}
where  $\delta _{ij}$ stands for the Kronecker delta. Thus, we have the generalized diffusion equation for a multicomponent system:
 \begin{equation} \partial{t}\phi_{i} = \boldsymbol{\nabla} \boldsymbol{\cdot} \left[\sum_{j=1}^{K} {\mathsf{M}}_{ij} \boldsymbol{\nabla}\left(\partial f/\partial \phi_{j}- 2 \kappa_{j} \nabla^{2}\phi_{j} \right)\right],\quad \forall\ (\boldsymbol x,t)\in \varOmega \times [0, T{t}], \end{equation}
where the mobility is expressed as
 \begin{equation} {\mathsf{M}}_{ij}=D_{i}\phi_{i}(\delta_{ij}-\phi_{j})v_{m}/R_{g} T. \end{equation}
Note that the mobility is composition-dependent, which is in contrast to the constant mobility (Kim Reference Kim2007; Boyer et al. Reference Boyer, Lapuerta, Minjeaud, Piar and Quintard2010). This dependency results from the diffusion equation plus the Gibbs–Duhem relation. A constant mobility and composition-dependent mobility can lead to different physical mechanisms for the time evolution of the equation as well as distinct energy dissipation laws (Cahn, Elliott & Novick-Cohen Reference Cahn, Elliott and Novick-Cohen1996; Abels, Garcke & Grün Reference Abels, Garcke and Grün2012). From the aspect of thermodynamic consistency, the mobility  $\boldsymbol{\mathsf{M}}=({\mathsf{M}}_{ij})\in \mathbb {R}^{K\times K}$ must be positive semi-definite to fulfil the energy dissipation law (supplementary material, S.7).
On the substrate  $S$, we introduce the following evolution equation based on the surface equilibrium condition (4.6):
 \begin{equation} \tau_{i}\partial{t}{\phi_{i}}=2 \kappa_{i}\boldsymbol{\nabla} \phi_{i} \boldsymbol{\cdot}\boldsymbol n-\partial_{\phi_{i}} \varGamma +\lambda,\quad \forall\ (\boldsymbol x,t)\in S \times [0, T{t}], \end{equation}
where  $\tau _{i}$ is a relaxation parameter. When the time $t\rightarrow \infty$, the surface equilibrium condition (4.6) is reached. To ensure the constraint $\sum _{j=1}^{K}\phi _{j}=1$, a Lagrange multiplier $\lambda =-(1/K)\sum _{j=1}^{K} (\delta \mathcal {F}/\delta \phi _{j})$ has been added to the kinetic evolution for the surface composition.
Depending on the Péclet number, the convection may play a non-negligible role in the mass transfer. In this case, the Cahn–Hilliard model is modified as
 \begin{equation} \partial{t}\phi_{i} + \boldsymbol{\nabla} \boldsymbol{\cdot}(\boldsymbol{u}\phi_{i})= \boldsymbol{\nabla} \boldsymbol{\cdot} \left[\sum_{j=1}^{K} {\mathsf{M}}_{ij} \boldsymbol{\nabla}\left(\partial f/\partial \phi_{j}- 2 \kappa_{j} \nabla^{2}\phi_{j} \right)\right],\quad \forall\ (\boldsymbol x,t)\in \varOmega \times [0, T{t}], \end{equation}
where  $\boldsymbol {u}$ is the convection velocity of the fluid. No-slip boundary condition is assumed for the fluid velocity on the solid substrate $S$. Hence, the evolution equation for the composition on the substrate $S$, equation (6.5), is not altered. However, it should be noted that a slip boundary condition on the substrate may be considered when the slip length is known. We refer to Huang & Wang (Reference Huang and Wang2018) for a discussion on the effect of the slip boundary condition on the solid substrate.
We focus on the fluid flow induced by the surface tension force which is formulated as (S.II.4)
 \begin{equation} \boldsymbol f_{s}={-}\sum_{j=1}^{K-1} \phi_{j} \boldsymbol{\nabla} (\mu_{j}-\mu_{K}),\quad \forall\ (\boldsymbol x,t)\in \varOmega \times [0, T{t}], \end{equation}
where the chemical potential is defined by the variational approach as  $\mu _{j}\equiv \partial f/\partial \phi _{j}-2\kappa _{j} \nabla ^{2}\phi _{j}$.
With the surface tension force, the incompressible Navier–Stokes equation for the convection velocity  $\boldsymbol {u}$ reads
 \begin{gather} \boldsymbol{\nabla}\boldsymbol{{\cdot} }\boldsymbol{u} = 0; \end{gather}
 \begin{gather}\rho \left(\partial{t} \boldsymbol{u} + \boldsymbol{u} \boldsymbol{\cdot} \boldsymbol{\nabla} \boldsymbol{u}\right) = \boldsymbol f_{s} -\boldsymbol{\nabla} p + \boldsymbol{\nabla}\boldsymbol{\cdot} \left[\eta (\boldsymbol{\nabla} \boldsymbol{u}+ \boldsymbol{\nabla} \boldsymbol{u}^{{\rm T}})\right], \quad \forall\ (\boldsymbol x,t)\in \varOmega \times [0, T{t}]. \end{gather}
The parameters  $\rho$, $\eta$ and $p$ denote the fluid density, viscosity and pressure, respectively. The evolution equations (6.6), (6.8) and (6.9) effect a decrease of the total energy of the system (S.II.5). By selecting the reference values $x^*$, $\sigma ^*$ and $D^*$ for the length, surface tension and diffusivity, respectively, we have the following dimensionless quantities: $Re$,
$Re$,  $We$ and $P\acute {e}$ (Appendix A).
We present some remarks for the divergence free of the velocity when diffusion is considered. At atmospheric pressure and at room temperature, the density of a fluid mixture is almost constant, as supported by many experimental data and theories. For instance, at room temperature and 1 atm, the density of air with 100 % relative humidity is 1.1 times that of dry air with 0 % relative humidity (Picard et al. Reference Picard, Davis, Gläser and Fujii2008). In view of this fact, it is reasonable to assume  ${\rm d}\rho /{\rm d} t\approx 0$ for a liquid–gas system at room temperature and 1 atm. By using the materials derivative with a frame moving with the direction of the fluid velocity $\boldsymbol u$, we have the following expression for the total derivative: ${\rm d}\rho /{\rm d} t=\partial \rho /\partial t+\boldsymbol {u}\boldsymbol {\cdot }\boldsymbol {\nabla } \rho$. In comparison with the continuity equation (Landau & Lifshitz Reference Landau and Lifshitz2013), $\partial \rho /\partial t+\boldsymbol {\nabla }\boldsymbol {\cdot } (\rho \boldsymbol {u})=0$, we have $\rho \boldsymbol {\nabla } \boldsymbol {\cdot } \boldsymbol u=-{\rm d}\rho /{\rm d} t$. Since ${\rm d}\rho /{\rm d} t\approx 0$, the divergence free of the velocity is obtained. Note that the diffusion equation is normally written in terms of the volume composition $\boldsymbol {\phi }$ rather than the density $\rho$ (Landau & Lifshitz Reference Landau and Lifshitz2013). When diffusion takes place, we generally have ${\rm d}\phi _{ i}/{\rm d} t\neq 0$, which seems to contradict with ${\rm d}\rho /{\rm d} t=0$. This contradicting point is realized by using $\phi _{2}=1-\phi _{ 1}$ and ${\rm d}\rho /{\rm d} t=(\rho _{1}^{o}-\rho _{2}^{o})\,{\rm d}\phi _{1}/{\rm d} t$, if $\rho =\rho _{1}^{o}\phi _{1} +\rho _{2}^{o}\phi _{2}$ for a binary mixture with $\rho _{1}^{o}\neq \rho _{2}^{o}$. Here, we prefer to interpret $\rho _{1}^{o}$ and $\rho _{2}^{o}$ as partial densities, rather than the densities of pure fluids before mixing. We think that one possible reason is that $\rho _{1}^{o}$ and $\rho _{2}^{o}$ are no longer constant in a mixture but depend on the local volume fraction. The fact is that one cannot measure the local density $\rho _{i}^{o}$, $i=1, 2$, after mixing, while the density of the mixture $\rho$ and the density of the pure phase before the mixing can be measured. When the local volume concentration varies with time in the diffusion process, the partial density $\rho _{i}^{o}$ should change accordingly via the equation of state relating to the partial pressure; but the density of the mixture $\rho$ does not vary.
7. Criterion of the contact angle measurement
For the two-phase wetting problem based on the phase diagrams in figures 1(I) and 1(II), the components  $1$ and $2$ are miscible with each other. The two immiscible phases separate themselves by composition $3$. Thus, we select the average composition $3$ in the droplet and in the matrix $\phi _{{int}} = (\phi _{3}^{\alpha } + \phi _{3}^{\delta })/2$ as the criterion for the interface between the immiscible phases, as shown by the blue solid line in figure 2. This interface position almost corresponds to the extreme value between the two immiscible phases along the tie line in the free energy landscape. Specifically, the contact line radius $r_{c}$ and the droplet height $h$ are used to calculate the macroscopic contact angle as $\theta = 2\arctan (h/r_{c}) \times 180^\circ /{\rm \pi}$.

Figure 2. Sketch for the contact angle.
For the three-phase wetting problem based on the phase diagram in figure 1(III), the interface for the  $\alpha$ phase is marked by the locations where $\phi _{{int}} = (\phi _{1}^{\alpha } + \phi _{1}^{\delta })/2$ (blue line), corresponding to the extreme value in the free energy landscape. Here, $\phi _{1}^{\alpha }$ and $\phi _{1}^{\delta }$ are the equilibrium values of $\phi _{1}$ in the $\alpha$ droplet and in the $\delta$ matrix, respectively. Similarly, we obtain the $\beta$– $\delta$ interface with the criterion of $\phi _{{int}} = (\phi _{2}^{\beta } + \phi _{2}^{\delta })/2$ (red line) as well as the $\alpha$– $\beta$ interface (violet line). By fitting the three interfaces with circular arcs, we denote their intersection point as the triple junction, where three dot-dashed tangent lines for each interface define the contact angles $\theta _{ij}^{\prime }$. At the other triple junctions where the two immiscible phases meet the substrate, the dot-dashed tangent lines are plotted at the contact line position and the contact angle $\theta _{ij}$ is estimated by the same method with the help of tangent lines, as shown in figure 2.
8. Results and discussion
8.1. Symmetric phase diagram
The simulation results for the wetting phenomenon of the symmetric phase diagram are shown in figure 3. Two different initial droplet compositions are considered, (a)  $\boldsymbol \phi =(0.63, 0.15, 0.22)$ and (b) $\boldsymbol \phi =(0.24, 0.55, 0.21)$, which fall on the black solid binodal line in figure 3(I). The compositions in the surrounding matrix are set to be the corresponding equilibrium values according to the coloured tie lines. In this case, we assume that components 1 and 2 have similar physical properties. Thus, we apply identical parameters $\chi _{13}=\chi _{23}>0>\chi _{12}$ and $N_{1}=N_{2}$ to get a special feature of the symmetric phase diagram. The notion of ‘symmetric’ is understood as follows. The phase diagram is symmetric with respect to $\phi _{2}=0.5$, as shown in figure 1(I). In the droplet, the equilibrium compositions of the first and second components can have a relatively large variation, while the third component remains almost constant. The gradient energy coefficient $\kappa _{i}=2$, the diffusion coefficient $D_{i}=1$ and the wetting relaxation parameter $\tau _{i}=1$ are applied for all components, $i=1,2,3$. The wall free energy coefficient is assigned as $g_{33}=0.2$ and the rest $g_{ij}=0$ following (5.4), which leads to a hydrophilic set-up, as displayed in figure 3(II). In case (a), we have a relatively high $\phi _{1}$ over $\phi _{2}$. Hence, the simulated wetting morphology shows a red colour (dense) for component 1 and a light blue colour (lean) for component 2. When adding more component 2 into the droplet, the coloured composition distribution is reversed, as illustrated in case (b).

Figure 3. Phenomenon: a symmetric phase diagram and the wetting morphology. (I) Phase diagram with parameters  $(N_{1}, N_{2}, N_{3}) = (2, 2, 1)$, $(\chi _{1},\chi _{2},\chi _{3}, \chi _{123})=(0.5, 3.5, 3.5, 1.5)$ and $T=2$, as in figure 1. (II) Wetting morphologies for a droplet with composition of (a) $\boldsymbol \phi =(0.63, 0.15, 0.22)$ and (b) $\boldsymbol \phi =(0.24, 0.55, 0.21)$. The tie lines for the binodal compositions of (a,b) are plotted on the phase diagram with corresponding index. The colour bar denotes the distribution of the compositions $\phi _{1}$, $\phi _{2}$ and $\phi _{3}$.
Next, we validate the simulation results by measuring the contact angle at the triple junction in comparison with Young's law for different compositions, as shown in figure 4. Here, four distinct compositions in the droplet with  $P_{1}$: $\boldsymbol \phi =(0.05, 0.72178, 0.22822)$, $P_{2}$: $\boldsymbol \phi =(0.25, 0.53979, 0.21021)$, $P_{3}$: $\boldsymbol \phi =(0.40, 0.39367, 0.20633)$ and $P_{4}$: $\boldsymbol \phi =(0.75,0.01734,0.23266)$ are considered, as sketched in the phase diagram of figure 4(I). As presented in figure 4(IV) for the wetting simulations in two dimensions, the contact angle for the composition of $P_2$ changes from a hydrophobic set-up $\theta =123^{\circ }$ with $g_{33}=-0.2$ to a hydrophilic set-up $\theta =63^{\circ }$ with $g_{33}=0.2$. A systematic study for the effect of the wall free energy parameter $g_{33}$ on the contact angle is shown in figure 4(II) for the four considered compositions $P_{1}$– $P_{4}$. For all droplet compositions, the contact angle variations with $g_{33}$ almost overlaps with each other. This scenario corresponds to a component-independent wetting phenomenon, for example, a mixture of water and dextran (Li, Sheng & Tsao Reference Li, Sheng and Tsao2014). One can also vary other coefficients $g_{13}$ and $g_{23}$ to manipulate the wettability. For brevity, the discussion about other parameters on varying the contact angle is not presented here.

Figure 4. Model validation for the wetting effect of the symmetric phase diagram. (I) Phase diagram with parameters  $(N_{1}, N_{2}, N_{3}) = (2, 2, 1)$, $(\chi _{1},\chi _{2},\chi _{3}, \chi _{123})=(0.5, 3.5, 3.5, 1.5)$ and $T=2$. (II) The equilibrium contact angle in two dimensions versus the wall free energy parameter $g_{33}$ for the compositions $P_{1}$, $P_{2}$, $P_{3}$ and $P_{4}$, in comparison with theory. (III) Comparison of the contact angle versus $g_{33}$ in two and three dimensions for the composition $P_2$. (IV,V) Wetting morphologies for a droplet with a composition of $\boldsymbol \phi =(0.55, 0.24, 0.21)$ in two and three dimensions, respectively. The colour bar denotes the composition distribution of all compositions.
For comparison, the theoretical contact angle according to Young's law is presented as the black solid line in figure 4(II). For the evaluation of Young's contact angle, the droplet–matrix interfacial tension is calculated with (5.2), where the integration path denotes the composition distributions along the droplet–matrix interface and is sketched as the coloured lines in figure 4(I). Differing from the tie lines in the phase diagram in figure 3(I), the integration path is the exact solution of the Euler–Lagrange equation, which is decided by the free energy minimization of whole system according to the Cahn–Hilliard model. For the symmetric phase diagram, the free energy minimization path from the droplet to the surrounding coincidentally overlaps with the tie lines of two binodal compositions, as demonstrated by the dark blue, the light blue, the light red and the dark red curves in figure 4(I). The other two interfacial tensions, namely the droplet–substrate and the matrix–substrate, are evaluated by (5.3). The contact angle is computed with the interfacial tension set by Young's law and shows excellent accordance with the simulation results. As illustrated in figure 4(II), the maximal derivation is up to only  $3^{\circ }$.
Besides 2-D simulations, 3-D simulations are carried out for the composition  $P_{2}$. The 3-D wetting morphologies are portrayed in figure 4(V) with side and top views, the red/blue surface showing the isosurface of component $1$/
$1$/ $2$, respectively. Comparing the 3-D simulated $\theta$ with the 2-D values in figure 4(III), both simulation results are in good accordance with the theoretical lines of Young's law. The subtle discrepancy is caused by the different curvature constitution in two and three dimensions.
8.2. Asymmetric phase diagram
For a real ternary mixture, components 1 and 2 do not necessarily show similar physical properties. More specifically speaking, for the ideal mixture with entropy dominating over enthalpy, the miscibility gap has a symmetric shape which is typically observed for alloys (Nakagawa Reference Nakagawa1958). However, for most other mixtures, such as water-, alcohol- and polymer-based solutions, the enthalpy contribution for the free energy density is larger than or comparable to the one of the entropy. In this case, the miscibility gap becomes asymmetric which means not the same properties of components 1 and 2. In this section, we consider the asymmetric phase diagram shown in figure 1(II) and study the wetting effect with different compositions and distinct wall free energy densities.
For the free energy density of the asymmetric phase diagram, we choose the following parameters:  $(N_{1}, N_{2}, N_{3}) = (5, 1, 1)$, $(\chi _{1},\chi _{2},\chi _{3}, \chi _{123})=(0.5, 6.0, 4.5, 1.5)$. The other parameters are unchanged from those in § 8.1, except the coefficient of the wall free energy. In our simulations, four distinct initial droplet compositions are considered as shown in figure 5(I), namely $P_{1}$: $\boldsymbol \phi =(0.26601,0.64955,0.08444)$, $P_{2}$: $\boldsymbol \phi =(0.49801,0.45093,0.05106)$, $P_{3}$: $\boldsymbol \phi =(0.71401,0.24986,0.03613)$ and $P_{4}$: $\boldsymbol \phi =(0.92201, 0.04983, 0.02816)$. The matrix is initialized with the corresponding equilibrium composition on the binodal line. As depicted in figure 5(II), an identical wall free energy coefficient $g_{33}=1.5$ leads to distinct wetting morphologies for $P_{1}$ and $P_{4}$. Comparing the composition distribution of $P_{1}$ with $P_{4}$ in figure 5(II), not only is the change in $\phi _{1}$ and $\phi _{2}$ observed, but also the composition variation of component $3$. In spite of the identical $g_{33}$, the contact angle for $P_{1}$ is not the same as for $P_{4}$. This observation is in contrast to the case of the symmetric phase diagram in § 8.1, where the contact angle is almost invariant with respect to the initial composition. Figure 5(III) depicts the contact angle as a function of the wall free energy coefficient $g_{33}$ for all four initial compositions $P_{1}$– $P_{4}$. The simulation results are in very good agreement with the theoretical lines calculated from Young's law.

Figure 5. Validation for the wetting effect of the asymmetric phase diagram. (I) The phase diagram and four compositions  $P_{1}$ $\boldsymbol \phi =(0.26601, 0.64955, 0.08444)$, $P_{2}=(0.49801, 0.45093, 0.05106)$, $P_{3}=(0.71401, 0.24986, 0.0361)$ and $P_{4}=(0.92201, 0.04983, 0.02816)$ for the simulation. The dark blue, light blue, light red and dark red lines depict the free energy minimization paths from the droplet to the surrounding, which are obtained from the numerical simulations. (II) The composition distribution of the three components for the initial composition $P_{1}$ and $P_{4}$. The wall energy coefficient is $g_{33}=1.5$. (III) The contact angle as a function of the wall free energy density from the numerical simulation for different compositions: $P_{1}$ (square), $P_{2}$ (circle), $P_{3}$ (cross), $P_{4}$ (triangle). The lines show the theoretical values calculated from Young's law.
With moving from  $P_{1}$ to $P_{4}$, the impact of the wall free energy coefficient $g_{33}$ on the wetting angle becomes more pronounced. The special case is $g_{33}=0$ where all four set-ups have the same $90^{\circ }$ contact angle. The enhanced wall effect with respect to the initial composition does not simply lie in the wall free energy itself, but is also attributed to the distinct interfacial tensions of droplet–matrix caused by the different equilibrium compositions of $P_{1}$– $P_{4}$. Especially, the composition paths from the bulk of the droplet to the bulk of the matrix for $P_{1}$– $P_{4}$ are depicted by the dark blue, light blue, light red and dark red lines in the phase diagram, as illustrated in figure 5(I). In contrast to the straight free energy minimization paths in figure 4(I), the paths in figure 5(I) are curved towards the $\phi _{2}$-rich direction. When computing the droplet–matrix interfacial tension by integrating along the curved paths via (5.2), the interfacial tension drops as the initial composition varies from $P_{1}$ to $P_{4}$. Moreover, the variation of the initial composition in the droplet results in a modification of the wall free energy, which in turn modifies the interfacial tensions of droplet–substrate $\gamma _{\alpha S}$ and matrix–substrate $\gamma _{\delta S}$. As a result, the contact angle relies strongly on the initial compositions which has been observed in experiments for mixtures of water with polyethylene glycol and polystyrene sulphonate (Li et al. Reference Li, Sheng and Tsao2014).
8.3. Surface composition
In previous works (Jacqmin Reference Jacqmin2000; Semprebon, Krüger & Kusumaatmaja Reference Semprebon, Krüger and Kusumaatmaja2016; Yue Reference Yue2020), the free energy density is assigned as a polynomial of composition  $\boldsymbol \phi$. The wall energy density is designed in a tricky way, so that the surface composition on the substrate is identical to the equilibrium values in the bulk. In this way, the interfacial tension between droplet and substrate $\gamma _{\alpha S}$ and that between matrix and substrate $\gamma _{\delta S}$ are only determined by the function of wall free energy and are independent of the surface composition. However, this simplification cannot fully explain some outliers in the experiments where the enrichment of a certain immiscible component on the substrate is observed. Suffice to say, the surface compositions can deviate from the equilibrium bulk values. Therefore, both the interfacial tensions $\gamma _{\alpha S}$ and $\gamma _{\delta S}$ in our model have two contributions: one is the wall free energy density as previous models; the other is the excess free energy as a result of the non-uniform composition from the substrate to the immiscible fluids (bulk of the surrounding or the droplet). Consequently, the accuracy of the contact angle in our model crucially depends on the precision of the surface composition in the numerical simulation. In this section, we validate the surface compositions for both the symmetric and asymmetric phase diagrams.
As a quick introduction, we briefly review the surface composition calculation for the binary system (Wang & Nestler Reference Wang and Nestler2021). When the sessile droplet equilibrates, there are two equilibrium equations in the bulk and the substrate. In the bulk, the Cahn–Hilliard equation gives rise to the equilibrium solution for the composition  $\phi _{1}$ as
 \begin{equation} \partial f/\partial\phi_{1} -2\kappa_{1}\nabla^{2}\phi_{1}=\mu_{1}^{{e}}.\end{equation}
Multiplying both sides of (8.1) with  $\boldsymbol {\nabla } \phi _{1}$ and integrating with the condition that the composition gradient vanishes at the boundary, the excess energy density ${\rm \Delta} f$ is expressed as follows:
 \begin{equation} {\rm \Delta} f=f\left(\phi_{1}(\boldsymbol x)\right)-f(\phi_{1}^{{e}})- \mu_{1}^{{e}}\left[\phi_{1}(\boldsymbol x)-\phi_{1}^{{e}}\right]= \kappa_{1} (\nabla\phi_{1})^{2}.\end{equation}
On the substrate layer, the other equilibrium reads
 \begin{equation} 2\kappa_{1}\boldsymbol{\nabla}\phi_{1}\boldsymbol{\cdot}\boldsymbol n = \partial \varGamma/\partial \phi_{1}.\end{equation}
For a flat substrate with normal vector  $\boldsymbol n=[0,1,0]$, after substituting (8.3) into (8.2), we have
 \begin{equation} {\rm \Delta} f = \frac{1}{4\kappa_{1}}\left(\partial \varGamma/\partial \phi_{1}\right)^{2}\quad \text{or}\quad 2\sqrt{\kappa_{1} {\rm \Delta} f } - \partial \varGamma/\partial \phi_{1}=0. \end{equation}
Therefore, the surface composition is given by the locus of (8.4), which marks the intersection of the curve  $2\sqrt {\kappa _{1}{\rm \Delta} f}$ with the derivative of the wall free energy density $\partial \varGamma /\partial \phi _{1}$. This solution is originated from Cahn's theory (Cahn Reference Cahn1977) and reviewed in De Gennes (Reference De Gennes1985). In the binary system, (8.4) is dependent solely on the single variable $\phi _{1}$. Hence, for the droplet and the matrix, the surface composition is unique. The numerical confirmation of the surface composition in binary systems has been shown in Wang & Nestler (Reference Wang and Nestler2021).
For the ternary system, the situation becomes more complex, as a second independent variable  $\phi _{2}$ is added to the equilibrium equation (8.1):
 \begin{gather} \left.\begin{gathered} \partial f/\partial\phi_{1} -2\kappa_{1}\nabla^{2}\phi_{1}=\mu_{1}^{{e}},\\ \partial f/\partial\phi_{2} -2\kappa_{2}\nabla^{2}\phi_{2}=\mu_{2}^{{e}},\\ \partial f/\partial\phi_{3} -2\kappa_{3}\nabla^{2}\phi_{3}=\mu_{3}^{{e}}, \end{gathered}\right\}\quad \text{in bulk region}\ \varOmega; \end{gather}
 \begin{gather} \left.\begin{gathered} 2\kappa_{1}\boldsymbol{\nabla}\phi_{1}\boldsymbol{\cdot}\boldsymbol n = \partial \varGamma/\partial \phi_{1},\\ 2\kappa_{2}\boldsymbol{\nabla}\phi_{2}\boldsymbol{\cdot}\boldsymbol n = \partial \varGamma/\partial \phi_{2},\\ 2\kappa_{3}\boldsymbol{\nabla}\phi_{3}\boldsymbol{\cdot}\boldsymbol n = \partial \varGamma/\partial \phi_{3}, \end{gathered}\right\}\quad \text{in substrate}\ S. \end{gather}
With the same calculus as the binary case, the surface composition in the ternary system is given by the following equation:
 \begin{align} {\rm \Delta} f &= f(\phi_{1},\phi_{2}, \phi_{3})-f(\phi_{1}^{{e}},\phi_{2}^{{e}}, \phi_{3}^{{e}}) -\sum_{j=1}^{3}\mu_{j}^{{e}}\left(\phi_{j}-\phi_{j}^{{e}}\right) \nonumber\\ &= \frac{1}{4\kappa_{1}}\left(\partial \varGamma/\partial \phi_{1}\right)^{2} + \frac{1}{4\kappa_{2}}\left(\partial \varGamma/\partial \phi_{2}\right)^{2}+ \frac{1}{4\kappa_{3}}\left(\partial \varGamma/\partial \phi_{3}\right)^{2}. \end{align}
As  $\sum _{j=1}^{3}\phi _{j} =1$ and after simplification, (8.7) can be rewritten as
 \begin{align} {\rm \Delta} f &= f(\phi_{1},\phi_{2},1-\phi_{1}-\phi_{2})-f(\phi_{1}^{{e}}, \phi_{2}^{{e}}, 1-\phi_{1}^{{e}}-\phi_{2}^{{e}}) -\sum_{j=1}^{2} \left(\mu_{j}^{{e}}-\mu_{3}^{{e}}\right)\left(\phi_{i}-\phi_{i}^{{e}}\right) \nonumber\\ &= \frac{1}{4\kappa_{1}}\left[\frac{\partial \varGamma(\phi_{1}, \phi_{2},1-\phi_{1}-\phi_{2})}{\partial \phi_{1}}\right]^{2} + \frac{1}{4\kappa_{2}}\left[\frac{\partial \varGamma(\phi_{1}, \phi_{2},1-\phi_{1}-\phi_{2})}{\partial \phi_{2}}\right]^{2}. \end{align}
It can be noticed that the intersection of  ${\rm \Delta} f$ with the derivative of the wall free energy density does not lead to a single point (figure S1), but a conic section of $\phi _{1}$ and $\phi _{2}$ instead. Two typical analytical solutions of (8.8) are shown in figures 6(I) and 6(II) for the symmetric and asymmetric phase diagrams, respectively. In the former case, the composition $P_{2}$ with $g_{33}=0.2$ is selected. In the latter one, the composition $P_{4}$ with $g_{33}=1.0$ is considered. The dark red conic section defines all the compositions for the droplet phase, which fulfil (8.7), while the dark blue one marks the adequate compositions in the matrix. However, in the ternary system, the exact surface compositions are not so straightforward to be read from the points on the two conic sections as the binary case which we can easily deal with. According to the least action principle, the surface compositions must give rise to the minimum of the total free energy functional for the whole system. Mathematically, this minimum can be solved by addressing the static solution of the Euler–Lagrange equation. Not surprisingly, the demanding answer turns out to be nothing but the results of the Cahn–Hilliard equation with the wetting boundary condition in our simulation, which are illustrated by the red open circle and blue open square on the conic sections. The positions for extracting the surface composition from simulation are indicated on the right-hand side of each panel. This observation demonstrates the strong capability of the present model for capturing the surface composition in the considered ternary systems, especially when the enrichment of materials on the substrate is an important feature. We also perform surface composition validations for other initial compositions, which show good accordance with the theoretical values (not shown here to avoid redundancy).

Figure 6. Validation of the surface composition for (I) the symmetric phase diagram and (II) the asymmetric phase diagram. The red and blue conic sections are the analytical values according to (8.7). The red circle and blue square depict the simulated surface compositions for the droplet and matrix, respectively. The simulated surface compositions are taken from the wetting morphologies, guided by the black arrows in the snapshots on the right-hand sides of the phase diagrams.
In addition, we present some remarks on the significance of the surface composition for ternary systems, especially when the system is off equilibrium. For instance, during the evaporation process, the solvent molecules continuously volatilize from the droplet–substrate and dissolve themselves in the surrounding matrix. This leads to the surface compositions away from the equilibrium values, not only inside but also outside the droplet. It has been proved in experiments that the composition changes around the triple junction are much pronounced than any other places upon the droplet–matrix interface (Deegan et al. Reference Deegan, Bakajin, Dupont, Huber, Nagel and Witten1997). As a result, the interfacial tension pairs  $\gamma _{\alpha S}$, $\gamma _{\delta S}$ are modified accordingly, which engenders microscopic mass transfer starting from the substrate. This kinetics is far off equilibrium and therefore gives rise to different wetting patterns on the substrate, for example, coffee-ring effect. Moreover, we emphasize again that the interfacial tensions in our model are composed of two crucial parts, namely the wall free energy and the surface excess free energy. Which part dominates the interfacial tension changing with surface composition will be more heedfully discussed in future works.
9. Evaporation
In this section, we study the evaporation process of a hydrophilic droplet for the symmetric phase diagram. The initial composition inside the droplet  $\boldsymbol \phi =(0.4000,0.3937,0.2063)$ corresponds to point $P_{3}$ in figure 3. The wall free energy coefficient is set to be $g_{33}=0.2$ which leads to a static contact angle of $62.4^{\circ }$. The other simulation parameters are identical to the set-up of figure 4. The evaporation behaviour is manipulated by changing the initial composition of component $2$ in the surrounding environment:
 \begin{equation} \phi_{2}^{\infty}=S_{0}\phi_{2}^{{e}}. \end{equation}
Here,  $S_{0}$ stands for the saturation rate and $\phi _{2}^{{e}}=0.0667$ denotes the binodal composition in the matrix which stays in equilibrium with the initial droplet $\phi _{2}^{{drop}}$. On decreasing the saturation value, the droplets present different morphological evolutions, as demonstrated in figure 7(I). When the surrounding saturation rate is greater than a certain value $S_{0}>25\,\%$, the droplet finally reaches the equilibrium with the surrounding and a small droplet remains on the substrate. While a low saturation $S_{0}\leq 25\,\%$ leads to a completely drying out of the droplets. These two typical morphological evolutions are characterized by the variation of the volume with time, as demonstrated in figure 7(II).

Figure 7. Model validation for multicomponent droplet evaporation. Examples are shown by considering the initial composition  $P_{3}$ of the symmetric phase diagram for different saturation rates $S_{0}$. Dark red: $S_{0}=66.7\,\%$; scarlet: $50.0\,\%$; light red: $33.3\,\%$; light blue: $25.0\,\%$; dark blue: $12.5\,\%$. (I) Exemplary simulation snapshots with time evolution: (a) $S_{0}=66.7\,\%$; (b) $S_{0}=50.0\,\%$; (c) $S_{0}=25.0\,\%$. (II) The normalized droplet volume $V/V_{0}$ with time ( $V_{0}$, initial droplet volume). (III) The contact base radius $r_{c}$ with time. (IV) The composition of component $2$ inside the droplet $\phi _{2}^{{drop}}$ with time. (V) The composition of component $2$ in the environment $\phi _{2}^{\infty }$ with time. (VI) The log–log plot of the correlation factor $\xi$ in (9.4) changes with $\phi _{2}^{{drop}}$. The results for different saturation rates $S$ follow the scaling law $\xi \sim (\phi _{2}^{{drop}})^{-0.5}$ which is demonstrated in experiments (Kim & Weon Reference Kim and Weon2018). The scaling law is guided by the dashed black line.
We compare the simulation results with an empirical formulation proposed in Kim & Weon (Reference Kim and Weon2018), which is based on the experimental evaporation of coffee droplets. According to the diffusion-limited theory (DLT), the evaporation rate of a dilute droplet is calculated as (Stauber et al. Reference Stauber, Wilson, Duffy and Sefiane2014)
 \begin{equation} \rho({\rm d} V/{\rm d} t)_{{DLT}} ={-}{\rm \pi} r_{c} D(\phi_{2}^{{drop}}-\phi_{2}^{\infty})g(\theta).\end{equation}
The evaporation rate is scaled by the water diffusivity  $D$ as well as by the composition difference of component $2$ between the droplet and the environment ( $\phi _{2}^{{drop}}-\phi _{2}^{\infty }$). The latter reflects the $\phi _{2}$ saturation and is the driving force for the evaporation. The wetting effect is considered by a geometric factor $g(\theta )$ as (Stauber et al. Reference Stauber, Wilson, Duffy and Sefiane2014)
 \begin{equation} g(\theta) = \tan\frac{\theta}{2} + 8 \int_{0}^{\infty} \frac{\cosh^{2}(\theta\zeta)}{\sinh(2{\rm \pi}\theta\zeta)}\tanh[\zeta({\rm \pi}-\theta)]\,{\rm d}\zeta. \end{equation}
As component  $2$ inside the droplet gets dried up, the simulated evaporation rate $(\textrm {d} V/\textrm {d} t)_{{Sim}}$ deviates gradually from the theoretical value $(\textrm {d} V/\textrm {d} t)_{{DLT}}$. Their ratio is named as the correlation factor $\xi$:
 \begin{equation} \xi = \frac{({\rm d} V/{\rm d} t)_{{DLT}}}{({\rm d} V/{\rm d} t)_{{Sim}}}. \end{equation}
Here,  $(\textrm {d} V/\textrm {d} t)_{{DLT}}$ is evaluated by using the base radius $r_{c}$ shown in figure 7(III) and the droplet compositions illustrated in figure 7(IV,V). If the droplet evaporation follows the DLT, the correlation factor $\xi$ should keep constant for its entire lifetime. However, the DLT (9.2) is only valid for dilute droplets. As the droplet becomes more concentrated during the evaporation, (9.2) loses its validity. As demonstrated in figure 7(VI) for $\xi$ versus time-dependent $\phi _{2}^{{drop}}$, we observe the scaling law $\xi \sim 1/\sqrt {\phi _{2}^{{drop}}}$, which shows good consistency with the evaporation behaviours of coffee droplets in experiments (Kim & Weon Reference Kim and Weon2018).
Notably, the evaporation phenomenon in figure 7 considers the diffusion of three compositions  $\phi _{1}$, $\phi _{2}$ and $\phi _{3}$ in the whole domain (droplet and gas phase). Figure 7(I) shows the evolution of composition $\phi _{3}$; the other two compositions $\phi _{1}$ and $\phi _{2}$ change with time as well (not shown). Because of the symmetry of the phase diagram and the same mobility/diffusivity for all the compositions adopted in the simulation, the components evaporate synchronously and simultaneously as illustrated in figure 7. However, if an asymmetric phase diagram is considered and/or the mobility is set to be distinct for different components, we may have inhomogeneous evaporation rates, which lead to non-uniform composition at the droplet–surrounding interface. The resulting composition gradient gives rise to pronounced interfacial flows, e.g. Marangoni flow. In figure 7, the fluid dynamics is neglected. By considering the complex fluid dynamics of multicomponent evaporation, some other phenomena can be observed, such as Ouzo effect (Diddens et al. Reference Diddens, Tan, Lv, Versluis, Kuerten, Zhang and Lohse2017; Lohse & Zhang Reference Lohse and Zhang2020), pancake structure (Pahlavan et al. Reference Pahlavan, Yang, Bain and Stone2021), precursor film (Wang et al. Reference Wang, Karapetsas, Valluri, Sefiane, Williams and Takata2021), interfacial instability (Keiser et al. Reference Keiser, Bense, Colinet, Bico and Reyssat2017; Baumgartner et al. Reference Baumgartner, Shiri, Sinha, Karpitschka and Cira2022) and Taylor dispersion (Charlier et al. Reference Charlier, Rednikov, Dehaeck, Colinet and Terwagne2022).
10. Fluid statics
For one-component and one-phase fluid, the static pressure plus the kinetic energy is constant for inviscid incompressible fluids. The pressure varies with the velocity of the fluid, which is affected by the boundary condition. When a one-component droplet is present in an immiscible surrounding phase, an interface appears; the pressure inside and outside the droplet is affected by two factors. (i) The first one is the curvature effect known as the Young–Laplace equation, namely  $P^*-P_{0}=\gamma _{\alpha \delta }/R$, where $P_{0}$ is a reference value. This relation is also acknowledged as the Gibbs–Thomson effect in materials science. (ii) The second factor is the fluid velocity, as shown by Bernoulli's law. With an increase in the fluid velocity, the pressure deviates from the static pressure, namely $P^*-P_{0}=\frac {1}{2}\rho \boldsymbol u^{2}$. For a multicomponent droplet, besides factors (i) and (ii), the pressure consists of an additional part, which is the thermodynamic pressure $P= f-\sum _{j=1}^{K}\mu _{j} \phi _{j}$. This is also known as the Landau potential, which is derived based on Euler's formulation in thermodynamics. In the thermodynamic equilibrium, the thermodynamic pressure of two phases is the same, as derived by the variational approach. However, when a non-zero mean curvature is present, the thermodynamic pressure deviates from that of the flat interface. The summation of the thermodynamic pressure with $P^*$ has two functions: (a) enforcing the incompressibility in the Navier–Stokes equation (Jacqmin Reference Jacqmin2000), which can be interpreted as an exchange of the kinetic energy with the free energy (potential energy), and (b) the Kortweg stress $-\sum _{ j=1}^{K} 2\kappa _{ j}\boldsymbol {\nabla } \phi _{ j} \otimes \boldsymbol {\nabla } \phi _{j}$ plus the thermodynamic pressure $P= f- \sum _{j=1}^{K}\mu _{ j} \phi _{ j}$ produces the capillary force in the form of $-\sum _{j=1}^{K}\phi _j\boldsymbol {\nabla }\mu _{ j}$, namely
 \begin{equation} \boldsymbol{\nabla}\boldsymbol{\cdot} \left[\left(f- \sum_{j=1}^{K}\mu_{j} \phi_{j}\right)\boldsymbol{I}-\sum_{j=1}^{K} 2\kappa_{ j}\boldsymbol{\nabla} \phi_{ j} \otimes \boldsymbol{\nabla} \phi_{j}\right]={-} \sum_{j=1}^{K}\phi_{ j}\boldsymbol{\nabla}\mu_{j}. \end{equation}
The left- and right-hand sides are termed the stress and the potential forms of the capillary force, respectively. Given the importance of the thermodynamic pressure, we validate the numerical convergence of its calculation as well as its relation with the mean curvature in this section. We consider the case when the fluid reaches the static state as in the Young–Laplace case. In the static state, the contact angle reaches the Young's contact angle.
We consider the numerical convergence of the Cahn–Hilliard model coupling with the Navier–Stokes equation. For 2-D simulation of the symmetric phase diagram, we vary the resolution of the numerical discretization by changing the space step  ${\rm \Delta} x = {\rm \Delta} y$ from $0.5$ to $4.0$, while fixing the values of $N_{x}\times {\rm \Delta} x$ and $R\times {\rm \Delta} x$. The former and the latter values correspond to the physical length of the domain and the physical radius of the droplet, respectively. For instance, we set the radius of the droplet $R=20$ and the domain size $N_{x}=132$ for ${\rm \Delta} x=1.0$. The simulation parameters are $\kappa _{1}=\kappa _{2}=\kappa _{3}=2$, $\tau _{1}=\tau _{2}=\tau _{3}=1$, $D_{1}=D_{2}=D_{3}=1$. The wall free energy density parameters are set with $g_{33}=0.2$ and the rest $g_{ij}=0.0$. The density $\rho$ and viscosity $\eta$ of the fluid are assigned as $1$. As depicted in figure 8(I), both the equilibrium contact angle $\theta$ and the Young–Laplace pressure ${\rm \Delta} P$ converge with the reduction in ${\rm \Delta} x$. Here, the thermodynamic pressure is defined as $P\equiv f(\boldsymbol \phi ^{e})-\sum _{j=1}^{K} \mu _{j}^{e} \phi _{j}^{e}$. For the optimization of simulation accuracy and computational effort, we select ${\rm \Delta} x=1.0$ as a compromise. Another convergence factor for the numerical discretization is the residual $eps$ for solving the Poisson equation in the Navier–Stokes equation via the conjugate gradient method. The simulation results in figure 8(II) demonstrate the convergence of the equilibrium contact angle $\theta$ and the thermodynamic pressure ${\rm \Delta} P$ with decreasing residual $eps$. As a consequence, we choose $eps=10^{-7}$ for our simulation, which presents both high accuracy and convergence speed. For verifying the numerical convergence of the Poisson equation, the space step is chosen to be ${\rm \Delta} x = {\rm \Delta} y = 1.0$.

Figure 8. The validation of the Navier–Stokes equation on the wetting problem. (I) The convergence of the equilibrium contact angle  $\theta$ and the thermodynamic pressure ${\rm \Delta} P$ with increasing mesh fineness ${\rm \Delta} x={\rm \Delta} y$. (II) The convergence of $\theta$ and ${\rm \Delta} P$ with decreasing residual $eps$ for solving the Poisson equation. (III) The Young–Laplace pressure ${\rm \Delta} P$ versus the reciprocal of the radius $1/R$ of the droplet for different compositions $P_{1}$ (square), $P_{2}$ (circle), $P_{3}$ (cross) and $P_{4}$ (triangle) of the symmetric phase diagram shown in figure 1. The dashed line illustrates the theoretical Young–Laplace relationship. (IV) The thermodynamic pressure ${\rm \Delta} P$ versus the curvature $1/R$ for different compositions $P_{1}$ (square), $P_{2}$ (circle), $P_{3}$ (cross) and $P_{4}$ (triangle) of the asymmetric phase diagram shown in figure 5. The dashed, dot-dashed, dotted and solid lines illustrate the theoretical curves from the Young–Laplace equation ${\rm \Delta} P=\gamma _{\alpha \delta }/R$.
Next, we place droplets with different droplet radii  $R$ on the substrate for compositions $P_{1}$, $P_{2}$, $P_{3}$ and $P_{4}$ for both the symmetric and the asymmetric phase diagrams. For the symmetric phase diagram, identical simulation parameters to those of § 8.1 are adopted. As shown in figure 8(III), for different droplet compositions marked by square ( $P_{1}$), circle ( $P_{2}$), cross ( $P_{3}$) and triangle ( $P_{4}$) symbols, the Young–Laplace pressure ${\rm \Delta} P$ from the phase-field simulation increases linearly with the curvature $1/R$. Compared with the theoretical expression ${\rm \Delta} P=\gamma _{\alpha \delta }/R$ depicted by the dashed line, the slope $\gamma _{\alpha \delta }$ equals the surface tension which is obtained by the path integral shown in figure 4(I) via (2.4). For the asymmetric phase diagram, the adopted simulation parameters are identical to those in § 8.2. As illustrated in figure 8(IV) by square ( $P_{1}$), circle ( $P_{2}$), cross ( $P_{3}$) and triangle ( $P_{4}$) symbols, the simulated Young–Laplace pressure is also proportional to $1/R$, but with distinct slopes for different compositions. For comparison with the Young–Laplace theory, we present the theoretical expression ${\rm \Delta} P=\gamma _{\alpha \delta }/R$, which is depicted by the dashed, dot-dashed, dotted and solid lines for compositions $P_{1}$, $P_{2}$, $P_{3}$ and $P_{4}$, respectively. Differing from the the results in figure 8(III), the Young–Laplace curves for different compositions differentiate from each other. This difference is caused by the distinct surface tensions for different compositions in the case of the asymmetric phase diagram, which are obtained by the path integral depicted in figure 5(I) via (2.4). As demonstrated in figure 8(IV), the simulation results quantitatively agree with the Young–Laplace relationship.
11. Fluid dynamics
11.1. Velocity field
In this section, we present the establishment of the equilibrium Young's angle with fluid flow for the symmetric phase diagram. The parameters are identical to those of § 8.1. The Péclet number, the Reynolds number and the Weber number all are set to be 1. As shown in figure 9, a semicircular droplet is initially placed on the substrate, corresponding to a contact angle of  $90^{\circ }$, which is far away from its equilibrium value $\theta =63^{\circ }$. Because of the imbalanced interfacial tension at the triple junction, the droplet spreads outwards, which results in the composition changes iterated by the wetting boundary condition (6.5). Despite the no-slip boundary condition, the composition on the substrate is updated according to the gradient descent method via (6.5). The evolution of the composition on the substrate leads to a composition gradient at the bulk region above the surface. Thereafter, the thermodynamic force $\boldsymbol f_{s}= -\sum _{j=1}^{K-1}\phi _{j}\boldsymbol {\nabla }(\mu _{j}-\mu _{K})$ is engendered and propels the fluid flow starting from the triple junction. As can be noticed at $t=2.5$ in figure 9(b), the maximal velocity is observed near the contact line and propagates gradually towards the matrix region, as shown by the black streamlines on the right-hand side of the panels. At $t=150$ and 400, a Marangoni vortex occurs at the interface, the formation of which is demonstrated in the next section. Finally, at $t=1200$, not only does the sessile droplet reach its equilibrium shape with $\theta =63^{\circ }$, but both substrate and bulk regions are thermodynamically stable as well. Consequently, without the thermodynamic force, the fluid flow decays markedly. Although very small velocity ( ${\sim }10^{-5}$) inside the domain can still be proved by the streamlines, its disappearance is only a matter of time, which is decided by the accuracy of the numerical model, and the relevant parameters in the Navier–Stokes equation, such as the viscosity $\eta$ and density $\rho$.

Figure 9. A semicircular droplet spreads with fluid flow to its equilibrium shape  $\theta =63^{\circ }$. Initial composition $P_{3}$ in the symmetric phase diagram is simulated and the initial droplet radius is $R=40$. The wall energy density parameter is identical to that of figure 8(I). The left half of each panel depicts the pressure, while the right half illustrates the velocity field with black solid streamlines. The colour bars beneath indicate the corresponding magnitudes.
The flow patterns in figure 9 are quite similar to the so-called bulk flow inside the droplet obtained by the sharp interface model (Diddens, Li & Lohse Reference Diddens, Li and Lohse2021). The origin of the present flow is the capillary force (6.9) which is proportional to the gradient of the chemical potential within the framework of the diffuse interface approach. Note that we use the concept of a generalized chemical potential rather than the surface tension for the evolution of the fluid flow. The point is that if the no-slip boundary condition is applied on the substrate, the contact line should not move. When introducing the chemical potential, the movement of the contact line is induced by the non-uniform chemical potential on the substrate, leading to the ‘slip’ effect. When the contact line is moving, the chemical potential is non-uniform in the bulk of the droplet–surrounding as well as at the droplet–surrounding interface, inducing the fluid flow. The chemical potential has two terms,  $\mu _{j}=\partial f/\partial \phi _{j}-2\kappa _{j} \nabla ^{2}\phi _{j}$, which is non-local. The former one $\partial f/\partial \phi _{j}$ is responsible for the bulk flow and the latter one $2\kappa _{j} \nabla ^{2}\phi _{j}$ mainly gives rise to the Marangoni flow. The present case has both flows. The competing effect of these two flows results in distinct flow patterns. An enhanced Marangoni flow at the interface can be achieved by imposing a strong dependence of the gradient energy coefficient $\kappa _{j}$ on the composition, which is out of the scope of the current work. The conventional Marangoni flow is induced by the surface tension gradient in the sharp interface concept. In the diffuse interface framework, the surface tension is the excess bulk free energy across the interface plus the gradient energy density. In this way, the gradient of the non-local chemical potential in the diffuse interface should be a more generalized driving force than the surface tension gradient in the sharp interface to account for the natural bulk and interfacial flows.
A difference of the present flow from that of Diddens et al. (Reference Diddens, Li and Lohse2021) is the boundary condition for the convection velocity at the droplet–surrounding interface. Because of the consideration of evaporation in Diddens et al. (Reference Diddens, Li and Lohse2021), the flow velocity in the normal direction  $\boldsymbol u\boldsymbol {\cdot }\boldsymbol m$ differs from $\boldsymbol u_{I}\boldsymbol {\cdot }\boldsymbol m$ ( $\boldsymbol m$ is the outward normal vector of droplet surface), where $\boldsymbol u_{I}$ is the interface velocity. The compensation is the diffusive flux. This boundary condition is derived based on a linear interpolation of the individual velocity of the components by mass fraction. However, it should be noted from the aspect of thermodynamics that the velocity is not an extensive variable. A linear interpolation/average of the individual velocity $\boldsymbol u_i$ engenders an additional contribution to the kinetic energy, which is proportional to the product of the individual velocities of the components, $\boldsymbol u_i\boldsymbol {\cdot } \boldsymbol u_j$, $i\neq j$. We refer to Abels et al. (Reference Abels, Garcke and Grün2012) for more discussions when diffusion is considered for two immiscible fluids with a large density ratio. In the present section and in the following analysis, the fluid velocity is assumed to be continuous in the normal direction; no evaporation takes place.
11.2. Comparison with wedge flow
In this section, we compare the flow field with the theory of Huh & Scriven (Reference Huh and Scriven1971). In Huh & Scriven (Reference Huh and Scriven1971), a planar  $\alpha$– $\delta$ interface at the triple junction is considered; the fluid contacts a solid wall with a contact angle of $\theta$. The wall moves with a constant velocity $\boldsymbol {U}= (U, 0, 0)$. By defining the stream function $\psi (r,\varphi )$ in the polar coordinates $(r,\varphi )$ with the origin at the triple junction,
 \begin{equation} u_{r}={-}\frac{1}{r}\frac{\partial \psi}{\partial \varphi},\quad u_{\varphi}=\frac{\partial \psi}{\partial r}, \end{equation}
we have the bi-harmonic equation for a 2-D steady-state flow:
 \begin{equation} \frac{1}{r}\frac{\partial}{\partial r}\left\{r \frac{\partial}{\partial r} \left[\frac{1}{r} \frac{\partial }{\partial r} \left(r \frac{\partial \psi_{i}}{\partial r}\right)\right]\right\}+ \frac{2}{r^{2}}\frac{\partial^{4}\psi_{i}}{\partial\varphi^{2}\partial r^{2}} +\frac{1}{r^{4}}\frac{\partial^{4}\psi_{i}}{\partial \varphi^{4}} -\frac{2}{r^{3}}\frac{\partial^{3}\psi_{i}}{\partial^{2}\varphi\partial r} + \frac{4}{r^{4}}\frac{\partial^{2} \psi_{i}}{\partial\varphi^{2}}=0. \end{equation}
In the individual fluids, we have the respective stream functions,  $\psi _{\alpha }$ and $\psi _{\delta }$. The general solution of the bi-harmonic equation for a bounded velocity in the polar coordinate reads (Huh & Scriven Reference Huh and Scriven1971)
 \begin{equation} \psi_{i}(r,\varphi)=r(a_{i}\sin \varphi +b_{i}\cos\varphi+ c_{i}\varphi\sin \varphi+d_{i}\varphi\cos\varphi),\quad r\geq0,\enspace \varphi\in[0, 180^\circ]. \end{equation}
The eight coefficients  $a_{i}$, $b_{i}$, $c_{i}$, $d_{i}$, $i=\alpha,\ \delta$, are determined by the corresponding boundary conditions (see details in the supplementary material). We highlight two boundary conditions which are modified in the current work. In Huh & Scriven (Reference Huh and Scriven1971), the normal velocities of the fluid–fluid interface are assumed to be zero:
 \begin{equation} \left.\frac{\partial \psi_{i}}{\partial r}\right|_{\varphi=\theta}=0,\quad i=\alpha,\ \delta. \end{equation}
This boundary is used to keep the interface planar. ‘Because the interface is idealized as being perfectly flat, no condition can be imposed on the normal stress acting at it’. In lieu of the assumption for the zero normal velocity at the fluid–fluid interface, we modify this boundary condition as
 \begin{equation} \left.\frac{\partial \psi_{\alpha}}{\partial r}\right|_{\varphi=\theta}= \left.\frac{\partial \psi_{\delta}}{\partial r}\right|_{\varphi=\theta}. \end{equation}
The modified condition ensures the continuity of the velocity in the normal direction of the fluid–fluid interface, which is known as the impenetrability constraint. In this way, the normal velocities at the interface in both fluids are not necessarily zero. This is the key way to achieve a Marangoni vortex across the liquid–liquid interface (Golovin, Nir & Pismen Reference Golovin, Nir and Pismen1995; Wang, Selzer & Nestler Reference Wang, Selzer and Nestler2015).
Another boundary condition in Huh & Scriven (Reference Huh and Scriven1971) is the stress balance in the tangential direction of the fluid–fluid interface:
 \begin{equation} \eta_{\alpha} \frac{\partial^{2}\psi_{\alpha}}{\partial\varphi^{2}}= \eta_{\delta}\frac{\partial^{2}\psi_{\delta}}{\partial\varphi^{2}}. \end{equation}
Notably, when applying the modified boundary condition for the normal velocity at the fluid–fluid interface, the stress balance condition has to be adjusted as well. The tangential viscous stress in polar coordinates is expressed as
 \begin{equation} \tau_{r\varphi}=\eta \left[r\frac{\partial }{\partial r}\left(\frac{u_{\varphi}}{r} \right) +\frac{1}{r}\frac{\partial u_{r}}{\partial \varphi}\right]. \end{equation}
Because of the zero normal velocity, the first term in the viscous stress of (11.7) vanishes and only the second term is considered in (11.7). By considering non-zero normal velocity, we modify the stress balance equation at the fluid–fluid interface as
 \begin{equation} \eta_{\alpha}\left[r\frac{\partial}{\partial r}\left(\frac{1}{r} \frac{\partial \psi_{\alpha}}{\partial r}\right)-\frac{1}{r^{2}} \frac{\partial^{2}\psi_{\alpha}}{\partial \varphi^{2}}\right]= \eta_{\delta} \left[r\frac{\partial}{\partial r}\left(\frac{1}{r}\frac{\partial \psi_{\delta}}{\partial r}\right) -\frac{1}{r^{2}}\frac{\partial^{2}\psi_{\delta}}{\partial \varphi^{2}}\right]. \end{equation}
Moreover, in the condition of (11.6), only the viscous stress is considered. The surface-tension-related curvature effect in the tangential dimension is overlooked. In this way, the Marangoni flow cannot come into play. We modify this boundary in the next section to account for the Marangoni effect. Other boundary conditions are the same as in Huh & Scriven (Reference Huh and Scriven1971) and listed in the supplementary material.
With the theory of Huh & Scriven (Reference Huh and Scriven1971), an exemplary streamline for a contact angle of  $\theta =90^\circ$ and a viscosity ratio of $\eta _{\alpha }/\eta _{\delta }=0.01$ is illustrated in figure 10(I-c) (see Appendix B for other contact angles). Two flow vortices appear in the low-viscosity fluid (left) and one flow vortex is observed in the high-viscosity liquid (right). We consider the same scenario in the simulation, as demonstrated figures 10(I-a) and 10(I-b). Some important set-ups are adopted in the simulation. (i) The wall velocity $U$ is used to calculate the viscous shear force on the first layer on top of the substrate (Jacqmin Reference Jacqmin2000). (ii) The variation of the viscosity in space is achieved by expressing its dependence on the composition as
 \begin{equation} \eta(\boldsymbol \phi)=\exp[-\varsigma(\phi_{3}-\phi_{3}^{\delta})]. \end{equation}
The viscosity ratio is controlled by the factor  $\varsigma$; a value of $\varsigma =-7$ leads to a viscosity ratio of $\eta _{\alpha }/\eta _{\delta }=0.01$. In comparison with the linear interpolation, the exponential function avoids non-physical values of negative viscosity and is more numerically stable. Note that the exponential relation does not mean that the viscosity varies exponentially across the interface. The composition is symmetric in space for a flat interface. For a curved interface, the composition profile is slightly curved according to the Gibbs–Thomson relation. In this way, the viscosity is almost symmetric across the interface but affected by the curvature. (iii) Inflow and outflow boundary conditions are applied on the left, right and top boundaries. (iv) The reciprocal of the Weber number is set to be 0, e.g. $\varepsilon \equiv {1}/{{We}}=0$, so that the surface tension ( ${\propto }{1}/{{We}}$) has no effect on the flow evolution. The streamlines from the simulation are demonstrated in figure 10(I-a). A noticeable difference from Huh & Scriven (Reference Huh and Scriven1971) is the non-zero normal velocity at the fluid–fluid interface. To compare the simulation with the theory of Huh & Scriven (Reference Huh and Scriven1971), we subtract all the velocity by a reference value to have an almost zero normal velocity at the fluid–fluid interface. The resulting streamlines in the reference frame are depicted in figure 10(I-b). This strategy has been used in Jacqmin (Reference Jacqmin1996) as well. As in the theory of Huh & Scriven (Reference Huh and Scriven1971), two flow vortices are observed in the low-viscosity liquid and one flow vortex is achieved in the high-viscosity liquid. A noticeable difference of figure 10(I-b) from figure 10(I-c) is that the streamlines close to the substrate pass through the interface near the triple junction. This characteristic is also observed in the simulation results of Jacqmin (Reference Jacqmin2000) and is further discussed in figure 11(V).

Figure 10. Comparison with wedge flow for a contact angle of 90 $^\circ$. The simulations are based on composition $P_{3}$ of the symmetric phase diagram. The Reynolds number is 1. The reciprocal of the Weber number is zero ( $\varepsilon \equiv {1}/{{We}}=0$) to exclude the surface tension effect. (I) The streamlines from the simulation with $g_{ij}=0$ corresponding to a contact angle of 90 $^\circ$ and a viscosity ratio of 0.01 (a), and from the theory of Huh & Scriven (Reference Huh and Scriven1971) (c). For comparison, a reference velocity of order $U/1000$ is subtracted in (a) to account for the reference frame; the resulting streamlines are shown in (b). In the theory, by applying the boundary conditions, we obtain the following coefficients for the streamlines: $a_{\alpha }=2.35$, $b_{\alpha }=-4.24$, $c_{\alpha }=-1.5$, $d_{\alpha }=1.35$, $a_{\delta }=-1.01$, $b_{\delta }=0$, $c_{\delta }=6.45$, $d_{\delta }=0.014$. (II) The streamlines for a viscosity ratio of 1 from simulation (a) and the theory of Huh & Scriven (Reference Huh and Scriven1971) (b). (III) A quantitative comparison for the velocity $u_{r}/U$ in the vertical direction along the interface as a function of the viscosity ratio between simulation and the theory of Huh & Scriven (Reference Huh and Scriven1971).

Figure 11. Flow pattern with Marangoni effect for a flat liquid–liquid interface and a contact angle of 90 $^\circ$. (I) In the simulation, composition $P_{3}$ of the symmetric phase diagram is considered. The Reynolds number and Weber number are 1 and 10, respectively. The viscosity ratio is 1 by assigning $\varsigma =0$. For the theoretical streamlines, the coefficients are $a_{\alpha }=6.87$, $b_{\alpha }=-6.28$, $c_{\alpha }=-{\rm \pi}$, $d_{\alpha }=2$, $a_{\delta }=-3$, $b_{\delta }=0$, $c_{\delta }={\rm \pi}$, $d_{\delta }=2$. The pulling velocity of the substrate is $U=1$. (II) The simulation set-up is the same as (I) except for a different viscosity ratio of 0.01. For the theoretical streamlines, the coefficients are $a_{\alpha }=3.71$, $b_{\alpha }=-6.28$, $c_{\alpha }=-2.13$, $d_{\alpha }=2$, $a_{\delta }=-0.85$, $b_{\delta }=0$, $c_{\delta }=0.76$, $d_{\delta }=-0.16$. (III) The simulation set-up is identical to (II) except that the composition is $P_{1}$. The Marangoni vortex vanishes for composition $P_{1}$. (IV) A decrease of the Weber number to 1 (increasing the Marangoni effect by a factor of 10), we again obtain a similar flow pattern with three vortices. (V) Comparison with the flow patterns in Jacqmin (Reference Jacqmin2000) for $\theta =90^\circ$ and $\eta _{\alpha }/\eta _{\delta }=1$. (a) Reproduced with permission, Copyright Cambridge University Press 2000. (b) Theoretical flow patterns with $a_{\alpha }=2.26$, $b_{\alpha }=-1.89$, $c_{\alpha }=-9.43$, $d_{\alpha }=6$, $a_{\delta }=-7$, $b_{\delta }=0$, $c_{\delta }=9.43$, $d_{\delta }=6$. (c) Theoretical flow patterns with $a_{\alpha }=1.75$, $b_{\alpha }=-2.20$, $c_{\alpha }=-1.1$, $d_{\alpha }=0.7$, $a_{\delta }=-1.7$, $b_{\delta }=0$, $c_{\delta }=1.1$, $d_{\delta }=0.7$.
We reconsider the reasonableness of the condition (11.4). In the simulation, we set a viscosity ratio of 1 by setting  $\varsigma =0$ and the substrate is pulling to the right with a velocity of $U=1$. The streamlines from the simulation are presented in figure 10(II-a). The resulting parallel streamlines demonstrate a linear velocity in the vertical dimension, which is obviously the solution of the Laplace equation for the fluid velocity. However, according to the theory of Huh & Scriven (Reference Huh and Scriven1971), we obtain two flow vortices, as shown in figure 10(II-b). These theoretical streamlines significantly differ from our simulation results with continuous non-zero normal velocity at the fluid–fluid interface. The reason for these differences is as follows. The theory of Huh & Scriven (Reference Huh and Scriven1971) considers a sharp interface model, where the triple junction is a singularity point. By using the resulting coefficients $a_{i}$, $b_{i}$, $c_{i}$ and $d_{i}$, it can be readily shown that the velocities $u_{r}$ and $u_{\varphi }$ at the triple junction $r=0$, $\varphi =90^\circ$ are different in the $\alpha$ and $\delta$ phases. This indicates a discontinuity in the fluid velocity at the triple junction, giving rise to a breakup of the velocity at the fluid–fluid interface. This result is non-physical on the continuum scale since there is no reason for the discontinuity in the fluid velocity when the two fluids have the same viscosity (equal viscosity and no surface tension means one-phase flow). In contrast to the sharp interface model, the diffuse interface model in the current work avoids the singularity problem in the continuum scale and the fluid velocity is continuous everywhere. In the diffuse interface, the triple junction is resolved by a triple region. The movement of the triple region is governed by the natural boundary condition, resulting from the minimization of the free energy functional $\mathcal {F}(\boldsymbol \phi, \boldsymbol {\nabla }\boldsymbol \phi )$ in accordance with the energy law. The question of whether the diffuse interface model resolves the singularity problem has been discussed by Cox (Reference Cox1986) and Jacqmin (Reference Jacqmin2000). The answer is yes. Detailed discussions about the contact line in the diffuse interface model are provided in Jacqmin (Reference Jacqmin2000).
Despite the difference in the normal velocity  $u_{\varphi }$, the tangential velocities $u_{r}$ at the fluid–fluid interface from the theory of Huh & Scriven (Reference Huh and Scriven1971) and the simulation are comparable, as demonstrated in figure 10(III). In the simulation, we vary the viscosity ratio $\eta _{\alpha }/\eta _{\delta }$ from 0.1 to 10 by changing the parameter $\varsigma$. When $\eta _{\alpha }/\eta _{\delta }=1$, we have the velocity parallel to the substrate and thus $u_r=0$ at the interface. When $\eta _{\alpha }/\eta _{\delta }<1$, the velocity $u_{r}$ is negative and downward (see figure 10I-c); when $\eta _\alpha /\eta _{\delta }>1$, the velocity $u_{r}$ becomes positive. The velocity $u_{r}$ as a function of the viscosity ratio is centrosymmetric with respect to the point $(\eta _{\alpha }/\eta _{\delta }, u_{r})=(1,0)$ in the logarithm scale. The reason is that the case $\eta _{\alpha }/\eta _{\delta }>1$ with a positive pulling velocity $U$ is identical to the scenario $\eta _{\delta }/\eta _{\alpha }<1$ with a negative pulling velocity $-U$. As shown in figure 10(III), the simulation results for $u_r$ coincide well with the analysis of Huh & Scriven (Reference Huh and Scriven1971).
Next, by using the modified boundary condition (11.5), we obtain distinct flow patterns according to the theory of Huh & Scriven (Reference Huh and Scriven1971). The theoretical flow patterns for a viscosity ratio of 1 and 0.01 are shown in figures 11(I-b) and 11(II-b), respectively. In the former case, we observe three flow vortices, one on the left, one on the right and one across the interface; the flow pattern is symmetric to the interface. With an increase in the viscosity of the right-hand fluid by a factor of 100, the symmetric flow pattern breaks down; all the flow vortices tilt to the less viscous fluid. In the simulations, we obtain similar flow patterns by varying the viscosity ratio (figures 11I-a and 11II-a). A difference of the simulation from figure 10 is that the Weber number is set to  $10$ in figures 11(I) and 11(II). A Weber number of 10 and a Reynolds number of 1 indicate a comparable effect between surface tension and the viscous forces. The left and right flow vortices result from the viscous effect. The flow ray passing through the interface is attributed to the Marangoni force, as is demonstrated in the next section; this flow ray is what is observed in figure 9 at $t=150$ and $t=400$. In both theory and simulations, we see that the streamlines pass through the interface, demonstrating non-zero normal velocity at the fluid–fluid interface.
According to (11.3), the normal velocity at the fluid–fluid interface for  $\theta =90^\circ$ is proportional to the coefficient $d_{\alpha }$. By using the modified boundary condition (11.5), a constraint has been removed. In order to have a well-defined system of equations for the coefficients of the stream function, we assign a value for $d_{\alpha }$ to account for the effect of the normal velocity; in this way, a constant velocity $u_{\varphi }$ is assigned to the interface. This is of course not a rigorous mathematical derivation, but rather an empirical model with idealization. The empirical model indeed provides a way to explain the Marangoni effect, where the normal velocity is non-zero. The validity of the empirical model is further demonstrated in figure 11(V) by comparing with the numerical results of Jacqmin (Jacqmin Reference Jacqmin2000). Based on the theoretical flow pattern in figure 11(I-b), we decrease $d_{\alpha }$ to 0.7 and obtain narrow and compressed flow ray across the interface, as shown in figure 11(V-b). In contrast, an increase in the value of $d_{\alpha }$ results in broad flow rays across the interface, as depicted in figure 11(V-c). The flow pattern in figure 11(V-b) is comparable with the numerical results obtained in Jacqmin (Reference Jacqmin2000), where the Laplace equation for the chemical potential and the bi-harmonic equation for the stream function are solved numerically. A difference is that the flow near the substrate at the triple junction passes through the interface in figure 11(V-a), while the flow cannot pass the triple junction in figure 11(V-b). Note that the streamline in figure 11(V-b) at the substrate is parallel to the substrate away from the triple junction and suddenly becomes upward/downward at the triple junction. This characteristic obtained by Jacqmin is also observed in our simulation results (figures 11(I,II) and 10(I)).
Next, we analyse the Marangoni effect by considering the balance between the gradient of the chemical potential and the viscous stress. In the diffuse interface model, the Marangoni force is computed by the gradient of the chemical potential  $-\sum _{j=1}^{K-1} \phi _{j} \boldsymbol {\nabla } (\mu _{j} -\mu _{K})$ subjected to the Gibbs–Duhem relation. Its balance with the viscous stress in the tangential direction $\boldsymbol {t}$ is expressed as
 \begin{equation} -\sum_{j=1}^{K-1} \phi_{j}\boldsymbol{\nabla} (\mu_{j}-\mu_{K}) \boldsymbol{\cdot} \boldsymbol t =\boldsymbol n \boldsymbol{\cdot} \eta_{\alpha} (\boldsymbol{\nabla} \boldsymbol u_{\alpha}+ \boldsymbol{\nabla} \boldsymbol u_{\alpha}^{{\rm T}}) \boldsymbol{\cdot} \boldsymbol t - \boldsymbol n \boldsymbol{\cdot}\eta_{\delta} (\boldsymbol{\nabla} \boldsymbol u_{\delta} + \boldsymbol{\nabla} \boldsymbol u_{\delta}^{{\rm T}})\boldsymbol{\cdot} \boldsymbol t. \end{equation}
For an incompressible fluid, this balance equation is rewritten as
 \begin{equation} \sum_{j=1}^{K-1} (\mu_{j}-\mu_{K})\boldsymbol{\nabla} \phi_{j} \boldsymbol{\cdot} \boldsymbol t =\boldsymbol n \boldsymbol{\cdot} \eta_{\alpha} (\boldsymbol{\nabla} \boldsymbol u_{\alpha}+ \boldsymbol{\nabla} \boldsymbol u_{\alpha}^{{\rm T}}) \boldsymbol{\cdot} \boldsymbol t - \boldsymbol n \boldsymbol{\cdot}\eta_{\delta} (\boldsymbol{\nabla} \boldsymbol u_{\delta} + \boldsymbol{\nabla} \boldsymbol u_{\delta}^{{\rm T}})\boldsymbol{\cdot} \boldsymbol t. \end{equation}
 These two equations indicate that either the chemical potential or the composition gradient induces Marangoni flow. A difference of the wetting effect of the present ternary fluid from the binary liquid is demonstrated in figures 11(III) and 11(IV). By changing the composition from  $P_{3}$ to $P_{1}$ and keeping all other conditions the same, we see that the Marangoni vortex vanishes (figure 11(III)). However, with a decrease in the Weber number to 1 and fixing all other conditions, the Marangoni vortex appears again (figure 11(IV)), resulting from the competing effect with the viscous force. This demonstrates that the Marangoni flow in the ternary system is strongly dependent on composition and phase diagram. The absolute value of the chemical potential at composition $P_{1}$ is less than that at $P_{3}$ (see figure 4), so that the Marangoni effect at $P_{1}$ is less pronounced than at $P_{3}$.
11.3. Comparison with theory coupling with fluid flow and chemical potential
The wetting effect of a two-component and two-phase system is in fact a mathematical problem of the coupled Laplace and bi-harmonic equations (Jacqmin Reference Jacqmin2000). The former and the latter are responsible for the chemical potential and the stream function, respectively. By considering the coupling between the chemical potential and the stream function, a leading-order analysis has been carried out by Jacqmin (Reference Jacqmin2000). This analysis for the stream function and chemical potential is valid for  $\theta =90^\circ$ and a viscosity ratio of 1. As in the work of Huh & Scriven (Reference Huh and Scriven1971), the leading-order analysis of Jacqmin (Reference Jacqmin2000) is for a planar interface, where the curvature effect is not considered. Because of the singularity at the triple junction, it is a knotty issue to address the analytical solution of the coupled Laplace and bi-harmonic equations. In addition, for multicomponent liquids, one should envisage a system of coupled Laplace equations for the chemical potential of different components. This makes the analysis even more complex. In the diffuse interface approach, the singularity problem is avoided and the coupled Laplace equation can be solved numerically. In this section, we present a simple analysis for the wetting effect by considering the coupling between the chemical potential and the stream function. This analysis is an example for $\theta =90^\circ$ based on Wang et al. (Reference Wang, Selzer and Nestler2015).
The Marangoni effect in Jacqmin (Reference Jacqmin2000) is induced by pulling the wall with a velocity  $U$, which breaks down the symmetry of the composition across the interface. In contrast to this method, we place two nearby droplets to break down the symmetry of the composition. By this consideration, the analysis is carried out in bipolar coordinates ( $\varrho$, $\varphi$). The Laplace equation and the biharmonic equations read
 \begin{equation} \left.\begin{gathered} \nabla^{2} \mu_{i}=0,\\ \nabla^{2} \nabla^{2} \psi=0, \end{gathered}\right\} \end{equation}
and have the general solution
 \begin{equation} \left.\begin{gathered} \mu_{i}(\varrho,\varphi)=(\cos \varrho-\cos \varphi)^{1/2}\sum_{n=1}^{\infty} G_{n}\cosh(n+1/2)\varrho P_{n}(\cos\varphi),\\ \psi(\varrho,\varphi)=(\cos \varrho-\cos \varphi)^{{-}3/2}\sum_{n=1}^{\infty} X_{n}(\varrho) C_{n+1}^{{-}1/2}(\cos\varphi), \end{gathered}\right\} \end{equation}
where  $G_{n}$ and $X_{n}$ are coefficients to be determined by the boundary condition at the droplet–surrounding interface. The terms $P_{n}$ and $C_{n+1}^{-1/2}$ represent the Legendre and Gegenbauer polynomials, respectively. We refer to Wang et al. (Reference Wang, Selzer and Nestler2015) for a comprehensive analysis. In contrast to a planar interface, we apply the stress balance between the viscous stress and the chemical potential gradient in the tangential direction on the surface of the droplet:
 \begin{equation} \eta_{\alpha}\tau^{\alpha}_{\varrho\varphi} - \eta_{\delta}\tau^{\beta}_{\varrho\varphi} = \frac{Re}{We}\sum_{j=1}^{K}\left(\frac{\cosh \varrho-\cos\varphi}{q}\right) \frac{\partial \mu_{j}}{\partial \varphi}. \end{equation}
The factor  $q$ relates to the radius of the droplet in bipolar coordinates. For $\theta =90^\circ$, the analysis for the wetting effect is obtained by considering the mirror symmetry with the following boundary conditions at the substrate:
 \begin{equation} \frac{\partial \mu_{i}}{\partial y}=\frac{\partial \psi}{\partial y}= \frac{\partial^{3} \psi}{\partial y^{3}}=0. \end{equation}
 The isolines of the chemical potential and the streamlines from the analysis are shown in figure 12(II) for a viscosity ratio of 1 and a contact angle of  $90^\circ$. The isolines of the chemical potential near the substrate are perpendicular to the substrate, demonstrating a contact angle of $90^\circ$ in the analysis. The non-uniform chemical potential along the droplet interface is balanced with the viscous stress, inducing the Marangoni flow. The streamlines near the substrate are parallel to the substrate, resulting from the no-slip constraint for the fluid velocity on the substrate. As shown in the analysis, we observe the formation of two Marangoni vortices within the gap of the two droplets. The streamline passes through the droplet interface, resulting from the boundary condition for the continuity of the velocity in the normal direction of the droplet. The Marangoni vortex is also observed in the numerical simulation, as depicted in figure 12(I). Composition $P_4$ for the symmetric phase diagram is used for the simulation. The droplet has a radius of 40 and a distance apart of 10. The Weber and Reynolds numbers both are set to be 1. Inflow and outflow boundary conditions are used on the left, right and top boundaries. Because of the geometrical asymmetry, the chemical potential within the gap of the droplet differs from that outside the droplet, as depicted by the isolines. This chemical potential gradient results in the Marangoni vortex. Both simulation and theory demonstrate the formation of two Marangoni vortices within the gap of the droplets.

Figure 12. Formation of Marangoni vortex from simulation and analysis for a contact angle of  $\theta =90^\circ$ and a viscosity ratio of 1. (I) Simulation results. Two droplets with a radius of 40 and an initial distance apart of 10 for composition $P_{3}$ of the symmetric phase diagram. The Weber and Reynolds numbers both are unity. (a) Streamlines and (b) isolines of the chemical potential $\mu _{3}$. (II) Analysis. (a) Streamlines and (b) isolines of the chemical potential. The analysis is based on solving the coupled Laplace and bi-harmonic equations in bipolar coordinates. In both simulation and theory, we observe the formation of the Marangoni vortex at the liquid–liquid interface.
12. Three immiscible fluids
In this section, we consider a three-phase three-component system. Not only are the  $\alpha$ phase and the $\beta$ phase immiscible with each other, but both phases are also immiscible with the $\delta$ matrix. Under such circumstance, the free energy landscape has three local minima, as demonstrated in figure 1(III).
Similar to the previous discussion, we validate our phase-field model for the three-phase configuration. The following simulation parameters are adopted:  $(\chi _{12},\chi _{13}, \chi _{23},\chi _{123})=(2.5,2.5,2.5,4.0)$. And $\kappa _{i}=1$, $D_{i}=1$, $\tau _{i}=1$ are chosen for all components, $i=1,2,3$. At the beginning, we place two circular (2-D) or spherical (3-D) droplets with a radius $R=40$ and a centre distance of $25$ on the substrate. The simulation domain size is $400\times 140$ for 2-D simulation and $200\times 74\times 200$ for 3-D simulation. To reduce the computational time, fluid dynamics is not considered during the time evolution.
The simulated equilibrium wetting morphologies in two and three dimensions are displayed in figures 13(I) and 13(II), respectively. Here, three different scenarios are investigated. (a) Left panel: both the  $\alpha$ phase (blue) and $\beta$ phase (red) are hydrophilic, which corresponds to the following wall free energy parameters: $g_{13}=-0.2$ and $g_{23}=-0.1$. (b) Middle panel: the $\beta$ phase is hydrophilic, while the $\alpha$ phase is hydrophobic. The wall free energy coefficients are selected as $g_{13}=-0.2$ and $g_{23}=0.2$. (c) Right panel: both the $\alpha$ and $\beta$ phases are hydrophobic with $g_{13}=0.3$ and $g_{23}=0.2$.

Figure 13. Wetting morphologies of three immiscible phases. (I) The 2-D simulation: blue,  $\alpha$ phase; red, $\beta$ phase; violet, $\delta$ phase. (II) The 3-D simulation. Top and bottom panels are top and side views, respectively. Blue, isosurface of $\alpha$ phase; red, isosurface of $\beta$ phase. The surrounding of the $\delta$ phase is transparent. In each case, three different scenarios are presented. Left panel: $\alpha$ and $\beta$ phases both are hydrophilic. Middle panel: $\alpha$ is hydrophobic and $\beta$ is hydrophilic. Right panel: $\alpha$ and $\beta$ both are hydrophobic.
The simulated contact angles on the substrate  $\theta _{ij}$ for all phases are tabulated in table 1 and prove to be directly comparable with the theoretical values via Young's law. The Young's contact angle is calculated by using the three interfacial tensions $\gamma _{\alpha \delta }$, $\gamma _{\alpha S}$ and $\gamma _{\delta S}$ which are estimated by the path integrals according to (5.2) and (5.3). The integral paths for cases (a)–(c) in two dimensions are shown in figures 14(I), 14(II) and 14(III), respectively.
Table 1. The contact angles from simulations in figure 13 compared with the theoretical values. The definition of contact angle corresponds to the notations in figure 2.


Figure 14. The composition integral routines on the three-phase diagram for the calculation of the interfacial tensions. The solid lines connect the black dotted equilibrium bulk compositions which vary from one to another across the interfaces. Red: phase  $\phi _{1}$ to $\phi _{3}$; blue: $\phi _{2}$ to $\phi _{3}$; grey: $\phi _{1}$ to $\phi _{2}$. The coloured dashed line traces the continuous changes from the bulk composition to its corresponding surface composition marked with an open circle.
For both 2-D and 3-D simulations, the equilibrium contact angles have very small deviations from the theory. Besides, we also compare the contact angles at the three-phase triple junction, namely  $\theta ^{\prime }_{12}$, $\theta ^{\prime }_{13}$ and $\theta ^{\prime }_{23}$, with the theoretical calculation according to Neumann's triangle rule. The precise naming method of all contact angles can be found in figure 2. The results are demonstrated in table 1 and excellent agreements between simulation and theory are observed. The contact angle in three dimensions differs slightly from that in two dimensions, which might be attributed to the different curvature constitution in two and three dimensions, as well as the measurement precision discussed in the supplementary material.
13. Conclusion
In conclusion, we have presented a ternary phase-field model for two different scenarios: (i) two components of the ternary system are miscible, which are immiscible with the third-component-rich phase, and (ii) all respective three-component-rich phases are immiscible with each other. In case (i), we have validated the contact angles with Young's law in both two and three dimensions. The effect of droplet composition and the wall free energy parameter on the variation of the contact angle is systematically studied. In particular, two distinct scenarios for the miscible fluids, namely symmetric and asymmetric phase diagrams, are considered for the wetting phenomenon. In both cases of the symmetric and asymmetric phase diagrams, the thermodynamic pressure varying with the radius of the droplet from the simulation is well consistent with the Young–Laplace equation. Apart from studying the static process for Young's contact angle and the Young–Laplace pressure, we also applied the present model for the kinetic process of evaporation. The simulation results exhibit the same power law as observed in experiments, but differ from the DLT for dilute solutions.
In the latter case (ii), we consider two immiscible droplets with different wettabilities on a solid substrate. The contact angle on the substrate and at the triple junction of three immiscible fluids shows good agreement with Young's law and with the Neumann triangle rule, respectively, in both two and three dimensions. This result is similar to recent work (Bala et al. Reference Bala, Pepona, Karlin, Kusumaatmaja and Semprebon2019). Differences from previous work are the variation of the surface composition varying with the wall free energy parameters, the 3-D simulations as well as the validation of the Young–Laplace pressure.
The model of the three immiscible fluids allows one to simulate simultaneous evaporation of two immiscible droplets. The present model for three immiscible fluids is based on a symmetric ternary phase diagram (figure 1(III)). As long as as the interfacial tensions are correctly modelled, the results for the static wetting angle should be independent of the real phase diagram. A realistic phase diagram used to be non-idealized and non-symmetric, which makes it more challenging to evaluate the free energy minimization path from one phase to another one. However, for the evaporation process, an idealized symmetric phase diagram loses its realistic physics.
A different opinion in the present work from previous ones is the introduction of the surface composition, which is consistent with the concept of Cahn (Reference Cahn1977). We have related the interfacial energies with the surface composition and validated the surface composition in the simulation with analytical solutions. This surface composition concept makes it possible to study a more realistic kinetic process of evaporation, where the composition evolves with time in the droplet and the interfacial energies change accordingly. Another distinct concept of the present work from previous ones is the miscible fluid. The miscible fluid can be considered as an individual phase that is immiscible with the surrounding phase, which corresponds to the two-phase model in the literature. However, when the droplet evaporates, the non-uniform distribution of the composition in the droplet cannot be handled by the two-phase model. The ternary fluid model of miscible fluid in combination with the surface composition concept could be applied for studying a variety of multicomponent and multiphase wetting phenomena coupling with evaporation, for example, coffee-ring effect.
Another discussion should concern the selection criterion for the coefficients of the wall free energy density,  $g_{ij}$. As a rule of thumb, for the term ${\sim } (\phi _{i})^{j}$ with an even power factor $j-1$, a negative value of the corresponding coefficient leads to a hydrophilic set-up and a positive coefficient results in a hydrophobic configuration, as shown in figure 13. This rule breaks down if the term ${\sim }(\phi _{i})^{j}$ with an odd power factor $j-1$ is considered. Because of the ( $K\times K$)-dimensional parametric space (for ternary case, $K=3$), the problem is hard to address numerically, as also pointed out in Bala et al. (Reference Bala, Pepona, Karlin, Kusumaatmaja and Semprebon2019). This problem may be investigated by studying the property of the matrix $\partial g/\partial \boldsymbol \phi$ to elaborate whether the interfacial energy increases or decreases along the direction of the composition vector following the energy minimization path.
The Marangoni effect has been discussed by comparing with the analysis of Huh & Scriven (Reference Huh and Scriven1971) and Jacqmin (Reference Jacqmin2000). From the comparative study, it is necessary to consider non-zero normal velocity to achieve the Marangoni vortex across the interface. The competition of Marangoni flow with the viscous drag force leads to distinct flow patterns in the process of dynamics wetting. An empirical model based on that of Huh & Scriven (Reference Huh and Scriven1971) has been developed by assigning a constant normal velocity to the interface. This result can somehow explain the Marangoni vortex competing with the viscous effect. The formation of the Marangoni vortex is further validated by comparing with an analysis by considering the stress balance between the viscous stress and the chemical potential gradient.
Supplementary material
Supplementary material is available at https://doi.org/10.1017/jfm.2023.561.
Acknowledgements
F.W. acknowledges Mr Guo for carrying out parts of the numerical simulations.
Funding
F.W. is grateful to the VirtMat project P09 ‘Wetting Phenomena’ of the Helmholtz association (MSE programme no. 43.31.02). H.Z. is grateful for funding of the research through the Gottfried-Wilhelm Leibniz prize NE 822/31-1 of the German Research Foundation (DFG). The authors acknowledge support by the state of Baden-Wuerttemberg through bwHPC.
Declaration of interests
The authors report no conflict of interest.
Appendix A. Non-dimensionalization
All the physical parameters are non-dimensionalized by the characteristic length  $x^*$, reference surface tension $\sigma ^*$ and diffusivity $D^*$. With these three reference values, we obtain the non-dimensionalized form of the model:
 \begin{equation} \left.\begin{gathered} \frac{\partial \phi_{i}}{\partial \tilde{t}} + \tilde{\boldsymbol{u}} \boldsymbol{\cdot} \tilde{\boldsymbol{\nabla}} \phi_{i}= \frac{\tilde{\boldsymbol{\nabla}}}{P\acute{e}}\boldsymbol{\cdot} \left[\sum_{j=1}^{K} \tilde{M}_{ij} \tilde{\boldsymbol{\nabla}} \left(\frac{\partial \tilde{f}}{\partial \phi_{j}}-\frac{2\widetilde{\kappa_{j}}}{ \alpha^{*}} \widetilde{\nabla^{2}} \phi_{j} \right) \right],\\ \tilde{\rho} \left(\frac{\partial \tilde{\boldsymbol{u}}}{\partial \tilde{t}} + \tilde{\boldsymbol{u}} \boldsymbol{\cdot} \tilde{\boldsymbol{\nabla}}\tilde{\boldsymbol{u}} \right) ={-}\frac{1}{We}\sum_{j=1}^{K-1}\phi_{i}\tilde{\boldsymbol{\nabla}}\left(\tilde{\mu}_{j}-\tilde{\mu}_{K} \right) -\frac{\tilde{\boldsymbol{\nabla}}\tilde{p}}{We}+ \frac{1}{Re}\tilde{\boldsymbol{\nabla}}\boldsymbol{\cdot} \left[\tilde{\eta}(\tilde{\boldsymbol{\nabla}}\tilde{\boldsymbol{u}}+\tilde{\boldsymbol{\nabla}} \tilde{\boldsymbol{u}}^{{\rm T}})\right],\\ \tilde{\boldsymbol{\nabla}}\boldsymbol{\cdot} \tilde{\boldsymbol{u}} = 0,\\ \tilde{\tau}_{i}\frac{\partial\phi_{i}}{\partial \tilde{t}}=2\tilde{\kappa}_{i} \tilde{\boldsymbol{\nabla}}\phi_{i}\boldsymbol{\cdot} \boldsymbol n - \frac{\partial \tilde{\varGamma}}{\partial \phi_{i}},\quad i=1,2,3. \end{gathered}\right\} \end{equation}
The dimensionless quantities  $Re$,
$Re$,  $We$ and $P\acute {e}$ are calculated as
 \begin{equation} Re=\frac{\rho^* u^* x^*}{\eta^*}, \quad We=\frac{\rho^* u^{*2} x^*}{\sigma^*},\quad P\acute{e}=\frac{u^* x^*}{D^*}. \end{equation}
Appendix B. Exemplary flow patterns for non-90$^{\circ }$ contact angle

Figure 15(a) shows the streamlines from the simulation for a contact angle of 67.8 $^{\circ }$, corresponding to $g_{33}=0.2$ in figure 4(II). The other parameters are identical to those of figure 11(I). For comparison, the analytical streamlines from the modified Huh & Scriven model are demonstrated in figure 15(b). In general, a good agreement between the simulation and theory is observed. A difference is noticed at the triple junction. The streamline from the theory does not pass through the interface near the triple junction suffering from the singularity. In the simulation, the streamline crosses over the interface near the triple junction because of the diffuse interface treatment, where the singularity is avoided and resolved in the continuum scale. The simulation and theory can be applied for other viscosity ratios ${\neq }1$ and contact angles, which will be discussed in forthcoming works.

Figure 15. Flow patterns for a contact angle of 67.8 $^{\circ }$. (a) Simulation. The parameters are identical to those of figure 11(I) except that the Young's contact angle is changed from 90 $^{\circ }$ to 67.8 $^{\circ }$. This contact angle is achieved by setting $g_{33}=0.2$, corresponding to figure 4(II). (b) Theory. The parameters in the modified Huh & Scriven model are $a_{\alpha }=17.57$, $b_{\alpha }=-9.43$, $c_{\alpha }=-6.87$, $d_{\alpha }=3$, $a_{\delta }=-11.44$, $b_{\delta }=0$, $c_{\delta }=11.36$, $d_{\delta }=10.44$. The pulling velocity of the substrate is $U=1$ and the viscosity ratio is $\eta _{\alpha }/\eta _{\delta }=1$.


 Open access