


1 Introduction
Understanding viscous drag reduction is a major challenge in engineering, since any achievement can potentially result in technological advances which affect the comfort of everyday life. For this reason, there is continuing interest in fundamental research and engineering development that are expected to produce beneficial effects on the economy and the environment.
A few techniques were discovered by chance that had a remarkable ability to produce a reduction of the friction drag, but only in the turbulent flow regime. Successful examples include dilute addition of high polymers (Toms Reference Toms1949), surfactant solutions (Zakin, Lu & Bewersdorff Reference Zakin, Lu and Bewersdorff1998), fibre suspensions (Metzner Reference Metzner1977) and dispersed particles (Lumley Reference Lumley1977). These discoveries initiated series of numerical simulations aimed at understanding the causative physics hidden behind as yet unclarified drag reduction effects (see, for example, Dimitropulos, Sureshkumar & Beris Reference Dimitropulos, Sureshkumar and Beris1998; Li et al. Reference Li, McLaughlin, Kontomaris and Portela2001; Dubief et al. Reference Dubief, White, Terrapou, Shaqfeh, Moin and Lele2004).
Following early ideas of Kramer (Reference Kramer1937), numerous attempts were made to achieve the drag reduction effect by structuring the wetted surface. A variety of riblet patterns aligned in the flow direction were investigated, both experimentally and numerically, but they produced only a modest drag reduction effect,
 $\text{DR}<10\,\%$
(Walsh Reference Walsh and Haugh1980; Choi, Moin & Kim Reference Choi, Moin and Kim1993; Bechert et al.
Reference Bechert, Bruse, Hage and Meyer2000). Additional evidence emerged from re-examination of early measurements made in pipes covered with sand-grained roughness (Nikuradze Reference Nikuradse1933; Tani Reference Tani1989) and experiments carried out in a plane channel consisting of walls covered with distributed arrow-shaped structures (Sirovich & Karlsson Reference Sirovich and Karlsson1997), surface-embedded grooves (Frohnapfel, Jovanović & Delgado Reference Frohnapfel, Jovanović and Delgado2007b
) or shallow dimples (Lienhart, Breuer & Köksoy Reference Lienhart, Breuer and Köksoy2008; Tay, Khoo & Chew Reference Tay, Khoo and Chew2015).
$\text{DR}<10\,\%$
(Walsh Reference Walsh and Haugh1980; Choi, Moin & Kim Reference Choi, Moin and Kim1993; Bechert et al.
Reference Bechert, Bruse, Hage and Meyer2000). Additional evidence emerged from re-examination of early measurements made in pipes covered with sand-grained roughness (Nikuradze Reference Nikuradse1933; Tani Reference Tani1989) and experiments carried out in a plane channel consisting of walls covered with distributed arrow-shaped structures (Sirovich & Karlsson Reference Sirovich and Karlsson1997), surface-embedded grooves (Frohnapfel, Jovanović & Delgado Reference Frohnapfel, Jovanović and Delgado2007b
) or shallow dimples (Lienhart, Breuer & Köksoy Reference Lienhart, Breuer and Köksoy2008; Tay, Khoo & Chew Reference Tay, Khoo and Chew2015).
Apart from techniques capable of producing viscous drag reduction by modifications of near-wall turbulence, attempts have been made to achieve a similar effect by delay of the laminar to turbulence transition to larger Reynolds numbers. Stabilization effects on laminar flow development were demonstrated by surface transpiration (Pfenninger Reference Pfenninger and Lachmann1961), flow acceleration (Schlicthing Reference Schlichting1968), surface heating or cooling (Dovgal, Levchenko & Timofeev Reference Dovgal, Levchenko, Timofeev, Arnal and Michael1989) or driving the initially laminar flow at high Mach numbers (Sternberg Reference Sternberg1952). The possibility that similar effects can be obtained by employing surface structuring was first reported by Irvine & Eckert (Reference Irvine and Eckert1960), who suggested the use of riblets. Experiments carried out by Grek, Kozlov & Titarenko (Reference Grek, Kozlov and Titarenko1996) revealed that riblets amplify small disturbances during the initial phase of their growth but damp during later stages, which implies that such flow control requires information about the stage of the transition development. The hypothesis that riblets can favourably influence the laminar to turbulent transition cannot be unambiguously supported by experiments or simulations (Ladd et al. Reference Ladd, Rohr, Reidy and Hendricks1993; Goldstein, Handler & Sirovich Reference Goldstein, Handler and Sirovich1995) owing to mutually compensating effects associated with the unfavourable influence of instability arising from inflectional velocity profiles appearing in the riblet valley region and beneficial stabilization due to axisymmetry in the apparent stresses in and around the midplane of the riblets, as discussed in § 2. Stabilization of the laminar boundary layer development was also attempted by creating finite-amplitude streaks (with a pronounced level of anisotropy) using an array of roughness elements, but with variable success (Sarić, Carpenter & Reed Reference Sarić, Carpenter and Reed2011).
Previous studies undertaken by the authors and co-workers (Jovanović et al.
Reference Jovanović, Pashtrapanska, Frohnapfel, Durst, Koskinen and Koskinen2006) established the unified theory of viscous drag reduction in wall-bounded flows, including validation using available databases of direct numerical simulations (Frohnapfel et al.
Reference Frohnapfel, Lammers, Jovanović and Durst2007a
). The starting point in considering viscous drag reduction relied on the role played by the average total energy dissipation
 $\overline{\unicode[STIX]{x1D6F7}}$
:
$\overline{\unicode[STIX]{x1D6F7}}$
:
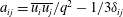
 $$\begin{eqnarray}\displaystyle & \displaystyle \overline{\unicode[STIX]{x1D6F7}}={\displaystyle \frac{1}{V}}\int _{V}\underbrace{\unicode[STIX]{x1D708}\left({\displaystyle \frac{\unicode[STIX]{x2202}\overline{U}_{i}}{\unicode[STIX]{x2202}x_{j}}}+{\displaystyle \frac{\unicode[STIX]{x2202}\overline{U}_{j}}{\unicode[STIX]{x2202}x_{i}}}\right){\displaystyle \frac{\unicode[STIX]{x2202}\overline{U}_{i}}{\unicode[STIX]{x2202}x_{j}}}}_{\text{I}}\,\text{d}V+{\displaystyle \frac{1}{V}}\int _{V}\underbrace{\unicode[STIX]{x1D708}\overline{\left({\displaystyle \frac{\unicode[STIX]{x2202}u_{i}}{\unicode[STIX]{x2202}x_{j}}}+{\displaystyle \frac{\unicode[STIX]{x2202}u_{j}}{\unicode[STIX]{x2202}x_{i}}}\right){\displaystyle \frac{\unicode[STIX]{x2202}u_{i}}{\unicode[STIX]{x2202}x_{j}}}}}_{\text{II},\unicode[STIX]{x1D716}}\,\text{d}V={\displaystyle \frac{A_{w}\unicode[STIX]{x1D70F}_{w}U_{B}}{\unicode[STIX]{x1D70C}V}},\qquad & \displaystyle\end{eqnarray}$$
where the two highlighted terms correspond to (I) direct and (II) turbulent dissipation and their overall contribution to
 $\overline{\unicode[STIX]{x1D6F7}}$
can be evaluated from the work done against the wall shear stress,
$\overline{\unicode[STIX]{x1D6F7}}$
can be evaluated from the work done against the wall shear stress,
 $\unicode[STIX]{x1D70F}_{w}$
, per unit mass of the working fluid,
$\unicode[STIX]{x1D70F}_{w}$
, per unit mass of the working fluid,
 $\unicode[STIX]{x1D70C}V$
, where
$\unicode[STIX]{x1D70C}V$
, where
 $A_{w}$
is the wetted surface area and
$A_{w}$
is the wetted surface area and
 $U_{B}$
is the bulk velocity. An order of magnitude estimation shows that the largest contribution to
$U_{B}$
is the bulk velocity. An order of magnitude estimation shows that the largest contribution to
 $\overline{\unicode[STIX]{x1D6F7}}$
is due to turbulent dissipation,
$\overline{\unicode[STIX]{x1D6F7}}$
is due to turbulent dissipation,
 $\unicode[STIX]{x1D716}$
, which reaches a maximum at the wall and decays away from the wall region. This evidence leads to the conclusion that a drag reduction can be expected if the turbulent dissipation at the wall is minimized, leading to minimization of
$\unicode[STIX]{x1D716}$
, which reaches a maximum at the wall and decays away from the wall region. This evidence leads to the conclusion that a drag reduction can be expected if the turbulent dissipation at the wall is minimized, leading to minimization of
 $\overline{\unicode[STIX]{x1D6F7}}$
.
$\overline{\unicode[STIX]{x1D6F7}}$
.
By considering the dynamics of turbulence in the space formed by two scalar invariants,
 $\text{II}_{a}=a_{ij}a_{ji}$
and
$\text{II}_{a}=a_{ij}a_{ji}$
and
 $\text{III}_{a}=a_{ij}a_{jk}a_{ki}$
(Lumley & Newman Reference Lumley and Newmaan1977; Lumley Reference Lumley1978), of the anisotropy tensor,
$\text{III}_{a}=a_{ij}a_{jk}a_{ki}$
(Lumley & Newman Reference Lumley and Newmaan1977; Lumley Reference Lumley1978), of the anisotropy tensor,
 $a_{ij}=\overline{u_{i}u_{j}}/q^{2}-1/3\unicode[STIX]{x1D6FF}_{ij}$
(where
$a_{ij}=\overline{u_{i}u_{j}}/q^{2}-1/3\unicode[STIX]{x1D6FF}_{ij}$
(where
 $\overline{u_{i}u_{j}}$
and
$\overline{u_{i}u_{j}}$
and
 $q^{2}$
denote the Reynolds stress tensor and its trace, respectively), it was shown (Jovanović & Hillerbrand Reference Jovanović and Hillerbrand2005) that the turbulent dissipation rate must vanish at the wall,
$q^{2}$
denote the Reynolds stress tensor and its trace, respectively), it was shown (Jovanović & Hillerbrand Reference Jovanović and Hillerbrand2005) that the turbulent dissipation rate must vanish at the wall,
 $\unicode[STIX]{x1D716}_{\text{wall}}\rightarrow 0$
as
$\unicode[STIX]{x1D716}_{\text{wall}}\rightarrow 0$
as
 $x_{2}\rightarrow 0$
, if the velocity fluctuations in the near-wall region satisfy statistical axisymmetry with invariance to rotation about the axis aligned with the mean flow direction so the wall location corresponds to the one-component state. Owing to the invariances that must be satisfied in this special state of wall turbulence leading to
$x_{2}\rightarrow 0$
, if the velocity fluctuations in the near-wall region satisfy statistical axisymmetry with invariance to rotation about the axis aligned with the mean flow direction so the wall location corresponds to the one-component state. Owing to the invariances that must be satisfied in this special state of wall turbulence leading to
 $\unicode[STIX]{x1D716}_{wall}\rightarrow 0$
, kinetic energy
$\unicode[STIX]{x1D716}_{wall}\rightarrow 0$
, kinetic energy
 $k$
, which grows as
$k$
, which grows as
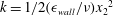 $k=1/2(\unicode[STIX]{x1D716}_{wall}/\unicode[STIX]{x1D708}){x_{2}}^{2}$
as
$k=1/2(\unicode[STIX]{x1D716}_{wall}/\unicode[STIX]{x1D708}){x_{2}}^{2}$
as
 $x_{2}\rightarrow 0$
, cannot be amplified and therefore turbulence must decay, leading to flow relaminarization (see § 5.4).
$x_{2}\rightarrow 0$
, cannot be amplified and therefore turbulence must decay, leading to flow relaminarization (see § 5.4).
We may further support the above fundamental deduction by examination of the Reynolds equations for the mean flow:
 $$\begin{eqnarray}\displaystyle & \displaystyle {\displaystyle \frac{\unicode[STIX]{x2202}\overline{U}_{i}}{\unicode[STIX]{x2202}t}}+\overline{U}_{k}{\displaystyle \frac{\unicode[STIX]{x2202}\overline{U}_{i}}{\unicode[STIX]{x2202}x_{k}}}=-{\displaystyle \frac{1}{\unicode[STIX]{x1D70C}}}{\displaystyle \frac{\unicode[STIX]{x2202}\overline{P}}{\unicode[STIX]{x2202}x_{i}}}+{\displaystyle \frac{\unicode[STIX]{x2202}}{\unicode[STIX]{x2202}x_{k}}}\left[\unicode[STIX]{x1D708}{\displaystyle \frac{\unicode[STIX]{x2202}\overline{U}_{i}}{\unicode[STIX]{x2202}x_{k}}}-\overline{u_{i}u_{k}}\right],\quad i,k=1,2,3, & \displaystyle\end{eqnarray}$$
in simple parallel wall-bounded flows by demanding statistical axisymmetry in the turbulent stress tensor
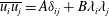 $\overline{u_{i}u_{j}}=A\unicode[STIX]{x1D6FF}_{ij}+B\unicode[STIX]{x1D706}_{i}\unicode[STIX]{x1D706}_{j}$
, where
$\overline{u_{i}u_{j}}=A\unicode[STIX]{x1D6FF}_{ij}+B\unicode[STIX]{x1D706}_{i}\unicode[STIX]{x1D706}_{j}$
, where
 $A$
and
$A$
and
 $B$
are scalar functions and
$B$
are scalar functions and
 $\unicode[STIX]{x1D706}_{i}$
is the unit vector constructed in a such way that
$\unicode[STIX]{x1D706}_{i}$
is the unit vector constructed in a such way that
 $\overline{u_{i}u_{j}}$
is invariant under rotation about the axis defined by its scalar arguments, say
$\overline{u_{i}u_{j}}$
is invariant under rotation about the axis defined by its scalar arguments, say
 $\unicode[STIX]{x1D706}_{i}=(1,0,0)$
. It is straightforward to show that for such a stress configuration, the Reynolds equations for the mean flow transform from the unclosed to the closed form:
$\unicode[STIX]{x1D706}_{i}=(1,0,0)$
. It is straightforward to show that for such a stress configuration, the Reynolds equations for the mean flow transform from the unclosed to the closed form:
 $$\begin{eqnarray}\displaystyle & \displaystyle {\displaystyle \frac{\unicode[STIX]{x2202}\overline{U}_{i}}{\unicode[STIX]{x2202}t}}+\overline{U}_{k}{\displaystyle \frac{\unicode[STIX]{x2202}\overline{U}_{i}}{\unicode[STIX]{x2202}x_{k}}}=-{\displaystyle \frac{1}{\unicode[STIX]{x1D70C}}}{\displaystyle \frac{\unicode[STIX]{x2202}}{\unicode[STIX]{x2202}x_{i}}}\underbrace{\left(\overline{P}+{\displaystyle \frac{1}{3}}\unicode[STIX]{x1D70C}q^{2}+{\displaystyle \frac{2}{3}}\unicode[STIX]{x1D70C}B\right)}_{modified\,\,pressure\,\,P^{\ast }}+\unicode[STIX]{x1D708}{\displaystyle \frac{\unicode[STIX]{x2202}^{2}\overline{U}_{i}}{\unicode[STIX]{x2202}x_{k}\unicode[STIX]{x2202}x_{k}}},\quad i,k=1,2,3, & \displaystyle\end{eqnarray}$$
and lead to solutions that coincide with corresponding solutions for laminar flows. It appears that statistical axisymmetry in the turbulent stresses is sufficient to discriminate conditions leading to forward and reverse transitions including requirements for persistence of stable laminar flow as shown in figure 1. In light of the above deductions inferred by exploring axisymmetry in
 $\overline{u_{i}u_{j}}$
, additional implications emerge from consideration of pipe flow subjected to rotation about the axis aligned with the flow direction. Results of direct numerical simulations (Pashtrapanska et al.
Reference Pashtrapanska, Jovanović, Lienhart and Durst2006) suggest that rotation reduces anisotropy and promotes turbulence in the viscous sublayer by increasing
$\overline{u_{i}u_{j}}$
, additional implications emerge from consideration of pipe flow subjected to rotation about the axis aligned with the flow direction. Results of direct numerical simulations (Pashtrapanska et al.
Reference Pashtrapanska, Jovanović, Lienhart and Durst2006) suggest that rotation reduces anisotropy and promotes turbulence in the viscous sublayer by increasing
 $\unicode[STIX]{x1D716}$
at the wall. Following this trend, it is expected that at sufficiently high rotation, turbulence will reach the state of minimum anisotropy, which coincides with the left boundary of the anisotropy-invariant map (Lumley & Newman Reference Lumley and Newmaan1977) and axisymmetric stress configuration
$\unicode[STIX]{x1D716}$
at the wall. Following this trend, it is expected that at sufficiently high rotation, turbulence will reach the state of minimum anisotropy, which coincides with the left boundary of the anisotropy-invariant map (Lumley & Newman Reference Lumley and Newmaan1977) and axisymmetric stress configuration
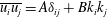 $\overline{u_{i}u_{j}}=A\unicode[STIX]{x1D6FF}_{ij}+Bk_{i}k_{j}$
with
$\overline{u_{i}u_{j}}=A\unicode[STIX]{x1D6FF}_{ij}+Bk_{i}k_{j}$
with
 $(\text{II}_{a})_{wall}=1/6$
, leading to unexpected laminarization denoted the rotation anomaly in the turbulence community (Jakirlić Reference Jakirlić1997).
$(\text{II}_{a})_{wall}=1/6$
, leading to unexpected laminarization denoted the rotation anomaly in the turbulence community (Jakirlić Reference Jakirlić1997).
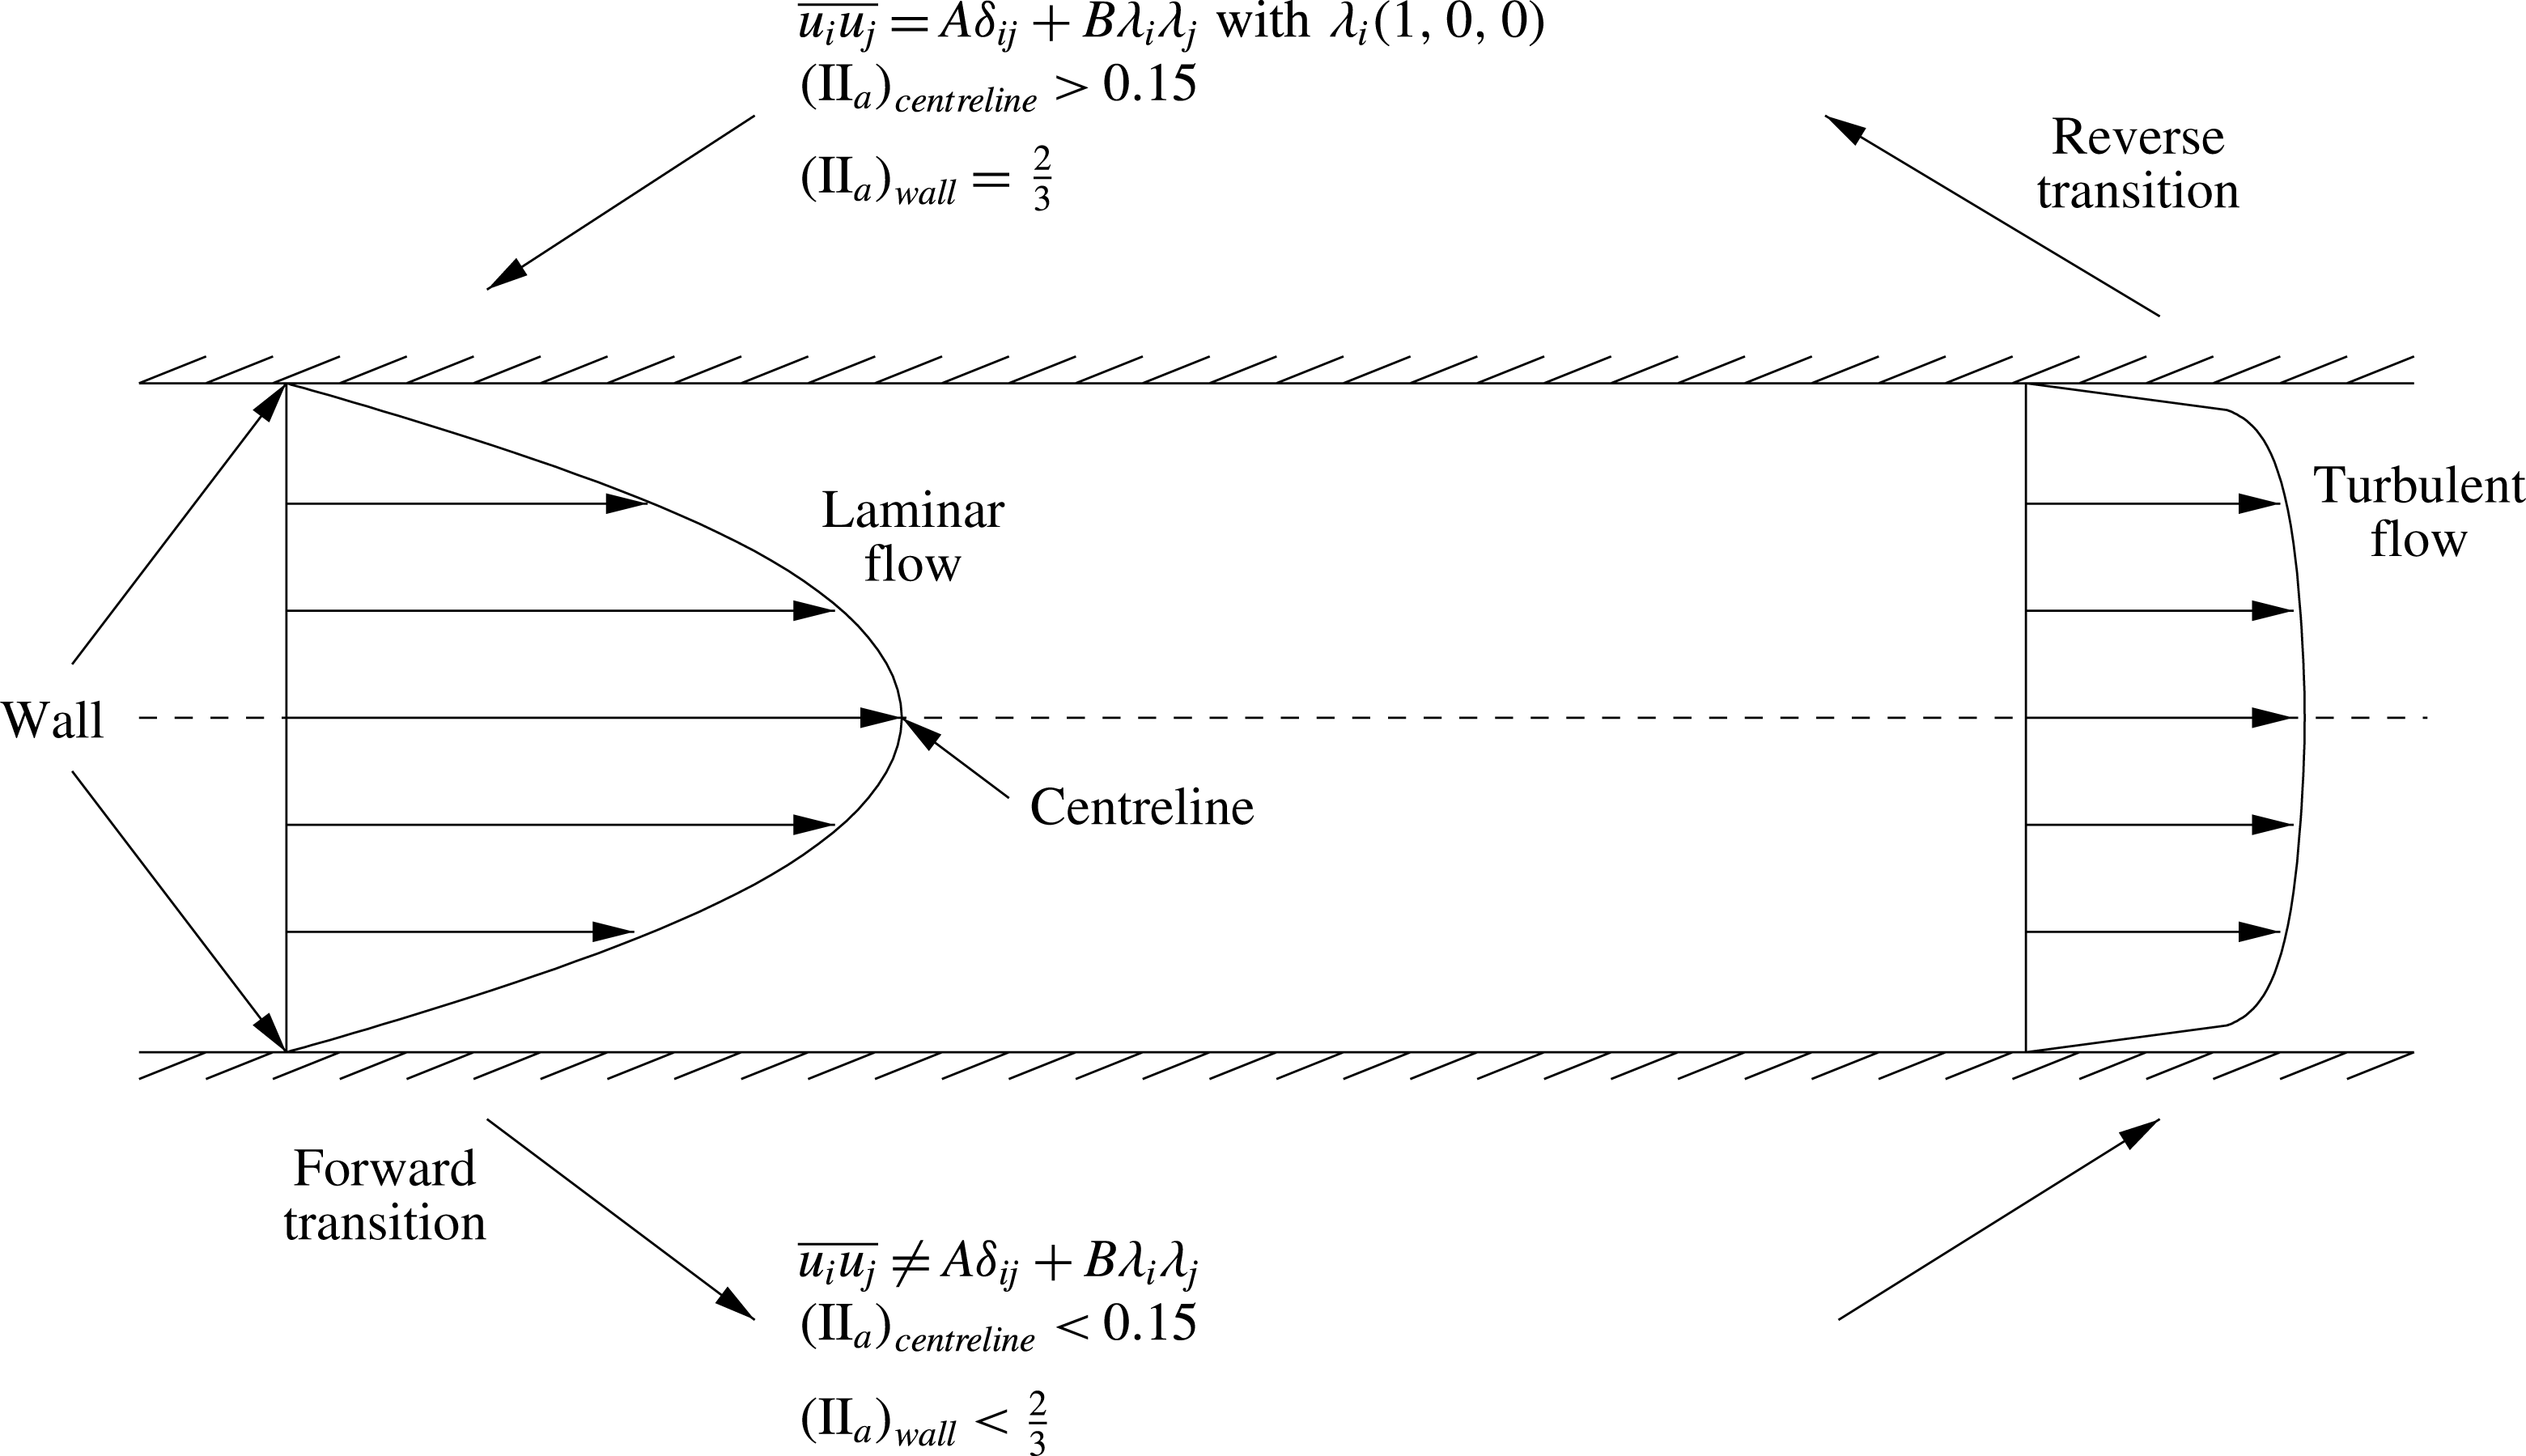
Figure 1. Statistical interpretation of forward and reverse transitions in wall-bounded flows (such as plane channel, circular pipe or boundary layer flow) based on presumed axisymmetry in the turbulent stresses
 $\overline{u_{i}u_{j}}$
(Jovanović et al.
Reference Jovanović, Pashtrapanska, Frohnapfel, Durst, Koskinen and Koskinen2006). Was the engineer Osborne Reynolds (Reference Reynolds1895) right or wrong in proposing flow decomposition leading to a statistical and not deterministic description of transition onset in a pipe flow?
$\overline{u_{i}u_{j}}$
(Jovanović et al.
Reference Jovanović, Pashtrapanska, Frohnapfel, Durst, Koskinen and Koskinen2006). Was the engineer Osborne Reynolds (Reference Reynolds1895) right or wrong in proposing flow decomposition leading to a statistical and not deterministic description of transition onset in a pipe flow?
In connection with the above issues, related to axisymmetry and laminarity, it is worth noting that Rotta (Reference Rotta1972) provided proof with necessary constraints for absence of the secondary flow in fully developed laminar duct flows of non-circular cross-sectional geometries. By considering Reynolds equations for the mean flow, instead of Navier–Stokes equations, he showed that for absence of secondary motions and therefore unidirectional laminar flow
 $\overline{u_{i}u_{j}}$
must assume the axisymmetric form.
$\overline{u_{i}u_{j}}$
must assume the axisymmetric form.
2 The rationale for design of the antiturbulence surface
Based on the considerations summarized above, we may attempt to produce a large viscous drag reduction by forcing the velocity fluctuations in the near-wall region to tend towards the statistically axisymmetric state and reach the one-component limit at the wall. The outstanding question is therefore whether and how this can be accomplished rationally by simple means such as modification of the surface morphology.
For internal flows, axisymmetry in
 $\overline{u_{i}u_{j}}$
can be promoted by design of the duct cross-sectional geometry. This can be accomplished by modification of the circular geometry with periodically arranged microgrooves placed along the duct bisector and embedded in the wall, as discussed by Lammers et al. (Reference Lammers, Jovanović, Frohnapfel and Delgado2012) and Daschiel et al. (Reference Daschiel, Krieger, Jovanović and Delgado2014). In connection with the above issues, we note that examination of the transport equations for the Reynolds stresses leads to the conclusion that an increase in surface curvature of a circular pipe reduces tangential and increases radial components of turbulent stresses, resulting in an increase in the anisotropy of turbulence with a tendency for
$\overline{u_{i}u_{j}}$
can be promoted by design of the duct cross-sectional geometry. This can be accomplished by modification of the circular geometry with periodically arranged microgrooves placed along the duct bisector and embedded in the wall, as discussed by Lammers et al. (Reference Lammers, Jovanović, Frohnapfel and Delgado2012) and Daschiel et al. (Reference Daschiel, Krieger, Jovanović and Delgado2014). In connection with the above issues, we note that examination of the transport equations for the Reynolds stresses leads to the conclusion that an increase in surface curvature of a circular pipe reduces tangential and increases radial components of turbulent stresses, resulting in an increase in the anisotropy of turbulence with a tendency for
 $\overline{u_{i}u_{j}}$
to approach more closely the axisymmetric state close to the wall. Anisotropy-invariant mapping of turbulence in circular pipe flows using databases of direct numerical simulations reveals higher anisotropy in the viscous sublayer compared with the plane channel and experiments performed in circular pipes confirmed an increase in the transition Reynolds number with increasing surface curvature, e.g. decreasing the pipe diameter (Pashtrapanska Reference Pashtrapanska2004; Haddad Reference Haddad2009).
$\overline{u_{i}u_{j}}$
to approach more closely the axisymmetric state close to the wall. Anisotropy-invariant mapping of turbulence in circular pipe flows using databases of direct numerical simulations reveals higher anisotropy in the viscous sublayer compared with the plane channel and experiments performed in circular pipes confirmed an increase in the transition Reynolds number with increasing surface curvature, e.g. decreasing the pipe diameter (Pashtrapanska Reference Pashtrapanska2004; Haddad Reference Haddad2009).
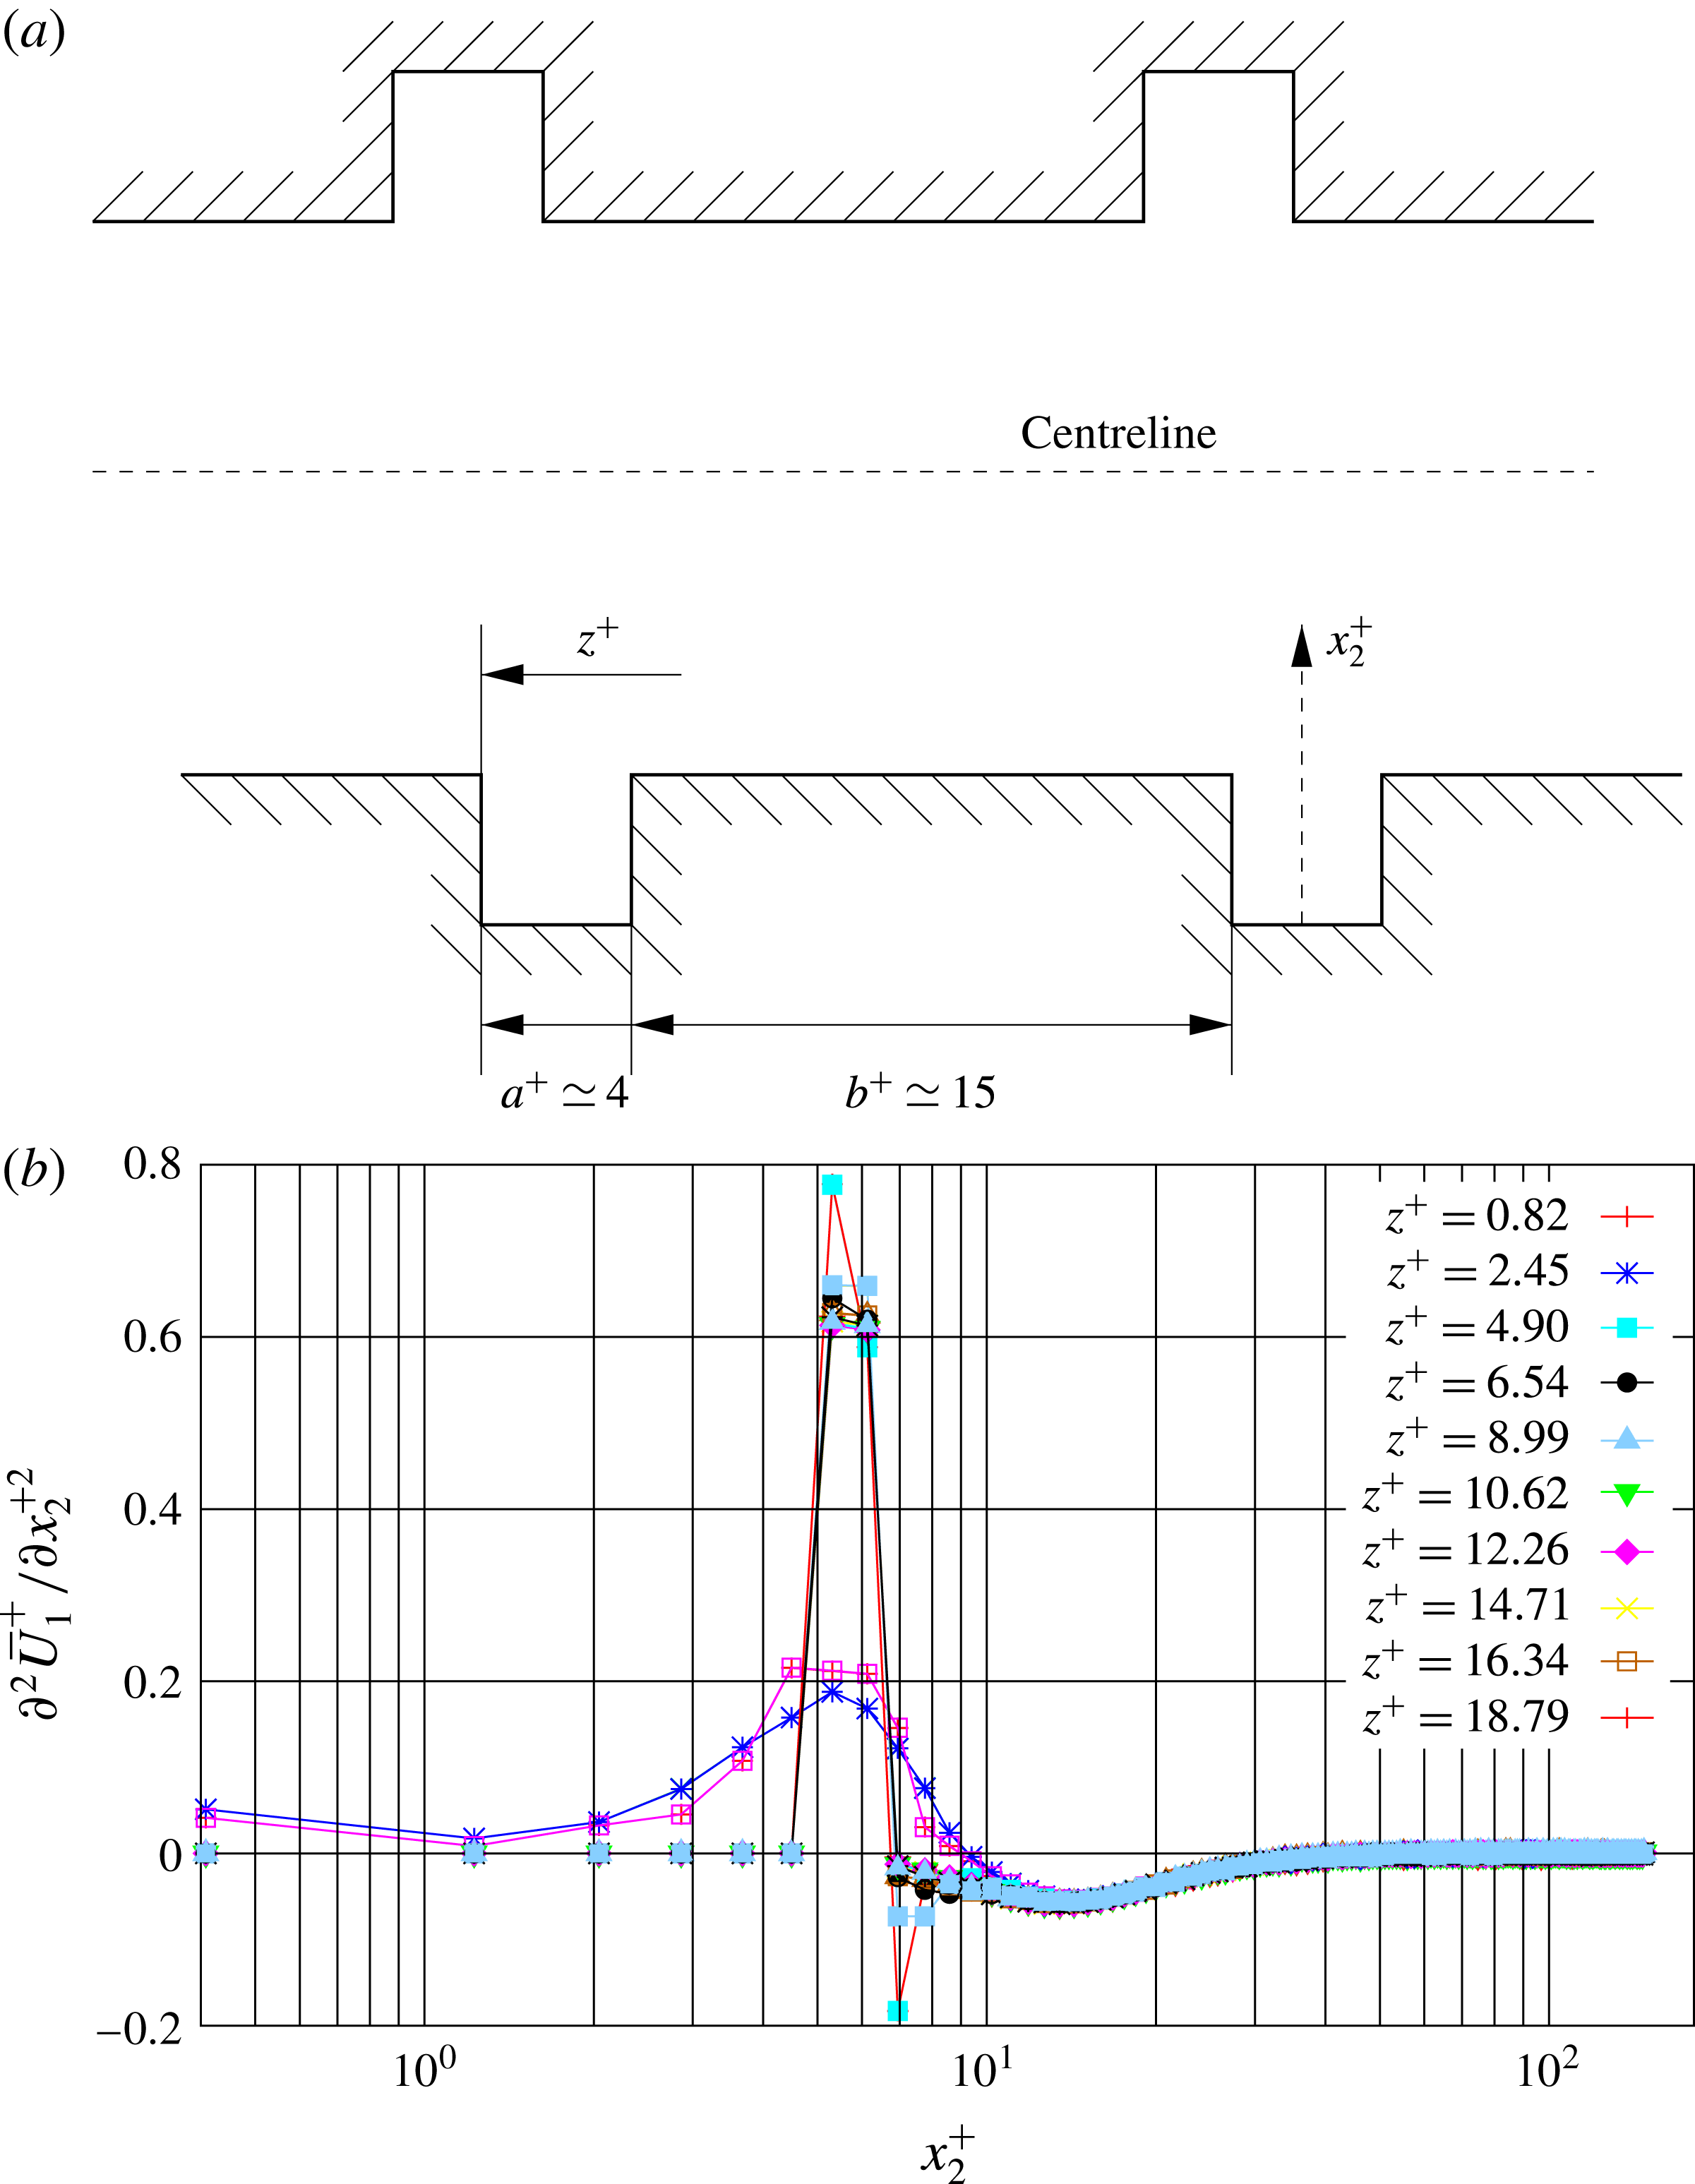
Figure 2. Two-dimensional channel with square grooves embedded in the wall (a). The flow direction is perpendicular to the plane of the figure. The curvature of the mean velocity profile (b), determined from direct numerical simulations by P. Lammers (2004, personal communication), indicates the presence of inflectional points across grooved and flat portions of the wall boundary and implies instability unless the grooves are extremely small. This suggests that a beneficial influence on drag reduction for such a groove geometry can be expected only under very special circumstances.
Following the fundamental deduction resulting from presumed axisymmetry in
 $\overline{u_{i}u_{j}}$
, square grooves embedded in the wall, sketched in figure 2(a), were suggested as a tentative surface modification for achieving high drag reduction (Frohnapfel et al.
Reference Frohnapfel, Jovanović and Delgado2007b
). Across the midplane of the groove, the velocity fluctuations in the normal (
$\overline{u_{i}u_{j}}$
, square grooves embedded in the wall, sketched in figure 2(a), were suggested as a tentative surface modification for achieving high drag reduction (Frohnapfel et al.
Reference Frohnapfel, Jovanović and Delgado2007b
). Across the midplane of the groove, the velocity fluctuations in the normal (
 $u_{2}$
) and lateral directions (
$u_{2}$
) and lateral directions (
 $u_{3}$
) are suppressed almost in the same fashion owing to the presence of side walls, so that turbulence assumes the axisymmetric state and reaches the one-component limit at the wall. Kinematic considerations involving invariances to rotation of
$u_{3}$
) are suppressed almost in the same fashion owing to the presence of side walls, so that turbulence assumes the axisymmetric state and reaches the one-component limit at the wall. Kinematic considerations involving invariances to rotation of
 $90^{\circ }$
about the axis aligned with the mean flow (resulting in
$90^{\circ }$
about the axis aligned with the mean flow (resulting in
 $\overline{u_{2}^{2}}=\overline{u_{3}^{2}}$
and
$\overline{u_{2}^{2}}=\overline{u_{3}^{2}}$
and
 $\overline{u_{1}u_{2}}=\overline{u_{1}u_{3}}$
) and reflection along the lateral direction (leading to
$\overline{u_{1}u_{2}}=\overline{u_{1}u_{3}}$
) and reflection along the lateral direction (leading to
 $\overline{u_{1}u_{3}}=\overline{u_{1}(-u_{3})}$
and consequently
$\overline{u_{1}u_{3}}=\overline{u_{1}(-u_{3})}$
and consequently
 $\overline{u_{1}u_{3}}=\overline{u_{1}u_{2}}=0$
) support this conjecture. The layout of the region between neighbouring grooves has to ensure that axisymmetry produced inside the grooves prevails over the entire wetted surface, resulting in a maximum drag reduction effect. The dense spacing between the grooves produces a surface structure similar to the fin type of riblets, which exhibit the drag reduction effect but induce undesired turbulence in the region above sharp edges caused by singularities in the surface geometry (Bechert et al.
Reference Bechert, Bruse, Hage and Meyer2000). Too wide a separation between the grooves does not allow axisymmetry to prevail over the entire surface.
$\overline{u_{1}u_{3}}=\overline{u_{1}u_{2}}=0$
) support this conjecture. The layout of the region between neighbouring grooves has to ensure that axisymmetry produced inside the grooves prevails over the entire wetted surface, resulting in a maximum drag reduction effect. The dense spacing between the grooves produces a surface structure similar to the fin type of riblets, which exhibit the drag reduction effect but induce undesired turbulence in the region above sharp edges caused by singularities in the surface geometry (Bechert et al.
Reference Bechert, Bruse, Hage and Meyer2000). Too wide a separation between the grooves does not allow axisymmetry to prevail over the entire surface.
Apart from an ability to promote axisymmetry, the grooved surface morphology induces unfavourable variations of the velocity profile in the vicinity of the surface. Inside the groove the velocity is extremely low. Approaching the groove top boundary, the velocity abruptly increases, creating inflectional profiles in wall-normal and spanwise directions, as shown in figure 2(b) (see Holmes, Lumley & Berkooz Reference Holms, Lumley and Berkooz1996, p. 77). Such profiles are inviscid–unstable and therefore suspected to cause rapid production of turbulence. Since fluctuations inside the groove are statistically axisymmetric, owing to constraints imposed by grooved side walls, such profiles cannot induce turbulence and the flow will remain laminar. However, in the region between grooves, inflectional profiles might induce the production of turbulence since statistical axisymmetry cannot be a priori guaranteed. This negative trend can be minimized by restricting the groove dimensions to a few viscous length scales, which implies that successful applications of simple square grooves are possible for weakly turbulent flows characterized by low turbulent Reynolds numbers,
 $R_{\unicode[STIX]{x1D706}}$
, and situations corresponding to marginal deviations of
$R_{\unicode[STIX]{x1D706}}$
, and situations corresponding to marginal deviations of
 $\overline{u_{i}u_{j}}$
from the axisymmetric state.
$\overline{u_{i}u_{j}}$
from the axisymmetric state.
By conical shaping of grooved side walls to intercept at a sharp angle approaching the groove bottom and adjusting the geometry of interspacing between grooves without discontinuities, it appears from the results of numerical experiments that under particular circumstances it might be possible to reach axisymmetry in
 $\overline{u_{i}u_{j}}$
, suppress the onset of turbulence and achieve persistence of the laminar regime even for the disturbed inlet flow conditions commonly met within technical practice. In the aerodynamic community, this very challenging goal is commonly termed the holy grail, implying that it cannot be reached with any of the existing approaches employed for the treatment of turbulence dynamics.
$\overline{u_{i}u_{j}}$
, suppress the onset of turbulence and achieve persistence of the laminar regime even for the disturbed inlet flow conditions commonly met within technical practice. In the aerodynamic community, this very challenging goal is commonly termed the holy grail, implying that it cannot be reached with any of the existing approaches employed for the treatment of turbulence dynamics.

Figure 3. Sketch of consecutive modifications of an initially square grooved surface leading to extended persistence of the laminar regime.
A design process for creating an antiturbulence surface is sketched in figure 3. The surface morphology, parameterized in terms of a few key parameters, is iteratively modified by varying the pattern dimensions until suppression of turbulence onset is achieved. The virtual design is performed numerically by running simulations within the few turnover time scales of turbulence
 $\unicode[STIX]{x1D70F}$
(Lee & Kim Reference Lee and Kim2002). This time scale corresponds to the time required to establish the high-wavenumber part of the turbulence spectrum and can be estimated as
$\unicode[STIX]{x1D70F}$
(Lee & Kim Reference Lee and Kim2002). This time scale corresponds to the time required to establish the high-wavenumber part of the turbulence spectrum and can be estimated as
 $\unicode[STIX]{x1D70F}=(H/2)/u_{\unicode[STIX]{x1D70F}}$
, where
$\unicode[STIX]{x1D70F}=(H/2)/u_{\unicode[STIX]{x1D70F}}$
, where
 $H$
is the channel height and
$H$
is the channel height and
 $u_{\unicode[STIX]{x1D70F}}$
is the wall shear velocity. It is interesting that during various stages of the design process, grooved surface patterns resemble the surface morphology of an Erlangen pipe (Lammers et al.
Reference Lammers, Jovanović, Frohnapfel and Delgado2012) and the region around the sharp corner of the triangular duct with a small apex angle where laminarity prevails over turbulence (Eckert & Irvine Reference Eckert and Irvine1956; Daschiel, Frohnapfel & Jovanović Reference Daschiel, Frohnapfel and Jovanović2013). The beneficial effect resulting from an increase in anisotropy on the development of wall-bounded flows also can be achieved using grids, honeycombs or blades placed in the shear flow normal to or along the flow direction. Experiments reported by Corke, Guezennec & Nabib (Reference Corke, Guezennec and Nabib1981), Corke, Nabib & Guezennec (Reference Corke, Nabib and Guezennec1982) show that downstream of the perturbation device anisotropy increases, resulting in a marked decrease of the skin friction compared to the skin friction measured upstream of the perturbation location. This evidence, however, should not be ignored or undervalued in view of the penalty arising from induced drag by the perturbation device itself resulting in no net drag decrease.
$u_{\unicode[STIX]{x1D70F}}$
is the wall shear velocity. It is interesting that during various stages of the design process, grooved surface patterns resemble the surface morphology of an Erlangen pipe (Lammers et al.
Reference Lammers, Jovanović, Frohnapfel and Delgado2012) and the region around the sharp corner of the triangular duct with a small apex angle where laminarity prevails over turbulence (Eckert & Irvine Reference Eckert and Irvine1956; Daschiel, Frohnapfel & Jovanović Reference Daschiel, Frohnapfel and Jovanović2013). The beneficial effect resulting from an increase in anisotropy on the development of wall-bounded flows also can be achieved using grids, honeycombs or blades placed in the shear flow normal to or along the flow direction. Experiments reported by Corke, Guezennec & Nabib (Reference Corke, Guezennec and Nabib1981), Corke, Nabib & Guezennec (Reference Corke, Nabib and Guezennec1982) show that downstream of the perturbation device anisotropy increases, resulting in a marked decrease of the skin friction compared to the skin friction measured upstream of the perturbation location. This evidence, however, should not be ignored or undervalued in view of the penalty arising from induced drag by the perturbation device itself resulting in no net drag decrease.
The objective of this study is to explore features of grooved surface morphology to achieve persistence of the laminar flow regime in modified channel flow for highly disturbed inflow conditions. Of special interest are: (i) a wall morphology capable of creating axisymmetry in turbulence fluctuations over the entire wetted surface; (ii) parameterization the geometry of the antiturbulence surface; and (iii) development of turbulence anisotropy and deviations in
 $\overline{u_{i}u_{j}}$
from the statistically axisymmetric state.
$\overline{u_{i}u_{j}}$
from the statistically axisymmetric state.
3 Governing equations and their numerical treatment
3.1 Governing equations
For the design of a structured surface with the ability to prevent turbulence development, direct numerical simulations were carried out by solving the governing equations consisting of mass and momentum conservation:
 $$\begin{eqnarray}\displaystyle & \displaystyle {\displaystyle \frac{\unicode[STIX]{x2202}U_{j}}{\unicode[STIX]{x2202}x_{j}}}=0, & \displaystyle\end{eqnarray}$$
 $$\begin{eqnarray}\displaystyle & \displaystyle {\displaystyle \frac{\unicode[STIX]{x2202}\unicode[STIX]{x1D70C}U_{i}}{\unicode[STIX]{x2202}t}}+{\displaystyle \frac{\unicode[STIX]{x2202}\unicode[STIX]{x1D70C}U_{i}U_{j}}{\unicode[STIX]{x2202}x_{j}}}=-{\displaystyle \frac{\unicode[STIX]{x2202}P}{\unicode[STIX]{x2202}x_{i}}}+{\displaystyle \frac{\unicode[STIX]{x2202}\unicode[STIX]{x1D70F}_{ij}}{\unicode[STIX]{x2202}x_{j}}},\quad i,j=1,2,3. & \displaystyle\end{eqnarray}$$
The fluid was assumed to be Newtonian with negligible compressibility effects, so that the viscous part of the stress tensor
 $\unicode[STIX]{x1D70F}_{ij}$
can be written in the form
$\unicode[STIX]{x1D70F}_{ij}$
can be written in the form
 $$\begin{eqnarray}\displaystyle & \displaystyle \unicode[STIX]{x1D70F}_{ij}=\unicode[STIX]{x1D707}\left({\displaystyle \frac{\unicode[STIX]{x2202}U_{i}}{\unicode[STIX]{x2202}x_{j}}}+{\displaystyle \frac{\unicode[STIX]{x2202}U_{j}}{\unicode[STIX]{x2202}x_{i}}}\right). & \displaystyle\end{eqnarray}$$
For all computations, the dynamic viscosity,
 $\unicode[STIX]{x1D707}$
, and the fluid density,
$\unicode[STIX]{x1D707}$
, and the fluid density,
 $\unicode[STIX]{x1D70C}$
, were considered to be constants:
$\unicode[STIX]{x1D70C}$
, were considered to be constants:
 $\unicode[STIX]{x1D70C}=1.2~\text{kg}~\text{m}^{-3}$
and
$\unicode[STIX]{x1D70C}=1.2~\text{kg}~\text{m}^{-3}$
and
 $\unicode[STIX]{x1D707}=1.8\times 10^{-5}~\text{Pa}~\text{s}$
.
$\unicode[STIX]{x1D707}=1.8\times 10^{-5}~\text{Pa}~\text{s}$
.
3.2 Numerical method
The general-purpose computer program STAR-CCM+ (http://www.cd-adapco.com/products/star-ccm-plus) was used for computations. It uses the finite-volume method to obtain the numerical solutions of governing equations. For this purpose, the solution domain is subdivided into a finite number of contiguous (non-overlapping) control volumes (CVs), which can be of arbitrary polyhedral shape. The governing equations are numerically integrated over each control volume, thus providing one algebraic equation per control volume. The generic form of integral conservation equations is
 $$\begin{eqnarray}\displaystyle & \displaystyle {\displaystyle \frac{\unicode[STIX]{x2202}}{\unicode[STIX]{x2202}t}}\int _{V}\unicode[STIX]{x1D70C}\unicode[STIX]{x1D719}\,\text{d}V+\int _{S}\unicode[STIX]{x1D70C}\unicode[STIX]{x1D719}\boldsymbol{V}\boldsymbol{\cdot }\boldsymbol{n}\,\text{d}S=\int _{S}\unicode[STIX]{x1D6E4}\unicode[STIX]{x1D735}\unicode[STIX]{x1D719}\boldsymbol{\cdot }\boldsymbol{n}\,\text{d}S+\int _{V}q_{\unicode[STIX]{x1D719}}\,\text{d}V, & \displaystyle\end{eqnarray}$$
where
 $\unicode[STIX]{x1D719}$
is the transported variable and the source term
$\unicode[STIX]{x1D719}$
is the transported variable and the source term
 $q_{\unicode[STIX]{x1D719}}$
contains all other terms from the Navier–Stokes equations, which are not included in the convective and diffusive fluxes of the generic equation.
$q_{\unicode[STIX]{x1D719}}$
contains all other terms from the Navier–Stokes equations, which are not included in the convective and diffusive fluxes of the generic equation.
The variable values at cell centres are the unknowns and the algebraic equation for one CV provides the link between a variable value at its centre and at the centres of the neighbouring cells. In the following, the discretization procedure is illustrated for a cell
 $P$
with a neighbouring cell
$P$
with a neighbouring cell
 $E$
, with values
$E$
, with values
 $\unicode[STIX]{x1D719}_{P}$
and
$\unicode[STIX]{x1D719}_{P}$
and
 $\unicode[STIX]{x1D719}_{E}$
at the cell centres. Their common surface
$\unicode[STIX]{x1D719}_{E}$
at the cell centres. Their common surface
 $S_{e}$
has the centre point
$S_{e}$
has the centre point
 $e$
.
$e$
.
The convective flux through the face
 $S_{e}$
is obtained with second-order accuracy by using the midpoint rule for integration and linear interpolation (or central differencing) for deducing the cell face value at
$S_{e}$
is obtained with second-order accuracy by using the midpoint rule for integration and linear interpolation (or central differencing) for deducing the cell face value at
 $e$
:
$e$
:
 $$\begin{eqnarray}\displaystyle & \displaystyle F_{e}^{c}=\int _{S_{e}}\unicode[STIX]{x1D70C}\unicode[STIX]{x1D719}\boldsymbol{V}\boldsymbol{\cdot }\boldsymbol{n}\,\text{d}S\simeq \unicode[STIX]{x1D719}_{e}(\unicode[STIX]{x1D70C}\boldsymbol{V}\boldsymbol{\cdot }\boldsymbol{n})_{e}S_{e}, & \displaystyle\end{eqnarray}$$
 $$\begin{eqnarray}\displaystyle & \displaystyle \unicode[STIX]{x1D719}_{e}\simeq \unicode[STIX]{x1D719}_{P}(1-\unicode[STIX]{x1D706}_{e})+\unicode[STIX]{x1D719}_{E}\unicode[STIX]{x1D706}_{e}, & \displaystyle\end{eqnarray}$$
where
 $\unicode[STIX]{x1D706}_{e}$
is the weighting function:
$\unicode[STIX]{x1D706}_{e}$
is the weighting function:
 $$\begin{eqnarray}\displaystyle & \displaystyle \unicode[STIX]{x1D706}_{e}={\displaystyle \frac{(\boldsymbol{r}_{e}-\boldsymbol{r}_{P})\boldsymbol{\cdot }(\boldsymbol{r}_{E}-\boldsymbol{r}_{P})}{|\boldsymbol{r}_{E}-\boldsymbol{r}_{P}|^{2}}}, & \displaystyle\end{eqnarray}$$
and
 $\boldsymbol{r}$
is the position vector for various locations in space.
$\boldsymbol{r}$
is the position vector for various locations in space.
The diffusive flux through the face
 $S_{e}$
can be obtained with second-order accuracy by using the midpoint rule for the integration:
$S_{e}$
can be obtained with second-order accuracy by using the midpoint rule for the integration:
 $$\begin{eqnarray}\displaystyle & \displaystyle F_{e}^{d}=\int _{S_{e}}\unicode[STIX]{x1D6E4}(\unicode[STIX]{x1D735})\boldsymbol{\cdot }\boldsymbol{n}\,\text{d}S\simeq (\unicode[STIX]{x1D6E4}(\unicode[STIX]{x1D735})\boldsymbol{\cdot }\boldsymbol{n})_{e}S_{e}. & \displaystyle\end{eqnarray}$$
To deduce
 $((\unicode[STIX]{x1D735})\boldsymbol{\cdot }\boldsymbol{n})=(\unicode[STIX]{x2202}\unicode[STIX]{x1D719}/\unicode[STIX]{x2202}n)$
, we first consider the second-order central difference approximation which holds for orthogonal grids:
$((\unicode[STIX]{x1D735})\boldsymbol{\cdot }\boldsymbol{n})=(\unicode[STIX]{x2202}\unicode[STIX]{x1D719}/\unicode[STIX]{x2202}n)$
, we first consider the second-order central difference approximation which holds for orthogonal grids:
 $$\begin{eqnarray}\displaystyle & \displaystyle \left({\displaystyle \frac{\unicode[STIX]{x2202}\unicode[STIX]{x1D719}}{\unicode[STIX]{x2202}n}}\right)_{e}\approx {\displaystyle \frac{\unicode[STIX]{x1D719}_{E}-\unicode[STIX]{x1D719}_{P}}{|\boldsymbol{r}_{E}-\boldsymbol{r}_{P}|}}. & \displaystyle\end{eqnarray}$$
To use the above formulation to calculate implicitly the cell face gradients for arbitrary polyhedral control volumes, one has to add a correction part to it, which must vanish when the grid is orthogonal (Muzaferija Reference Muzaferija1994):
 $$\begin{eqnarray}\displaystyle & \displaystyle \left({\displaystyle \frac{\unicode[STIX]{x2202}\unicode[STIX]{x1D719}}{\unicode[STIX]{x2202}n}}\right)\approx {\displaystyle \frac{\unicode[STIX]{x1D719}_{E}-\unicode[STIX]{x1D719}_{P}}{(\boldsymbol{r}_{E}-\boldsymbol{r}_{P})\boldsymbol{\cdot }\boldsymbol{n}}}-{\displaystyle \frac{\overline{(\unicode[STIX]{x1D735}\unicode[STIX]{x1D719})_{e}}^{\;\ast }\boldsymbol{\cdot }(\boldsymbol{r}_{E}-\boldsymbol{r}_{P})}{(\boldsymbol{r}_{E}-\boldsymbol{r}_{P})\boldsymbol{\cdot }\boldsymbol{n}}}+\overline{(\unicode[STIX]{x1D735}\unicode[STIX]{x1D719})_{e}}^{\;\ast \ast }\boldsymbol{\cdot }\boldsymbol{n}. & \displaystyle\end{eqnarray}$$
The interpolated gradients are obtained in the following way:
 $$\begin{eqnarray}\displaystyle & \displaystyle \overline{(\unicode[STIX]{x1D735}\unicode[STIX]{x1D719})_{e}}^{\;\ast }={\textstyle \frac{1}{2}}((\unicode[STIX]{x1D735}\unicode[STIX]{x1D719})_{E}+(\unicode[STIX]{x1D735}\unicode[STIX]{x1D719})_{P}), & \displaystyle\end{eqnarray}$$
 $$\begin{eqnarray}\displaystyle & \displaystyle \overline{(\unicode[STIX]{x1D735}\unicode[STIX]{x1D719})_{e}}^{\;\ast \ast }=\unicode[STIX]{x1D706}_{e}(\unicode[STIX]{x1D735}\unicode[STIX]{x1D719})_{E}+(1-\unicode[STIX]{x1D706}_{e})(\unicode[STIX]{x1D735}\unicode[STIX]{x1D719})_{P}. & \displaystyle\end{eqnarray}$$
The source term is calculated in the integral form using the midpoint rule to the second-order accuracy as follows:
 $$\begin{eqnarray}\displaystyle & \displaystyle \int _{V_{P}}q_{\unicode[STIX]{x1D719}}\,\text{d}V\simeq (q_{\unicode[STIX]{x1D719}}\unicode[STIX]{x0394}V)_{P}. & \displaystyle\end{eqnarray}$$
The time derivative of
 $\unicode[STIX]{x1D719}$
at the cell centre
$\unicode[STIX]{x1D719}$
at the cell centre
 $P$
is discretized with second-order accuracy using a quadratic backward scheme:
$P$
is discretized with second-order accuracy using a quadratic backward scheme:
 $$\begin{eqnarray}\displaystyle & \displaystyle \left({\displaystyle \frac{\unicode[STIX]{x2202}\unicode[STIX]{x1D719}}{\unicode[STIX]{x2202}t}}\right)_{P}\approx {\displaystyle \frac{3\unicode[STIX]{x1D719}_{P}^{n+1}-4\unicode[STIX]{x1D719}_{P}^{n}+\unicode[STIX]{x1D719}_{P}^{n-1}}{2\unicode[STIX]{x0394}t}}. & \displaystyle\end{eqnarray}$$
The superscript
 $n$
denotes the previous time step,
$n$
denotes the previous time step,
 $(n+1)$
is the new time level at which solution is sought and
$(n+1)$
is the new time level at which solution is sought and
 $(n-1)$
corresponds to solution at two time steps backwards. Second-order accuracy is the minimum requirement for direct numerical simulation.
$(n-1)$
corresponds to solution at two time steps backwards. Second-order accuracy is the minimum requirement for direct numerical simulation.
When the approximations of all the terms are inserted in the governing equations, we obtain for each unknown quantity one algebraic equation for every control volume in the domain. This can be expressed as a system of equations:
 $$\begin{eqnarray}\displaystyle & \displaystyle A\unicode[STIX]{x1D753}=\boldsymbol{b}, & \displaystyle\end{eqnarray}$$
where
 $A$
is an
$A$
is an
 $n\times n$
matrix with
$n\times n$
matrix with
 $n$
being the number of control volumes,
$n$
being the number of control volumes,
 $\unicode[STIX]{x1D753}$
is the unknown vector of the flow variable and
$\unicode[STIX]{x1D753}$
is the unknown vector of the flow variable and
 $\boldsymbol{b}$
is the vector which comprises the remainder of the governing equation that is not included in
$\boldsymbol{b}$
is the vector which comprises the remainder of the governing equation that is not included in
 $A\unicode[STIX]{x1D753}$
and is computed explicitly using available data.
$A\unicode[STIX]{x1D753}$
and is computed explicitly using available data.
The momentum conservation equations are solved for the velocity components, where the pressure and mass fluxes are treated as known. The SIMPLE method for collocated grids is used to obtain the pressure, which together with the velocity field satisfies the Navier–Stokes equations. It consists of first updating the velocities by solving the linearized momentum equations, then solving the pressure-correction equation to enforce mass conservation. The computed pressure correction is used to correct pressure, velocities and mass fluxes. This is done iteratively 3–5 times to update the nonlinearity effects, which make under-relaxation of the variables necessary. Calculations for the next time step are performed in the same manner (see Ferzinger & Perić Reference Ferzinger and Perić2002). The systems of linear equations are solved using an algebraic multigrid method based on V-cycles. A Gauss–Seidel solver is used as a smoother. No adjustments were needed to default parameters in the program.
3.2.1 Computational flow domain
To study drag reduction effects of different surface structures over a wide range of pattern dimensions, numerous simulations have to be performed. Even at low Reynolds numbers, to simulate flow in a channel extending in the streamwise and spanwise directions following drop-off, the two-point correlations for large separations would require enormous computational power. Following common practice, introduced by Choi et al. (Reference Choi, Moin and Kim1993) to minimize the computational effort, we adopted a minimum channel configuration in which the effects of turbulence can be fairly simulated. For such a domain with periodic boundary conditions, the boundaries are far enough from each other not to affect essential details of the turbulence development characterized in terms of the second-order statistics. The solution domain is sketched in figure 4.

Figure 4. Computational domain for numerical simulation of turbulence in a flat channel showing domain extensions in the streamwise (
 $L_{x_{1}}$
), normal (
$L_{x_{1}}$
), normal (
 $L_{x_{2}}$
) and spanwise (
$L_{x_{2}}$
) and spanwise (
 $L_{x_{3}}$
) directions with numerical grid extruded in the flow direction.
$L_{x_{3}}$
) directions with numerical grid extruded in the flow direction.
For the simulations reported in §§ 4.2 and 5, the top wall was flat and the bottom wall structured. Between the front inlet face and the back outlet face and also between the side faces of the computational domain, periodic boundary conditions were imposed with a fixed mass flow rate at the inlet and outlet faces. The size of the computational domain was chosen to match the experimental arrangement used by Jovanović et al. (Reference Jovanović, Frohnapfel, Srikantharajah, Jovanović, Lienhart and Delgado2011) for studies of viscous drag reduction effects. The length of the computational box in the flow direction
 $x_{1}$
was
$x_{1}$
was
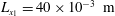 $L_{x_{1}}=40\times 10^{-3}~\text{m}$
and in the spanwise direction
$L_{x_{1}}=40\times 10^{-3}~\text{m}$
and in the spanwise direction
 $x_{3}$
it was
$x_{3}$
it was
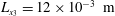 $L_{x_{3}}=12\times 10^{-3}~\text{m}$
, and the extent in the normal
$L_{x_{3}}=12\times 10^{-3}~\text{m}$
, and the extent in the normal
 $x_{2}$
direction corresponding to channel height
$x_{2}$
direction corresponding to channel height
 $H$
was
$H$
was
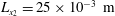 $L_{x_{2}}=25\times 10^{-3}~\text{m}$
.
$L_{x_{2}}=25\times 10^{-3}~\text{m}$
.
The grooves were embedded in the wall and placed parallel to the mean flow periodically along the spanwise direction. With a period of
 $d=1.\times 10^{-3}$
m and width
$d=1.\times 10^{-3}$
m and width
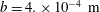 $b=4.\times 10^{-4}~\text{m}$
(sketched in figure 13), 11 grooves were arranged on the structured wall. During the first iterative modification of the surface pattern, the groove shape consisted of circular arcs intercepting at a right angle at the groove bottom (Daschiel et al.
Reference Daschiel, Frohnapfel and Jovanović2013) and was systematically improved to enhance performance by increasing the groove depth until the first evidence for suppression of transition onset was achieved over an extended period of time (say
$b=4.\times 10^{-4}~\text{m}$
(sketched in figure 13), 11 grooves were arranged on the structured wall. During the first iterative modification of the surface pattern, the groove shape consisted of circular arcs intercepting at a right angle at the groove bottom (Daschiel et al.
Reference Daschiel, Frohnapfel and Jovanović2013) and was systematically improved to enhance performance by increasing the groove depth until the first evidence for suppression of transition onset was achieved over an extended period of time (say
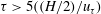 $\unicode[STIX]{x1D70F}>5((H/2)/u_{\unicode[STIX]{x1D70F}})$
).
$\unicode[STIX]{x1D70F}>5((H/2)/u_{\unicode[STIX]{x1D70F}})$
).
3.2.2 Initial flow field
To promote the rapid development of turbulence, simulations were initialized in a similar manner to that done experimentally by tripping the flow using sharp plates or wires. By blocking the flow near the wall, these devices produce inflectional velocity profiles that lead to instantaneous production of turbulence. A blockage ratio greater than 10 %, defined as the ratio of the blocked area to the channel cross-sectional area, ensures a fully developed turbulent state in a channel flow even at low Reynolds numbers (Durst et al. Reference Durst, Fischer, Jovanović and Kikura1998).
Figure 5. Initial velocity profile corresponding to 25 % blockage ratio without disturbances (a) and the same profile with superimposed randomly generated disturbances whose amplitude (root-mean-square) level was 20 % of the bulk velocity (b).
Following on from the above experience, we initialized simulations by blocking the flow over 25 % of the channel cross-sectional area near the wall and by specifying a uniform velocity distribution across the rest of the cross-section with uncorrelated disturbances having a 20 % root-mean-square (r.m.s.) magnitude of the bulk velocity
 $U_{B}$
(as presented in figure 5). For
$U_{B}$
(as presented in figure 5). For
 $R_{m}=5\times 10^{3}$
the bulk velocity is
$R_{m}=5\times 10^{3}$
the bulk velocity is
 $U_{B}=3~\text{m}~\text{s}^{-1}$
. This procedure was applied at the beginning of simulation across the entire solution domain. Unlike initialization based on perturbation of the parabolic velocity profile or the universal law of the wall with wavy or random disturbances, the procedure outlined above led to fully developed turbulence (in canonical flows used for validation) within
$U_{B}=3~\text{m}~\text{s}^{-1}$
. This procedure was applied at the beginning of simulation across the entire solution domain. Unlike initialization based on perturbation of the parabolic velocity profile or the universal law of the wall with wavy or random disturbances, the procedure outlined above led to fully developed turbulence (in canonical flows used for validation) within
 $t<5\unicode[STIX]{x1D70F}$
and convergent turbulence statistics averaged over next
$t<5\unicode[STIX]{x1D70F}$
and convergent turbulence statistics averaged over next
 $t\approx (5{-}10)\unicode[STIX]{x1D70F}$
, which greatly facilitated the analysis (Gavrilakis Reference Gavrilakis1992; Daschiel et al.
Reference Daschiel, Krieger, Jovanović and Delgado2014).
$t\approx (5{-}10)\unicode[STIX]{x1D70F}$
, which greatly facilitated the analysis (Gavrilakis Reference Gavrilakis1992; Daschiel et al.
Reference Daschiel, Krieger, Jovanović and Delgado2014).
3.2.3 Space and time discretization of governing equations
Recent work reported by the authors (Daschiel et al.
Reference Daschiel, Krieger, Jovanović and Delgado2014) and previous studies of turbulence in wall-bounded flows (Grötzbach Reference Grötzbach1983; Wagner, Hütel & Friedrich Reference Wagner, Hütel and Friedrich2001) demonstrate that good agreement with the experimental data can be achieved rationally by numerical integration of the governing equations of fluid flow employing the finite-volume technique of second-order accuracy with implicit treatment in time and space. This require resolutions of
 $\unicode[STIX]{x0394}x_{1}\simeq (5{-}6)\unicode[STIX]{x1D702}_{K}$
in the flow direction and
$\unicode[STIX]{x0394}x_{1}\simeq (5{-}6)\unicode[STIX]{x1D702}_{K}$
in the flow direction and
 $\unicode[STIX]{x0394}x_{2}=\unicode[STIX]{x0394}x_{3}\simeq (2{-}3)\unicode[STIX]{x1D702}_{K}$
in the normal and spanwise directions by demanding at least three or four points within the region of the viscous sublayer and a time step satisfying the condition for a Courant number
$\unicode[STIX]{x0394}x_{2}=\unicode[STIX]{x0394}x_{3}\simeq (2{-}3)\unicode[STIX]{x1D702}_{K}$
in the normal and spanwise directions by demanding at least three or four points within the region of the viscous sublayer and a time step satisfying the condition for a Courant number
 $(C)$
of 0.2:
$(C)$
of 0.2:
 $$\begin{eqnarray}\displaystyle & \displaystyle \unicode[STIX]{x0394}t\;\text{max}\left|{\displaystyle \frac{|u_{1}|}{\unicode[STIX]{x0394}x_{1}}}+{\displaystyle \frac{|u_{2}|}{\unicode[STIX]{x0394}x_{2}}}+{\displaystyle \frac{|u_{3}|}{\unicode[STIX]{x0394}x_{3}}}\right|\leqslant 0.2, & \displaystyle\end{eqnarray}$$
where
 $\unicode[STIX]{x1D702}_{K}=(\unicode[STIX]{x1D708}^{3}/\unicode[STIX]{x1D716})^{1/4}$
denotes the Kolmogorov scale. To determine
$\unicode[STIX]{x1D702}_{K}=(\unicode[STIX]{x1D708}^{3}/\unicode[STIX]{x1D716})^{1/4}$
denotes the Kolmogorov scale. To determine
 $\unicode[STIX]{x1D702}_{k}$
we may use Dean’s correlation for the skin-friction coefficient
$\unicode[STIX]{x1D702}_{k}$
we may use Dean’s correlation for the skin-friction coefficient
 $c_{f}=0.073Re_{m}^{-0.25}$
with
$c_{f}=0.073Re_{m}^{-0.25}$
with
 $Re_{m}=U_{B}H/\unicode[STIX]{x1D708}$
, and interpreting
$Re_{m}=U_{B}H/\unicode[STIX]{x1D708}$
, and interpreting
 $\unicode[STIX]{x1D716}$
(at large
$\unicode[STIX]{x1D716}$
(at large
 $Re_{m}$
) by (1.1), the grid resolution of
$Re_{m}$
) by (1.1), the grid resolution of
 $\unicode[STIX]{x0394}x_{1}^{+}=\unicode[STIX]{x0394}x_{1}u_{\unicode[STIX]{x1D70F}}/\unicode[STIX]{x1D708}=9.5$
,
$\unicode[STIX]{x0394}x_{1}^{+}=\unicode[STIX]{x0394}x_{1}u_{\unicode[STIX]{x1D70F}}/\unicode[STIX]{x1D708}=9.5$
,
 $\unicode[STIX]{x0394}x_{2}^{+}=\unicode[STIX]{x0394}x_{3}^{+}=5$
was chosen for the flow core region and
$\unicode[STIX]{x0394}x_{2}^{+}=\unicode[STIX]{x0394}x_{3}^{+}=5$
was chosen for the flow core region and
 $\unicode[STIX]{x0394}x_{2}^{+}=\unicode[STIX]{x0394}x_{3}^{+}=5/3$
for the region of the viscous sublayer.
$\unicode[STIX]{x0394}x_{2}^{+}=\unicode[STIX]{x0394}x_{3}^{+}=5/3$
for the region of the viscous sublayer.
Figure 6. Generated grid for simulation of turbulence developing in a flat channel (a) and local grid refinement near the surface (b).
For the computations reported in this study, polyhedral cells were used in an unstructured grid. The mesh was locally refined near walls, resulting in four areas with different mean cell diameters, as shown in figure 6. The coarsest cells were in the channel centre, with a mean cell diameter in the
 $x_{2}{-}x_{3}$
plane of approximately
$x_{2}{-}x_{3}$
plane of approximately
 $d^{+}\simeq 5$
. In the region closer to the wall, the mean cell diameter in the
$d^{+}\simeq 5$
. In the region closer to the wall, the mean cell diameter in the
 $x_{2}{-}x_{3}$
plane was consecutively halved until reaching approximately
$x_{2}{-}x_{3}$
plane was consecutively halved until reaching approximately
 $d^{+}\simeq 0.72$
, which is one eighth of the resolution in the core flow region. The mesh was first created in the
$d^{+}\simeq 0.72$
, which is one eighth of the resolution in the core flow region. The mesh was first created in the
 $x_{2}{-}x_{3}$
plane and then extruded in the flow direction
$x_{2}{-}x_{3}$
plane and then extruded in the flow direction
 $x_{1}$
with a uniform spacing of
$x_{1}$
with a uniform spacing of
 $\unicode[STIX]{x0394}x_{1}^{+}\simeq 9.5$
.
$\unicode[STIX]{x0394}x_{1}^{+}\simeq 9.5$
.
To improve further the resolution of the viscous region very close to the wall, four layers of prismatic cells were set-up close to top and bottom walls. The prism layer thickness was arranged in such a way as to yield the first cell
 $x_{2}^{+}\simeq 0.16$
from the wall (see figure 15).
$x_{2}^{+}\simeq 0.16$
from the wall (see figure 15).
3.2.4 Boundary conditions
The wall boundaries were treated with no-slip conditions. Attention was paid to maintaining symmetrical grid planes for the inlet and outlet, and also for the sides of the computational domain, which were required for application of the periodic conditions along these boundaries.
For side faces of the computational domain, periodicity was applied to all variables. Along the inlet and outlet faces, only the velocities were treated periodically while the pressure was lower at the outlet than at the inlet. A pressure drop was imposed such that the prescribed flow rate was maintained. The mass fluxes through the inlet and outlet boundary were integrated in each iteration within each time step, and the imposed pressure drop was adjusted in order to achieve the specified flow rate for a selected Reynolds number. At the end of iterations for each time step, the flow rates at the inlet and outlet boundaries deviated from the prescribed value by less than
 $0.1\,\%$
. The grids were conformal for all periodic boundaries. For more details on the boundary conditions the reader is referred to Ferzinger & Perić (Reference Ferzinger and Perić2002).
$0.1\,\%$
. The grids were conformal for all periodic boundaries. For more details on the boundary conditions the reader is referred to Ferzinger & Perić (Reference Ferzinger and Perić2002).
3.2.5 Efficiency of computations
Calculations were processed on the LIMA cluster of the Erlangen Regional Computer Centre consisting of 500 nodes and 24 processors per node. The overall performance rate of the cluster is
 $56.7~\text{Tflop}~\text{s}^{-1}$
based on the LINPACK benchmark test.
$56.7~\text{Tflop}~\text{s}^{-1}$
based on the LINPACK benchmark test.
For a typical run, utilizing one node, the numerical algorithm required 5.6 s of CPU time per time step. With an efficiency rating of the program of
 $8.1~\text{Gflop}~\text{s}^{-1}$
, the number of operations per grid point was more than two orders of magnitude greater than the optimum effort of
$8.1~\text{Gflop}~\text{s}^{-1}$
, the number of operations per grid point was more than two orders of magnitude greater than the optimum effort of
 $60\times \text{ln}(N_{1}\times N_{2}\times N_{3})^{1/3}+200$
required for the fourth-order finite difference scheme on the Cartesian grid (Saffman Reference Saffman and Fiedler1978; P. Lammers 2008, personal communication), where
$60\times \text{ln}(N_{1}\times N_{2}\times N_{3})^{1/3}+200$
required for the fourth-order finite difference scheme on the Cartesian grid (Saffman Reference Saffman and Fiedler1978; P. Lammers 2008, personal communication), where
 $N_{1}$
,
$N_{1}$
,
 $N_{2}$
and
$N_{2}$
and
 $N_{3}$
are number of cells in each flow direction. Such efficiency was almost achieved by Le, Moin & Kim (Reference Le, Moin and Kim1997) when studying turbulent flow over a backward-facing step flow. For the general-purpose numerical program, offering great flexibility for the treatment of flows developing in complex domains using unstructured grids, significant loss of computational performance is not surprising.
$N_{3}$
are number of cells in each flow direction. Such efficiency was almost achieved by Le, Moin & Kim (Reference Le, Moin and Kim1997) when studying turbulent flow over a backward-facing step flow. For the general-purpose numerical program, offering great flexibility for the treatment of flows developing in complex domains using unstructured grids, significant loss of computational performance is not surprising.
4 Validation of the computational algorithm
To demonstrate the capabilities of the numerical technique employed, validation runs were performed by computation of fully developed flow in two-dimensional channels at
 $Re_{m}=5\times 10^{3}$
. Results corresponding to turbulence in a channel with smooth walls will be considered first, followed by a discussion of simulation results obtained for a riblet-modified channel showing evidence of viscous drag reduction. These flows have been simulated by a number of authors (Kim, Moin & Moser Reference Kim, Moin and Moser1987; Kuroda Reference Kuroda1990; Antonia et al.
Reference Antonia, Teitel, Kim and Browne1992; Choi et al.
Reference Choi, Moin and Kim1993) using high-resolution pseudospectral techniques, so the results from these simulations can serve for comparisons with current implementation.
$Re_{m}=5\times 10^{3}$
. Results corresponding to turbulence in a channel with smooth walls will be considered first, followed by a discussion of simulation results obtained for a riblet-modified channel showing evidence of viscous drag reduction. These flows have been simulated by a number of authors (Kim, Moin & Moser Reference Kim, Moin and Moser1987; Kuroda Reference Kuroda1990; Antonia et al.
Reference Antonia, Teitel, Kim and Browne1992; Choi et al.
Reference Choi, Moin and Kim1993) using high-resolution pseudospectral techniques, so the results from these simulations can serve for comparisons with current implementation.
4.1 Flat channel
The skin-friction coefficient,
 $c_{f}=\unicode[STIX]{x1D70F}_{w}/(1/2\unicode[STIX]{x1D70C}U_{B}^{2})$
, as a function of time
$c_{f}=\unicode[STIX]{x1D70F}_{w}/(1/2\unicode[STIX]{x1D70C}U_{B}^{2})$
, as a function of time
 $\unicode[STIX]{x1D70F}$
plotted in figure 7(a) indicates that the average value of
$\unicode[STIX]{x1D70F}$
plotted in figure 7(a) indicates that the average value of
 $8.17\times 10^{-3}$
is in good agreement with Dean’s correlation (Dean Reference Dean1978)
$8.17\times 10^{-3}$
is in good agreement with Dean’s correlation (Dean Reference Dean1978)
 $c_{f}=0.073Re_{m}^{-0.25}=8.68\times 10^{-3}$
. Similar results for
$c_{f}=0.073Re_{m}^{-0.25}=8.68\times 10^{-3}$
. Similar results for
 $c_{f}$
were obtained by Kim et al. (Reference Kim, Moin and Moser1987) at a slightly higher Reynolds number. From the above value of
$c_{f}$
were obtained by Kim et al. (Reference Kim, Moin and Moser1987) at a slightly higher Reynolds number. From the above value of
 $c_{f}$
, we deduce the friction Reynolds number
$c_{f}$
, we deduce the friction Reynolds number
 $Re_{\unicode[STIX]{x1D70F}}=u_{\unicode[STIX]{x1D70F}}H/2/\unicode[STIX]{x1D708}\simeq 160$
and extension of the computation domain in the streamwise and spanwise directions
$Re_{\unicode[STIX]{x1D70F}}=u_{\unicode[STIX]{x1D70F}}H/2/\unicode[STIX]{x1D708}\simeq 160$
and extension of the computation domain in the streamwise and spanwise directions
 $L_{x_{1}}\simeq 511$
and
$L_{x_{1}}\simeq 511$
and
 $L_{x_{3}}\simeq 153$
, respectively.
$L_{x_{3}}\simeq 153$
, respectively.
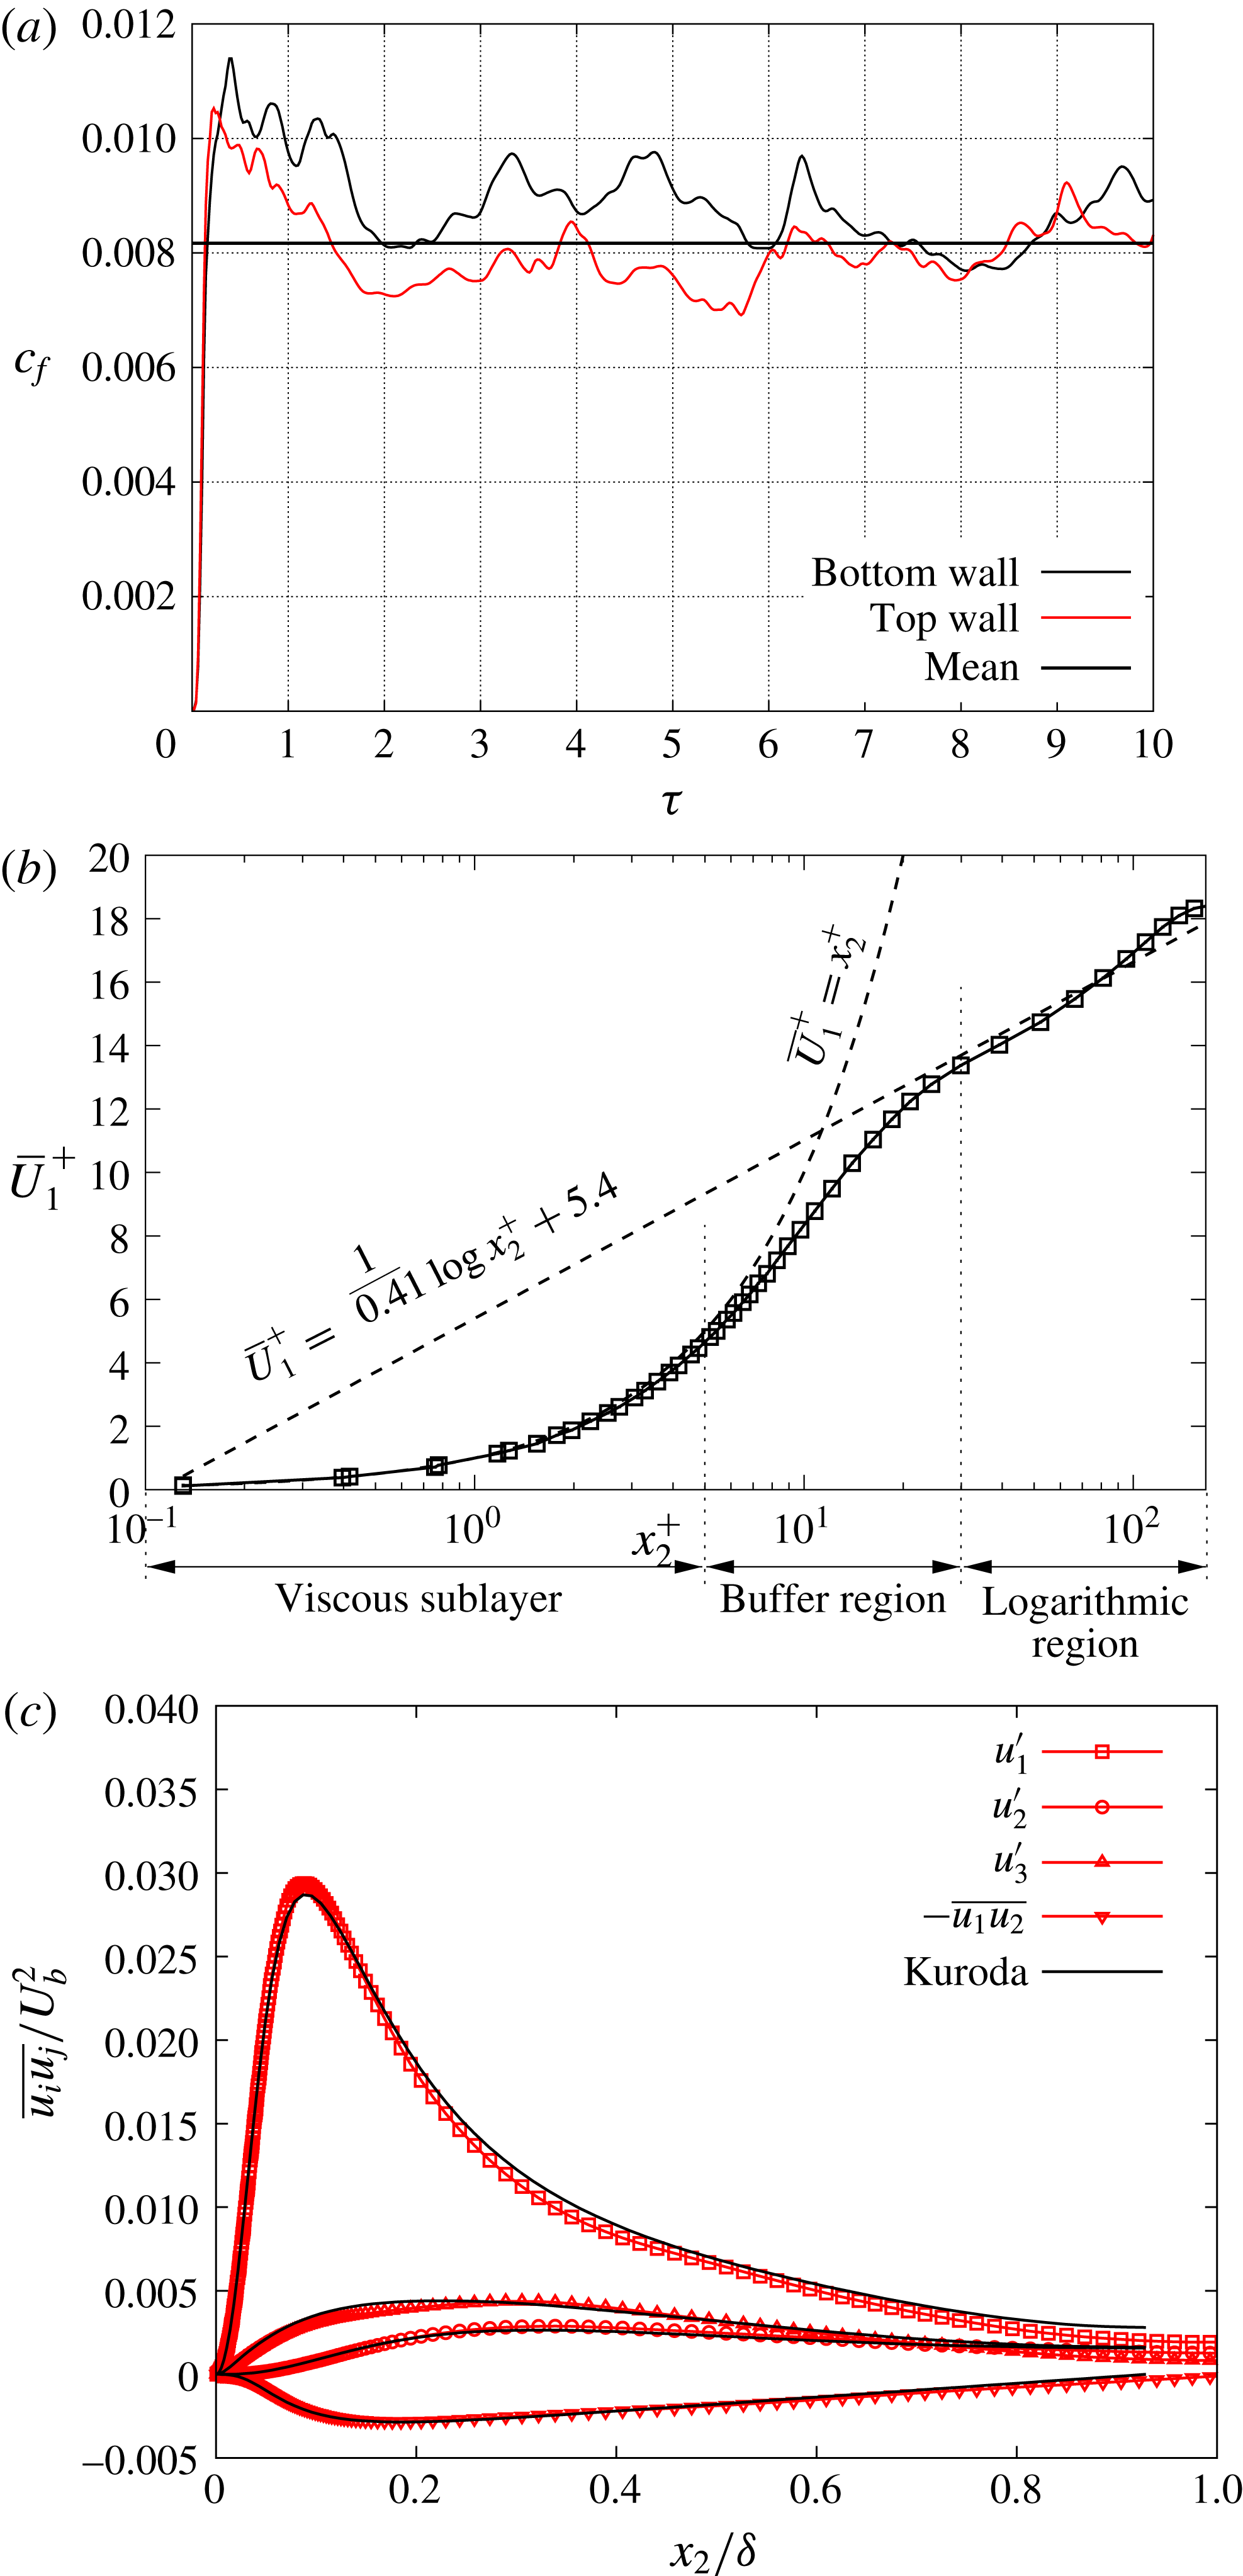
Figure 7. History of the skin-friction coefficient (a) with distributions of the mean flow (b) and the turbulent stresses
 $\overline{u_{i}u_{j}}$
(c) across the channel with flat walls.
$\overline{u_{i}u_{j}}$
(c) across the channel with flat walls.
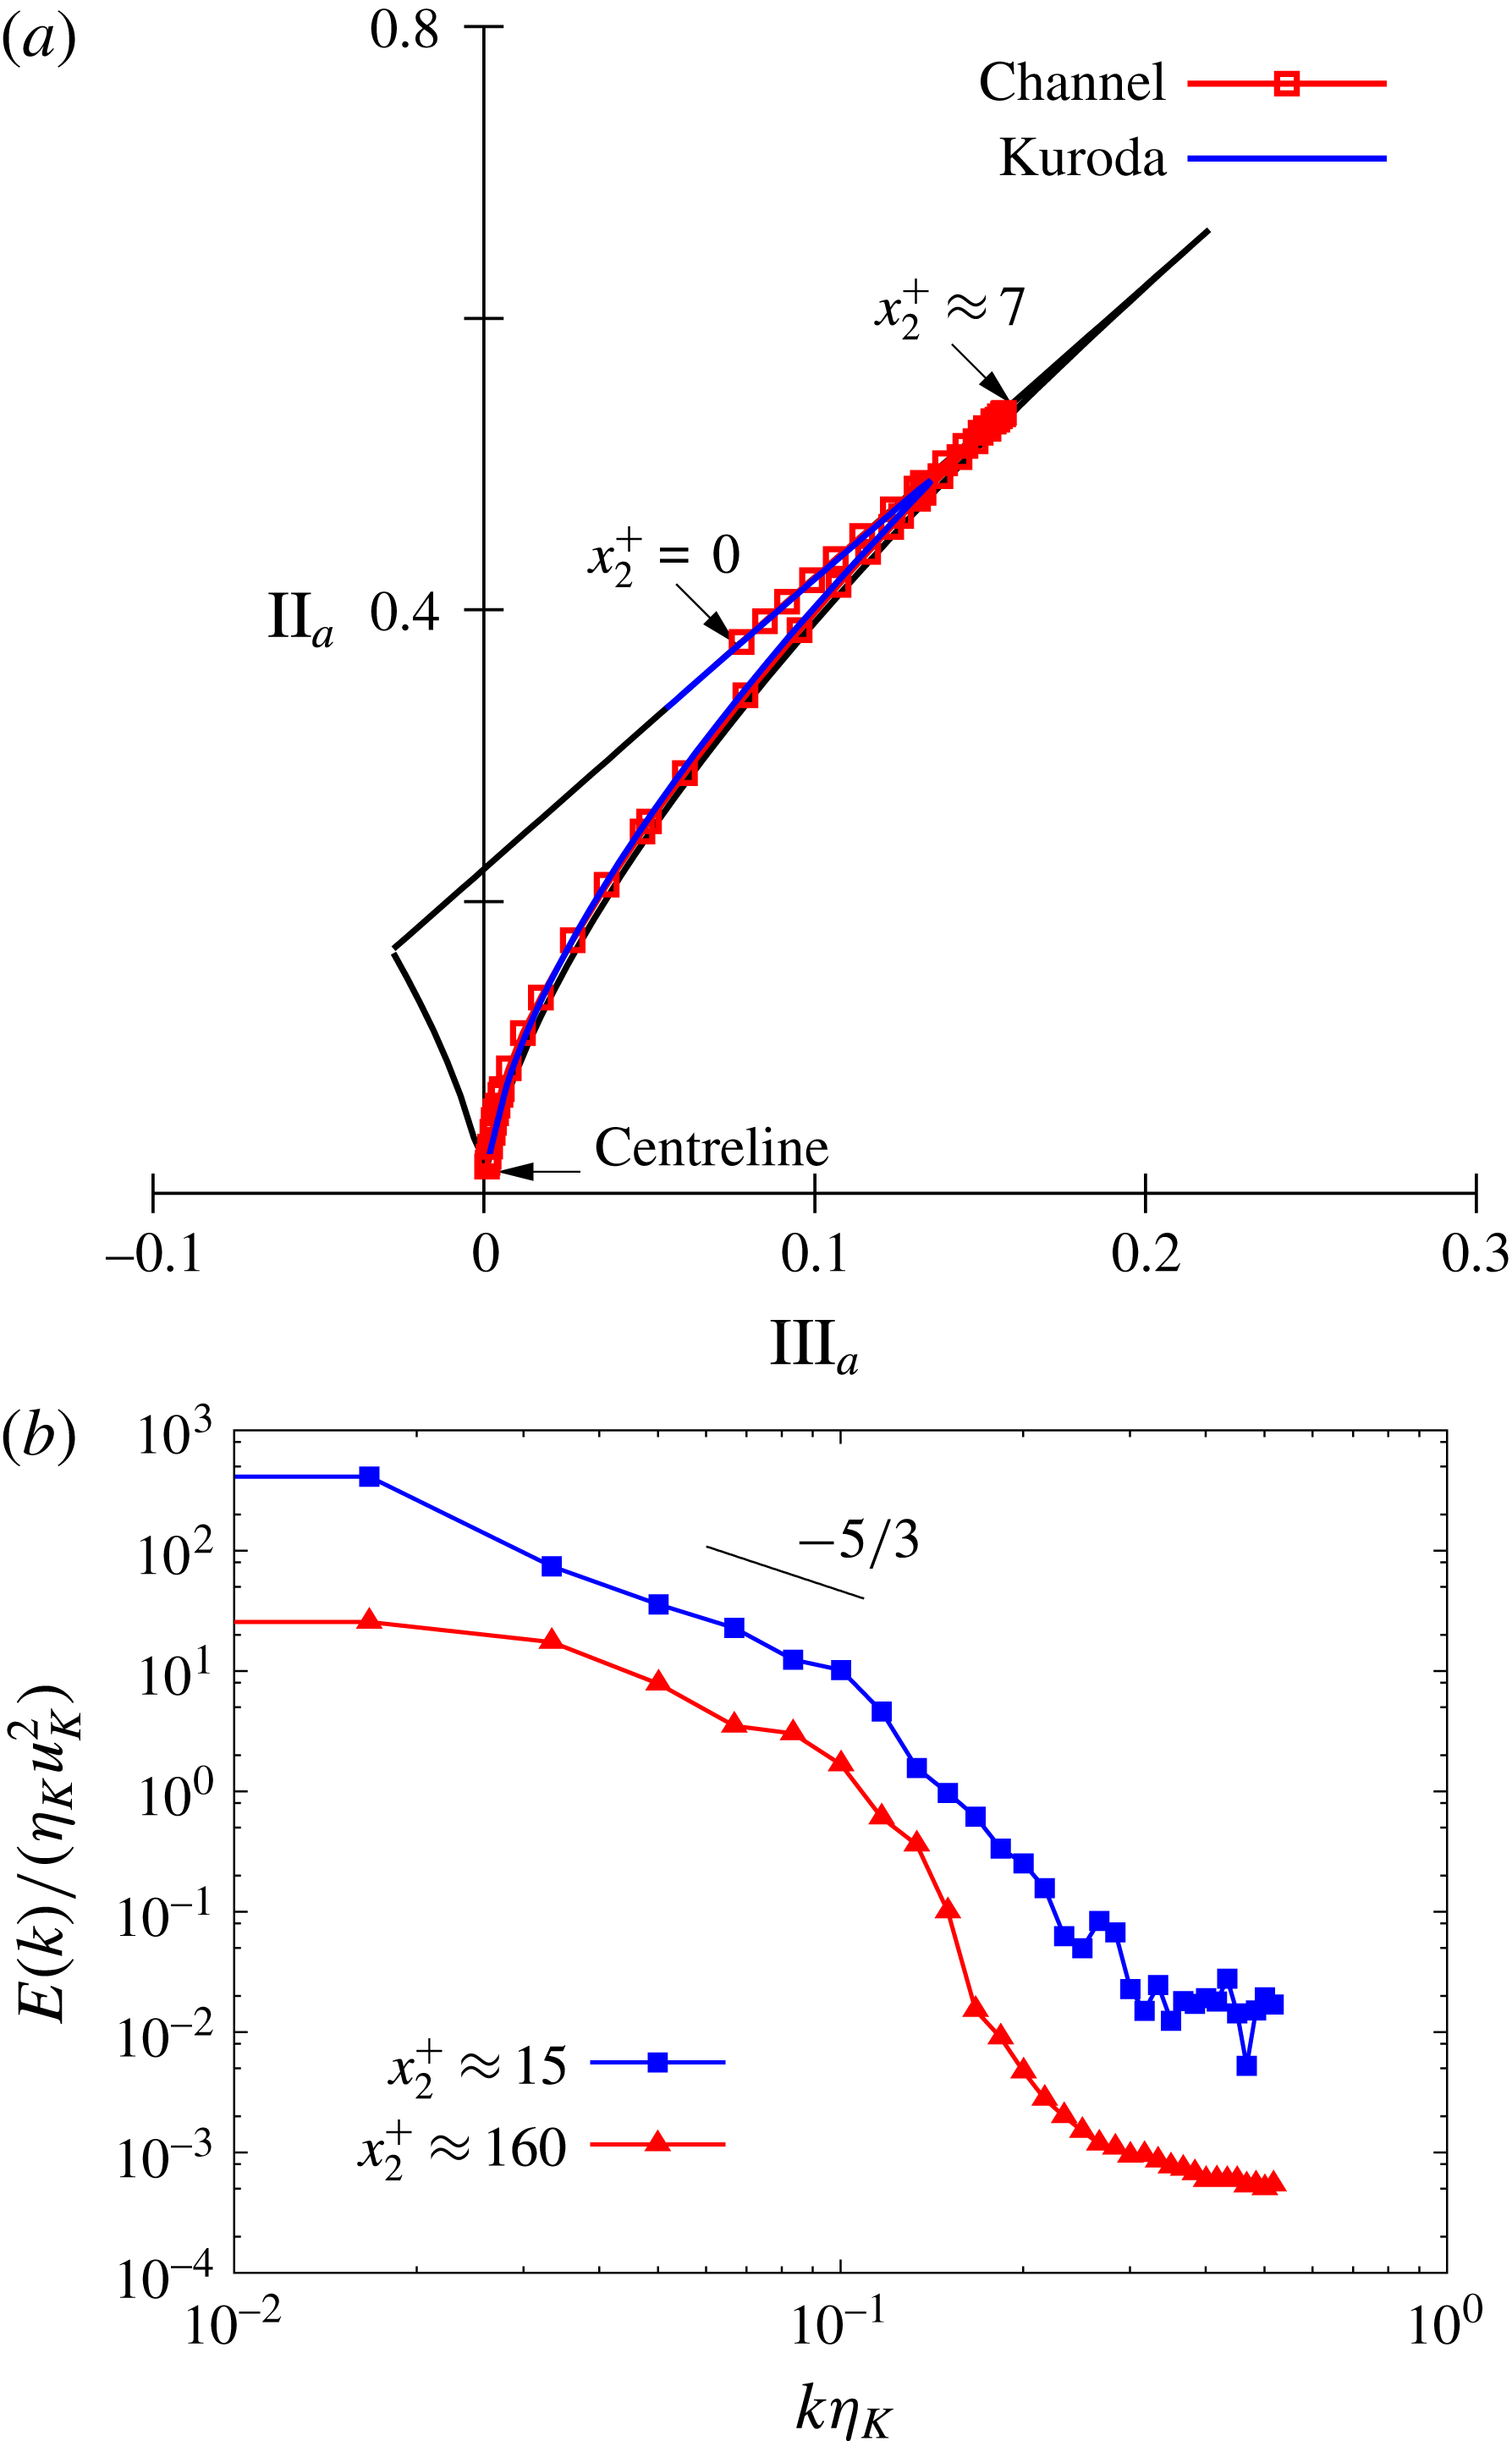
Figure 8. Anisotropy-invariant mapping of turbulence (a) and the energy spectra (b) in a flat channel.
Figure 7(b) shows the distribution of the mean velocity profile normalized on inner wall variables:
 $$\begin{eqnarray}\displaystyle & \displaystyle x_{2}^{+}={\displaystyle \frac{x_{2}u_{\unicode[STIX]{x1D70F}}}{\unicode[STIX]{x1D708}}}\quad \text{and}\quad \overline{U}_{1}^{+}={\displaystyle \frac{\overline{U}_{1}}{u_{\unicode[STIX]{x1D70F}}}}, & \displaystyle\end{eqnarray}$$
where
 $u_{\unicode[STIX]{x1D70F}}$
and
$u_{\unicode[STIX]{x1D70F}}$
and
 $\unicode[STIX]{x1D708}$
are the wall shear velocity and kinematic viscosity of the flow medium, respectively. The log–linear representation of the mean flow displays a clear tendency towards the universal law of the wall (Hinze Reference Hinze1975). Figure 7(b) reveals that very good resolution was attained in the viscous sublayer, with almost 20 points located in the region
$\unicode[STIX]{x1D708}$
are the wall shear velocity and kinematic viscosity of the flow medium, respectively. The log–linear representation of the mean flow displays a clear tendency towards the universal law of the wall (Hinze Reference Hinze1975). Figure 7(b) reveals that very good resolution was attained in the viscous sublayer, with almost 20 points located in the region
 $x_{2}^{+}\leqslant 5$
.
$x_{2}^{+}\leqslant 5$
.
To validate the computational program to resolve turbulence quantities, figure 7(c) shows comparisons of the turbulent stresses
 $\overline{u_{i}u_{j}}$
with corresponding results reported by Kuroda (Reference Kuroda1990), who carried out direct numerical simulation at
$\overline{u_{i}u_{j}}$
with corresponding results reported by Kuroda (Reference Kuroda1990), who carried out direct numerical simulation at
 $Re_{\unicode[STIX]{x1D70F}}=150$
using a pseudospectral method with Fourier series expansions applied along the homogeneous directions (
$Re_{\unicode[STIX]{x1D70F}}=150$
using a pseudospectral method with Fourier series expansions applied along the homogeneous directions (
 $x_{1}$
and
$x_{1}$
and
 $x_{3}$
) and Chebyshev polynomials in the wall-normal direction (
$x_{3}$
) and Chebyshev polynomials in the wall-normal direction (
 $x_{2}$
). The computational domain was much larger than the domain used in the present study and corresponded to
$x_{2}$
). The computational domain was much larger than the domain used in the present study and corresponded to
 $L_{x_{1}}\times L_{x_{2}}\times L_{x_{3}}=5\unicode[STIX]{x03C0}(H/2)\times 2\times (H/2)\times 2\unicode[STIX]{x03C0}(H/2)$
in the streamwise, normal and spanwise directions, respectively. Uniform grid spacings of
$L_{x_{1}}\times L_{x_{2}}\times L_{x_{3}}=5\unicode[STIX]{x03C0}(H/2)\times 2\times (H/2)\times 2\unicode[STIX]{x03C0}(H/2)$
in the streamwise, normal and spanwise directions, respectively. Uniform grid spacings of
 $\unicode[STIX]{x0394}x_{1}=18.4$
and
$\unicode[STIX]{x0394}x_{1}=18.4$
and
 $\unicode[STIX]{x0394}x_{3}=7.36$
viscous units were employed along the streamwise and spanwise directions and non-uniform spacing was applied in the wall-normal direction. The mesh spacing was
$\unicode[STIX]{x0394}x_{3}=7.36$
viscous units were employed along the streamwise and spanwise directions and non-uniform spacing was applied in the wall-normal direction. The mesh spacing was
 $\unicode[STIX]{x0394}x_{2}=0.08$
near the wall and approached smoothly
$\unicode[STIX]{x0394}x_{2}=0.08$
near the wall and approached smoothly
 $\unicode[STIX]{x0394}x_{2}=4.9$
at the centreline of the channel. Data from this simulation presented in figure 7(c) are normalized with outer variables
$\unicode[STIX]{x0394}x_{2}=4.9$
at the centreline of the channel. Data from this simulation presented in figure 7(c) are normalized with outer variables
 $\unicode[STIX]{x1D6FF}=H/2$
and
$\unicode[STIX]{x1D6FF}=H/2$
and
 $U_{B}$
in order to account for small differences in
$U_{B}$
in order to account for small differences in
 $Re_{m}$
between the present and reference data sets. The very good agreement between these data justifies confidence in the numerical algorithm employed and our implementation.
$Re_{m}$
between the present and reference data sets. The very good agreement between these data justifies confidence in the numerical algorithm employed and our implementation.
The anisotropy-invariant mapping presented in figure 8(a) exhibits a trajectory common for turbulence developing in wall-bounded flows at low Reynolds numbers. Pronounced anisotropy in the viscous sublayer and a marginal departure from axisymmetry away from the wall are noticeable in these data. Such trends can be predicted from the asymptotic behaviour of the velocity fluctuations close to the wall and from the equations for mean flow under the assumption of the axisymmetric form for the turbulent stress tensor
 $\overline{u_{i}u_{j}}\stackrel{(Re)\rightarrow (Re)_{crit.}}{\longrightarrow }A\unicode[STIX]{x1D6FF}_{ij}+B\unicode[STIX]{x1D706}_{i}\unicode[STIX]{x1D706}_{j}$
.
$\overline{u_{i}u_{j}}\stackrel{(Re)\rightarrow (Re)_{crit.}}{\longrightarrow }A\unicode[STIX]{x1D6FF}_{ij}+B\unicode[STIX]{x1D706}_{i}\unicode[STIX]{x1D706}_{j}$
.
The energy spectra normalized with Kolmogorov’s scales
 $\unicode[STIX]{x1D702}_{K}=(\unicode[STIX]{x1D708}^{3}/\unicode[STIX]{x1D716})^{1/4}$
and
$\unicode[STIX]{x1D702}_{K}=(\unicode[STIX]{x1D708}^{3}/\unicode[STIX]{x1D716})^{1/4}$
and
 $u_{K}=\unicode[STIX]{x1D708}/\unicode[STIX]{x1D702}_{K}$
, presented in figure 8(b), indicate that the resolution of the simulation is satisfactory since the energy content of small scales is several orders of magnitude smaller in comparison with the energy associated with large scales. The behaviour of the spectrum at high wavenumbers shows a continuous drop with no signs of an increase, which confirms that the numerical grid covers the essential scales that influence the development of turbulence.
$u_{K}=\unicode[STIX]{x1D708}/\unicode[STIX]{x1D702}_{K}$
, presented in figure 8(b), indicate that the resolution of the simulation is satisfactory since the energy content of small scales is several orders of magnitude smaller in comparison with the energy associated with large scales. The behaviour of the spectrum at high wavenumbers shows a continuous drop with no signs of an increase, which confirms that the numerical grid covers the essential scales that influence the development of turbulence.
4.2 Channel flow with riblets
Further validation of the numerical program was obtained by simulating turbulent drag reduction by V-grooved riblet surface structures (for details see Perić Reference Perić2011). Walsh (Reference Walsh and Haugh1980, Reference Walsh1983) and co-workers at NASA-Langley found for such surfaces a net drag reduction in the range of about 5 % if the height and spacing between grooves were less than
 $25\unicode[STIX]{x1D708}/u_{\unicode[STIX]{x1D70F}}$
.
$25\unicode[STIX]{x1D708}/u_{\unicode[STIX]{x1D70F}}$
.
Figure 9 shows even-sided triangular riblets arranged periodically along the flow direction on the structured wall. To match the conditions simulated by Choi et al. (Reference Choi, Moin and Kim1993), computations were performed for low Reynolds number:
 $$\begin{eqnarray}\displaystyle & \displaystyle Re_{m}={\displaystyle \frac{U_{B}H}{\unicode[STIX]{x1D708}}}=5600. & \displaystyle\end{eqnarray}$$
By considering riblet dimensions that induce the drag reduction effect (
 ${<}25\unicode[STIX]{x1D708}/u_{\unicode[STIX]{x1D70F}}$
), eight riblets were placed on the wall. The generated mesh, shown in figure 10, is locally refined near the walls and shows coarsening away from the wall region. This insured adequate resolution for reliable estimation of the skin friction and the drag reduction effect.
${<}25\unicode[STIX]{x1D708}/u_{\unicode[STIX]{x1D70F}}$
), eight riblets were placed on the wall. The generated mesh, shown in figure 10, is locally refined near the walls and shows coarsening away from the wall region. This insured adequate resolution for reliable estimation of the skin friction and the drag reduction effect.
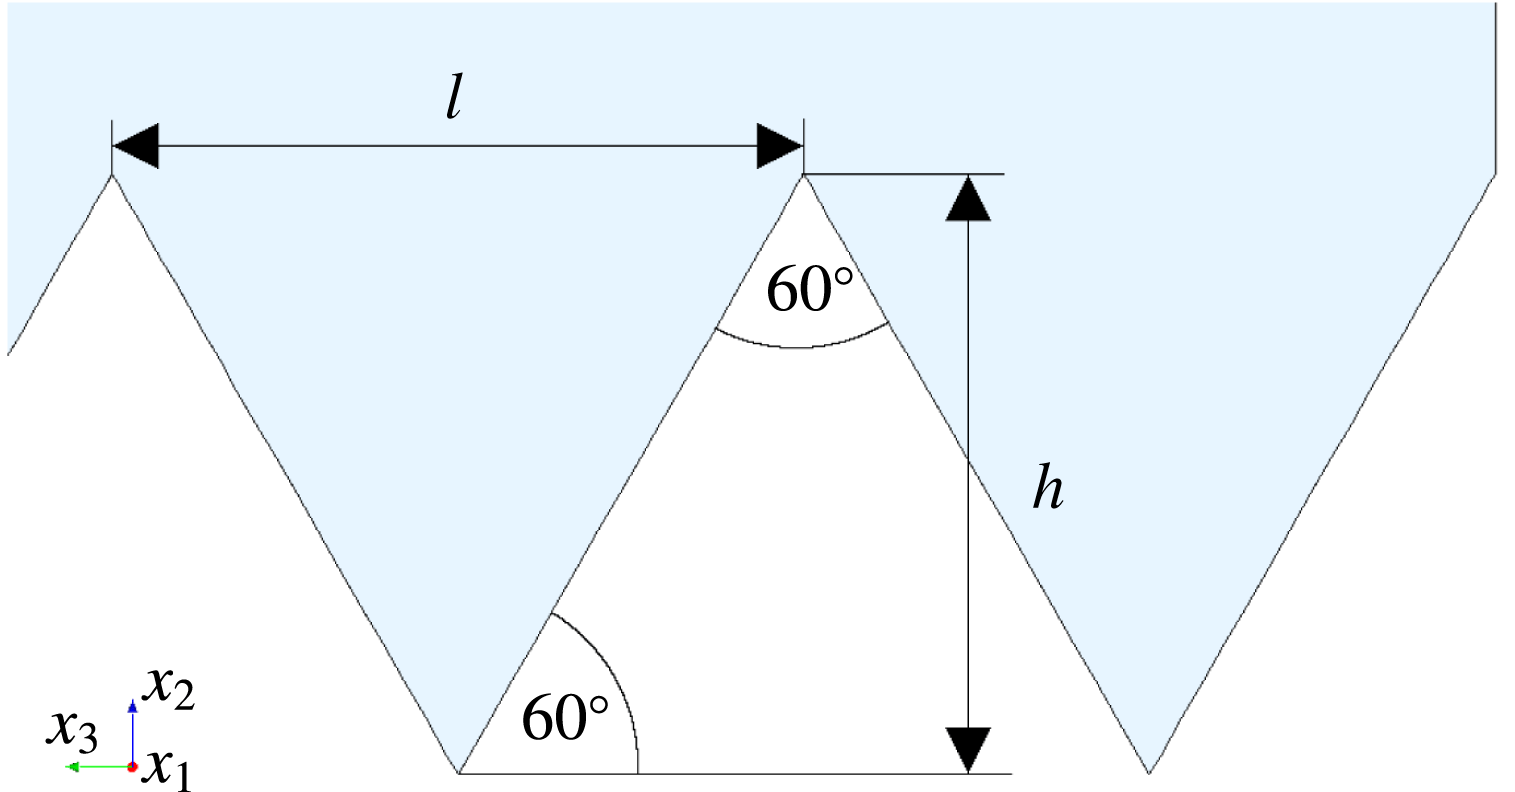
Figure 9. The riblet geometry used for validation of the numerical program:
 $l$
is the riblet width and
$l$
is the riblet width and
 $h$
the riblet height.
$h$
the riblet height.
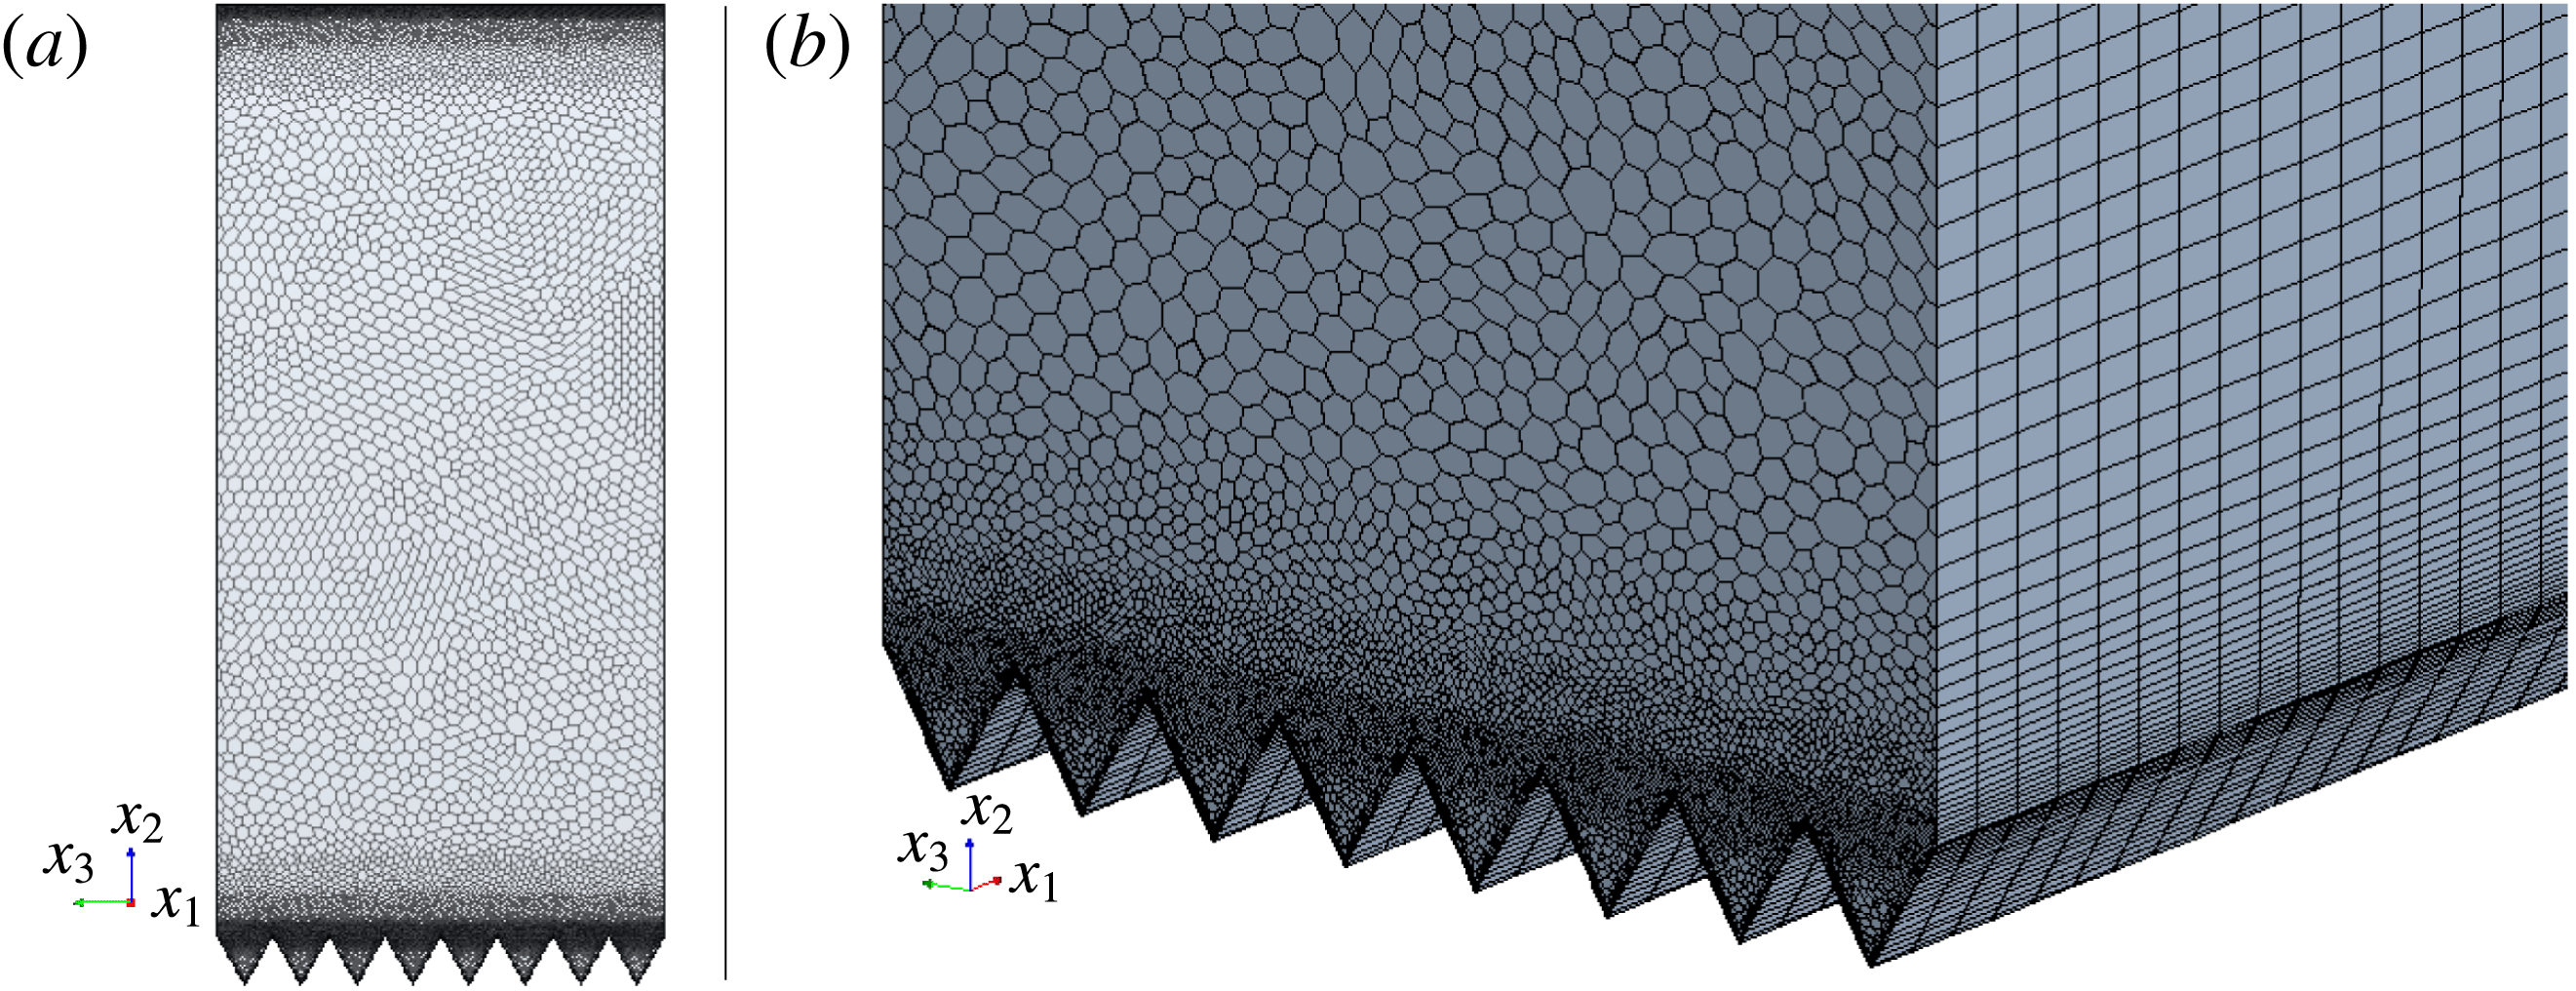
Figure 10. Front (a) and side (b) views of the channel section with computational grid for simulation the turbulent drag reduction effect by riblets.
Visualization of the wall shear stress development on channel walls, illustrated in figures 11 and 12, reveals significant reductions on the bottom wall covered with riblets. Isolated regions of high shear stress visible on the flat wall cannot be identified on the wall covered with riblets, except in the region around the riblet tips. In the valley region between neighbouring riblets, the wall shear stress drops below the value
 $6\unicode[STIX]{x1D707}U_{B}/H=0.0145~\text{N}~\text{m}^{-2}$
which holds for laminar flow. This evidence is in agreement with findings reported by Choi et al. (Reference Choi, Moin and Kim1993) and confirm the ability of riblet structures to suppress turbulence and produce relaminarization of the flow, as predicted by Irvine & Eckert (Reference Irvine and Eckert1960), who suggested the use of riblets for laminar flow control and drag reduction.
$6\unicode[STIX]{x1D707}U_{B}/H=0.0145~\text{N}~\text{m}^{-2}$
which holds for laminar flow. This evidence is in agreement with findings reported by Choi et al. (Reference Choi, Moin and Kim1993) and confirm the ability of riblet structures to suppress turbulence and produce relaminarization of the flow, as predicted by Irvine & Eckert (Reference Irvine and Eckert1960), who suggested the use of riblets for laminar flow control and drag reduction.
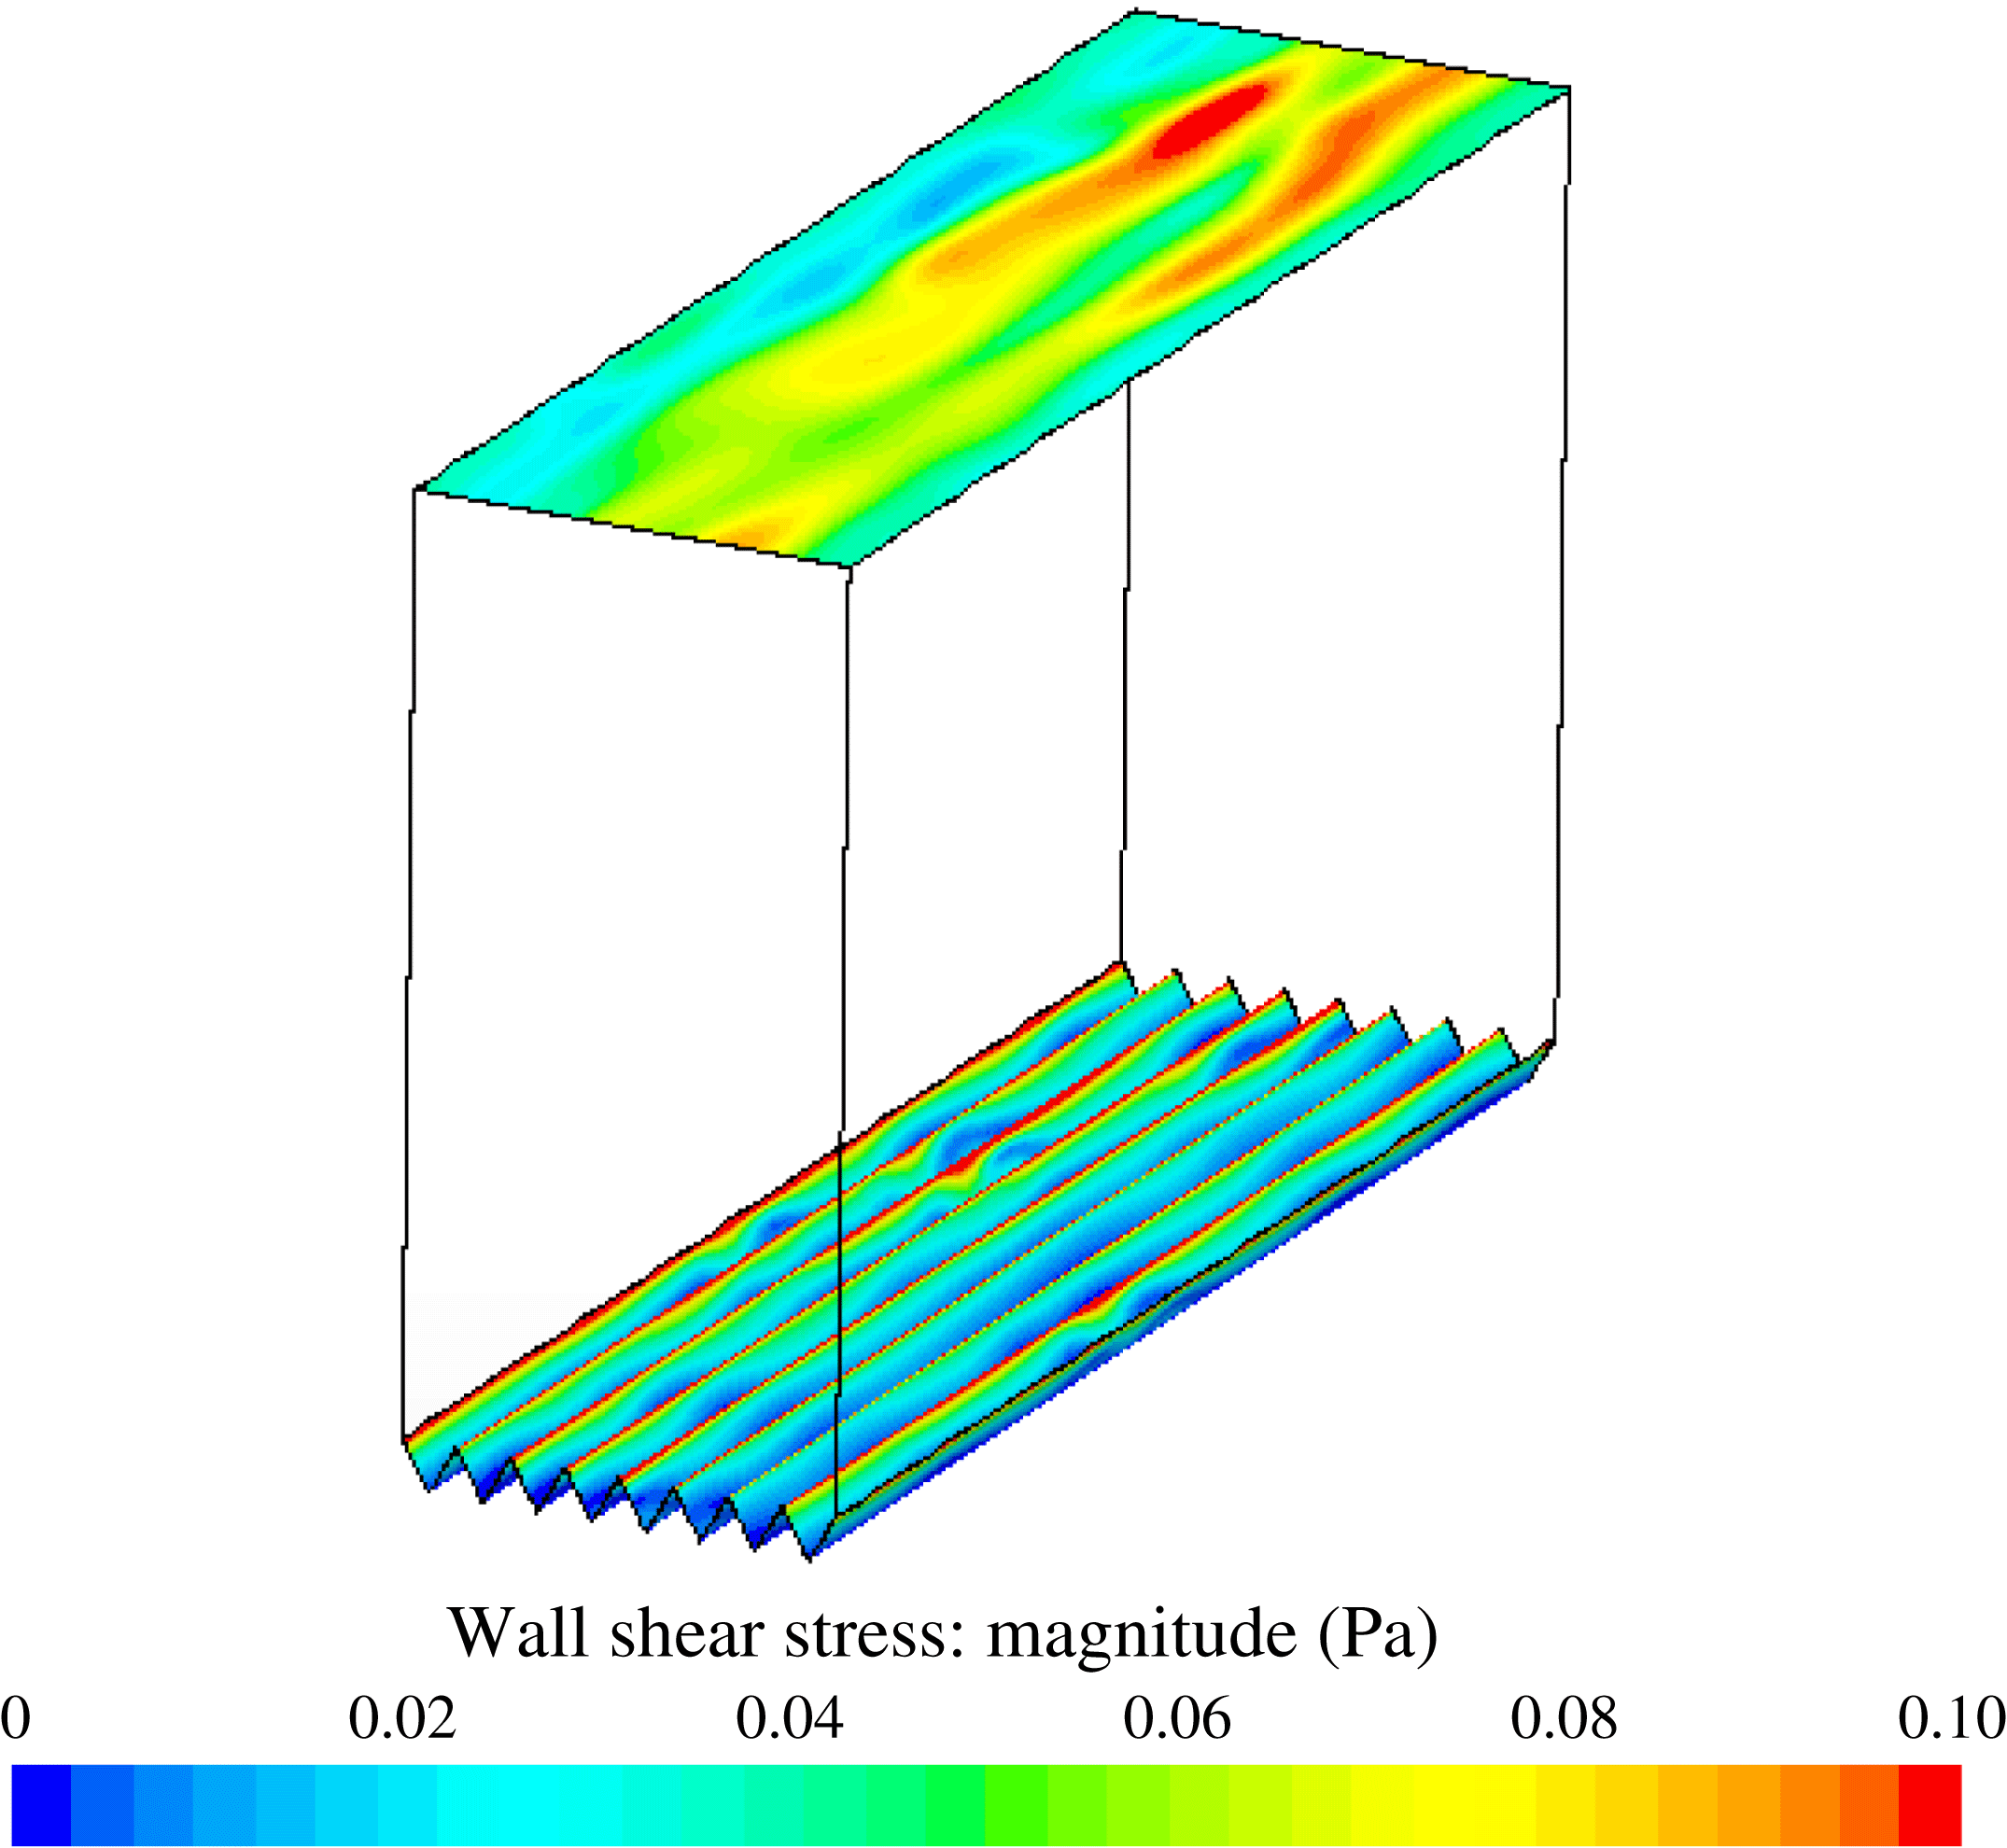
Figure 11. Contour plots of the instantaneous wall shear stress on channel walls.
Table 1. Mean values of forces, wall shear stresses and friction velocities on channel walls and riblet dimensions scaled on wall quantities (Perić Reference Perić2011).
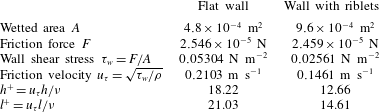
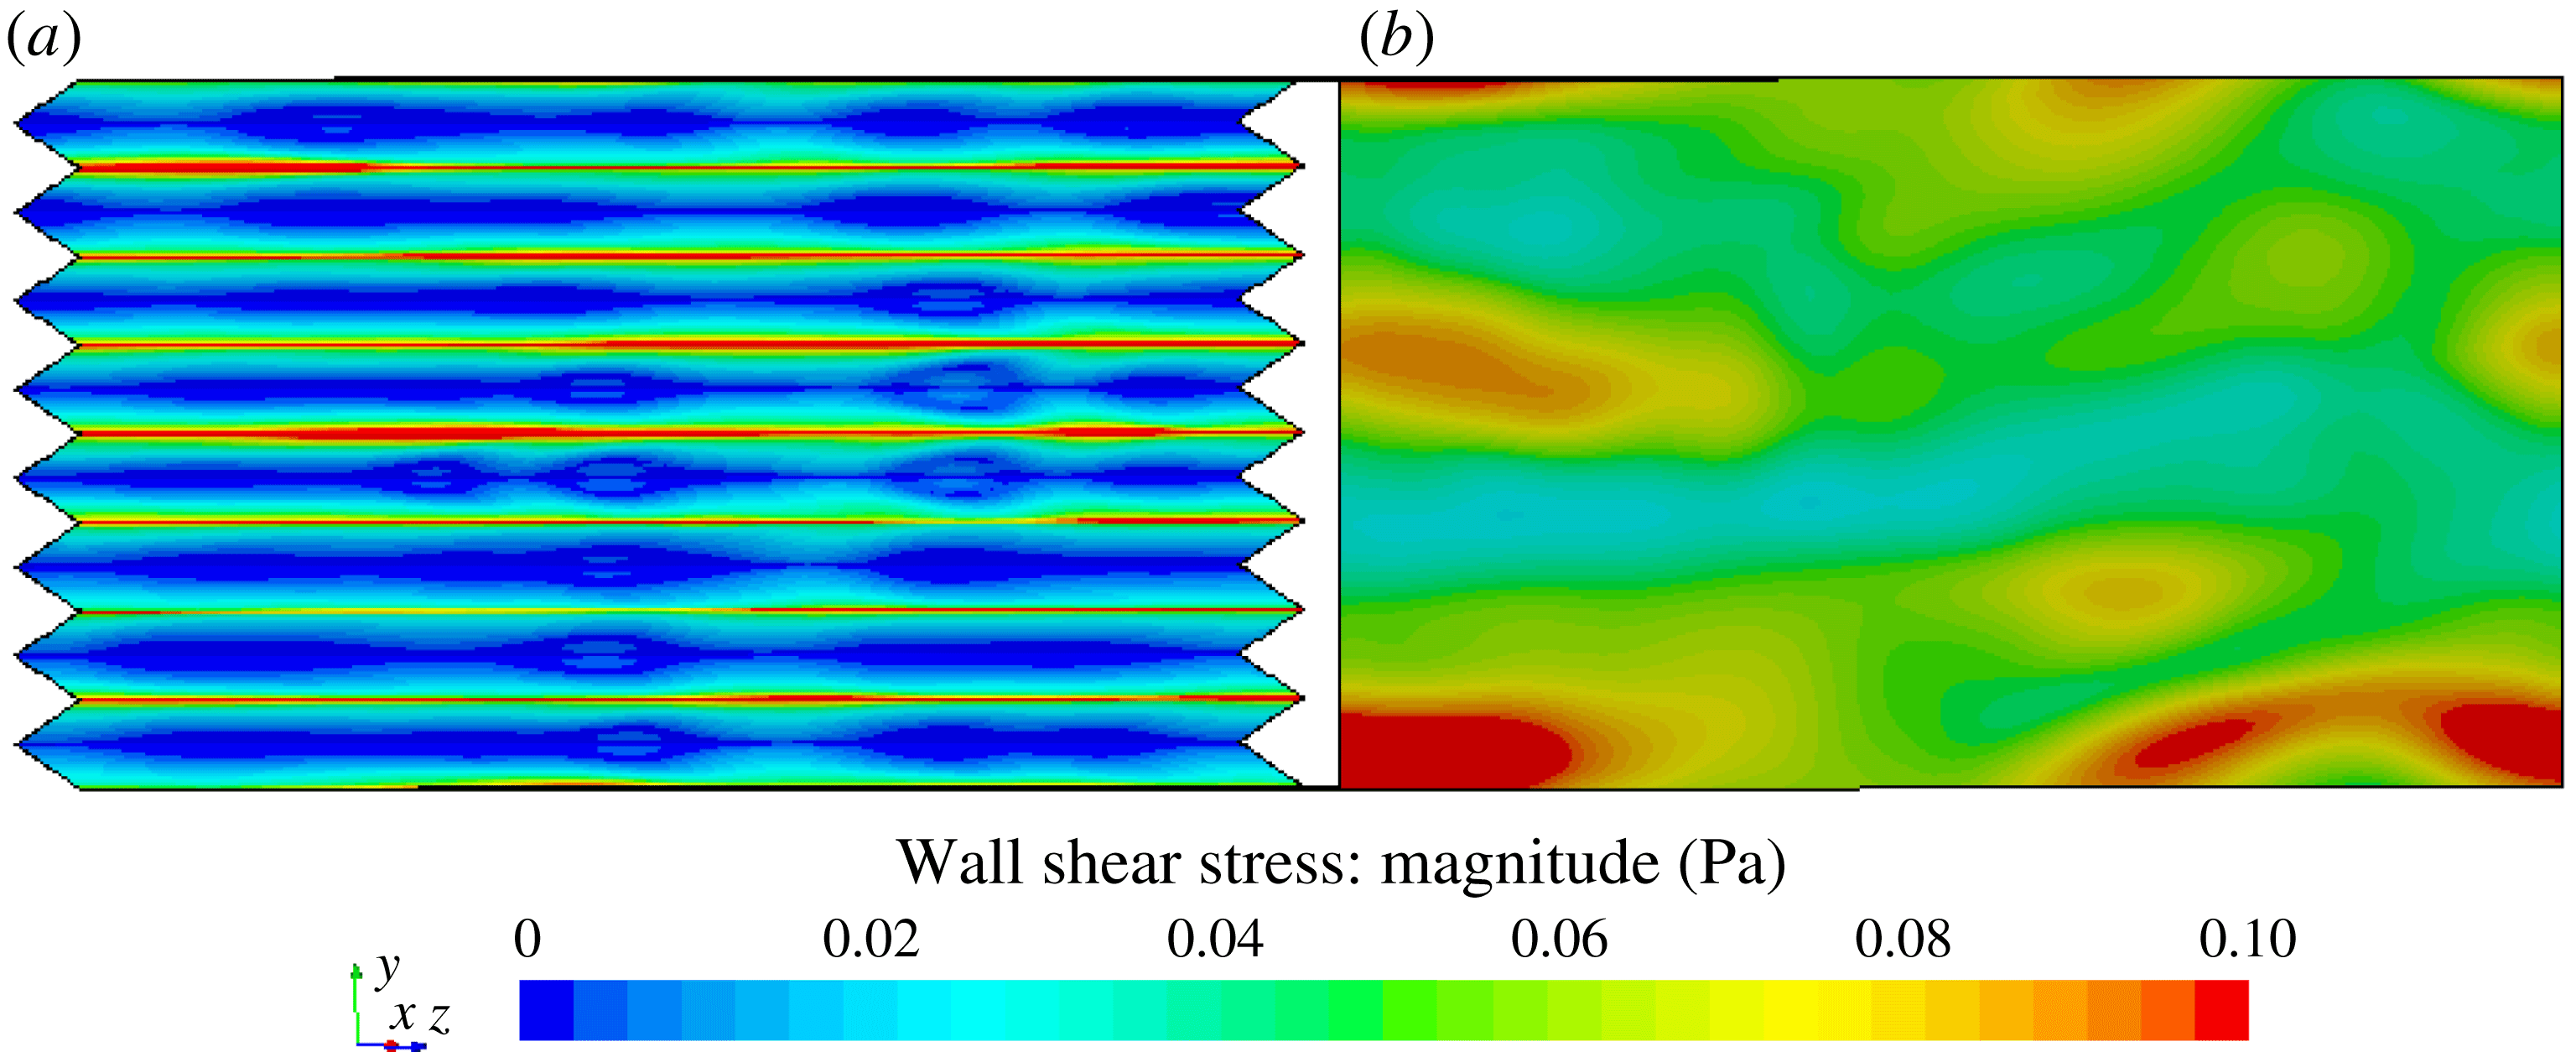
Figure 12. Top view of the instantaneous wall shear stress developing on the wall covered with riblets (a) and shear stress distribution on the flat wall (b). The wall shear stress in the riblet valley drops below the value corresponding to laminar channel flow at the same
 $Re_{m}$
(
$Re_{m}$
(
 $\unicode[STIX]{x1D70F}_{wall}=0.0145~\text{N}~\text{m}^{-2}$
).
$\unicode[STIX]{x1D70F}_{wall}=0.0145~\text{N}~\text{m}^{-2}$
).
To quantify the drag reduction effect by riblet structures, computational studies were extended by considering the influence of the domain size and spatial/temporal resolution of simulations on the friction forces acting on channel walls. Table 1 provides computational results for forces with corresponding data for wall shear stresses and friction velocities that were used to scale the riblet geometry. Owing to the increase in wetted area, a significant reduction of wall shear stress over riblets results in only a slight reduction of the friction force compared with the force acting on the flat wall. The estimated drag reduction level of
 $\text{DR}\simeq 3.4\,\%$
is in broad agreement with the experimental results of Walsh (Reference Walsh1983).
$\text{DR}\simeq 3.4\,\%$
is in broad agreement with the experimental results of Walsh (Reference Walsh1983).
5 Persistence of laminar flow regime with surface-embedded grooves
To study flow stabilization by surface-embedded grooves, the structured wall was designed following the strategy outlined in § 2. By systematic modifications of the surface geometry, an attempt was made to modulate turbulence towards the statistically axisymmetric state and in this way achieve persistence of laminar flow. For the same conditions, flow in a flat channel experiences turbulence almost instantly, as demonstrated in figure 7(a). The outstanding task, therefore, is to design the surface morphology so as to permit flow development without turbulence.
Ten simulation runs were made to investigate the influence of the grooved surface morphology on viscous drag reduction following the strategy outlined in § 2 and figure 3. Simulations were performed for the Reynolds number
 $Re_{m}=U_{B}H/\unicode[STIX]{x1D708}=5\times 10^{3}$
. Only a limited sample of the results is presented to demonstrate the essential physical insights and provide support for theoretical considerations. No account of surface geometry optimization is included and will be the subject of further research efforts (for details see Krieger Reference Krieger2015).
$Re_{m}=U_{B}H/\unicode[STIX]{x1D708}=5\times 10^{3}$
. Only a limited sample of the results is presented to demonstrate the essential physical insights and provide support for theoretical considerations. No account of surface geometry optimization is included and will be the subject of further research efforts (for details see Krieger Reference Krieger2015).
5.1 Surface geometry
The initial surface geometry consisted of square grooves, matching sublayer dimensions as sketched in figure 2. Grooves were arranged periodically in the spanwise direction and oriented parallel to the mean flow. The period between neighbouring grooves was fixed at 3–4 groove depths under the assumption that such periodicity would promote the development of low-speed streaks in the interspacing region between the grooves under the influence of axisymmetry dictated by the groove side walls. A highly elongated and anisotropic streak pattern that preserves axisymmetry with a corkscrew type of invariance (
 $\text{III}_{a}>0$
) was found (see, for example, Hinze Reference Hinze1975) to form the essential mechanism observed during forward and reverse transitions (Jovanović & Nishi Reference Jovanović and Nishi2016). Following deductions resulting from qualitative analysis of (1.3), it is expected that periodically induced streaks would be beneficial for stabilizing laminar flow development.
$\text{III}_{a}>0$
) was found (see, for example, Hinze Reference Hinze1975) to form the essential mechanism observed during forward and reverse transitions (Jovanović & Nishi Reference Jovanović and Nishi2016). Following deductions resulting from qualitative analysis of (1.3), it is expected that periodically induced streaks would be beneficial for stabilizing laminar flow development.
Close examination of the flow behaviour over the square grooves shown in figure 2 reveals that it is not the optimum choice for achieving axisymmetry in the velocity fluctuations near the wall. Such a geometry enforces axisymmetry only along groove bisectors starting from corners at the groove bottom up to the groove centre (Daschiel et al. Reference Daschiel, Krieger, Jovanović and Delgado2014). This situation is not satisfactory and demands further improvements in order to extend axisymmetry more widely. To overcome this shortcoming, the groove geometry was redesigned following experimental results for turbulent flow through a triangular duct with a small apex angle reported by Eckert & Irvine (Reference Eckert and Irvine1956). They showed the occurrence of flow laminarization in the region around the sharp corner of the duct. This evidence suggests that profiling groove side walls intercept at a sharp angle at the groove bottom. Figure 13 shows the geometry that produced clear evidence for suppression of transition onset and persistence of the laminar regime over more than 10 turnover time scales of turbulence (as demonstrated in figure 18). The modified wall geometry increased the cross-sectional area of the channel shown in figure 14 only marginally (0.33 %).
It is interesting that the geometry shown in figure 13 resembles in some detail the wall topology of seal fur investigated by Itoh et al. (Reference Itoh, Tamano, Iguchi, Yokota, Akino, Hino and Kubo2006). Sharp grooves with a large depth (
 $t$
) to width (
$t$
) to width (
 $b$
) ratio were found to produce the turbulent drag reduction effect in the range of
$b$
) ratio were found to produce the turbulent drag reduction effect in the range of
 $\text{DR}\approx 10\,\%$
. Unlike the wall morphology investigated in the present study, the seal fur surface pattern consists of randomized grooves of uneven size and period. Such a pattern is suitable for modification of turbulence flow characterized by the presence of motions at different scales.
$\text{DR}\approx 10\,\%$
. Unlike the wall morphology investigated in the present study, the seal fur surface pattern consists of randomized grooves of uneven size and period. Such a pattern is suitable for modification of turbulence flow characterized by the presence of motions at different scales.
Figure 13. Refined groove geometry designed to prevent breakdown of the laminar flow regime to turbulence under particular circumstances considered in this study.
Figure 14. Layout of the groove-modified channel.
5.2 Numerical grid
The surface pattern shown in figure 13 imposes severe restrictions on the layout of the numerical grid capable of resolving motions inside the gap formed by groove side walls. The groove geometry dictates resolution since the flow inside the groove is laminar and controlled entirely by the viscous diffusion process.
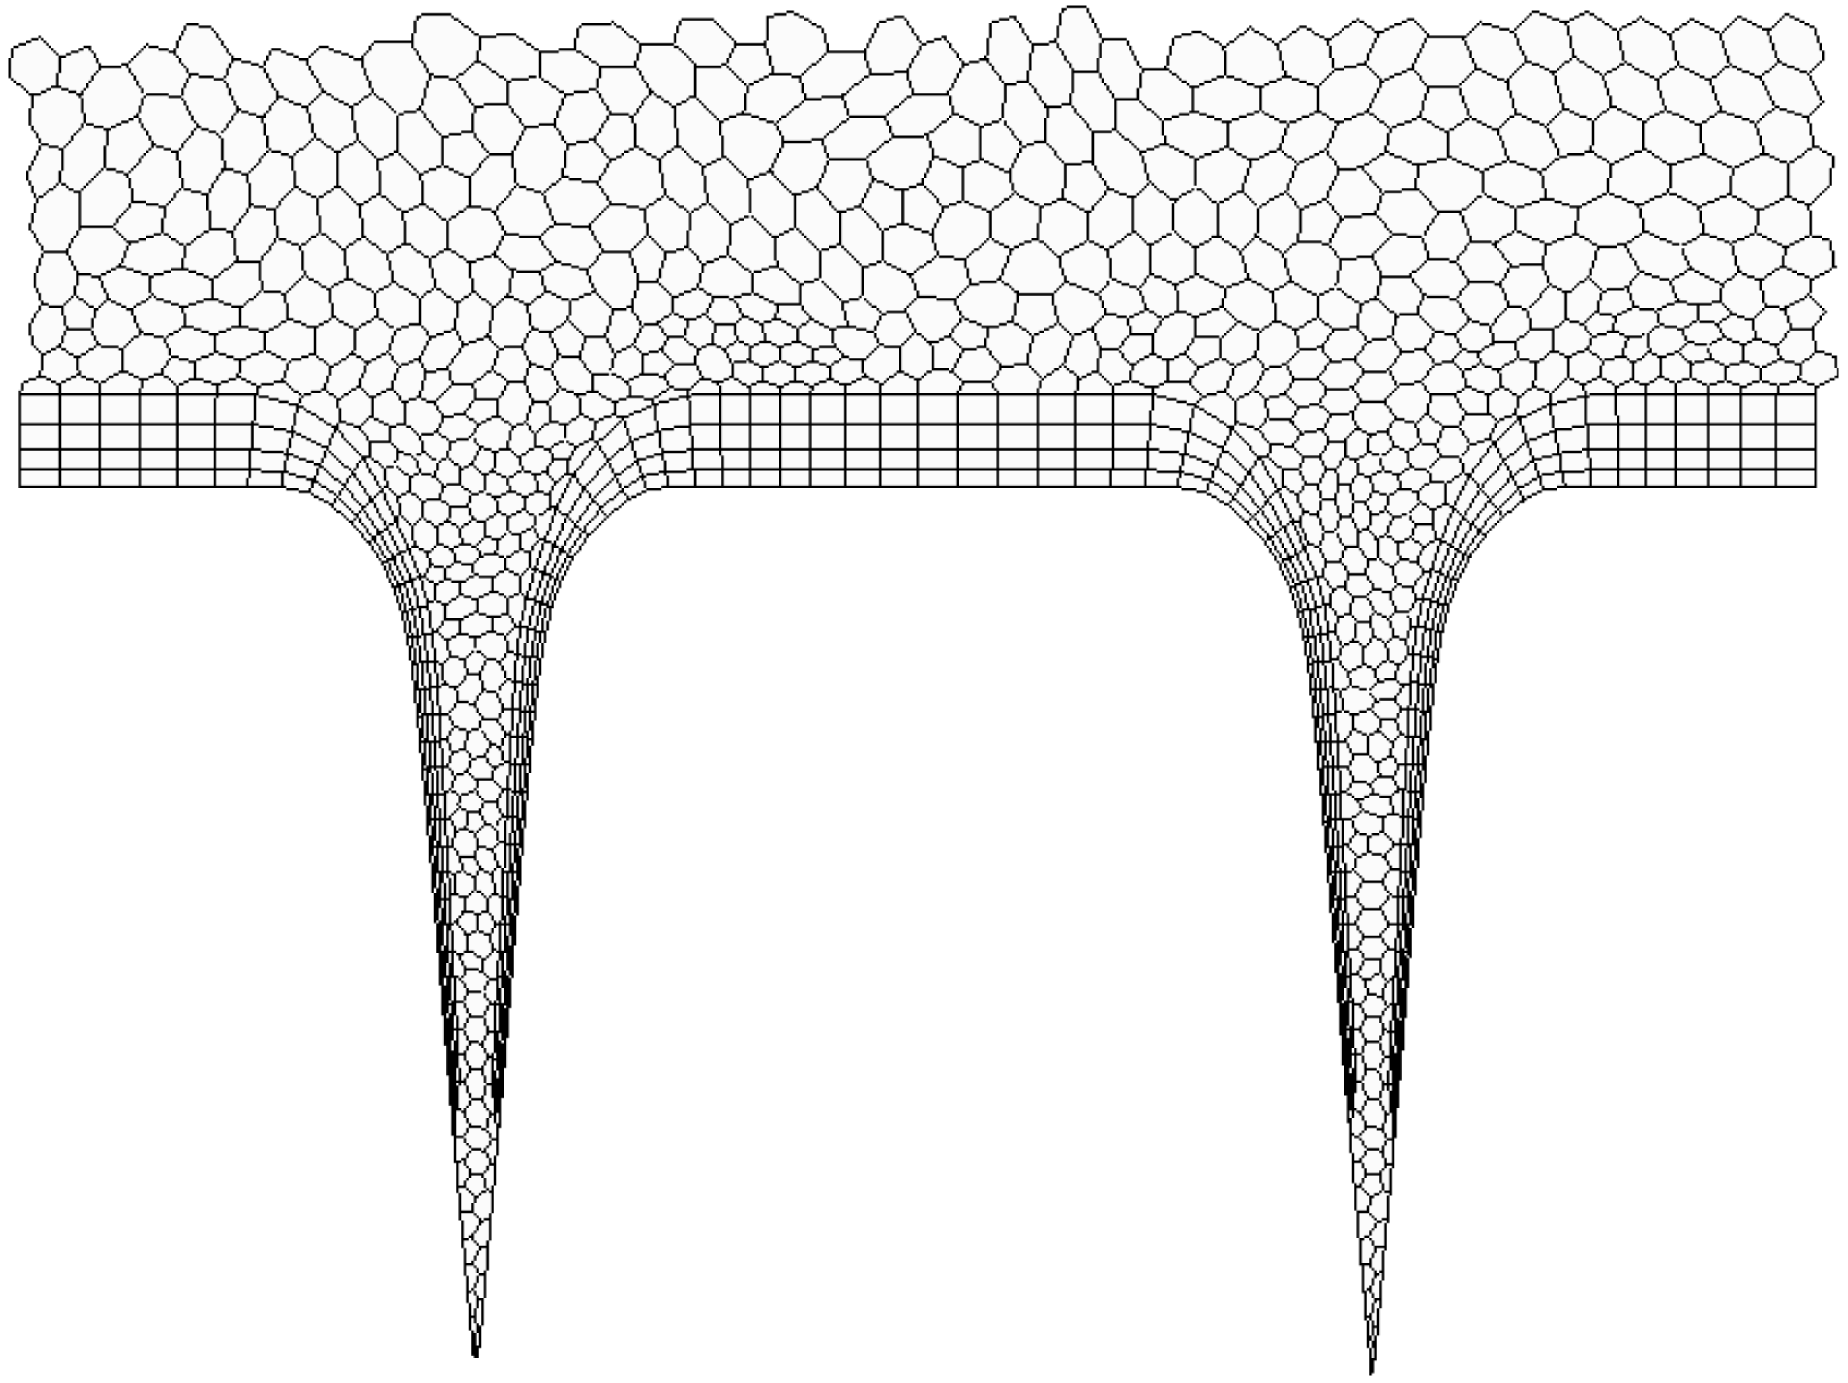
Figure 15. Generated mesh for the groove geometry shown in figure 13.
Absence of sharp corners across the groove contour significantly improves the accuracy of computations and estimation of the drag reduction effect. Singularities, which are inherently present along the surface composed from orthogonal grooves, are a source of uncertainty for the determination of wall shear stress, dissipation rate and turbulence anisotropy.
The layout of the mesh used for simulation shown in figure 15 illustrates an increase in resolution in the gap close to the grove bottom. Generated cells are of small aspect ratio and preserve good orthogonality, which is essential for numerical treatment using the finite volume technique. The above grooved cells are clustered and increase in size away from the wall. Resolution near the wall is critical to capture the peak in the distribution of the turbulent dissipation rate, which is the driving mechanism for turbulence generation.
5.3 The drag reduction effect
Comparison of the flow development in flat and groove-modified channels shown in figure 16 reveals significant differences. The grooved wall exhibits no evidence for turbulence appearance whereas over the opposite flat wall turbulence reached the fully developed state. Comparisons of the flow patterns clearly demonstrate strong damping of turbulence by the grooved surface. Owing to the stabilizing action of the structured surface, laminar and turbulent flow regimes coexist in the groove-modified channel.
Figure 16. Instantaneous flow patterns in the plane normal to the flow direction illustrate significant differences related to the turbulence development in a flat channel (a) and in a groove-modified channel (b). Note that both figures are normalized with channel heights for convenience. The cross-sectional areas of both channels are almost identical. Different colours represent the minimum (blue) and maximum (red) magnitudes of the velocity vector. The instantaneous flow patterns correspond to
 $\unicode[STIX]{x1D70F}\approx 10$
of the data presented in figure 18.
$\unicode[STIX]{x1D70F}\approx 10$
of the data presented in figure 18.
Figure 17 shows the mean velocity profile across the channel. As a consequence of different flow behaviour near solid boundaries, the profile is strongly asymmetric. The tendency in the flow for laminar development is associated with reduced slope of the velocity profile at the grooved wall compared with an increase in the slope at the flat wall due to rapid production of turbulence.
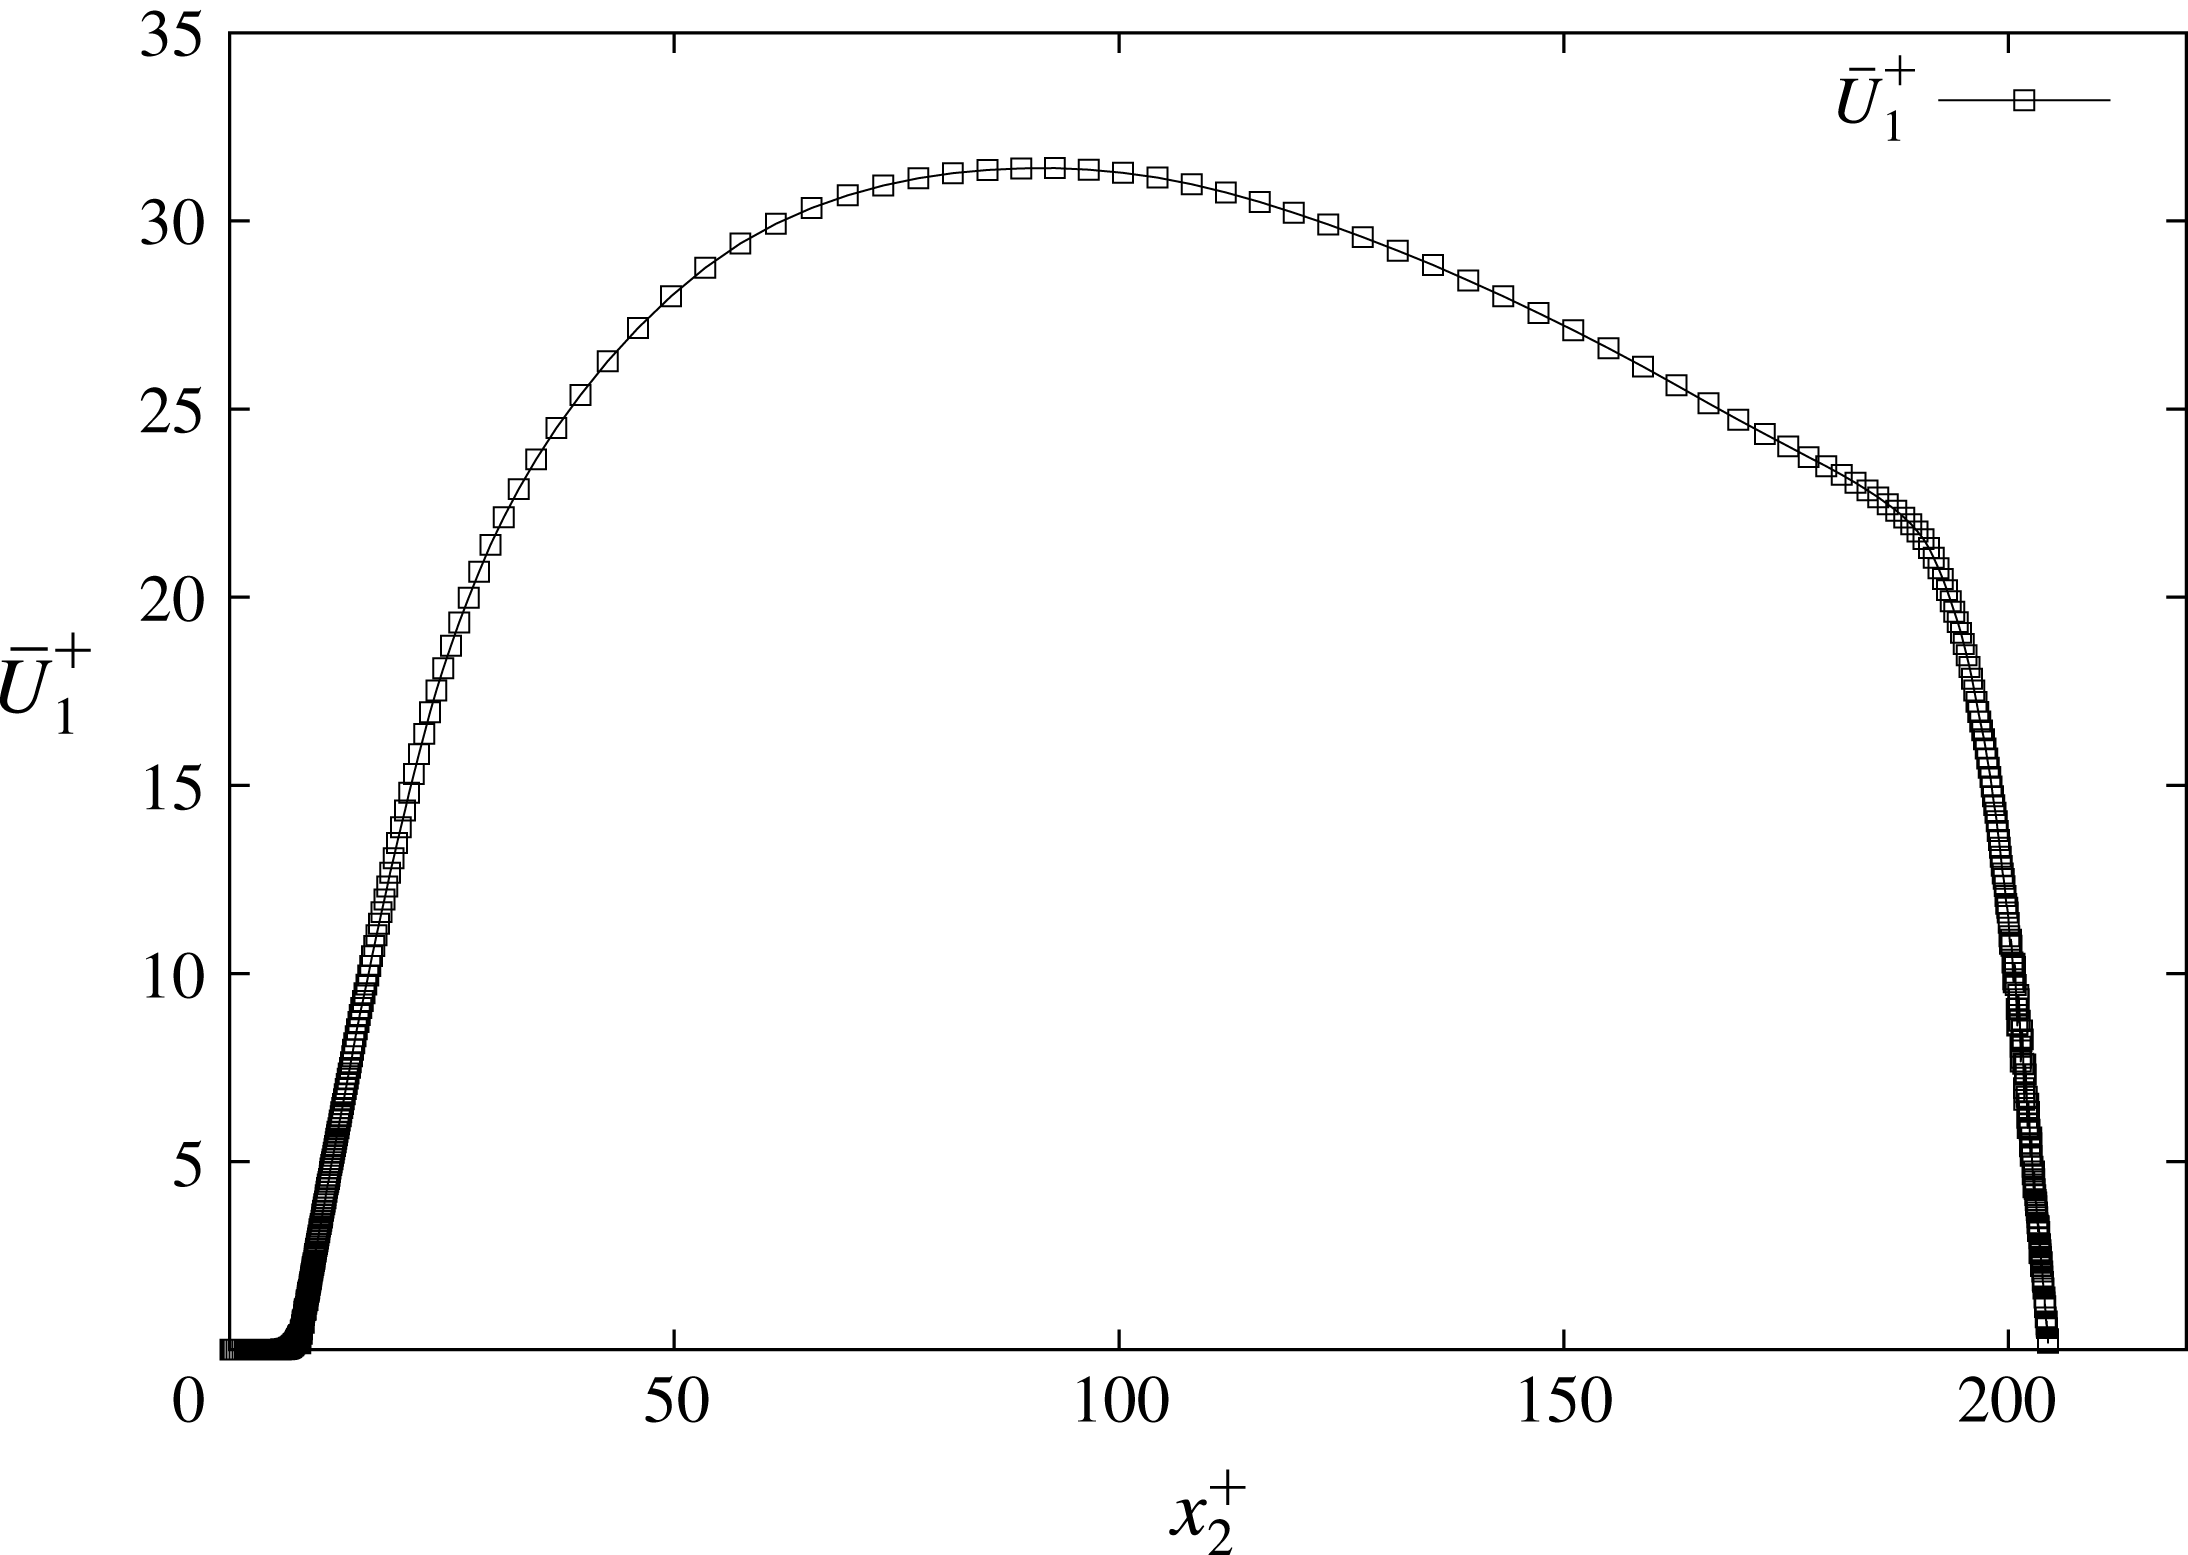
Figure 17. Distribution of the mean flow in a groove-modified channel showing pronounced asymmetry due to laminar and turbulent states on the channel walls.
Differences in the flow development are reflected in friction forces acting on the channel walls. Figure 18 shows that the friction drag is significantly lower over the grooved wall compared to the flat wall. Differences in forces reach over 60 %, in good agreement with the estimation based on laminar and turbulent flow regimes in the channel.
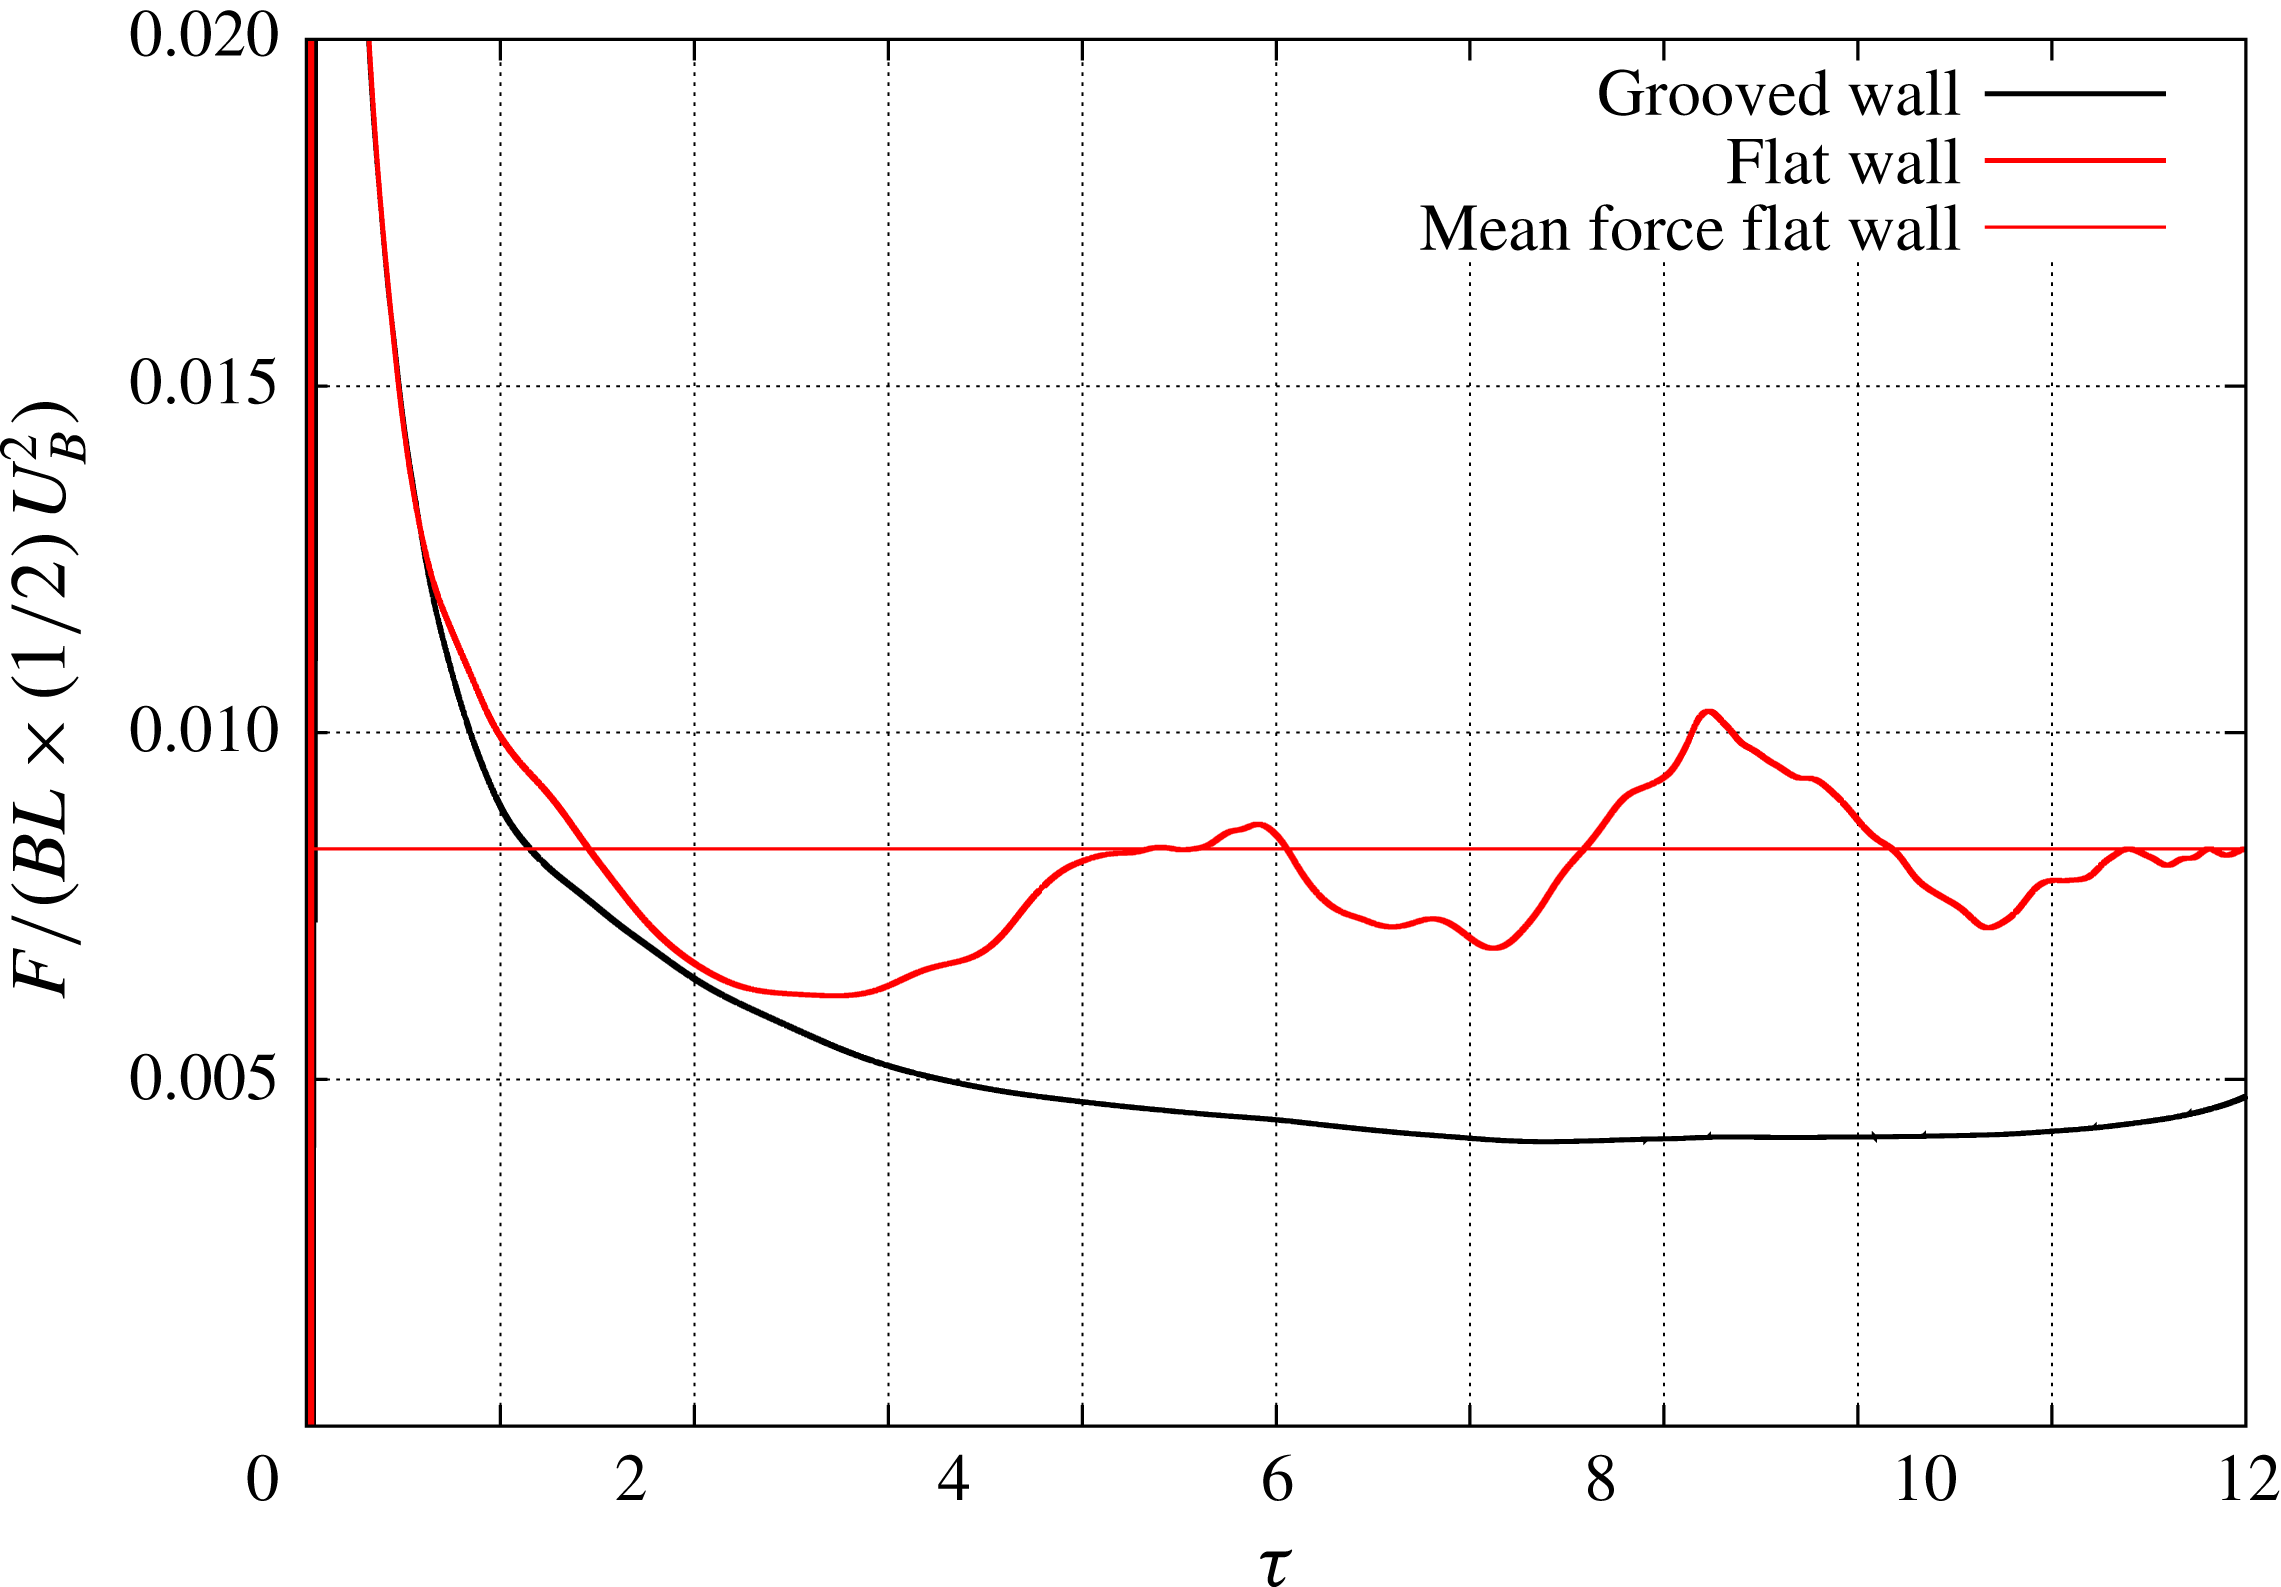
Figure 18. Normalized friction force over smooth and grooved channel walls as a function of turnover time scale of turbulence. Normalization of force (
 $F$
) is performed with the surface area (
$F$
) is performed with the surface area (
 $BL$
) of a flat channel and dynamic pressure (
$BL$
) of a flat channel and dynamic pressure (
 $(1/2)\times \unicode[STIX]{x1D70C}U_{B}^{2}$
). The results are supported by a supplementary movie, available at https://doi.org/10.1017/jfm.2018.423, showing visualization of the wall shear stress development over flat and grooved walls as a function of the turnover time of turbulence
$(1/2)\times \unicode[STIX]{x1D70C}U_{B}^{2}$
). The results are supported by a supplementary movie, available at https://doi.org/10.1017/jfm.2018.423, showing visualization of the wall shear stress development over flat and grooved walls as a function of the turnover time of turbulence
 $\unicode[STIX]{x1D70F}$
.
$\unicode[STIX]{x1D70F}$
.
5.4 Distributions of the turbulent stresses
Distributions of turbulent stresses
 $\overline{u_{i}u_{j}}$
, shown in figure 19, further display noticeable differences in the development of the velocity fluctuations over grooved and flat channel walls. In comparison with turbulence development on the flat wall, fluctuations are significantly reduced over the grooved wall and are to a fair degree of approximation one-componential. Fluctuations of the streamwise component
$\overline{u_{i}u_{j}}$
, shown in figure 19, further display noticeable differences in the development of the velocity fluctuations over grooved and flat channel walls. In comparison with turbulence development on the flat wall, fluctuations are significantly reduced over the grooved wall and are to a fair degree of approximation one-componential. Fluctuations of the streamwise component
 $\overline{u_{1}u_{1}}$
prevail over the components in the normal
$\overline{u_{1}u_{1}}$
prevail over the components in the normal
 $\overline{u_{2}u_{2}}$
and spanwise
$\overline{u_{2}u_{2}}$
and spanwise
 $\overline{u_{3}u_{3}}$
directions, which are negligible, and also the turbulent shear stress
$\overline{u_{3}u_{3}}$
directions, which are negligible, and also the turbulent shear stress
 $\overline{u_{1}u_{2}}$
.
$\overline{u_{1}u_{2}}$
.
From the asymptotic behaviour of the velocity fluctuations near the wall constrained to satisfy the continuity equation for the instantaneous fluctuations
 $\unicode[STIX]{x2202}u_{i}/\unicode[STIX]{x2202}x_{i}=0$
:
$\unicode[STIX]{x2202}u_{i}/\unicode[STIX]{x2202}x_{i}=0$
:
 $$\begin{eqnarray}\displaystyle \displaystyle \left.\begin{array}{@{}lllllll@{}}u_{1}\ & =\ & a_{1}x_{2}\ & +\ & a_{2}x_{2}^{2}\ & +\ & \cdots \\[4.0pt] u_{2}\ & =\ & \ & +\ & b_{2}x_{2}^{2}\ & +\ & \cdots \\[4.0pt] u_{3}\ & =\ & c_{1}x_{2}\ & +\ & c_{2}x_{2}^{2}\ & +\ & \cdots \end{array}\right\}\quad \text{as }x_{2}\rightarrow 0, & & \displaystyle\end{eqnarray}$$
results the asymptotic behaviour of turbulent stresses and the dissipation rate near the wall:
 $$\begin{eqnarray}\displaystyle \displaystyle \left.\begin{array}{@{}lll@{}}\overline{u_{1}^{2}}\ & =\ & \overline{a_{1}^{2}}x_{2}^{2}+\cdots \\[3.0pt] \overline{u_{2}^{2}}\ & =\ & \overline{b_{2}^{2}}x_{2}^{4}+\cdots \\[3.0pt] \overline{u_{3}^{2}}\ & =\ & \overline{c_{1}^{2}}x_{2}^{2}+\cdots \\[3.0pt] \unicode[STIX]{x1D716}\ & =\ & \unicode[STIX]{x1D708}(\overline{a_{1}^{2}}+\overline{c_{1}^{2}})+\cdots \end{array}\right\}\quad \text{as }x_{2}\rightarrow 0. & & \displaystyle\end{eqnarray}$$
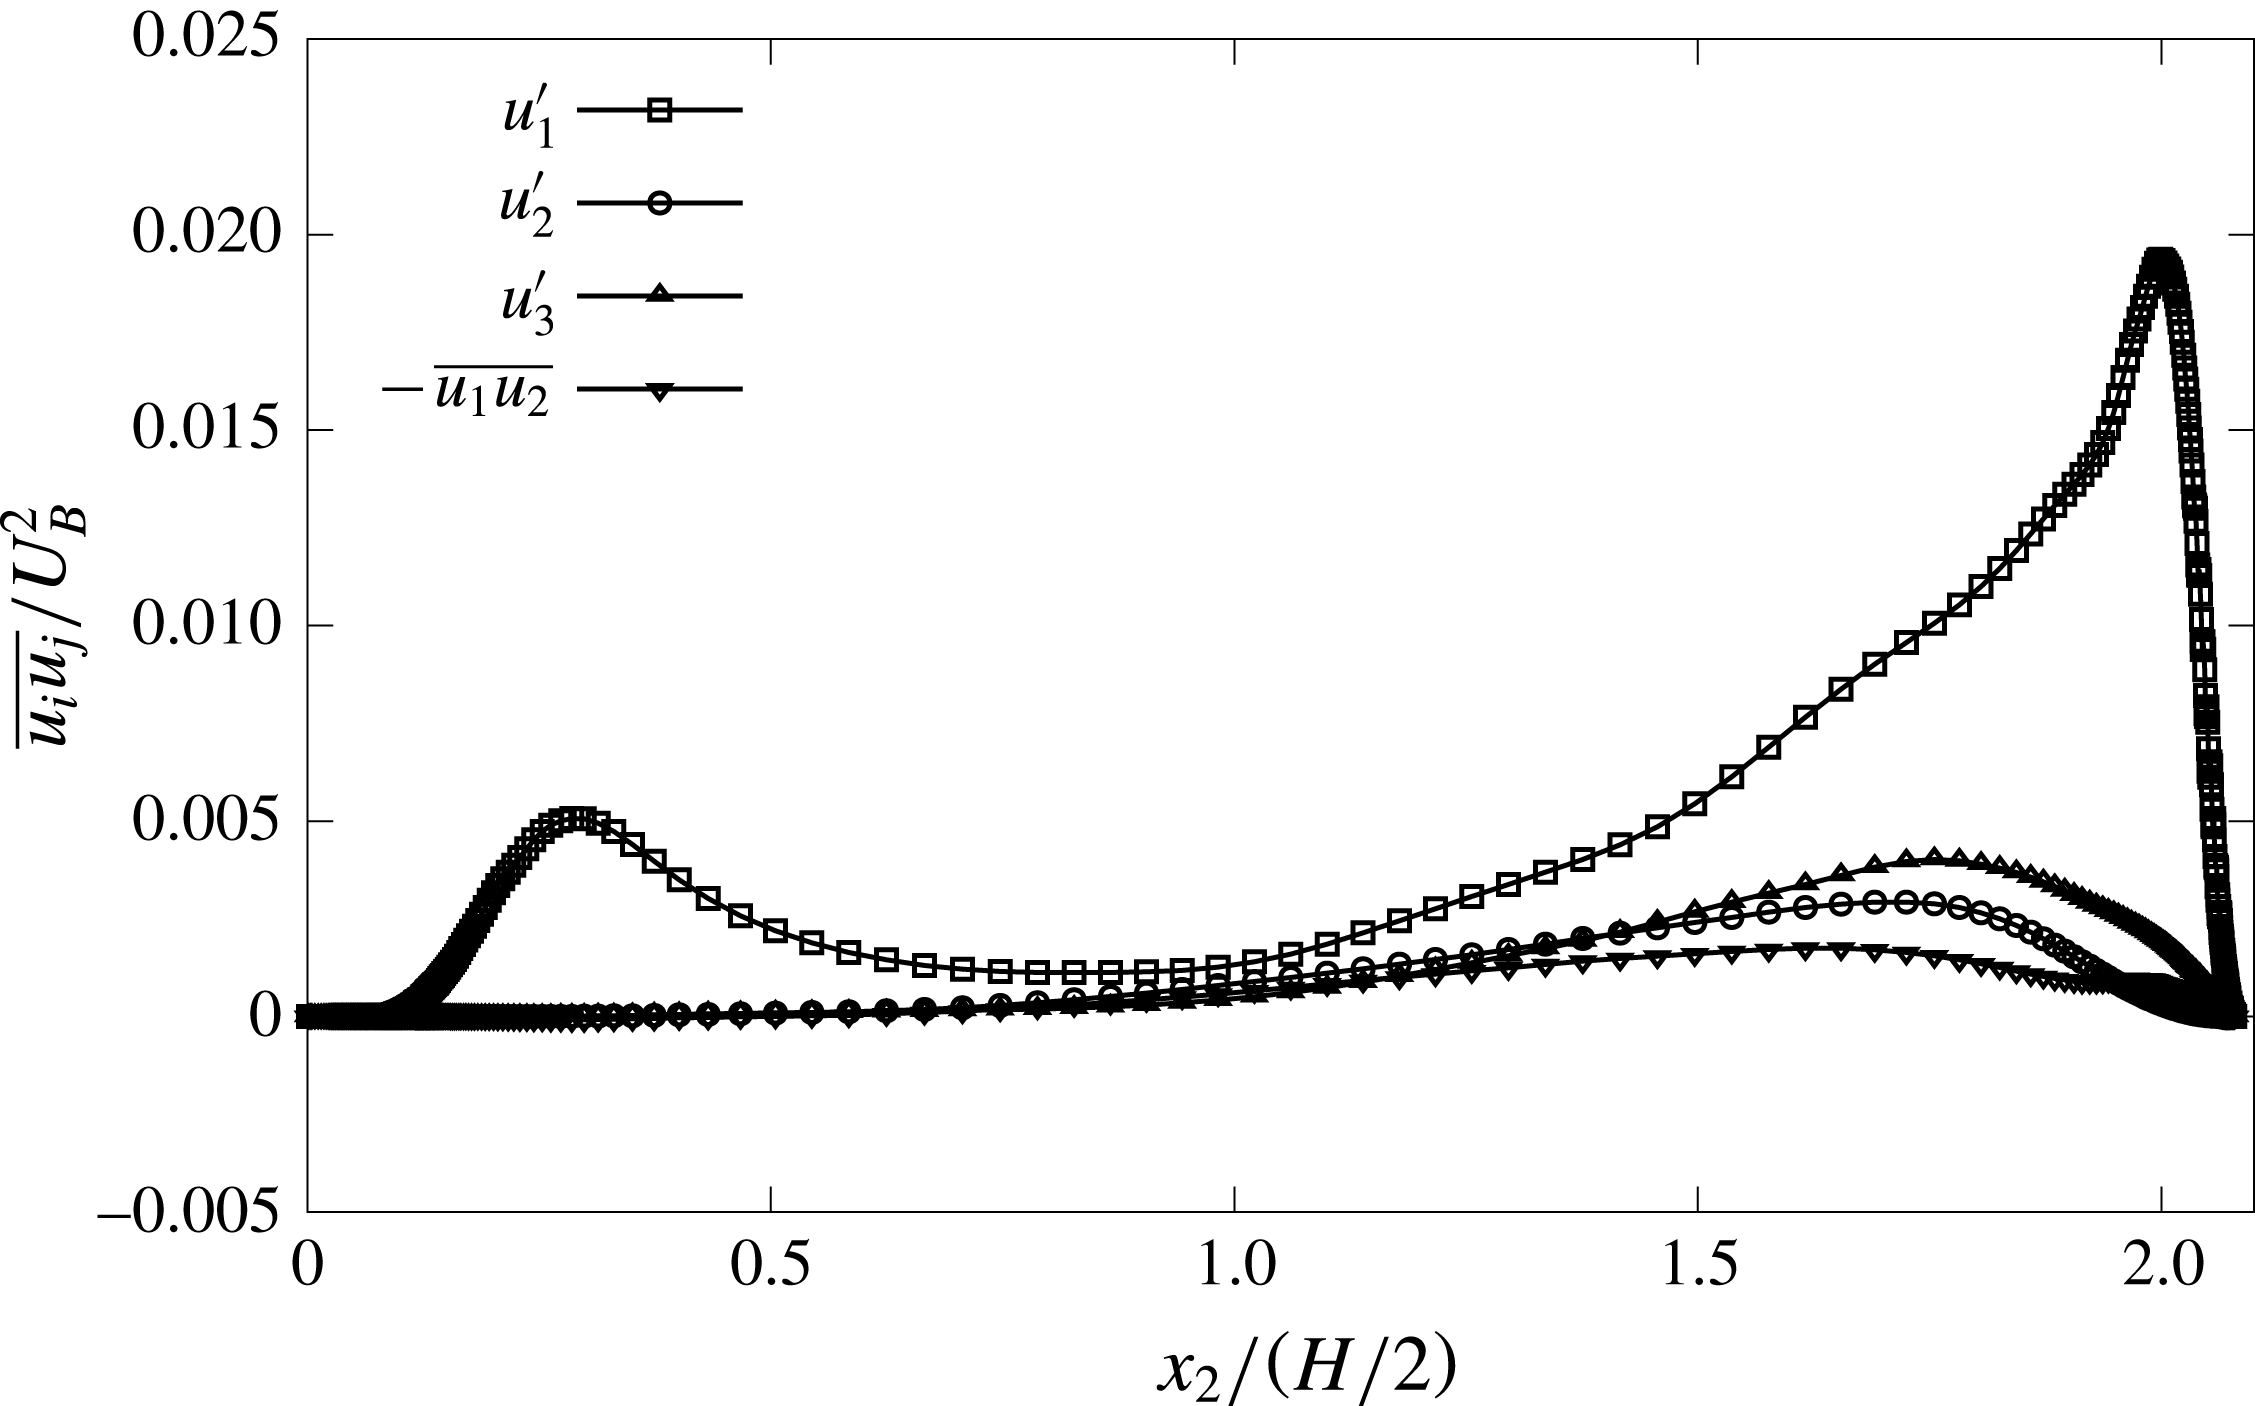
Figure 19. Distributions of the turbulent stresses in a groove-modified channel show large differences in slopes of the stress profiles near grooved and flat walls. Such behaviour implies production of
 $\unicode[STIX]{x1D716}$
at the flat wall and damping of
$\unicode[STIX]{x1D716}$
at the flat wall and damping of
 $\unicode[STIX]{x1D716}$
at the grooved wall.
$\unicode[STIX]{x1D716}$
at the grooved wall.
From the above results, we conclude that the kinetic energy of turbulence
 $k=1/2\overline{u_{i}u_{i}}$
increases in proportion to the magnitude of the dissipation rate at the wall
$k=1/2\overline{u_{i}u_{i}}$
increases in proportion to the magnitude of the dissipation rate at the wall
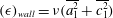 $(\unicode[STIX]{x1D716})_{wall}=\unicode[STIX]{x1D708}(\overline{a_{1}^{2}}+\overline{c_{1}^{2}})$
:
$(\unicode[STIX]{x1D716})_{wall}=\unicode[STIX]{x1D708}(\overline{a_{1}^{2}}+\overline{c_{1}^{2}})$
:
 $$\begin{eqnarray}\displaystyle & \displaystyle k={\displaystyle \frac{1}{2}}{\displaystyle \frac{(\unicode[STIX]{x1D716})_{wall}}{\unicode[STIX]{x1D708}}}x_{2}^{2}+\cdots \,, & \displaystyle\end{eqnarray}$$
and suggest that turbulence can be entirely suppressed if, and only if,
 $\unicode[STIX]{x1D716}_{wall}\rightarrow 0$
. From (5.3) and figure 19, it is obvious that the production of turbulence along the flat wall and damping of turbulence over the grooved wall are logical and not surprising.
$\unicode[STIX]{x1D716}_{wall}\rightarrow 0$
. From (5.3) and figure 19, it is obvious that the production of turbulence along the flat wall and damping of turbulence over the grooved wall are logical and not surprising.
It is noted in passing that by constraining expansion describing the limiting behaviour of turbulence near the wall by the continuity equation holding for compressible fluid/flow, it is possible to show that motions in the viscous sublayer cannot be considered as two-componential as implied by (5.1). Since turbulence at low Reynolds numbers evolves from the highly anisotropic state of the velocity fluctuations by intermittent sweeping between stable axisymmetric and unstable two-component states, we conclude that compressibility stabilizes the laminar flow development and postpones transition to turbulence to higher Reynolds number, as demonstrated by inflight measurements by Sternberg (Reference Sternberg1952) (see also Song et al. Reference Song, Jovanović, Al-Salaymeh, Rauh and Delgado2016).
5.5 Anisotropy-invariant mapping
In order to shed light on the mechanism responsible for stabilization of the laminar regime and the drag reduction effect, anisotropy-invariant mapping of turbulence was carried out across channel sections corresponding to valley and crest regions of the grooved surface. Analytic considerations based on the equations for the mean flow led to the conclusion that persistence of the laminar regime can be achieved (for statistically stationary velocity fluctuations) if the stress
 $\overline{u_{i}u_{j}}$
is forced towards the axisymmetric state, leading to maximum reduction of the friction drag.
$\overline{u_{i}u_{j}}$
is forced towards the axisymmetric state, leading to maximum reduction of the friction drag.
Figure 20 shows trajectories across the anisotropy-invariant map constructed from invariants of the anisotropy tensor plotted along cross-sections starting from the channel centreline and finishing at valley and crest portions of the grooved surface. These trajectories exhibit clear evidence for axisymmetry in
 $\overline{u_{i}u_{j}}$
and are substantially different from those approaching the opposite flat wall. Trajectories approaching the flat wall show a tendency, in the region of viscous sublayer (
$\overline{u_{i}u_{j}}$
and are substantially different from those approaching the opposite flat wall. Trajectories approaching the flat wall show a tendency, in the region of viscous sublayer (
 $x_{2}^{+}<5$
), for development along the two-component state, which promote turbulent dissipation and therefore the appearance and self-maintenance of turbulence.
$x_{2}^{+}<5$
), for development along the two-component state, which promote turbulent dissipation and therefore the appearance and self-maintenance of turbulence.
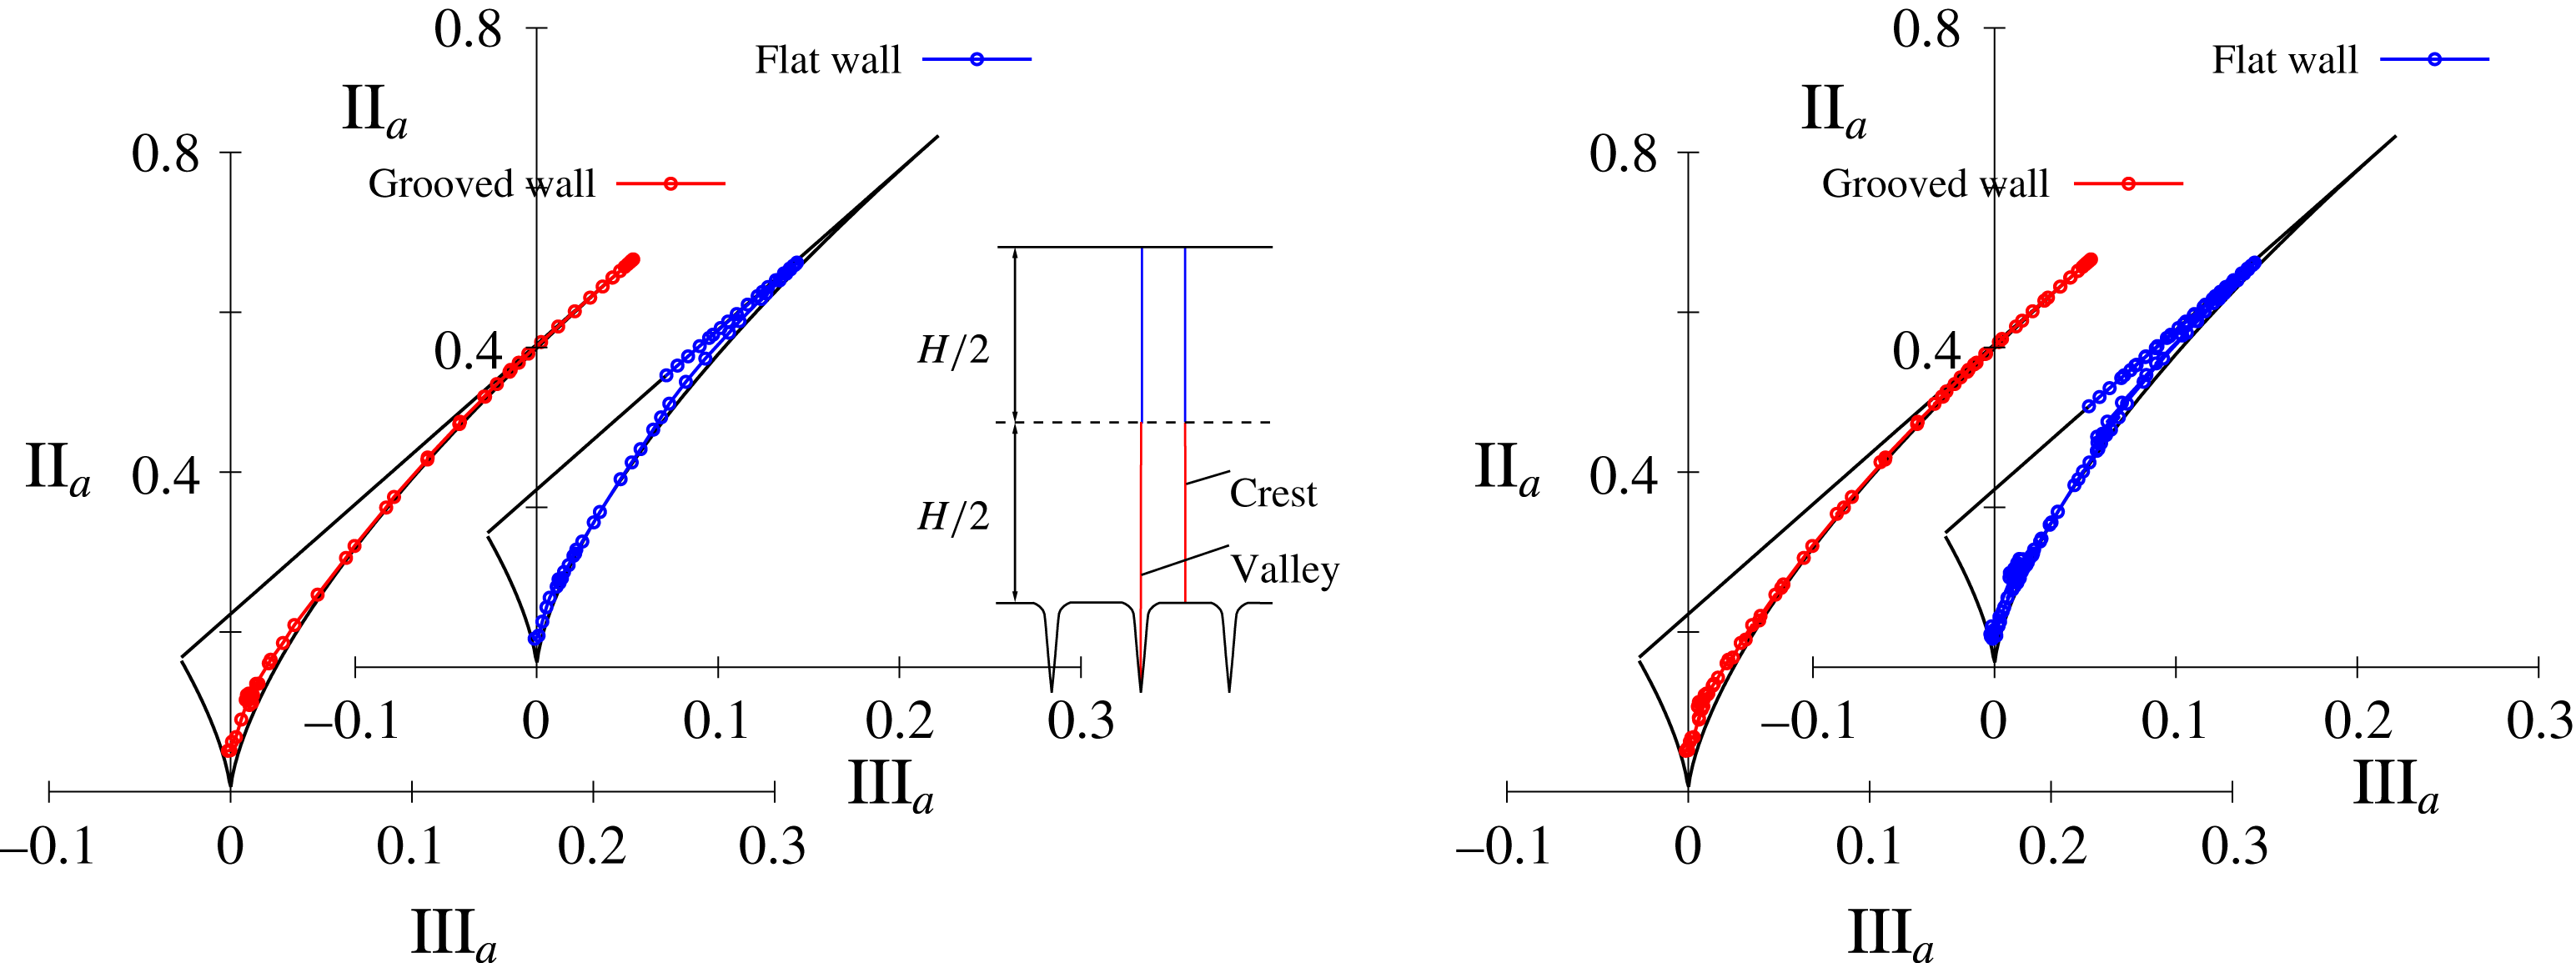
Figure 20. Anisotropy-invariant mapping of turbulence shows that axisymmetry in the turbulent stresses
 $\overline{u_{i}u_{j}}$
persists over valley (left red dotted points) and crest (right red dotted points) regions of the grooved surface. Such a structure of
$\overline{u_{i}u_{j}}$
persists over valley (left red dotted points) and crest (right red dotted points) regions of the grooved surface. Such a structure of
 $\overline{u_{i}u_{j}}$
ensures persistence of the laminar flow regime in wall-bounded flows. Approaching the flat wall, corresponding trajectories (blue dotted points) show deviations from axisymmetry and development along the two-component state.
$\overline{u_{i}u_{j}}$
ensures persistence of the laminar flow regime in wall-bounded flows. Approaching the flat wall, corresponding trajectories (blue dotted points) show deviations from axisymmetry and development along the two-component state.
5.6 Turbulence energy spectra
Power spectral distributions, shown in figure 21, further elucidate details of the turbulence development over flat and grooved walls. There is no noticeable effect on the energy transfer at the channel centreline (
 $x_{2}^{+}\approx 100$
) since the distribution is similar to that deduced for the flat channel shown in figure 8(b). Approaching the grooved surface (
$x_{2}^{+}\approx 100$
) since the distribution is similar to that deduced for the flat channel shown in figure 8(b). Approaching the grooved surface (
 $x_{2}^{+}\approx 12$
), a significant reduction in the energy content is observed, whereas on approaching the flat wall (
$x_{2}^{+}\approx 12$
), a significant reduction in the energy content is observed, whereas on approaching the flat wall (
 $x_{2}^{+}\approx 190$
), the energy content is increased in comparison with the distribution at the channel centreline. This is in agreement with conclusions that emerge from the anisotropy-invariant mapping shown in figure 20 and from the analysis involving (1.2) and (1.3) by exploring the concept of statistical axisymmetry.
$x_{2}^{+}\approx 190$
), the energy content is increased in comparison with the distribution at the channel centreline. This is in agreement with conclusions that emerge from the anisotropy-invariant mapping shown in figure 20 and from the analysis involving (1.2) and (1.3) by exploring the concept of statistical axisymmetry.
Figure 21. Turbulence spectra in a groove-modified channel: note the substantial difference in the behaviour near the grooved surface (
 $x_{2}^{+}\approx 12$
) in comparison with the flat surface (
$x_{2}^{+}\approx 12$
) in comparison with the flat surface (
 $x_{2}^{+}\approx 190$
).
$x_{2}^{+}\approx 190$
).
6 Turbulent drag reduction in grooved channel flow
During the course of the present investigations, results from numerical simulations revealed that drag reduction accomplishments depend strongly on the flow conditions and the groove geometry but weakly on the grid layout, resolution and domain extent in the streamwise and spanwise directions. For all simulation runs performed with the grooved surface morphology shown in figures 3 and 13, the drag reduction effect was achieved but with wide variations in magnitude.
For highly disturbed inlet conditions used to initialize simulations, the flow conditions change substantially with increase in Reynolds number. The influence of Reynolds number is important but its clarification is very demanding owing to the computation costs resulting from the increase of resolution and the efforts required to establish scaling laws for the surface geometry. For these reasons, investigations in this direction will be delayed until a fully optimized groove geometry is established.
From the computational results, it appears that sharp grooves with a large depth to width ratio ensure laminar flow in the groove by inducing high anisotropy in the valley region. The open question is therefore associated with the shape of the interspacing region separating the neighbouring grooves and periodicity between the grooves, which must be arranged in such a way as to achieve the full extent of axisymmetry over the entire surface.
6.1 Channel layout
To demonstrate the influence of flow conditions on viscous drag reduction, we present a set of the results obtained from simulation of the symmetric channel configuration with grooves placed along both channel walls as shown in figure 22. The initial conditions, groove dimensions, periodicity and grid layout were same as for the simulations performed for the groove-modified channel shown in figures 13 and 15. Compared with the reference flat channel of height
 $H$
, grooves at both channel walls increased the cross-sectional area by 0.66 %.
$H$
, grooves at both channel walls increased the cross-sectional area by 0.66 %.
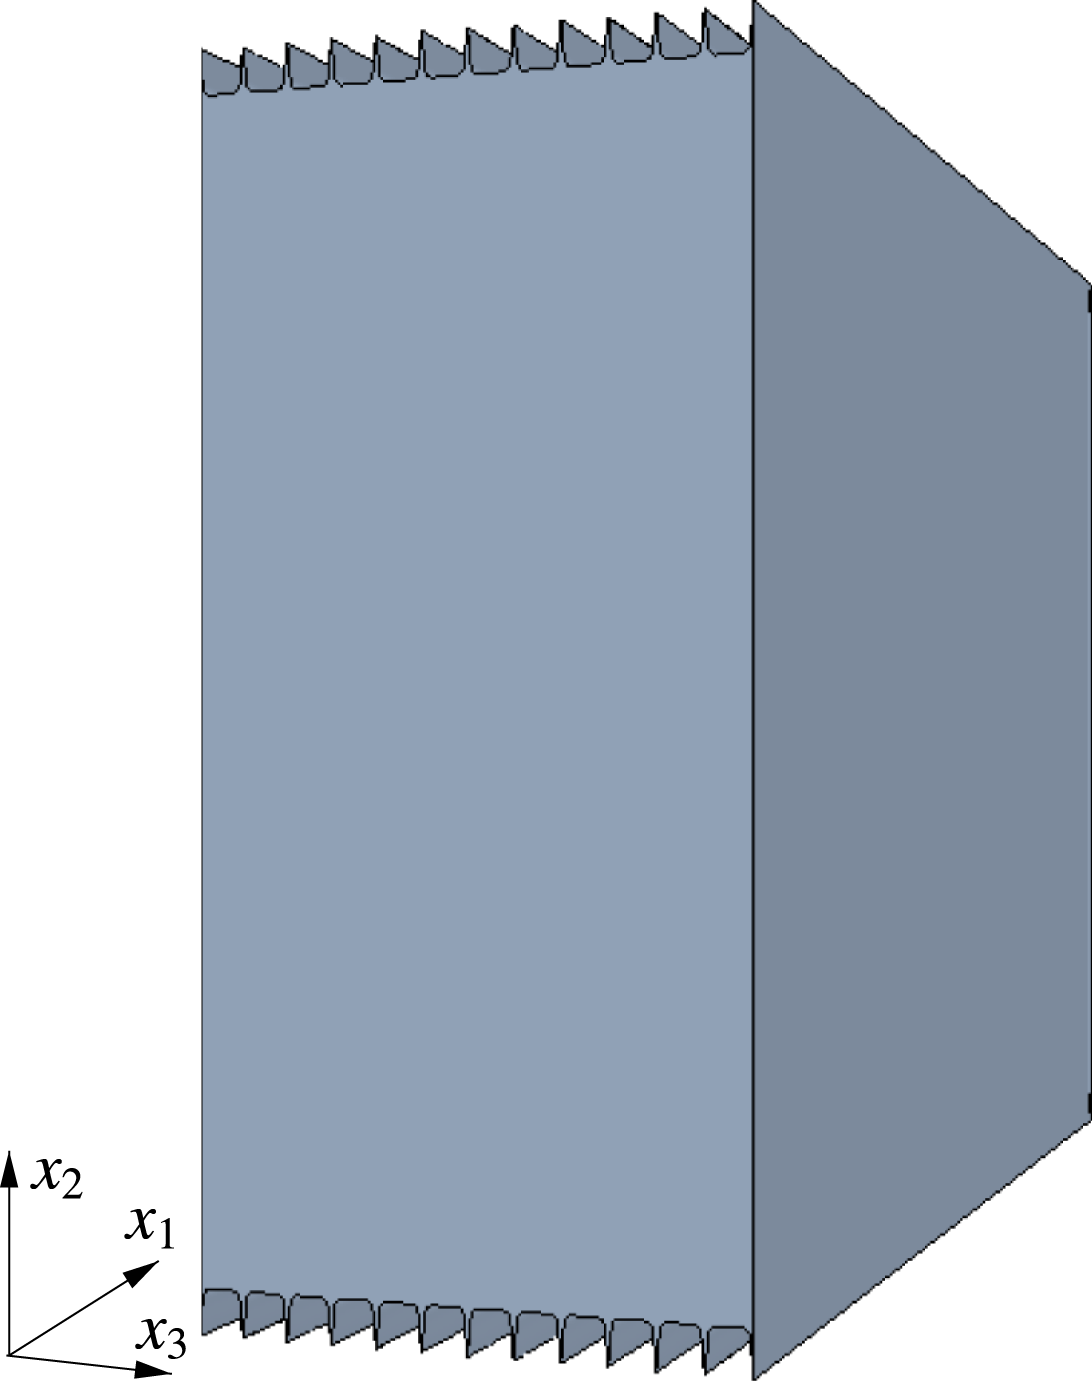
Figure 22. Layout of the grooved channel.
6.2 Turbulent drag reduction effect
Figure 23 shows the history of friction forces acting on the channel walls. In light of the results obtained with the groove-modified channel, shown in figure 18, these look surprising. There is no evidence of a transition delay caused by grooves. Instead of laminar flow development, turbulence starts from the beginning of the simulation.
Evaluation of the non-dimensional mean friction force
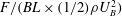 $F/(BL\times (1/2)\unicode[STIX]{x1D70C}U_{B}^{2})$
acting on the channel walls yields a value of
$F/(BL\times (1/2)\unicode[STIX]{x1D70C}U_{B}^{2})$
acting on the channel walls yields a value of
 $7.47\times 10^{-3}$
in comparison with that determined in the flat channel of
$7.47\times 10^{-3}$
in comparison with that determined in the flat channel of
 $8.17\times 10^{-3}$
, suggesting a drag reduction of
$8.17\times 10^{-3}$
, suggesting a drag reduction of
 $DR\approx 8.5\,\%$
. This is twice the value obtained for the channel with riblets at comparable
$DR\approx 8.5\,\%$
. This is twice the value obtained for the channel with riblets at comparable
 $Re_{m}$
reported in § 4.2.
$Re_{m}$
reported in § 4.2.
To clarify the absence of a transition delay and the origin of turbulent drag reduction, further analysis followed, exploring the considerations of § 2.
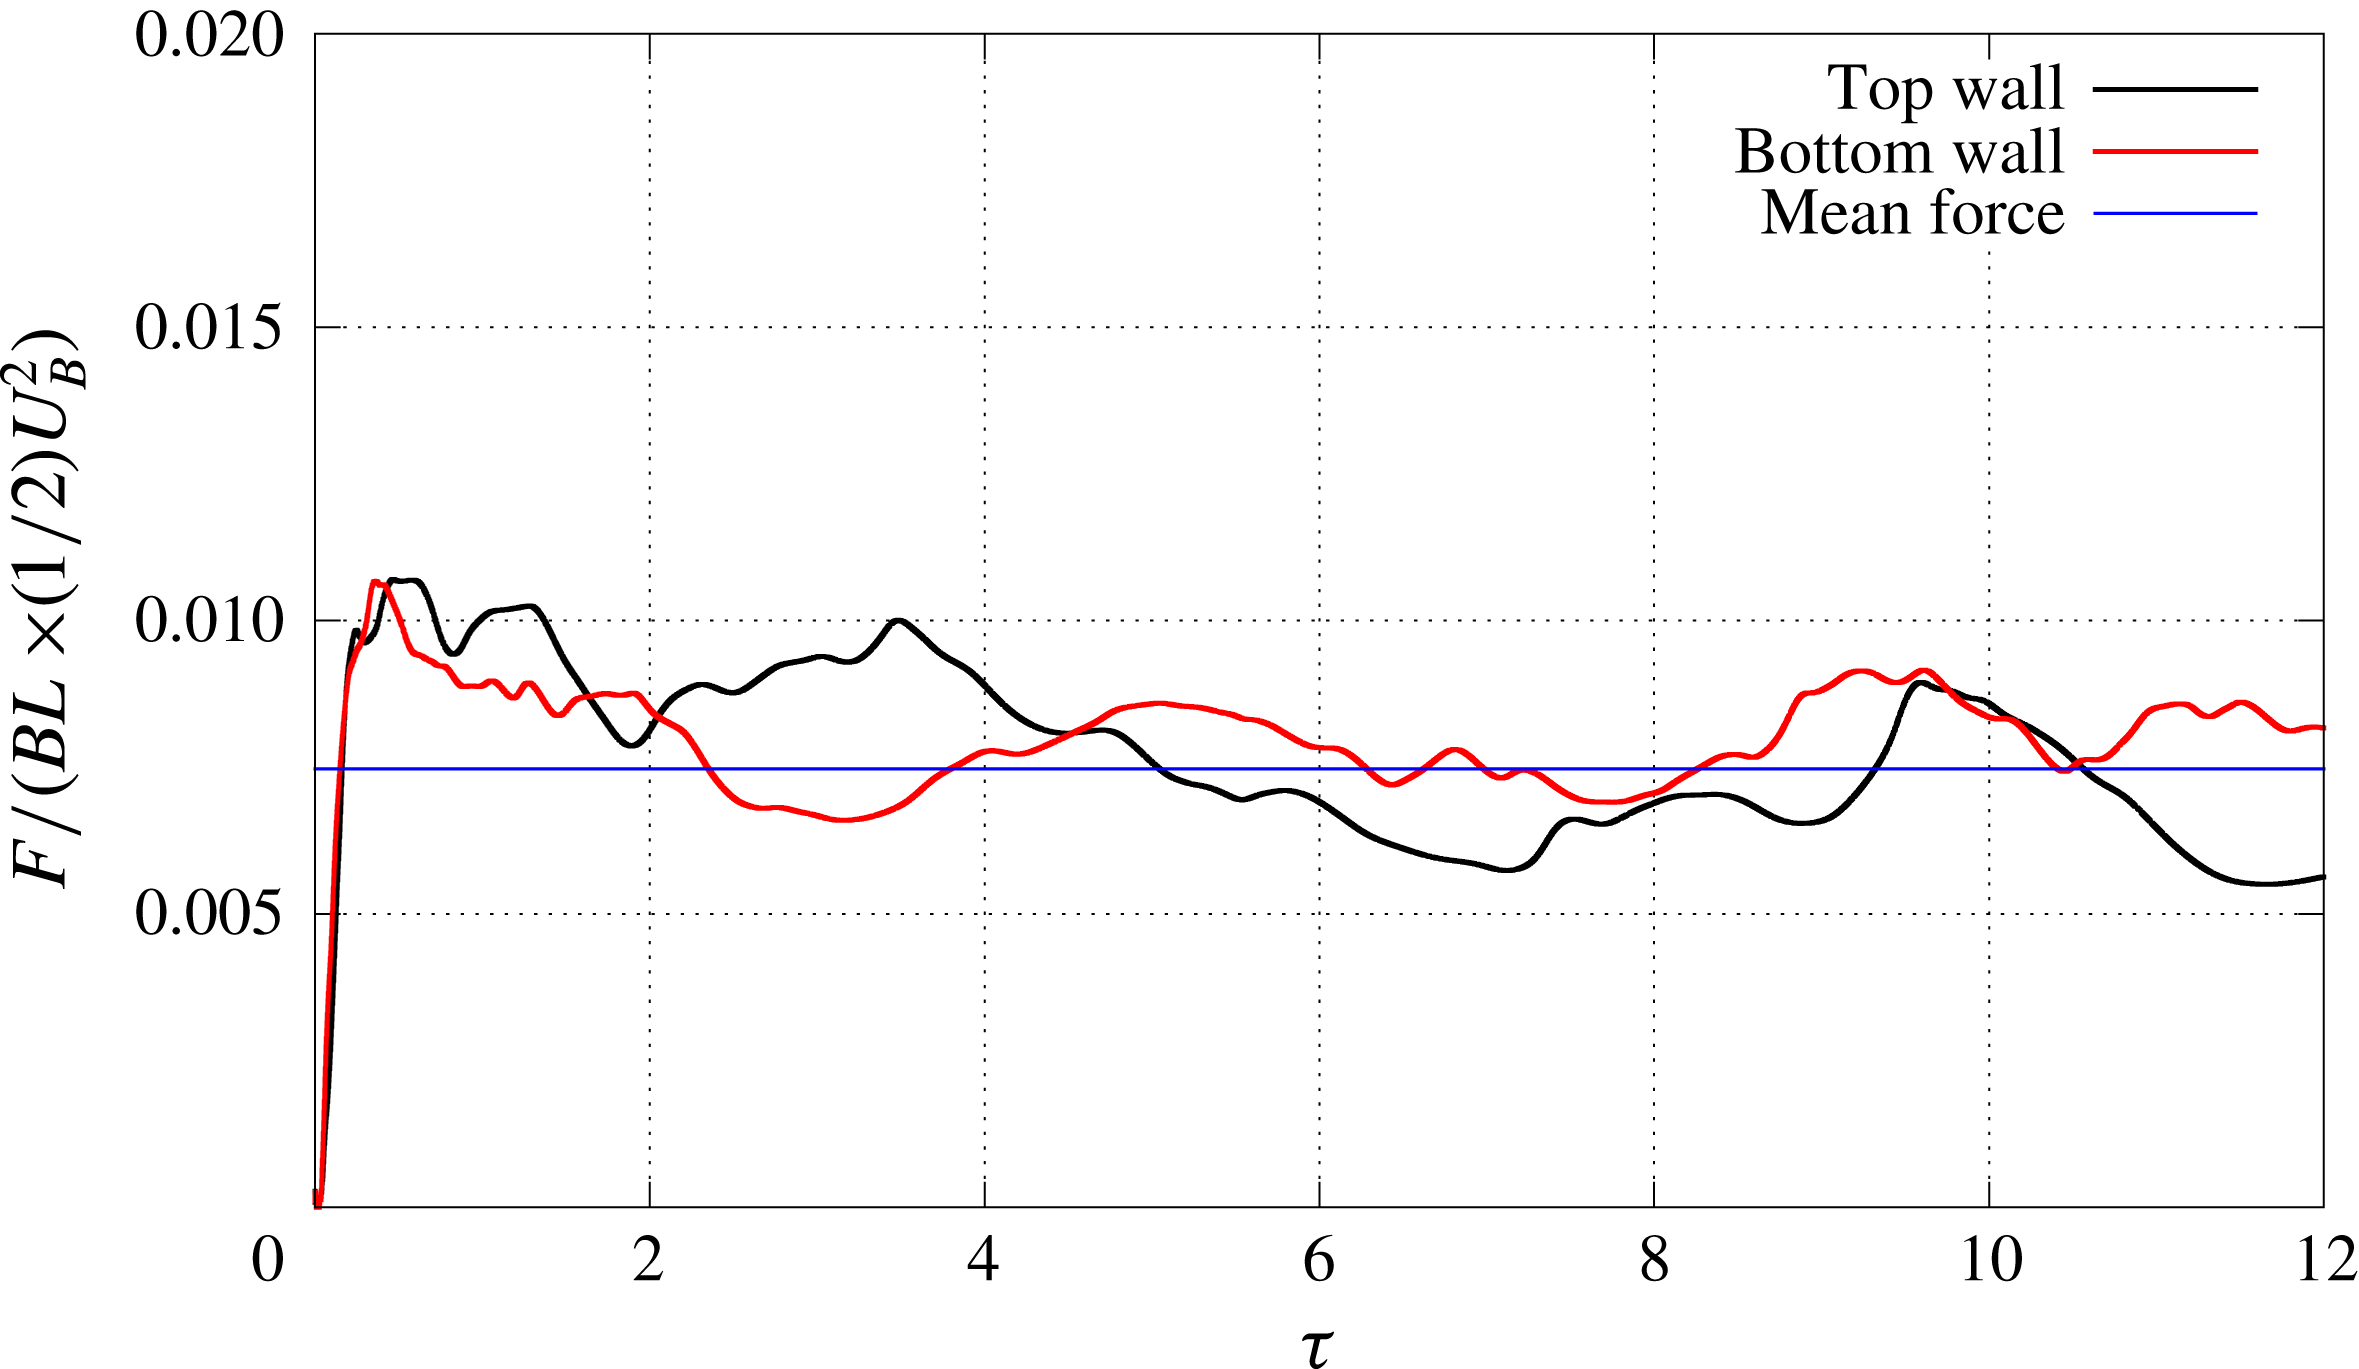
Figure 23. Normalized friction force in channel flow with grooved walls as a function of turnover time scale of turbulence. Normalization of force (
 $F$
) is performed with the surface area (
$F$
) is performed with the surface area (
 $BL$
) of the flat channel and dynamic pressure (
$BL$
) of the flat channel and dynamic pressure (
 $(1/2)\times \unicode[STIX]{x1D70C}U_{B}^{2}$
).
$(1/2)\times \unicode[STIX]{x1D70C}U_{B}^{2}$
).
6.3 Turbulent stresses
Distributions of the turbulent stresses
 $\overline{u_{i}u_{j}}$
, determined by averaging simulation fields over the entire surface, are plotted in figure 24 against the results for the flat channel. The data reveal no appearance of turbulence in the groove valley and reduction of stresses across the entire channel. In comparison with the stress behaviour in the flat channel, there is a tendency in
$\overline{u_{i}u_{j}}$
, determined by averaging simulation fields over the entire surface, are plotted in figure 24 against the results for the flat channel. The data reveal no appearance of turbulence in the groove valley and reduction of stresses across the entire channel. In comparison with the stress behaviour in the flat channel, there is a tendency in
 $\overline{u_{i}u_{j}}$
towards axisymmetry, owing to the reduced difference between normal (
$\overline{u_{i}u_{j}}$
towards axisymmetry, owing to the reduced difference between normal (
 $\overline{u_{2}u_{2}}$
) and spanwise (
$\overline{u_{2}u_{2}}$
) and spanwise (
 $\overline{u_{3}u_{3}}$
) stresses, followed by a decrease in the turbulent shear stress (
$\overline{u_{3}u_{3}}$
) stresses, followed by a decrease in the turbulent shear stress (
 $\overline{u_{1}u_{2}}$
).
$\overline{u_{1}u_{2}}$
).
Trends in the computed results logically follow conclusions from considerations in §§ 1 and 2. However, the results cannot explain the absence of expected laminarity achieved in a groove-modified channel as demonstrated in § 5.
Figure 24. Comparisons of
 $\overline{u_{i}u_{j}}$
in flat and grooved channels show suppression of the velocity fluctuations by grooved walls without any evidence of turbulence inside grooves.
$\overline{u_{i}u_{j}}$
in flat and grooved channels show suppression of the velocity fluctuations by grooved walls without any evidence of turbulence inside grooves.
6.4 Anisotropy-invariant mapping
To provide a closer look into the origin of turbulence development in grooved channels, trajectories across the anisotropy-invariant map were evaluated over cross-sections corresponding to valley and crest regions of the grooved surface, as shown in figure 25.
The trajectory corresponding to the valley region (figure 25
a) clearly supports axisymmetry in
 $\overline{u_{i}u_{j}}$
with a one-component state at the wall. This is in general agreement with the data shown in figure 24, displaying no evidence of turbulence inside the groove valley.
$\overline{u_{i}u_{j}}$
with a one-component state at the wall. This is in general agreement with the data shown in figure 24, displaying no evidence of turbulence inside the groove valley.
Across the interspacing between the grooves, the trajectory in the invariant map (figure 25
b) shows deviations from the axisymmetric state and a tendency for turbulence in the viscous sublayer to follow the two-component state. Such a development is associated with an increase in
 $\unicode[STIX]{x1D716}_{wall}$
, amplification of fluctuations near the wall and consequently promotion of turbulence.
$\unicode[STIX]{x1D716}_{wall}$
, amplification of fluctuations near the wall and consequently promotion of turbulence.
The presented results suggest that the contour of interspacing and the period between the neighbouring grooves have to be optimized to achieve axisymmetry prevailing over the entire surface to prevent turbulence development and attain the maximum drag reduction effect.
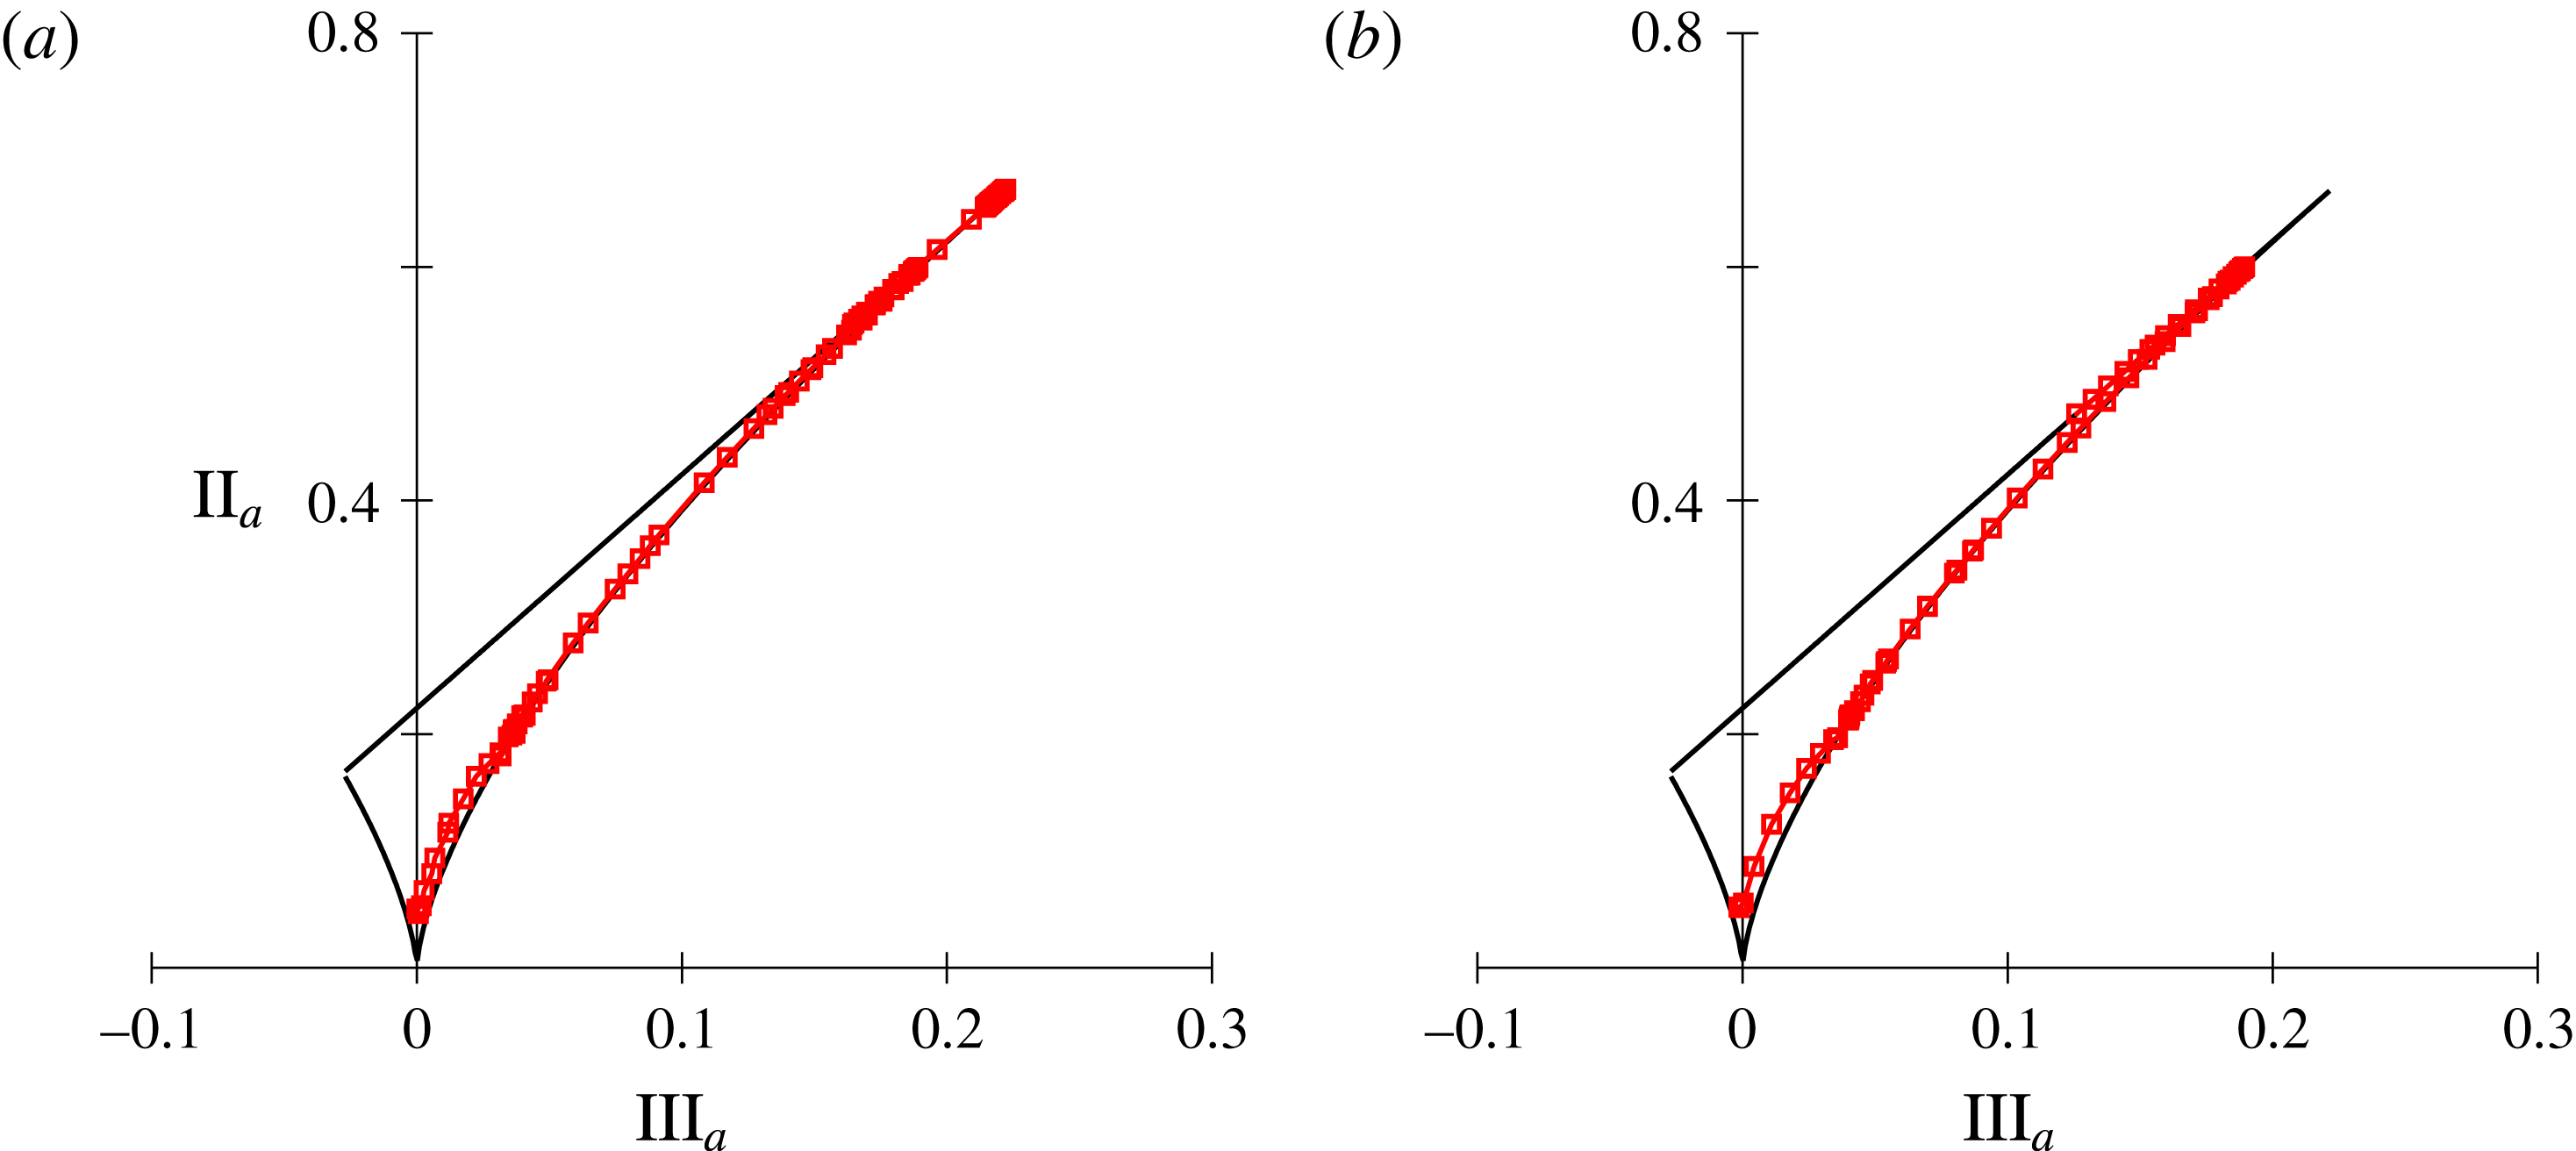
Figure 25. Anisotropy-invariant mapping of turbulence in a grooved channel: across valley (a) and crest (b) regions of the grooved surface.
6.5 Turbulence spectra
The turbulence spectra shown in figure 26, evaluated close to the groove surface (
 $x_{2}^{+}\approx 15$
) and at the channel centreline (
$x_{2}^{+}\approx 15$
) and at the channel centreline (
 $x_{2}^{+}\approx 160$
), are essentially the same as for the flat channel presented in figure 8. There is no sign of reduced spectral transfer to suggest modification of turbulence and the drag reduction effect. This behaviour might be due to the low Reynolds number in the present simulations and the relatively small spectral separation between large- and small-scale motions not allowing the turbulence spectrum to attain the fully developed form with the region that correlates with
$x_{2}^{+}\approx 160$
), are essentially the same as for the flat channel presented in figure 8. There is no sign of reduced spectral transfer to suggest modification of turbulence and the drag reduction effect. This behaviour might be due to the low Reynolds number in the present simulations and the relatively small spectral separation between large- and small-scale motions not allowing the turbulence spectrum to attain the fully developed form with the region that correlates with
 $\unicode[STIX]{x1D716}$
.
$\unicode[STIX]{x1D716}$
.
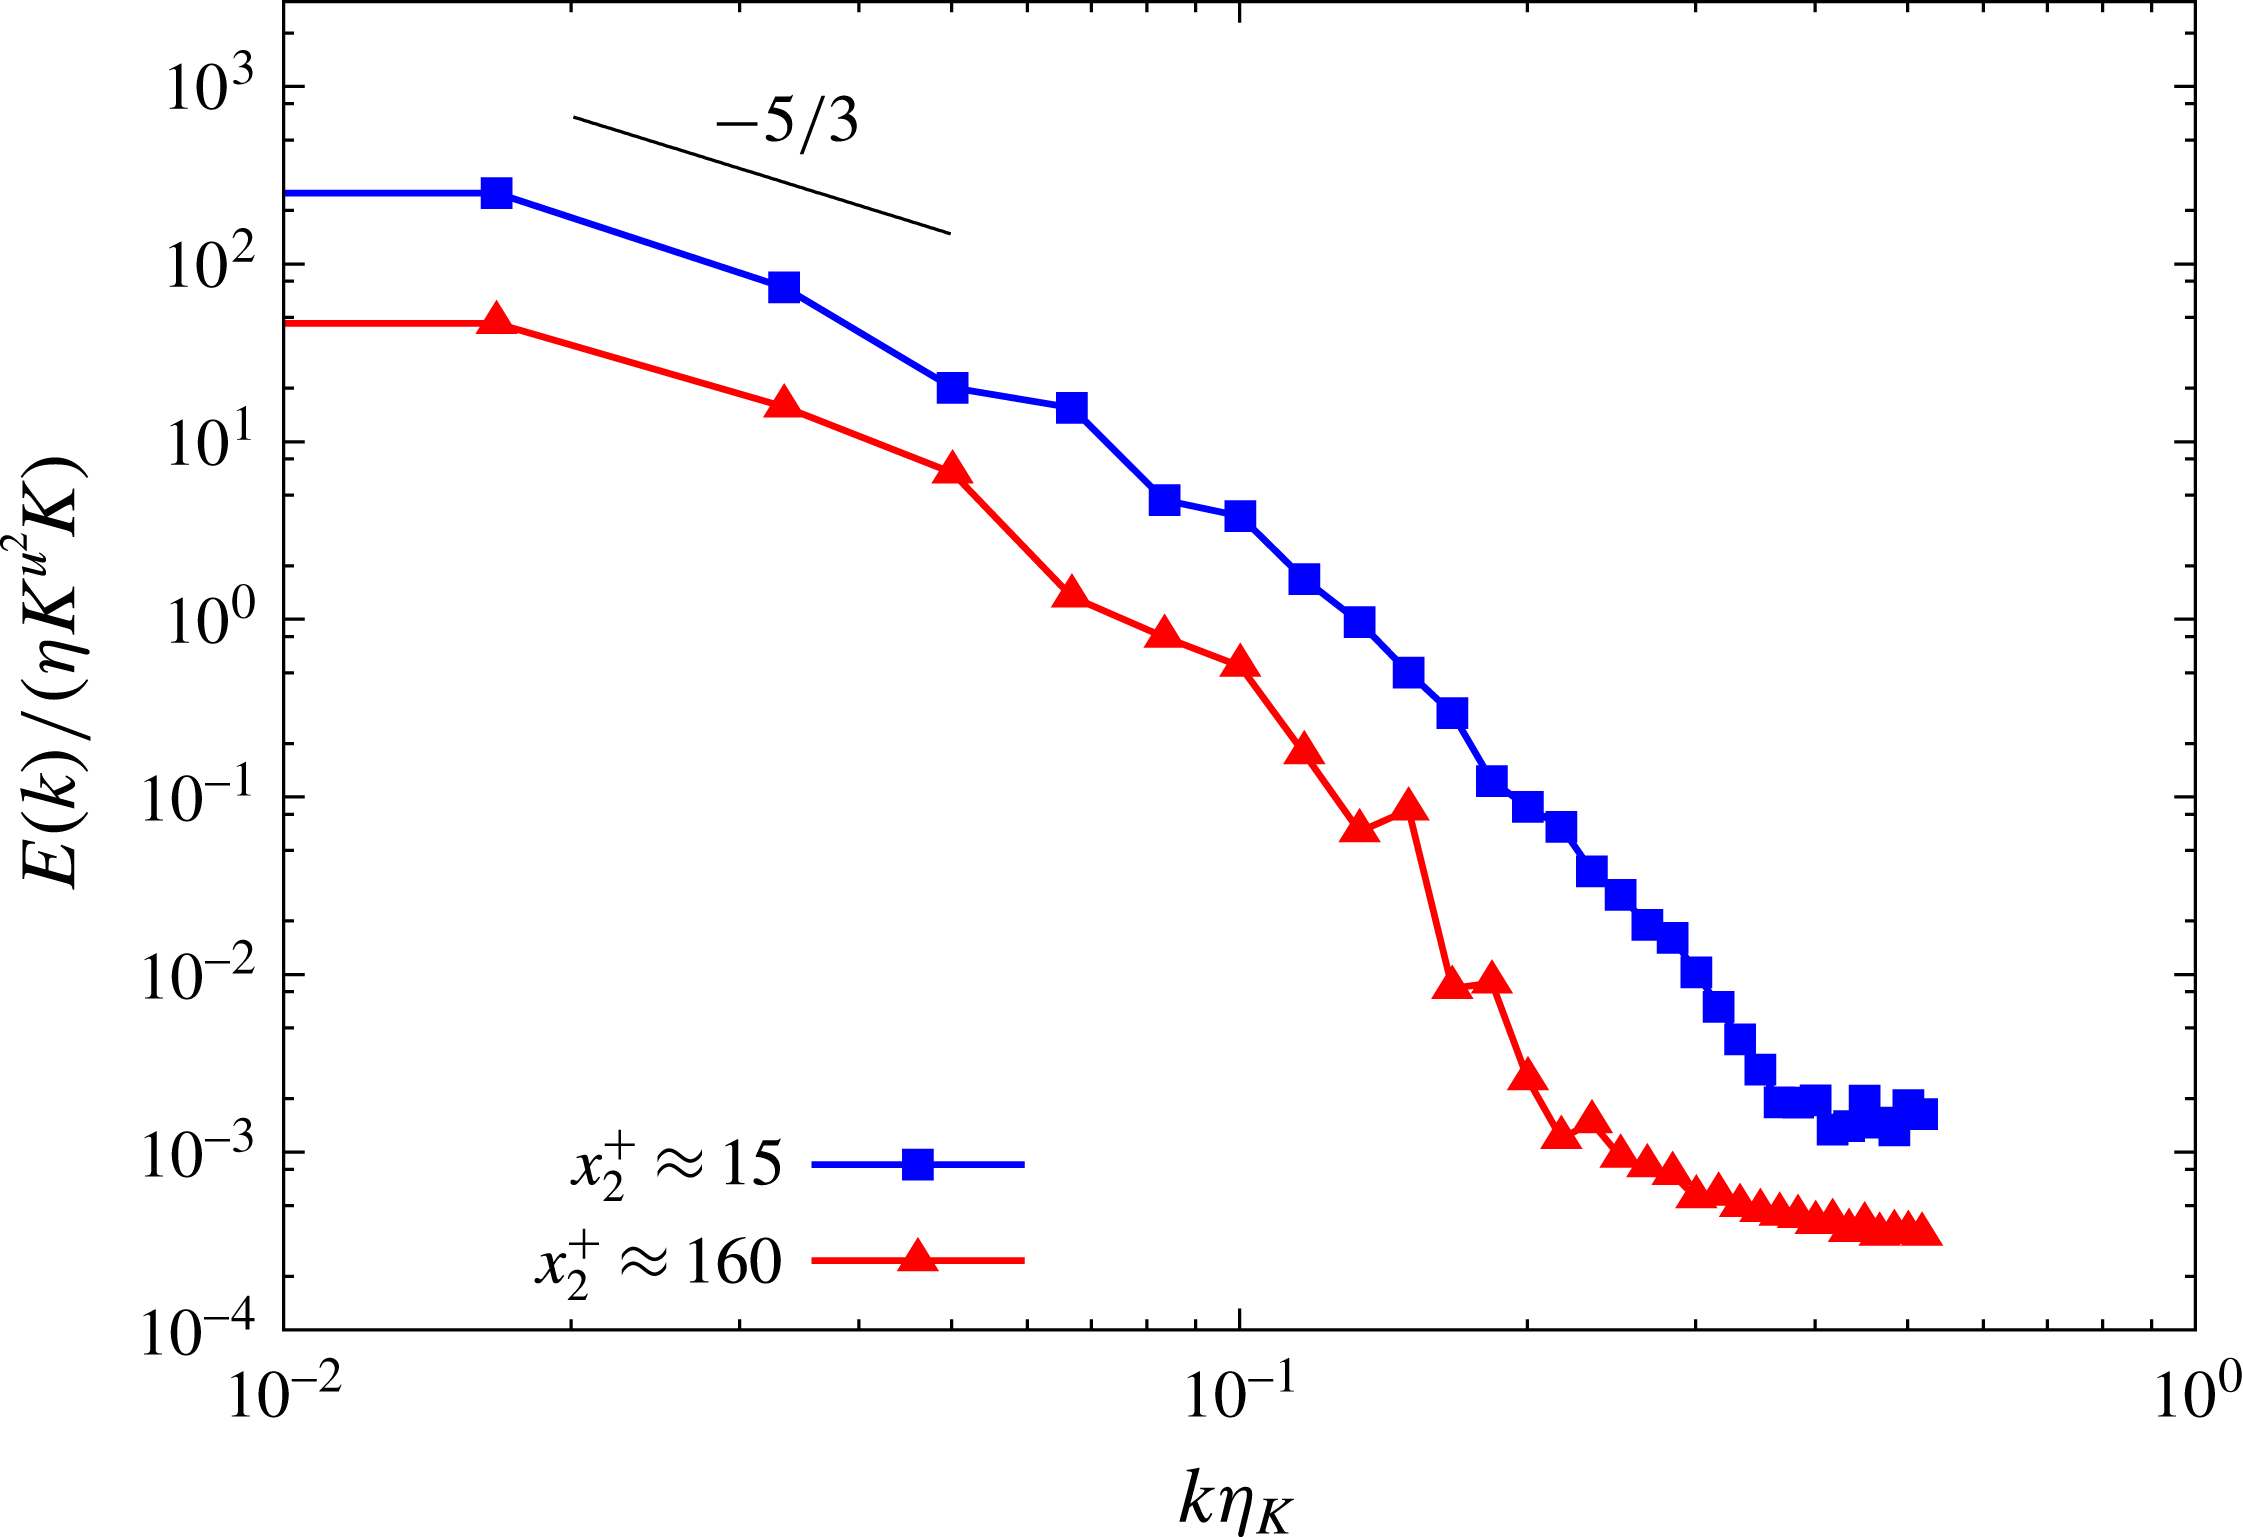
Figure 26. Turbulence spectra in a grooved channel: the behaviour of the spectra near the grooved surface (
 $x_{2}^{+}\approx 15$
) is almost same as for the flat channel shown in figure 8(b).
$x_{2}^{+}\approx 15$
) is almost same as for the flat channel shown in figure 8(b).
7 Experiments on drag reduction in a groove-modified channel flow
To support numerical investigations experiments, were undertaken in flat and groove-modified channel configurations for highly tripped flow conditions at the channel inlet to demonstrate features of turbulent drag reduction produced by surface-embedded grooves at low Reynolds numbers. Supplementary measurements were made to study the stabilizing effect produced by the grooved surface on the laminar boundary layer developing naturally along the test section of a two-dimensional channel. The stabilization is assumed to be due to the ability of a grooved surface pattern to suppress the velocity fluctuations in the spanwise direction, on a restricted portion of the wetted surface, which prevents vorticity development at the wall and consequently across the entire flow field.
7.1 Experimental facility and measuring procedure
The two-dimensional channel and the measuring instrumentation that were used in the present experiments were same to those employed in the previous investigations of flow control near-wall turbulence, as described by Frohnapfel et al. (Reference Frohnapfel, Jovanović and Delgado2007b
) and Jovanović et al. (Reference Jovanović, Frohnapfel, Srikantharajah, Jovanović, Lienhart and Delgado2011). The air flow was produced with a facility constructed according to DIN 24 163 requirements. The facility, shown in figure 27, consists of a large circular housing 2.2 m in diameter and 7 m in length equipped with a centrifugal fan and a speed-controlled d.c. motor unit, a set of five Venturi nozzles produced according to DIN 1952 for determination of the volume flow rate, an assembly of honeycomb and screens to improve flow homogeneity and reduce the level of turbulence, followed by an outlet module that allows connection of the chamber housing to the experimental test section. This facility provides well-controlled flow rates, good flow uniformity and a satisfactory turbulence level of approximately
 $Tu=0.3\,\%$
at the entrance of the experimental test section. The channel was equipped with a two-dimensional nozzle having a contraction ratio of
$Tu=0.3\,\%$
at the entrance of the experimental test section. The channel was equipped with a two-dimensional nozzle having a contraction ratio of
 $8\,:\,1$
, which was flush mounted with the channel top and bottom walls. The set-up thus provided natural development of boundary layers along the test section walls. For investigation of turbulent drag reduction, a tripping device was mounted at the channel inlet to ensure a fully developed turbulent state above the critical Reynolds number of
$8\,:\,1$
, which was flush mounted with the channel top and bottom walls. The set-up thus provided natural development of boundary layers along the test section walls. For investigation of turbulent drag reduction, a tripping device was mounted at the channel inlet to ensure a fully developed turbulent state above the critical Reynolds number of
 $Re_{m}\approx 2100$
.
$Re_{m}\approx 2100$
.
Figure 27. Experimental facility at the Lehrstuhl für Strömungsmechanik for study of viscous drag reduction by surface embedded grooves.
To quantify the drag reduction effect of a structured surface which is expected to produce a decrease in pressure loss, measurements of pressure differentials were made along the channel test section. A Scanivalve pressure scanner and a calibrated Höntzsch pressure transducer with a combined range of 0–1 kPa were used for this purpose with a resolution of
 $0.1\,\%$
full scale. The pressure signals were averaged over a period of
$0.1\,\%$
full scale. The pressure signals were averaged over a period of
 $300~\text{s}$
, which was found to be sufficiently long to achieve good measuring accuracy at all Reynolds numbers.
$300~\text{s}$
, which was found to be sufficiently long to achieve good measuring accuracy at all Reynolds numbers.
7.2 The grooved surface topology
The initial design of the drag-reducing surface pattern resulted from the requirement to minimize the turbulent dissipation rate
 $\unicode[STIX]{x1D716}$
by increasing the turbulence anisotropy (Jovanović & Hillerbrand Reference Jovanović and Hillerbrand2005). The promising pattern was sought in the form of square grooves with a flat interspacing region between them arranged periodically along the spanwise direction. The period between neighbouring grooves was fixed to a few groove depths assuming that such arrangement will induce a favourable interaction between the grooves and enforce axisymmetry over the entire wetted surface. For flow conditions corresponding to groove dimensions of a few viscous length scales, it is expected that the structured surface could modify near-wall turbulence by increasing anisotropy with a tendency for the turbulence stress tensor
$\unicode[STIX]{x1D716}$
by increasing the turbulence anisotropy (Jovanović & Hillerbrand Reference Jovanović and Hillerbrand2005). The promising pattern was sought in the form of square grooves with a flat interspacing region between them arranged periodically along the spanwise direction. The period between neighbouring grooves was fixed to a few groove depths assuming that such arrangement will induce a favourable interaction between the grooves and enforce axisymmetry over the entire wetted surface. For flow conditions corresponding to groove dimensions of a few viscous length scales, it is expected that the structured surface could modify near-wall turbulence by increasing anisotropy with a tendency for the turbulence stress tensor
 $\overline{u_{i}u_{j}}$
to approach the statistically axisymmetric state with the one-component limit at the wall resulting in a decrease of
$\overline{u_{i}u_{j}}$
to approach the statistically axisymmetric state with the one-component limit at the wall resulting in a decrease of
 $\unicode[STIX]{x1D716}$
and a reduction of the friction drag.
$\unicode[STIX]{x1D716}$
and a reduction of the friction drag.
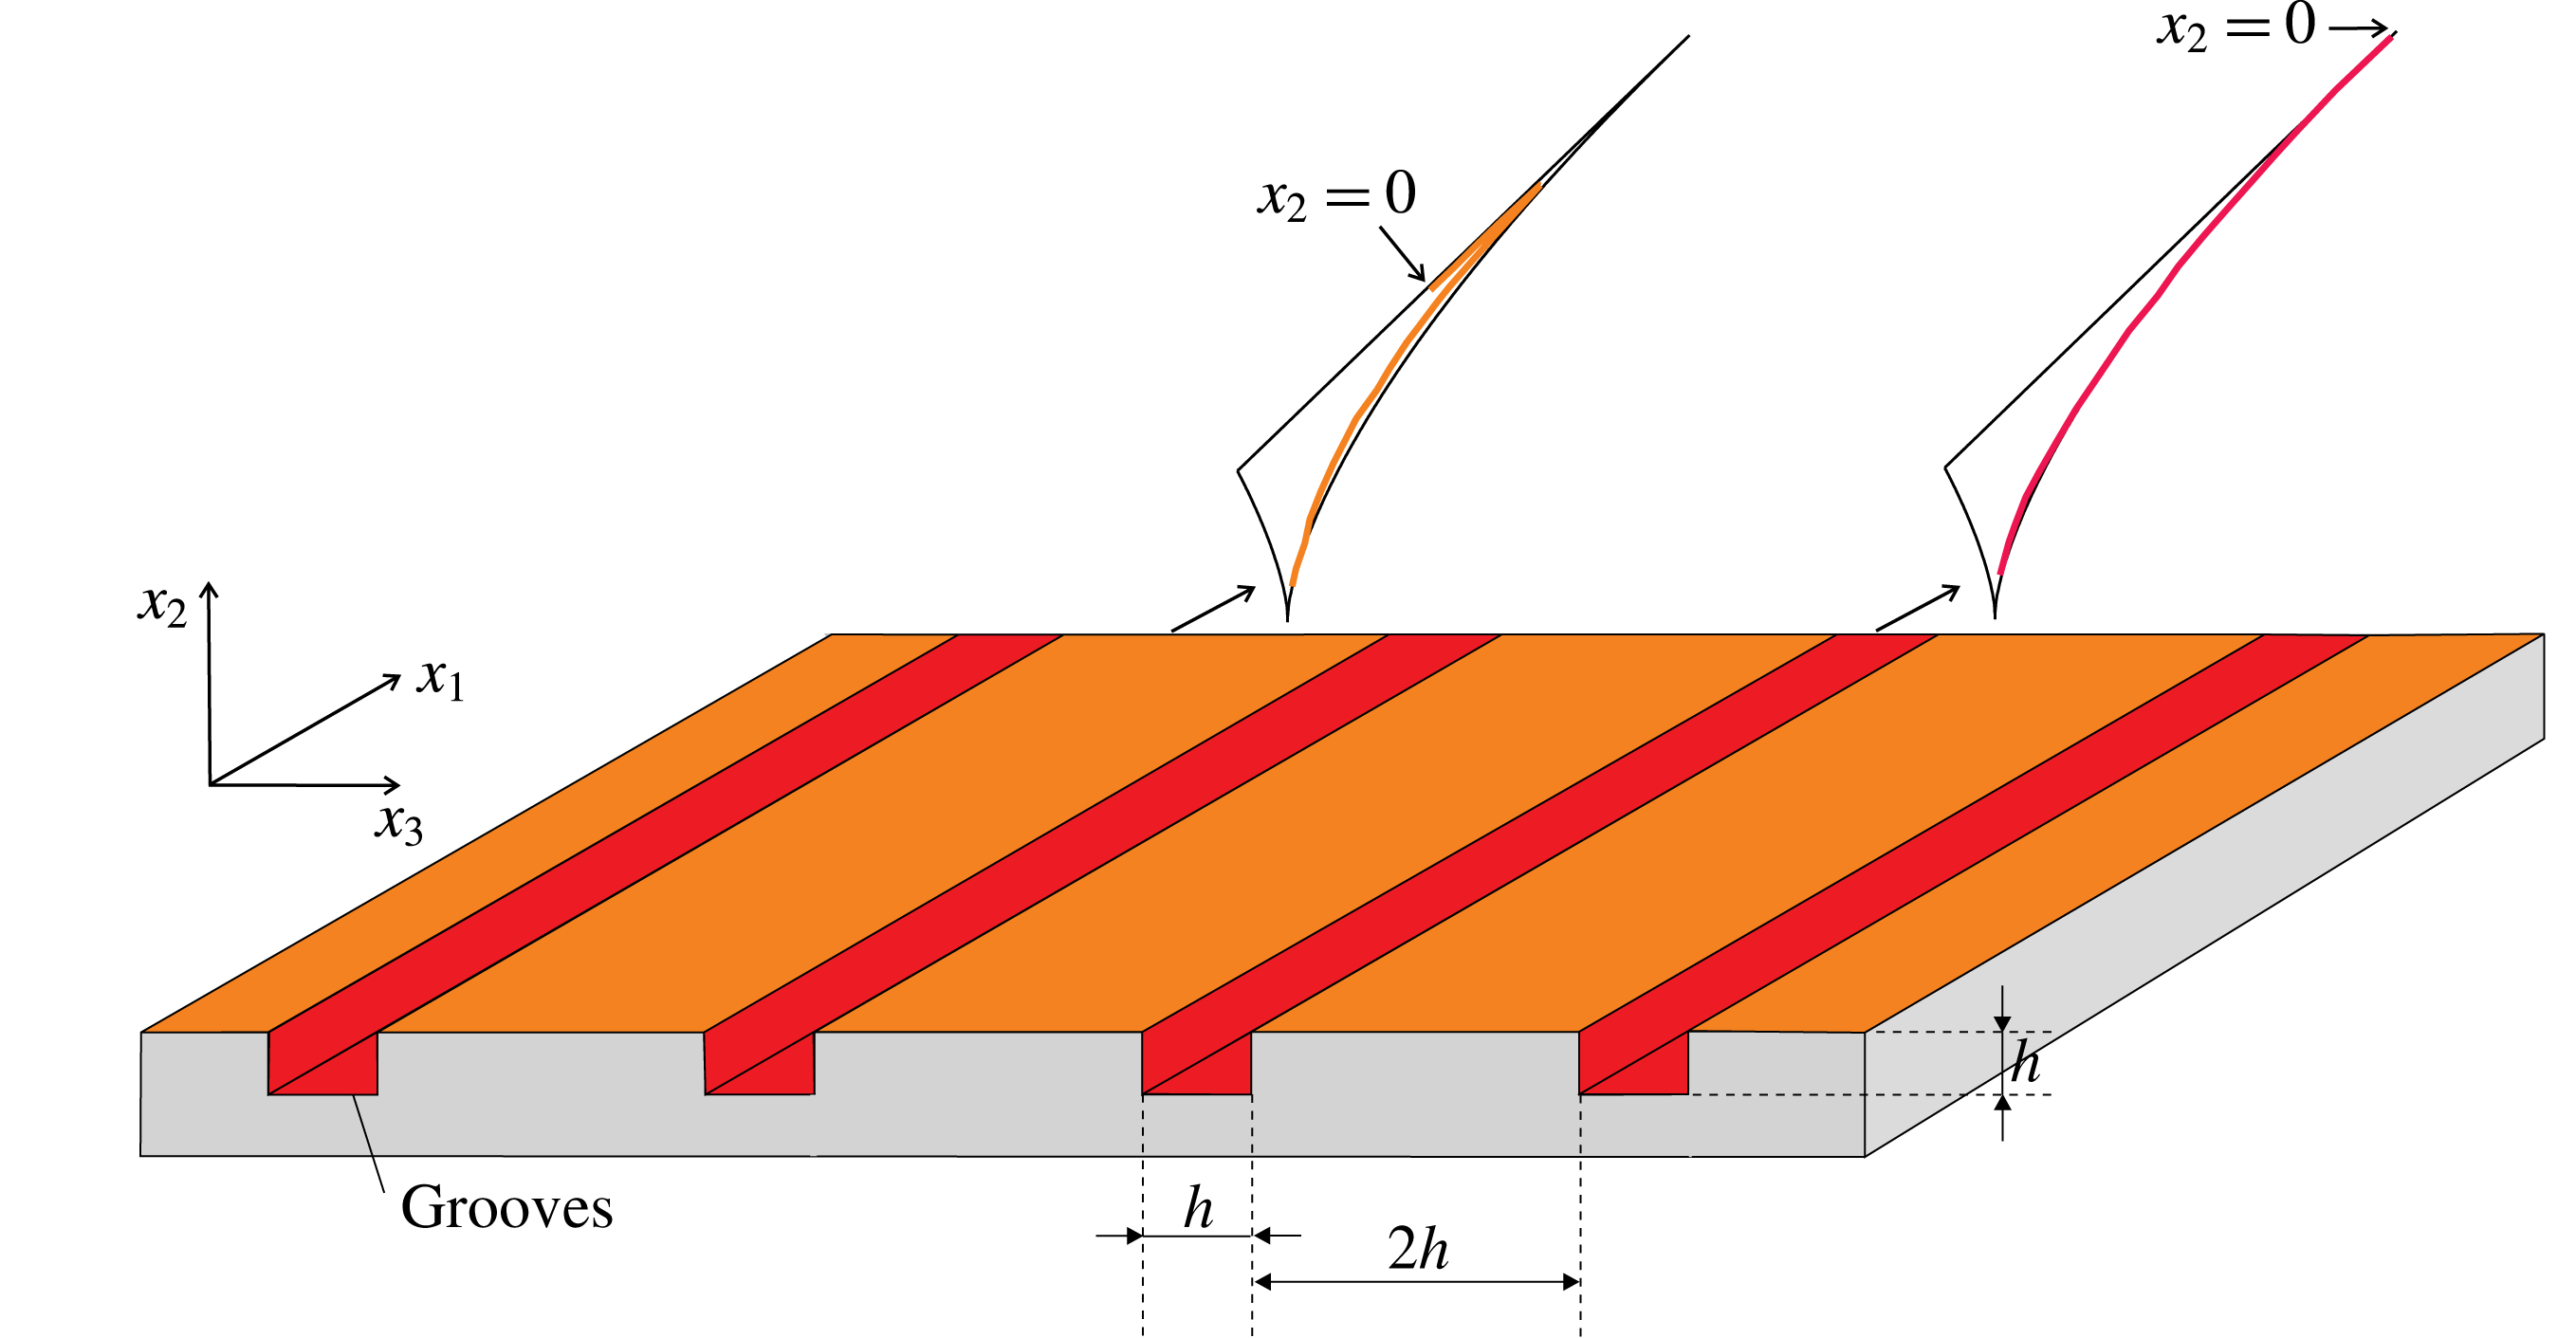
Figure 28. The initial groove geometry reproduced from the study by Frohnapfel et al. (Reference Frohnapfel, Jovanović and Delgado2007b ).
To test the potential of the grooved surface topology to produce the drag reduction effect, surface structures with groove dimensions
 $h=100$
and
$h=100$
and
 $150~\unicode[STIX]{x03BC}\text{m}$
and separation
$150~\unicode[STIX]{x03BC}\text{m}$
and separation
 $2h=200$
and
$2h=200$
and
 $300~\unicode[STIX]{x03BC}\text{m}$
were employed (see figure 28). The drag-reducing surfaces were produced from flat aluminium plates employing mechanical milling. Two surface samples were produced with groove dimensions of
$300~\unicode[STIX]{x03BC}\text{m}$
were employed (see figure 28). The drag-reducing surfaces were produced from flat aluminium plates employing mechanical milling. Two surface samples were produced with groove dimensions of
 $h=150~\unicode[STIX]{x03BC}\text{m}$
and one sample with
$h=150~\unicode[STIX]{x03BC}\text{m}$
and one sample with
 $h=100~\unicode[STIX]{x03BC}\text{m}$
. The resulting surface was rough and required polishing, using fine sand paper, and cleaning with compressed air and ethanol in order to remove remaining burrs from the surface. In comparison with the square groove shape of the milling cutter, the final surface finish consisted of grooves with a conical cross-sectional geometry as presented in figure 29.
$h=100~\unicode[STIX]{x03BC}\text{m}$
. The resulting surface was rough and required polishing, using fine sand paper, and cleaning with compressed air and ethanol in order to remove remaining burrs from the surface. In comparison with the square groove shape of the milling cutter, the final surface finish consisted of grooves with a conical cross-sectional geometry as presented in figure 29.
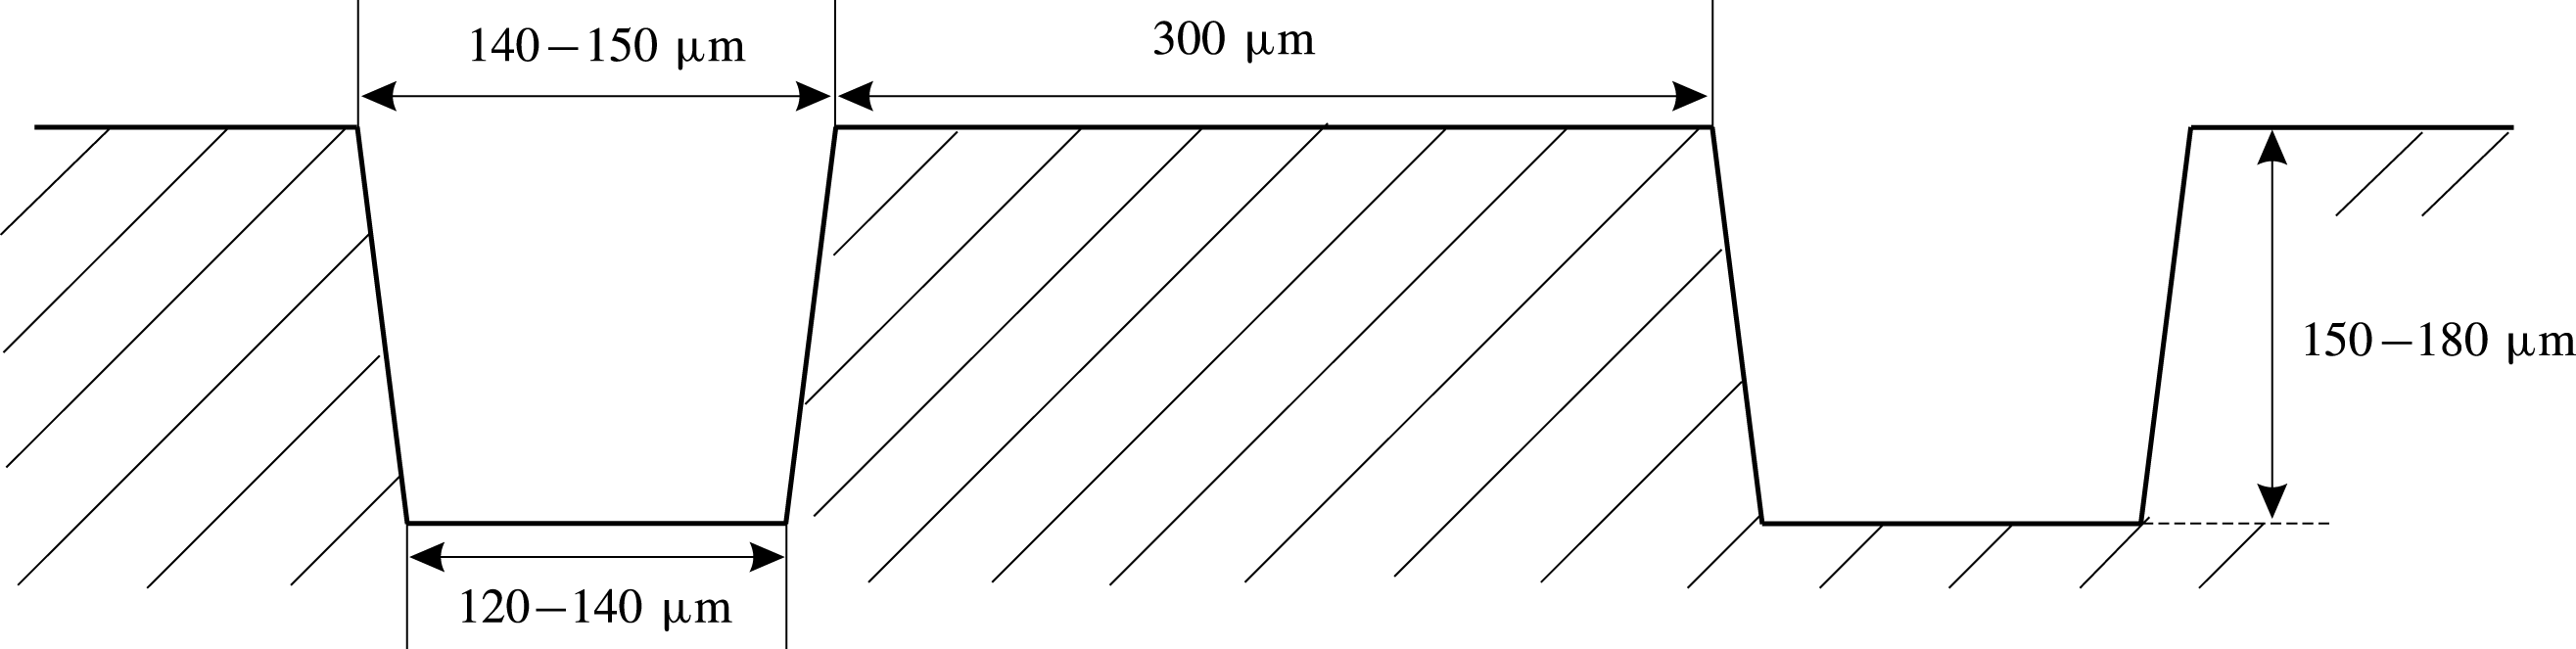
Figure 29. Dimensions of grooves after surface polishing (Frohnapfel et al. Reference Frohnapfel, Jovanović and Delgado2007b ).
7.3 Turbulent drag reduction at low Reynolds numbers
The experimental set-ups for investigations of turbulent drag reduction by a grooved surface are shown in figure 30. Measurements of the pressure distributions along the flat and groove-modified channel test sections were carried out to form the basis for quantitative estimation of the influence of grooves on skin-friction reduction for the Reynolds number range
 $Re_{m}=2.7\times 10^{3}{-}12\times 10^{3}$
.
$Re_{m}=2.7\times 10^{3}{-}12\times 10^{3}$
.
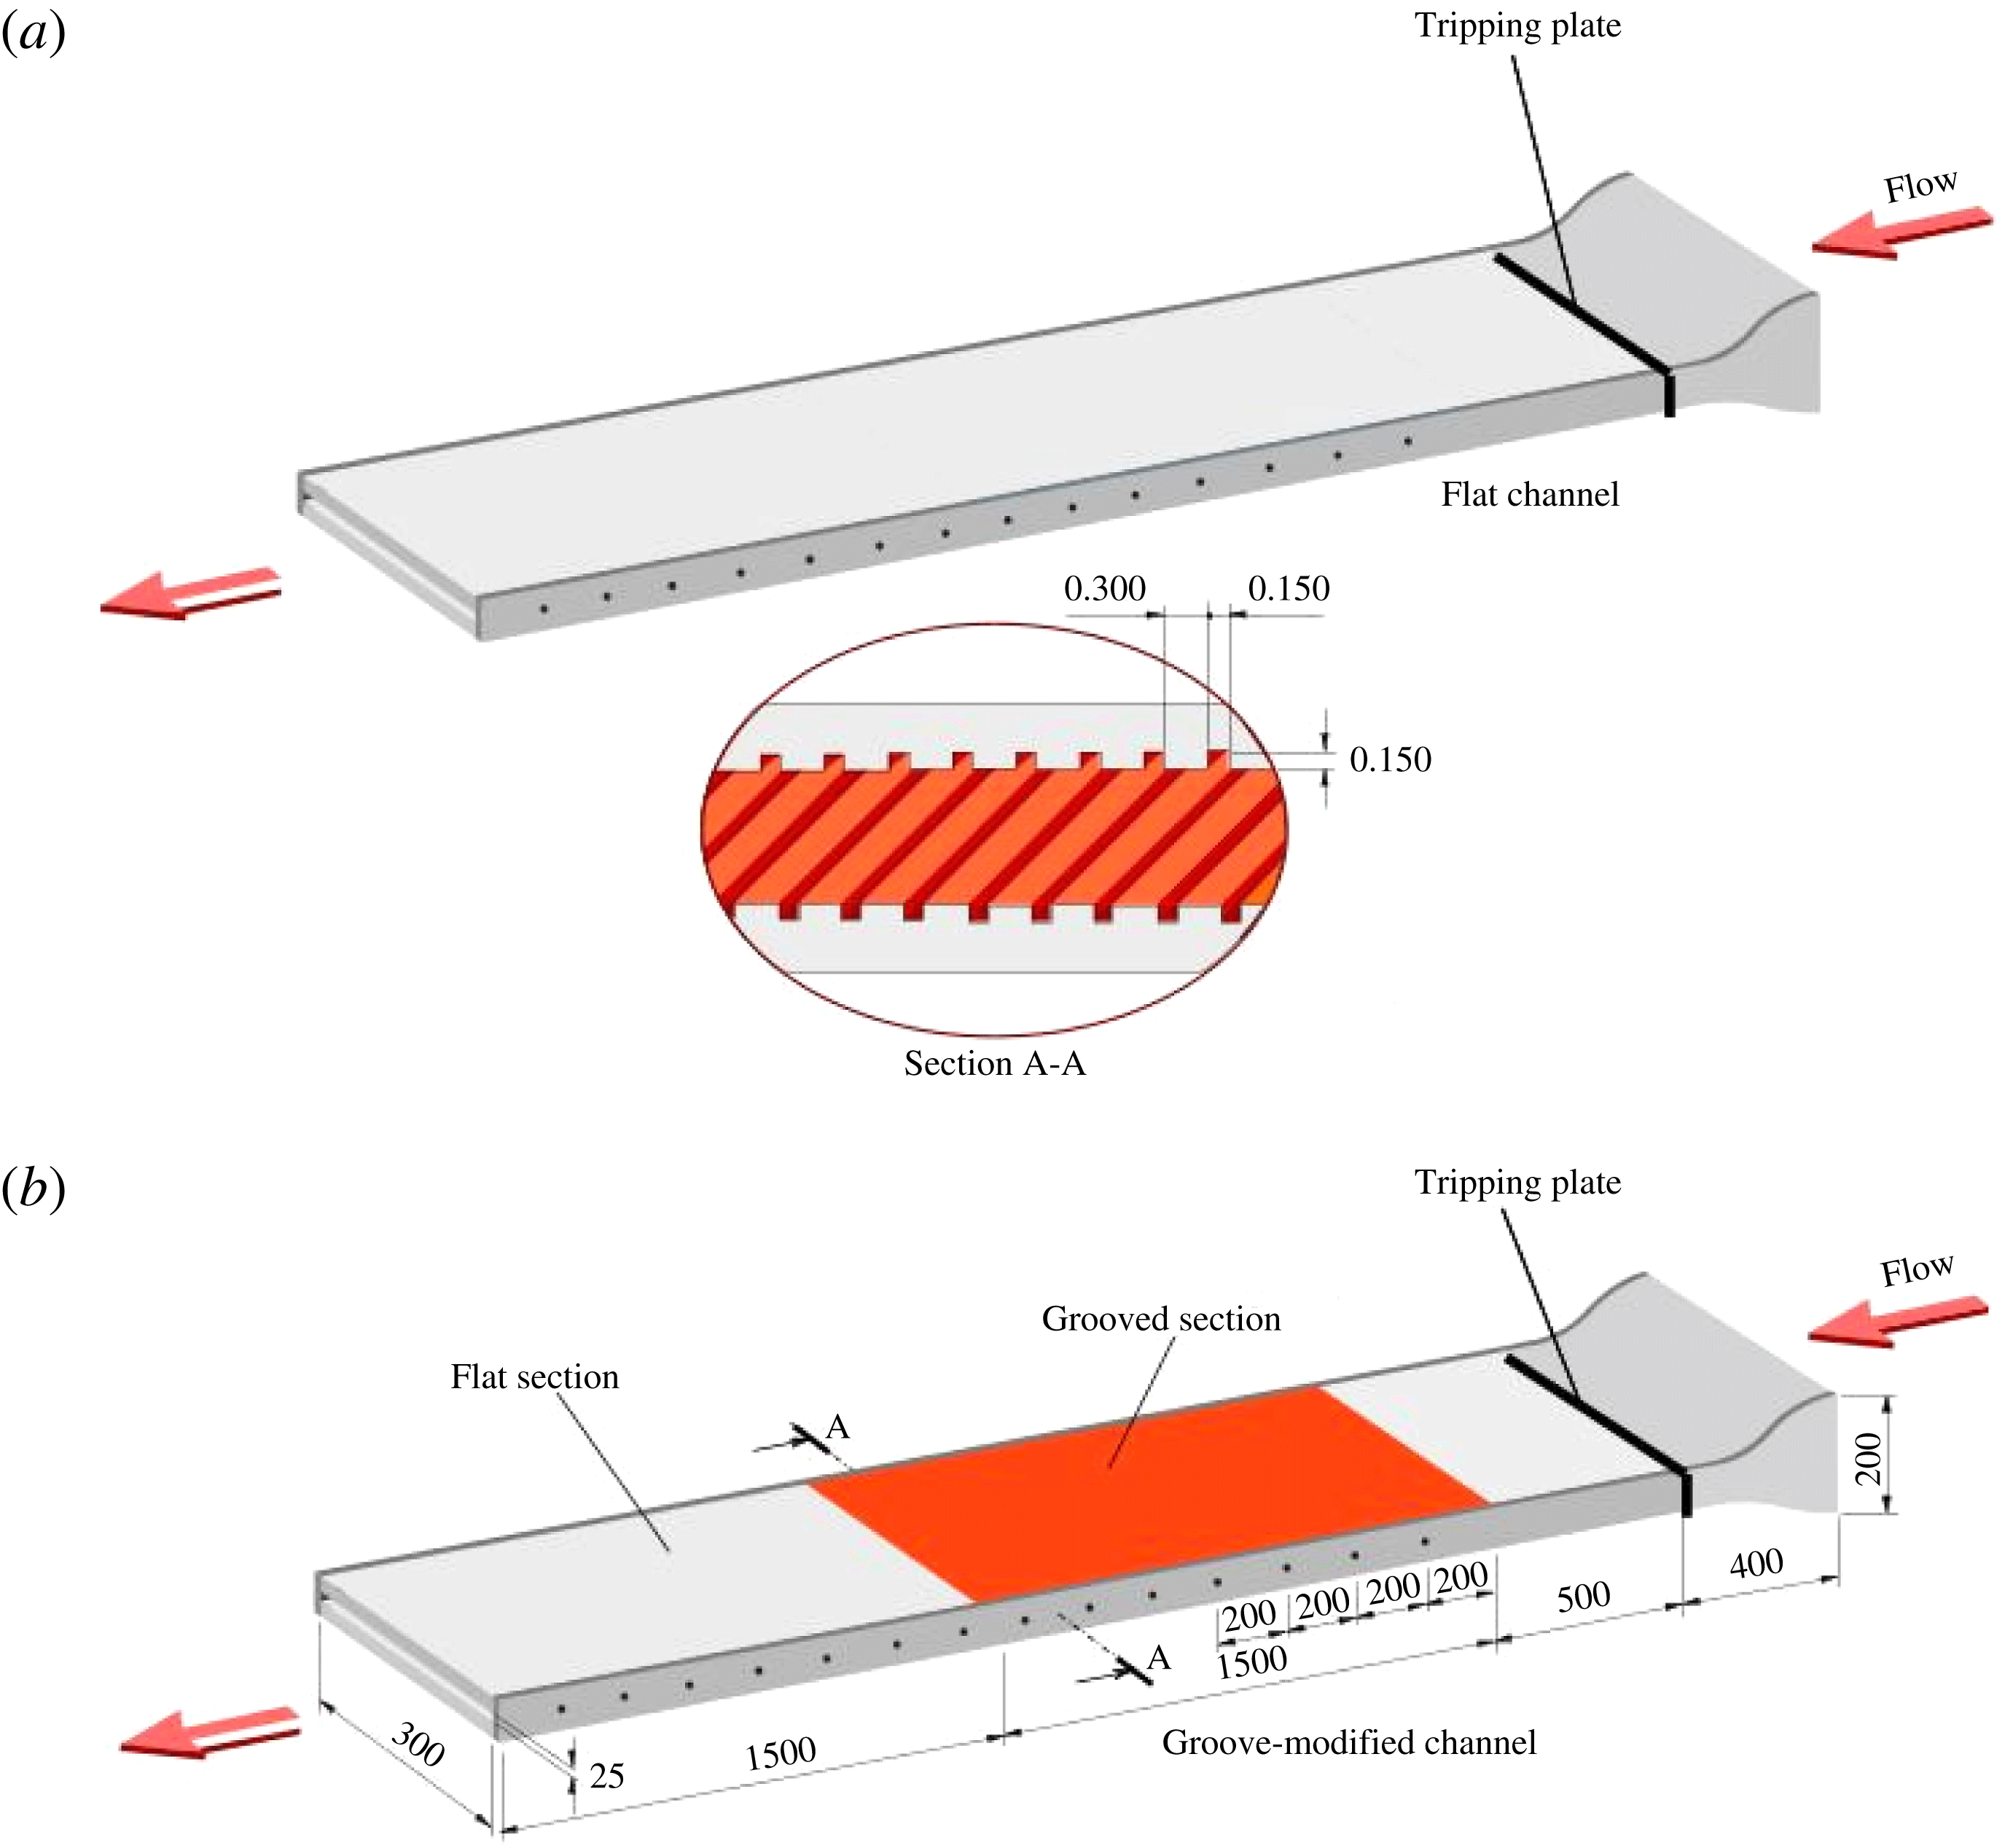
Figure 30. Two-dimensional channel flow with flat and groove-modified test section arrangements. (a) Reference test section configuration. (b) Configuration of the test section for determination of the turbulent drag reduction effect produced by the grooved surface installed at the top and bottom walls of the channel.
The flow at the channel inlet was tripped with sharp plates fixed permanently at the channel entrance in order to promote turbulence development right from the trip location (see Schlicthing Reference Schlichting1968, p. 511). The specially designed trip, produced by laser cutting of thin aluminium plates of prescribed height with respect to the test section wall, was adjusted to yield a blockage ratio, defined as the ratio between the trip and test section areas, larger than 10 %. Such a blockage was found by Fischer (Reference Fischer2000) to ensure a fully developed turbulent state for flow conditions above critical defined in terms of a critical Reynolds number
 $(Re_{m})_{critical}\approx 2300$
based on the bulk velocity
$(Re_{m})_{critical}\approx 2300$
based on the bulk velocity
 $U_{B}$
and full channel height
$U_{B}$
and full channel height
 $H$
. The critical conditions in the channel were verified using hot-wire anemometry with the probe placed at the centre of the test section outlet. Repeated tests carried out over an extended period of time gave very reproducible results for
$H$
. The critical conditions in the channel were verified using hot-wire anemometry with the probe placed at the centre of the test section outlet. Repeated tests carried out over an extended period of time gave very reproducible results for
 $(Re_{m})_{critical}$
. Owing to the pronounced linearity of the pressure drop measured along the groove-modified channel for
$(Re_{m})_{critical}$
. Owing to the pronounced linearity of the pressure drop measured along the groove-modified channel for
 $Re_{m}$
slightly above critical, it was concluded during previous investigations, reported by Frohnapfel et al. (Reference Frohnapfel, Jovanović and Delgado2007b
), that the fully developed turbulent state was already achieved for
$Re_{m}$
slightly above critical, it was concluded during previous investigations, reported by Frohnapfel et al. (Reference Frohnapfel, Jovanović and Delgado2007b
), that the fully developed turbulent state was already achieved for
 $Re_{m}>(Re_{m})_{critical}$
, which allowed fast estimation of the drag reduction effect by comparing pressure-drop measurements along grooved and flat parts of the channel test section shown in figure 30(b).
$Re_{m}>(Re_{m})_{critical}$
, which allowed fast estimation of the drag reduction effect by comparing pressure-drop measurements along grooved and flat parts of the channel test section shown in figure 30(b).
Since the drag reduction effect was expected to occur in a narrow range of flow conditions slightly above
 $(Re_{m})_{critical}$
(which assume small deviations from axisymmetry) and for groove dimensions corresponding to a few viscous length scales (implying hydraulically smooth surface behaviour), it was decided to determine the drag reduction effect by comparing measurements carried out in flat (figure 30
a) against those measured in groove-modified channels (figure 30
b) for the same values of the volume flow rate. This approach eliminates suspicion that the observed effects might be a consequence of laminar to turbulent transition developing along the channel test section and not due to action of the structured surface. In our previous experiments (Frohnapfel et al.
Reference Frohnapfel, Jovanović and Delgado2007b
), such a possibility could not be entirely eliminated owing to frequent interruption of the experiments that required detachment of the test section from the tunnel. This might introduce misalignment of tripping plates at the channel inlet, resulting in undesired modifications of the initial conditions. Systematic checks of the transition Reynolds number revealed, however, that this was unlikely to happen since it was perfectly reproducible over the entire course of the drag reduction investigations.
$(Re_{m})_{critical}$
(which assume small deviations from axisymmetry) and for groove dimensions corresponding to a few viscous length scales (implying hydraulically smooth surface behaviour), it was decided to determine the drag reduction effect by comparing measurements carried out in flat (figure 30
a) against those measured in groove-modified channels (figure 30
b) for the same values of the volume flow rate. This approach eliminates suspicion that the observed effects might be a consequence of laminar to turbulent transition developing along the channel test section and not due to action of the structured surface. In our previous experiments (Frohnapfel et al.
Reference Frohnapfel, Jovanović and Delgado2007b
), such a possibility could not be entirely eliminated owing to frequent interruption of the experiments that required detachment of the test section from the tunnel. This might introduce misalignment of tripping plates at the channel inlet, resulting in undesired modifications of the initial conditions. Systematic checks of the transition Reynolds number revealed, however, that this was unlikely to happen since it was perfectly reproducible over the entire course of the drag reduction investigations.
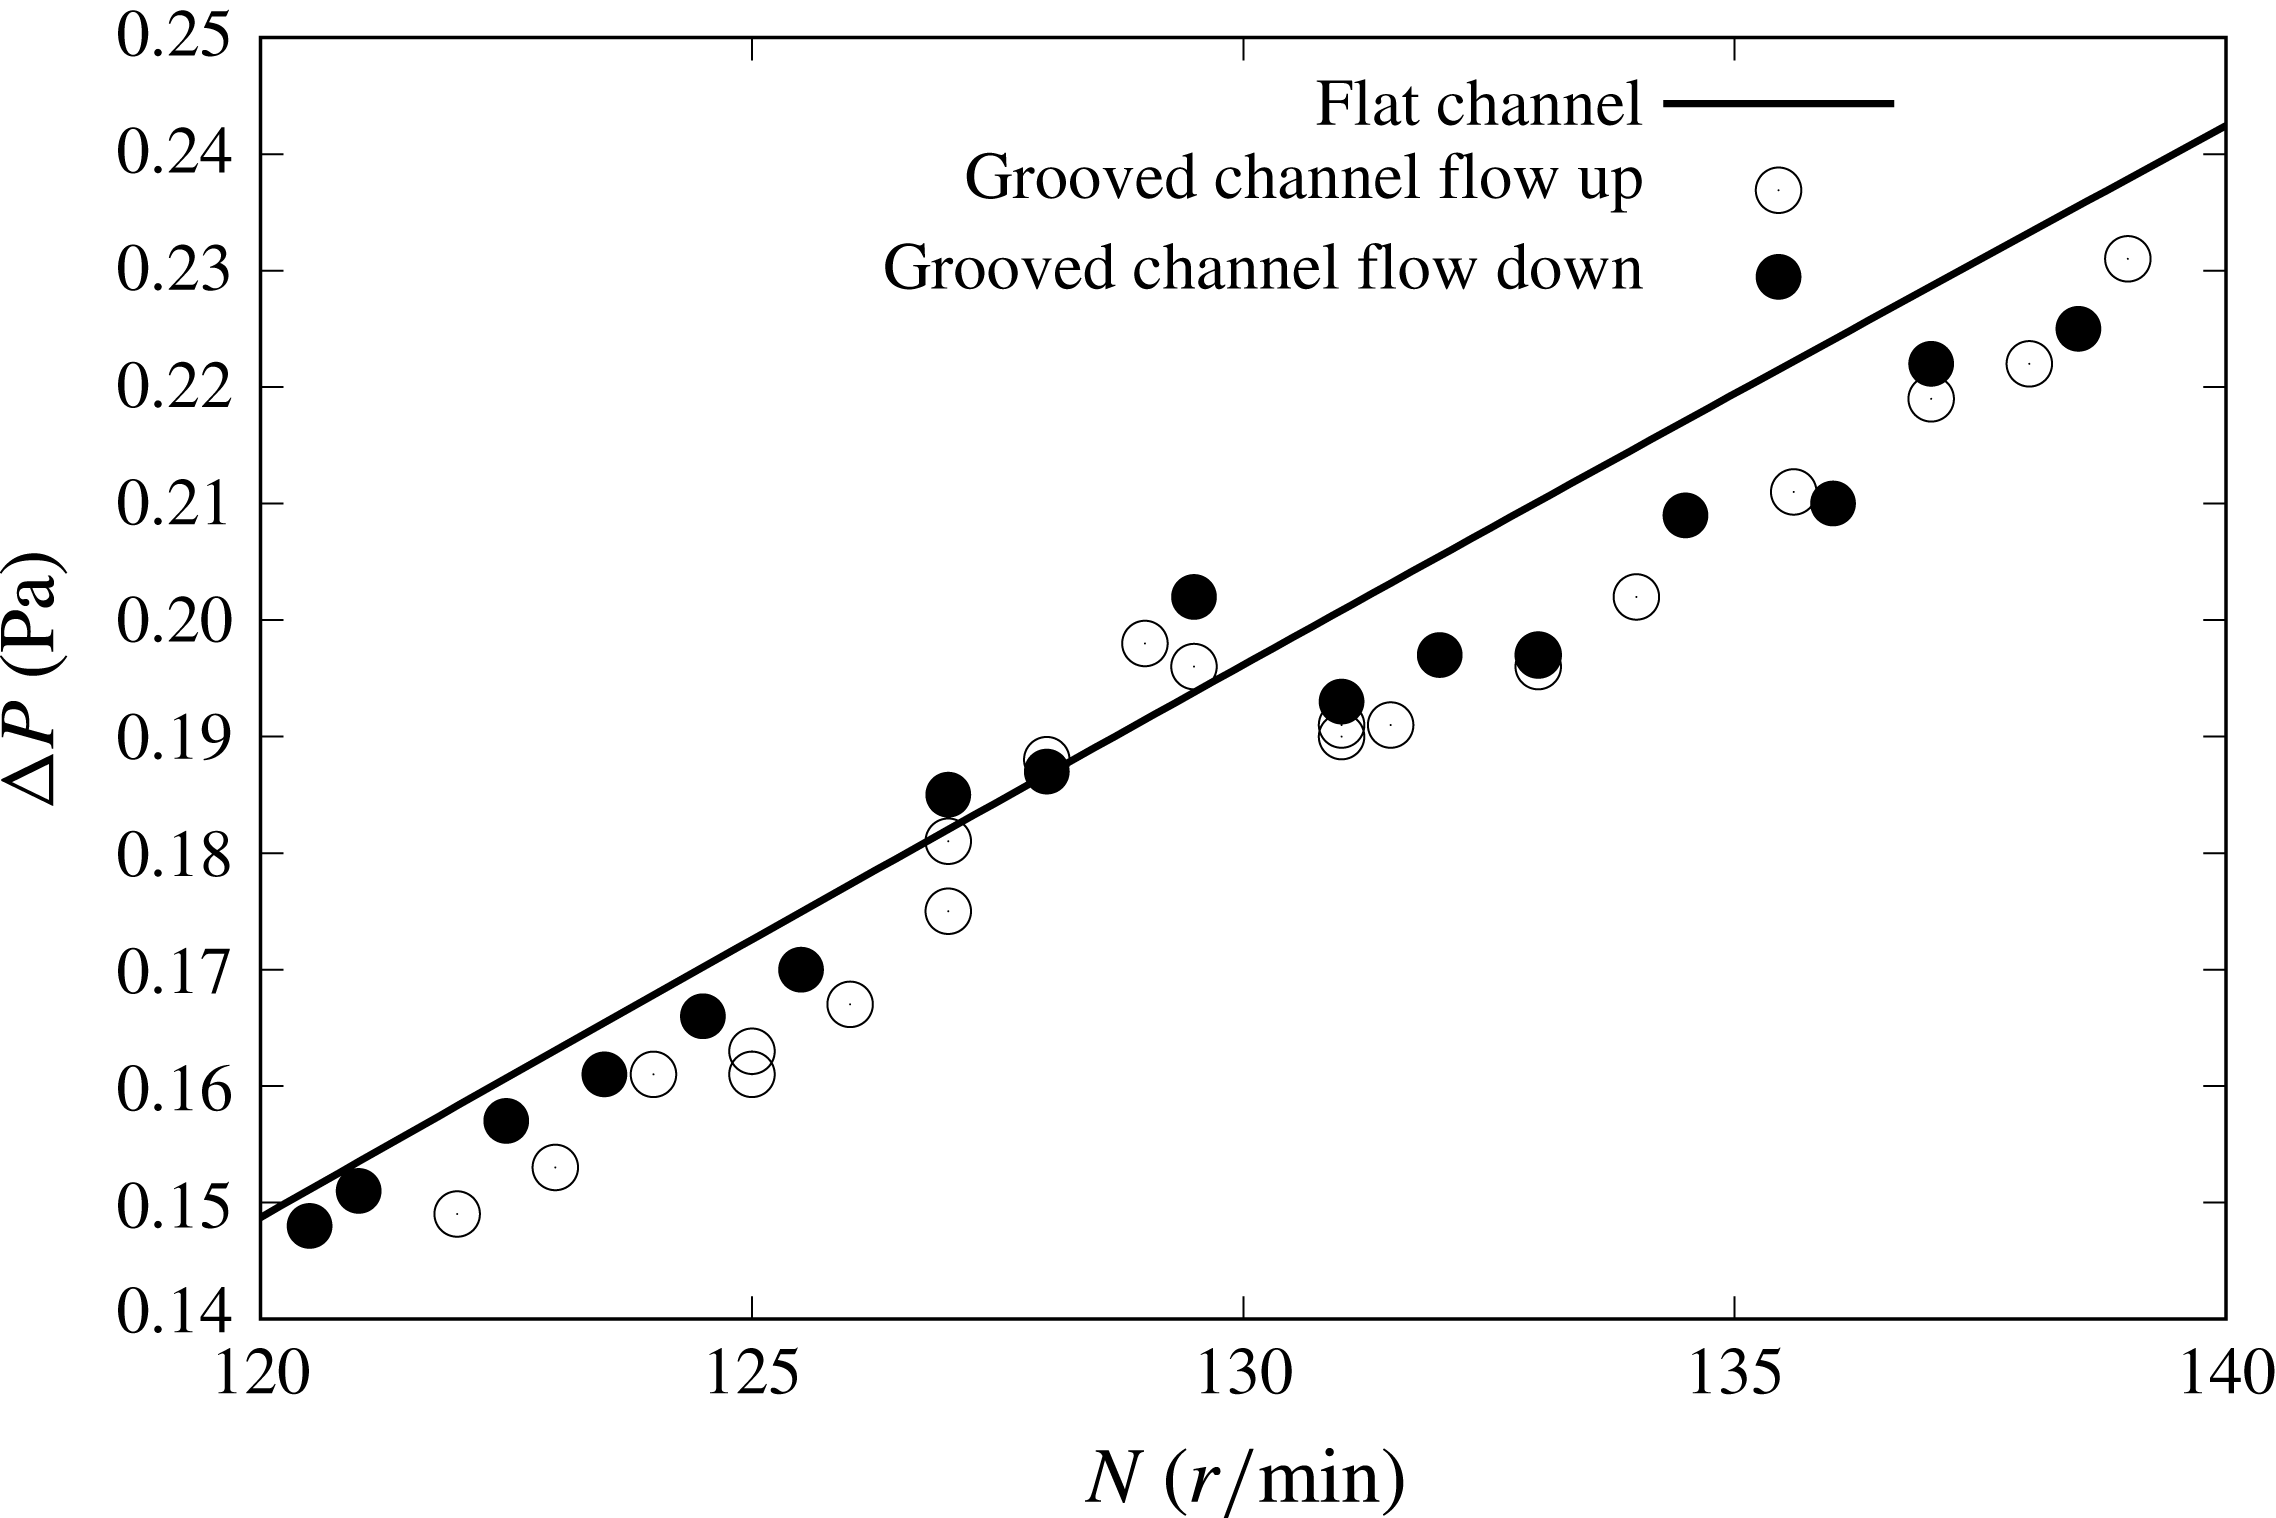
Figure 31. Typical evidence for the turbulent drag reduction produced by the grooved surface pattern. By increasing the fan rotation rate
 $N$
and therefore the flow rate a sudden decrease of the pressure drop
$N$
and therefore the flow rate a sudden decrease of the pressure drop
 $\unicode[STIX]{x0394}P$
is observed in the narrow range of the flow conditions. The same tendency in
$\unicode[STIX]{x0394}P$
is observed in the narrow range of the flow conditions. The same tendency in
 $\unicode[STIX]{x0394}P$
was obtained by decreasing the flow rate without the hysteresis effect, demonstrating clear evidence for turbulence modification by the structured surface and not due to the laminar to turbulence transition. Similar findings were reported by Toms (Reference Toms1977) from early experiments on turbulent drag reduction by high polymers and additionally by Tani (Reference Tani1989), who re-evaluated Nikuradze’s (Reference Nikuradse1933) experiments performed in rough pipes.
$\unicode[STIX]{x0394}P$
was obtained by decreasing the flow rate without the hysteresis effect, demonstrating clear evidence for turbulence modification by the structured surface and not due to the laminar to turbulence transition. Similar findings were reported by Toms (Reference Toms1977) from early experiments on turbulent drag reduction by high polymers and additionally by Tani (Reference Tani1989), who re-evaluated Nikuradze’s (Reference Nikuradse1933) experiments performed in rough pipes.
Several hundred measurements were made by covering a wide range of different parameters such as the flow velocity and the surface structure. A database of pressure-drop distributions along the reference channel with flat walls was first established. These data were checked for consistency and reproducibility dictated by resolution of the pressure transducer, which was approximately 0.3 % of the full-scale deflection, and by integration times of 300 s. These data were compared with measurements taken over the grooved section of the modified channel at the same flow rate to determine the possible influence of grooves on the drag reduction effect. The flow velocity was varied in small steps in attempt to detect the regime for which grooved surface morphology start to influence friction drag.
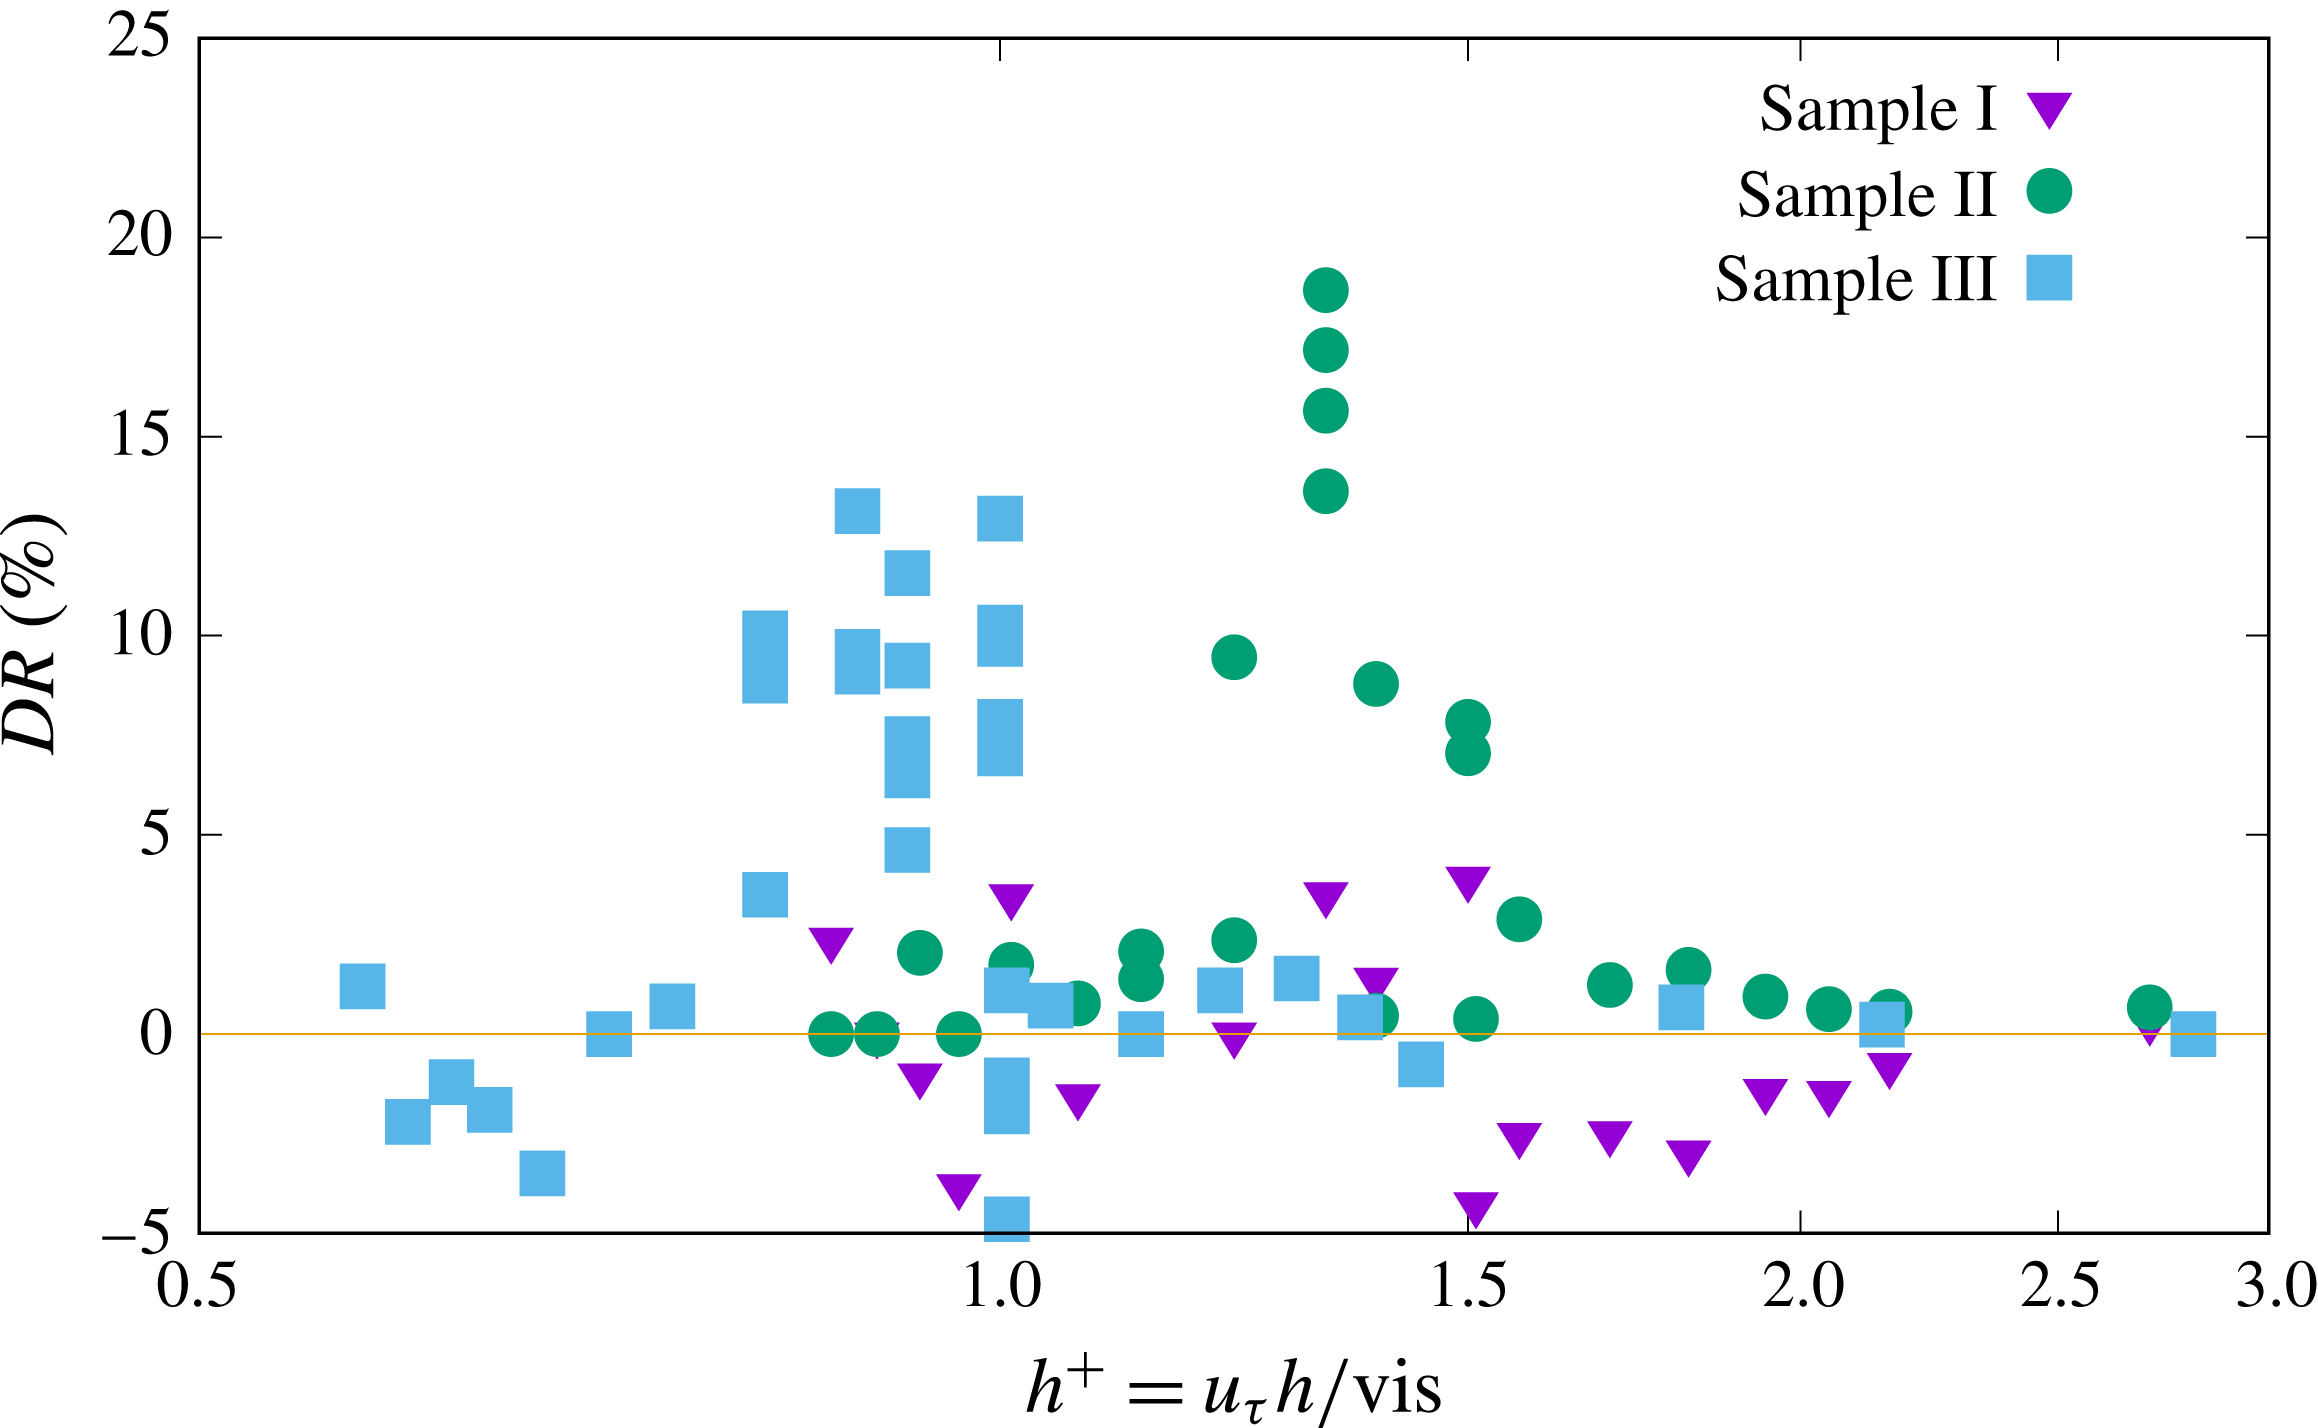
Figure 32. Turbulent drag reduction for three different grooved samples.
By comparison of the pressure drop measured along the front parts of the flat and groove-modified test sections, the turbulent drag reduction was determined as follows:
 $$\begin{eqnarray}\displaystyle & \displaystyle DR_{turbulent}=\left(1-{\displaystyle \frac{\unicode[STIX]{x0394}p_{grooved\,\,section\,\,of\,\,modified\,\,channel}}{\unicode[STIX]{x0394}p_{front\,\,section\,\,of\,\,flat\,\,channel}}}\right)\times 100~[\%]. & \displaystyle\end{eqnarray}$$
Figure 32 presents drag reduction results for three different surface samples plotted as function of the dimensionless groove depth
 $h$
according to
$h$
according to
 $$\begin{eqnarray}\displaystyle & \displaystyle h^{+}={\displaystyle \frac{\tilde{u} _{\unicode[STIX]{x1D70F}}h}{\unicode[STIX]{x1D708}}}, & \displaystyle\end{eqnarray}$$
where
 $\tilde{u} _{\unicode[STIX]{x1D70F}}$
is the average friction velocity determined from the pressure drop over the front part of the test section and cross-sectional area of the reference channel with flat walls.
$\tilde{u} _{\unicode[STIX]{x1D70F}}$
is the average friction velocity determined from the pressure drop over the front part of the test section and cross-sectional area of the reference channel with flat walls.
The experimental results in figure 32 reveal that a drag reduction as high as
 $DR_{turbulent}\approx 20\,\%$
occurs in the narrow range of flow velocities corresponding to a dimensionless groove depth
$DR_{turbulent}\approx 20\,\%$
occurs in the narrow range of flow velocities corresponding to a dimensionless groove depth
 $h^{+}$
between 1 and 1.5 and
$h^{+}$
between 1 and 1.5 and
 $Re_{m}$
between
$Re_{m}$
between
 $3.7\times 10^{3}$
and
$3.7\times 10^{3}$
and
 $4.1\times 10^{3}$
. Maximum reduction was obtained for the second sample (designated in figure 32 as sample II) with a groove depth of
$4.1\times 10^{3}$
. Maximum reduction was obtained for the second sample (designated in figure 32 as sample II) with a groove depth of
 $h=150~\unicode[STIX]{x03BC}\text{m}$
. For the first sample (sample I in figure 32) with the same groove dimensions, no beneficial reduction was obtained. Visual inspection of this sample suggests that this might be due to irregular groove manufacture resulting in large inhomogeneities over the surface finish. The third sample (sample III in figure 32) with the best surface finish and a depth of
$h=150~\unicode[STIX]{x03BC}\text{m}$
. For the first sample (sample I in figure 32) with the same groove dimensions, no beneficial reduction was obtained. Visual inspection of this sample suggests that this might be due to irregular groove manufacture resulting in large inhomogeneities over the surface finish. The third sample (sample III in figure 32) with the best surface finish and a depth of
 $h=100~\unicode[STIX]{x03BC}\text{m}$
clearly produced a consistent trend in reduction of the friction drag with the effect accounting for
$h=100~\unicode[STIX]{x03BC}\text{m}$
clearly produced a consistent trend in reduction of the friction drag with the effect accounting for
 $DR_{turbulent}\approx 15\,\%$
.
$DR_{turbulent}\approx 15\,\%$
.
There is good agreement, both qualitative and quantitative, between the results presented here and those reported previously by Frohnapfel et al. (Reference Frohnapfel, Jovanović and Delgado2007b ), who used the data on pressure-drop measurements along the groove-modified channel to estimate the drag reduction effect by considering that the flow reached the fully developed turbulent state in both parts of the channel test section. Evidence for high drag reduction obtained for the second sample (sample II in figure 32) was further explored by utilizing it for investigation of the ability of the grooved surface to delay the laminar to turbulent transition, which is expected to produce a larger drag reduction effect compared with the data presented in figure 32.
7.4 Drag reduction due to laminar flow control
The channel test sections employed for laminar flow control are shown in figure 33. Whereas the tripping device at the channel inlet ensured a fully developed turbulent state in the investigations of turbulent drag reduction presented in the previous section, the channel configurations for laminar control were arranged in such a way that the contraction was flush mounted with the channel top and bottom walls. Such an arrangement provided natural development of the boundary layers along the test section walls.
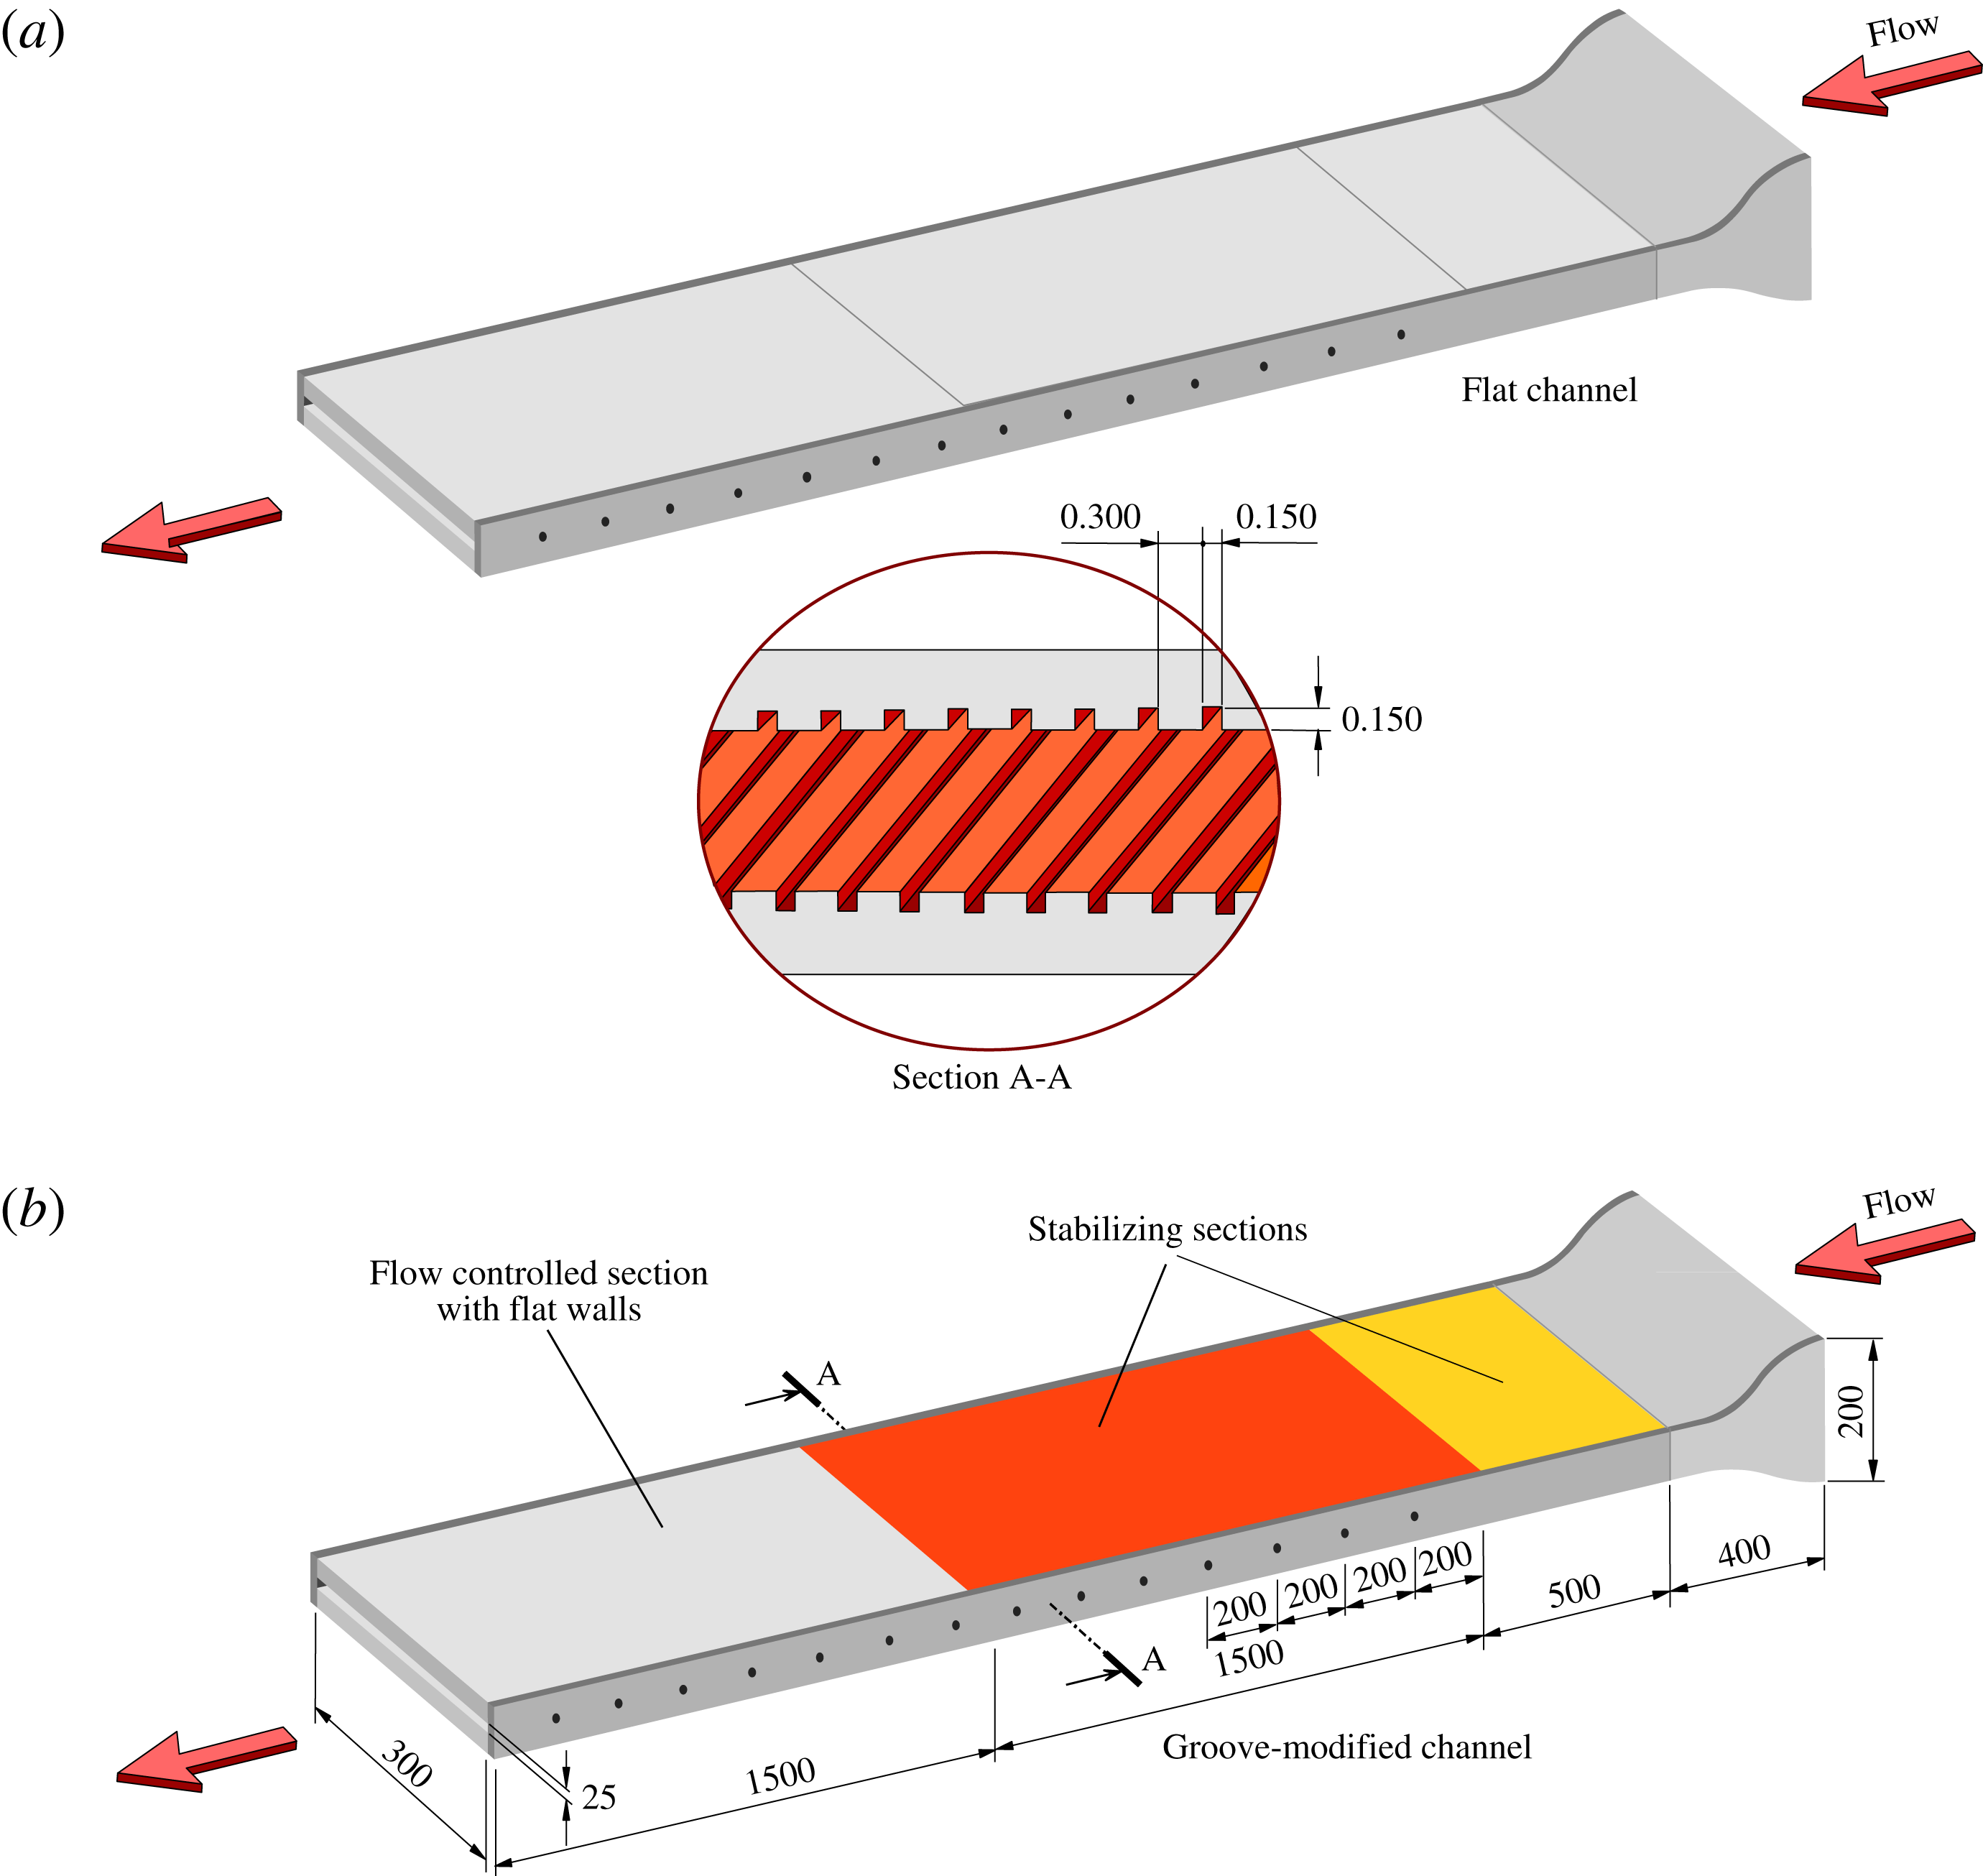
Figure 33. Two-dimensional channel flow with flat and groove-modified test section arrangements. (a) Reference test section configuration with flat walls. (b) Configuration of the test section with two subsections consisting of a grooved surface structure installed at the top and bottom walls of the channel for demonstration of laminar flow control.
The two different test section arrangements permitted quantitative estimation of the drag reduction effect produced by delay of the laminar to turbulent transition. This was accomplished by comparison of pressure-drop measurements made along different parts of the channel test sections. The pressure differentials measured along the reference channel configuration with flat walls were compared with the data measured over the groove-modified channel equipped with the grooved surface installed in the front part of the test section just after contraction. For initial stabilization of the boundary layer development, a grooved surface structure with groove dimensions of
 $h=100~\unicode[STIX]{x03BC}\text{m}$
and separation
$h=100~\unicode[STIX]{x03BC}\text{m}$
and separation
 $2h=200~\unicode[STIX]{x03BC}\text{m}$
(which correspond to sample III in figure 32) was installed over the leading (
$2h=200~\unicode[STIX]{x03BC}\text{m}$
(which correspond to sample III in figure 32) was installed over the leading (
 $L=0.5~\text{m}$
) portion of the groove-modified channel starting right from the contraction exit. The succeeding measuring part of the test section (
$L=0.5~\text{m}$
) portion of the groove-modified channel starting right from the contraction exit. The succeeding measuring part of the test section (
 $L=1.5~\text{m}$
) consisted of grooved plates designated as sample II in figure 31 and the rest (
$L=1.5~\text{m}$
) consisted of grooved plates designated as sample II in figure 31 and the rest (
 $L=1.5~\text{m}$
) of the test section was with flat walls. For the investigated range of the flow velocities, the groove depth was smaller than the thickness of the viscous sublayer,
$L=1.5~\text{m}$
) of the test section was with flat walls. For the investigated range of the flow velocities, the groove depth was smaller than the thickness of the viscous sublayer,
 $5\unicode[STIX]{x1D708}/u_{\unicode[STIX]{x1D70F}}$
, implying hydraulically smooth surface behaviour without any noticeable difference with respect to the flat surface. We shall see, however, that under special circumstances the surface structure can be arranged to alter the behaviour of the flow near the surface by enforcing axisymmetry in
$5\unicode[STIX]{x1D708}/u_{\unicode[STIX]{x1D70F}}$
, implying hydraulically smooth surface behaviour without any noticeable difference with respect to the flat surface. We shall see, however, that under special circumstances the surface structure can be arranged to alter the behaviour of the flow near the surface by enforcing axisymmetry in
 $\overline{u_{i}u_{j}}$
, resulting in suppression of disturbance amplification, delay of the laminar to turbulent transition and consequently reduction of the friction drag.
$\overline{u_{i}u_{j}}$
, resulting in suppression of disturbance amplification, delay of the laminar to turbulent transition and consequently reduction of the friction drag.
Experiments were performed at channel bulk velocities between
 $2.3$
and
$2.3$
and
 $18~\text{m}~\text{s}^{-1}$
, corresponding to the Reynolds number range
$18~\text{m}~\text{s}^{-1}$
, corresponding to the Reynolds number range
 $Re_{m}=3.6\times 10^{3}{-}30\times 10^{3}$
. Since the experiments were conducted under developing flow conditions, one might employ arguments of the boundary layer theory and alternatively interpret the results in terms of the Reynolds number
$Re_{m}=3.6\times 10^{3}{-}30\times 10^{3}$
. Since the experiments were conducted under developing flow conditions, one might employ arguments of the boundary layer theory and alternatively interpret the results in terms of the Reynolds number
 $Re_{x}=U_{B}L/\unicode[STIX]{x1D708}$
based on the bulk velocity,
$Re_{x}=U_{B}L/\unicode[STIX]{x1D708}$
based on the bulk velocity,
 $U_{B}$
, the entire test section length,
$U_{B}$
, the entire test section length,
 $L=3.5~\text{m}$
, and the air viscosity,
$L=3.5~\text{m}$
, and the air viscosity,
 $\unicode[STIX]{x1D708}$
, which correspond to the range
$\unicode[STIX]{x1D708}$
, which correspond to the range
 $Re_{x}=0.5\times 10^{6}{-}4.2\times 10^{6}$
. The local pressure-drop
$Re_{x}=0.5\times 10^{6}{-}4.2\times 10^{6}$
. The local pressure-drop
 $\unicode[STIX]{x0394}p$
measurements, made along the flat and groove-modified test sections are presented in figure 34 in the form of the dimensionless pressure coefficient
$\unicode[STIX]{x0394}p$
measurements, made along the flat and groove-modified test sections are presented in figure 34 in the form of the dimensionless pressure coefficient
 $c_{p}$
defined as
$c_{p}$
defined as
 $c_{p}=\unicode[STIX]{x0394}p/(0.5\unicode[STIX]{x1D70C}U_{B}^{2})$
. Measurements were made over an extended period of time lasting for several years in order to acquire reliable data sets for the reference channel configuration with flat walls and to find a suitable test section arrangement exhibiting pronounced drag reduction effects using available grooved-surface samples already described in § 7.3.
$c_{p}=\unicode[STIX]{x0394}p/(0.5\unicode[STIX]{x1D70C}U_{B}^{2})$
. Measurements were made over an extended period of time lasting for several years in order to acquire reliable data sets for the reference channel configuration with flat walls and to find a suitable test section arrangement exhibiting pronounced drag reduction effects using available grooved-surface samples already described in § 7.3.
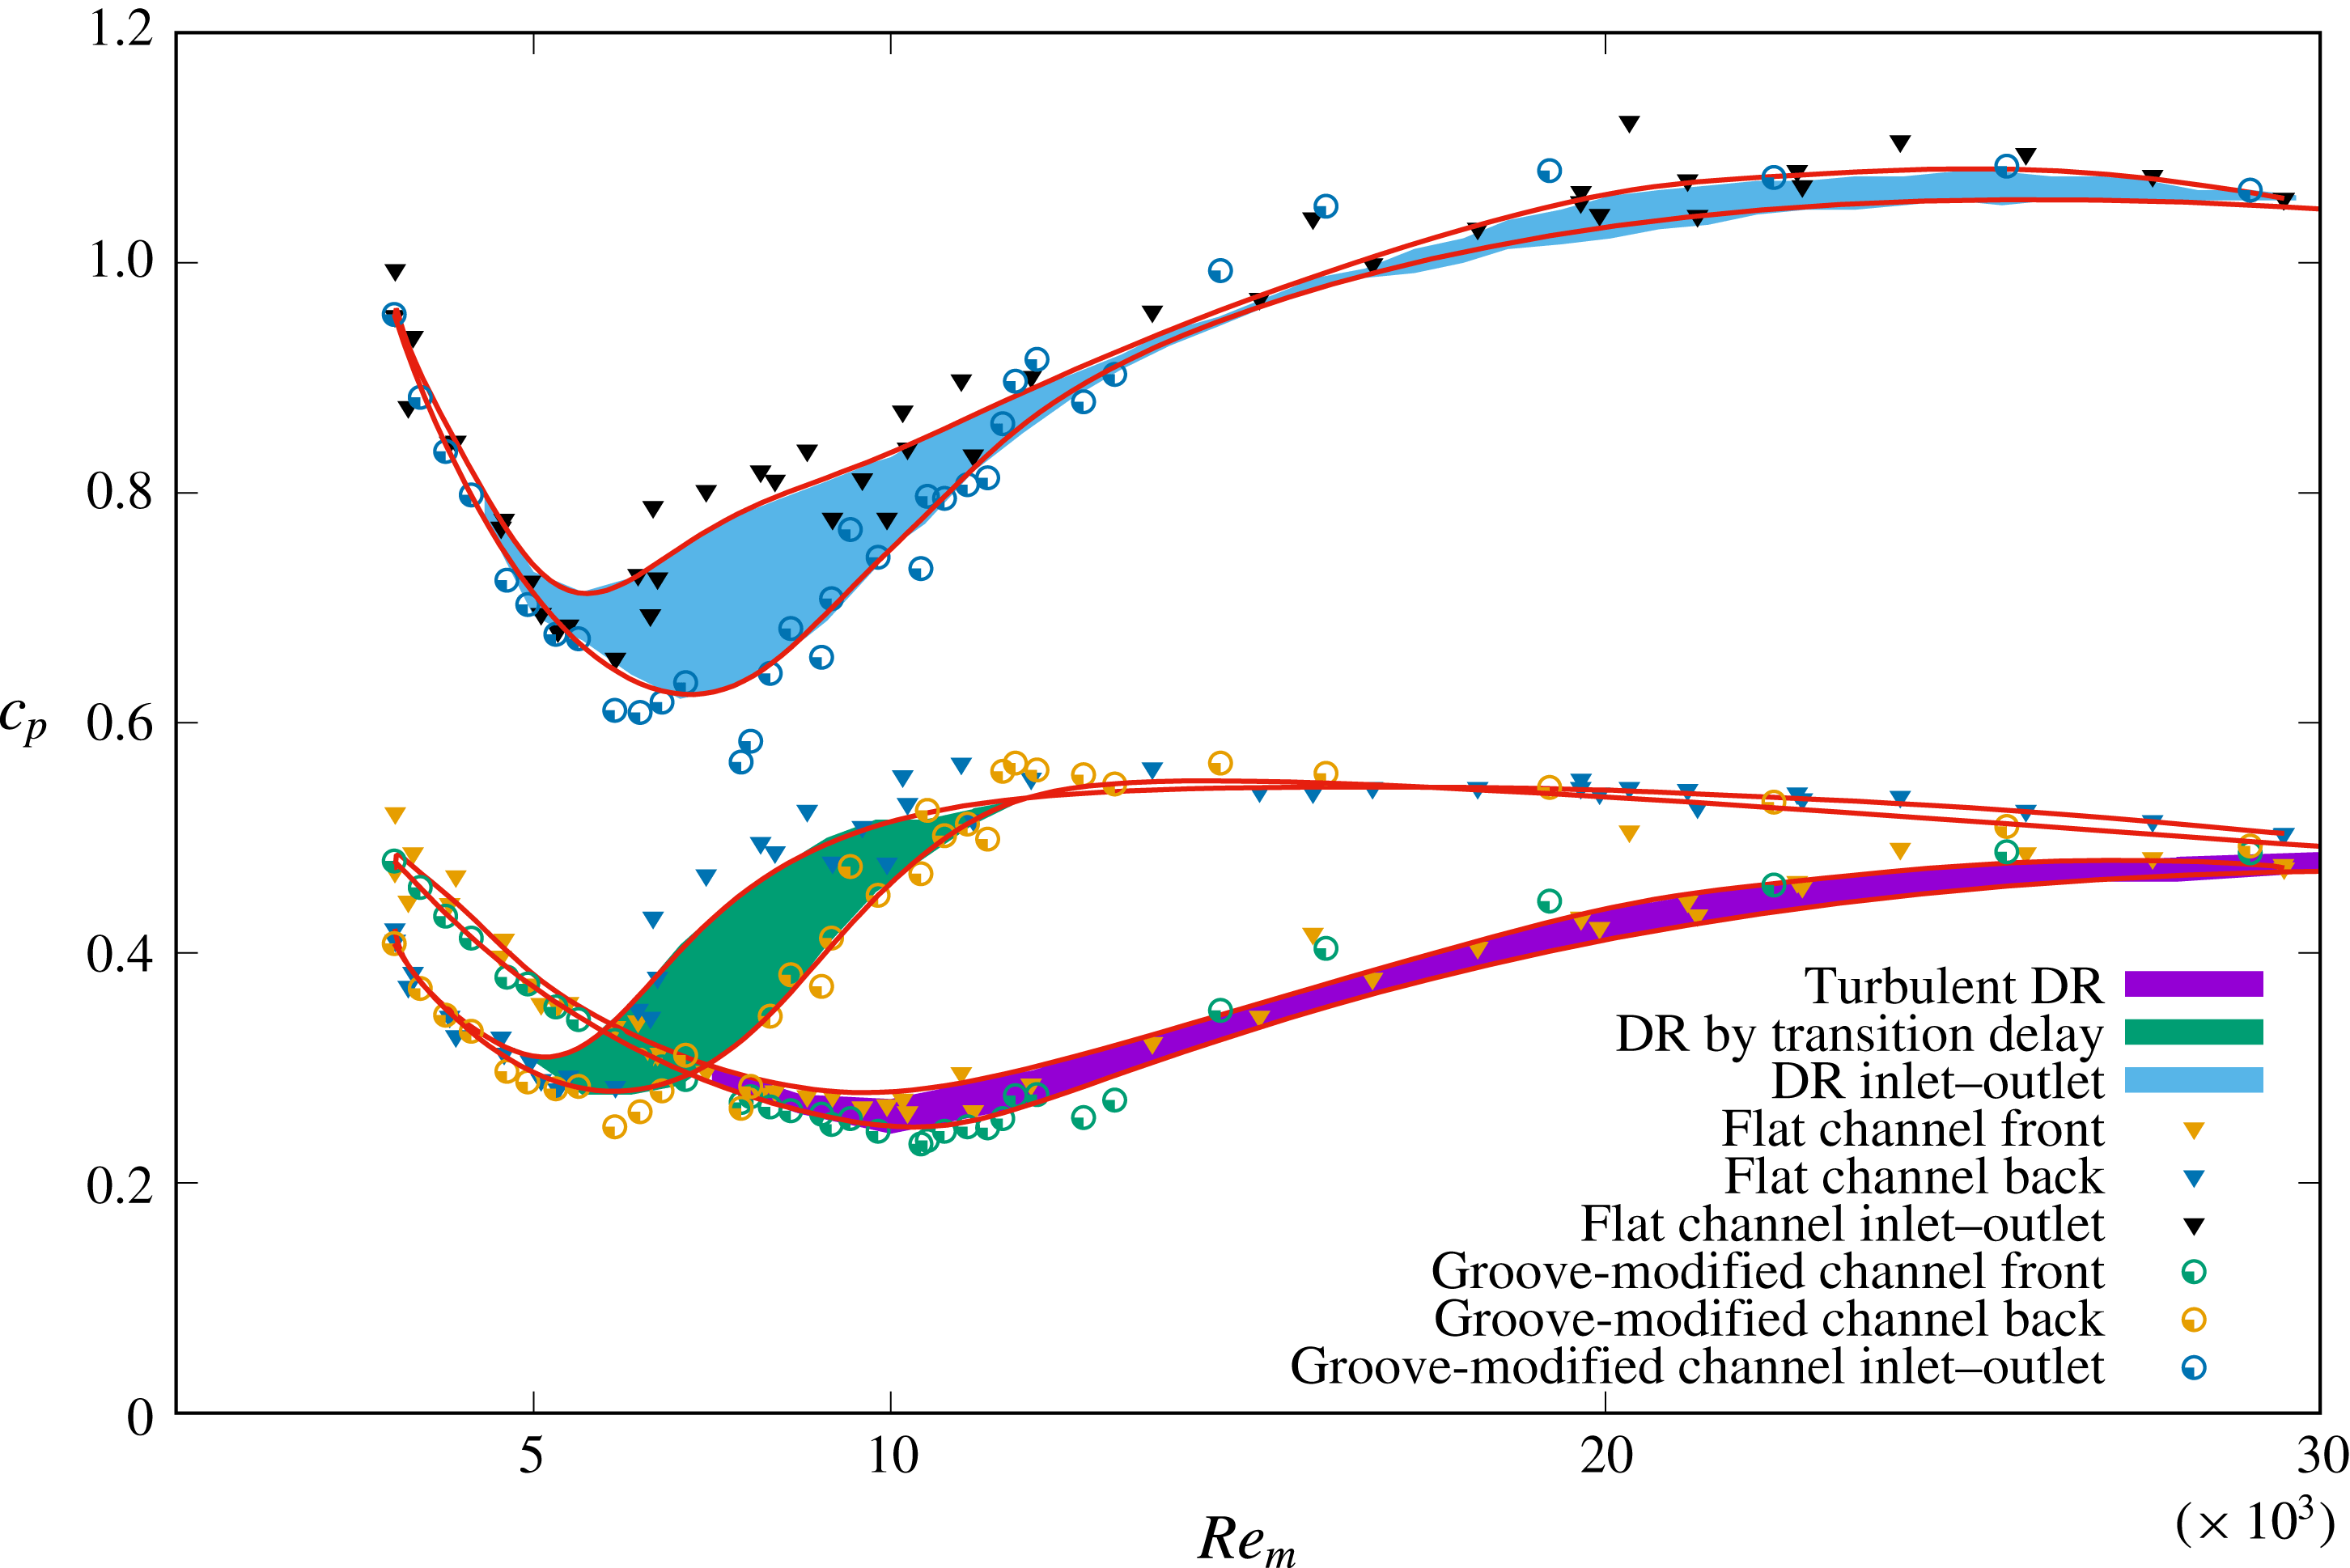
Figure 34. Distributions of the pressure coefficients
 $c_{p}$
in flat and groove-modified channels as functions of
$c_{p}$
in flat and groove-modified channels as functions of
 $Re_{m}$
. Distributions of
$Re_{m}$
. Distributions of
 $c_{p}$
along the entire channel length (top) and the spit forms of
$c_{p}$
along the entire channel length (top) and the spit forms of
 $c_{p}$
corresponding to the front and rear portions of the two test sections.
$c_{p}$
corresponding to the front and rear portions of the two test sections.
Figure 34 (top) shows comparisons of
 $c_{p}$
distributions over the entire test sections of flat and groove-modified channels. The data were smoothed using the gnuplot option Bezier in attempt to display transparently the drag reduction effect produced by the grooved surface pattern. The shaded area between the curves, corresponding to flat and groove-modified test sections, emphasizes the beneficial effect of grooves on drag reduction. The effect extended over a much wider range of flow velocities than for fully developed turbulence discussed in § 7.3. At very low Reynolds numbers
$c_{p}$
distributions over the entire test sections of flat and groove-modified channels. The data were smoothed using the gnuplot option Bezier in attempt to display transparently the drag reduction effect produced by the grooved surface pattern. The shaded area between the curves, corresponding to flat and groove-modified test sections, emphasizes the beneficial effect of grooves on drag reduction. The effect extended over a much wider range of flow velocities than for fully developed turbulence discussed in § 7.3. At very low Reynolds numbers
 $c_{p}$
decays, following analytic solutions for laminar flow, without any noticeable difference between the two test sections. Local minima in
$c_{p}$
decays, following analytic solutions for laminar flow, without any noticeable difference between the two test sections. Local minima in
 $c_{p}$
distributions indicate the critical Reynolds numbers for laminar to turbulent transitions. From these distributions, it appears that grooves increase the critical Reynolds number from
$c_{p}$
distributions indicate the critical Reynolds numbers for laminar to turbulent transitions. From these distributions, it appears that grooves increase the critical Reynolds number from
 $(Re_{m})_{critical}\approx 5300$
holding for the flat channel to
$(Re_{m})_{critical}\approx 5300$
holding for the flat channel to
 $(Re_{m})_{critical}\approx 7900$
for the groove-modified configuration. The theory of hydromechanical stability for the flat channel yields
$(Re_{m})_{critical}\approx 7900$
for the groove-modified configuration. The theory of hydromechanical stability for the flat channel yields
 $(Re_{m})_{critical}\simeq 7600$
(Orszag Reference Orszag, Eppler and Fasel1980). The increase in
$(Re_{m})_{critical}\simeq 7600$
(Orszag Reference Orszag, Eppler and Fasel1980). The increase in
 $(Re_{m})_{critical}$
results in a decrease of
$(Re_{m})_{critical}$
results in a decrease of
 $c_{p}$
over the entire range of flow velocities and is pronounced for
$c_{p}$
over the entire range of flow velocities and is pronounced for
 $Re_{m}=5\times 10^{3}{-}15\times 10^{3}$
.
$Re_{m}=5\times 10^{3}{-}15\times 10^{3}$
.
Split distributions of the pressure coefficient corresponding to the front and rear portions of the employed test sections presented in figure 34 (bottom) provide further details associated with the ability of the grooved surface to delay the laminar to turbulent transition process. Clear evidence for the transition delay can be seen from the
 $c_{p}$
profiles corresponding to the rear, flat, parts of both test sections. In the laminar regime
$c_{p}$
profiles corresponding to the rear, flat, parts of both test sections. In the laminar regime
 $(Re_{m})<(Re_{m})_{critical}$
, grooves located in the front part of groove-modified test section do not influence the friction drag but provide restructuring of the disturbances towards axisymmetry. This favourable influence of grooves on the disturbance development results in the transition delay, which is reflected in reduction of the pressure loss along the flat section of the groove-modified channel compared with the pressure loss along the corresponding section of the flat channel.
$(Re_{m})<(Re_{m})_{critical}$
, grooves located in the front part of groove-modified test section do not influence the friction drag but provide restructuring of the disturbances towards axisymmetry. This favourable influence of grooves on the disturbance development results in the transition delay, which is reflected in reduction of the pressure loss along the flat section of the groove-modified channel compared with the pressure loss along the corresponding section of the flat channel.
Profiles of
 $c_{p}$
measured along the front parts of the two test sections suggest that in the laminar the regime groove surface exhibits the same friction drag as the flat surface in spite of the marked increase in the wetted area. With increasing Reynolds number and appearance of turbulence, the pressure drop along the grooved section decreases in comparison with the flat section of the reference channel, with preserved magnitude as the Reynolds number increases, resulting in an almost constant drag reduction of about
$c_{p}$
measured along the front parts of the two test sections suggest that in the laminar the regime groove surface exhibits the same friction drag as the flat surface in spite of the marked increase in the wetted area. With increasing Reynolds number and appearance of turbulence, the pressure drop along the grooved section decreases in comparison with the flat section of the reference channel, with preserved magnitude as the Reynolds number increases, resulting in an almost constant drag reduction of about
 $DR_{turbulent}\approx 8\,\%$
, which is noticeable even at
$DR_{turbulent}\approx 8\,\%$
, which is noticeable even at
 $Re_{m}=30\times 10^{3}$
.
$Re_{m}=30\times 10^{3}$
.
By comparison of the pressure drop measured in the flat and groove-modified channel test sections, the drag reduction,
 $DR$
, due to the stabilizing effect of the grooved surface on the laminar boundary layer development can be estimated as follows:
$DR$
, due to the stabilizing effect of the grooved surface on the laminar boundary layer development can be estimated as follows:
 $$\begin{eqnarray}\displaystyle & \displaystyle DR_{inlet{-}outlet}=1-{\displaystyle \frac{(\unicode[STIX]{x0394}p)_{groove\text{-}modified\,\,channel}}{(\unicode[STIX]{x0394}p)_{flat\,\,channel}}}, & \displaystyle\end{eqnarray}$$
where the drag reduction relates to the overall pressure-drop reduction measured between the inlet and outlet cross-sectional area of the two test sections. We may define drag reduction emphasizing local flow stabilization by grooves in the form
 $$\begin{eqnarray}\displaystyle & \displaystyle DR_{controlled\text{-}section}=1-{\displaystyle \frac{(\unicode[STIX]{x0394}p)_{flat\,\,section\,\,groove\text{-}modified\,\,channel}}{(\unicode[STIX]{x0394}p)_{rear\,\,section\,\,flat\,\,channel}}}, & \displaystyle\end{eqnarray}$$
which relates to the drag reduction effect only over the controlled portion of the groove-modified test section.
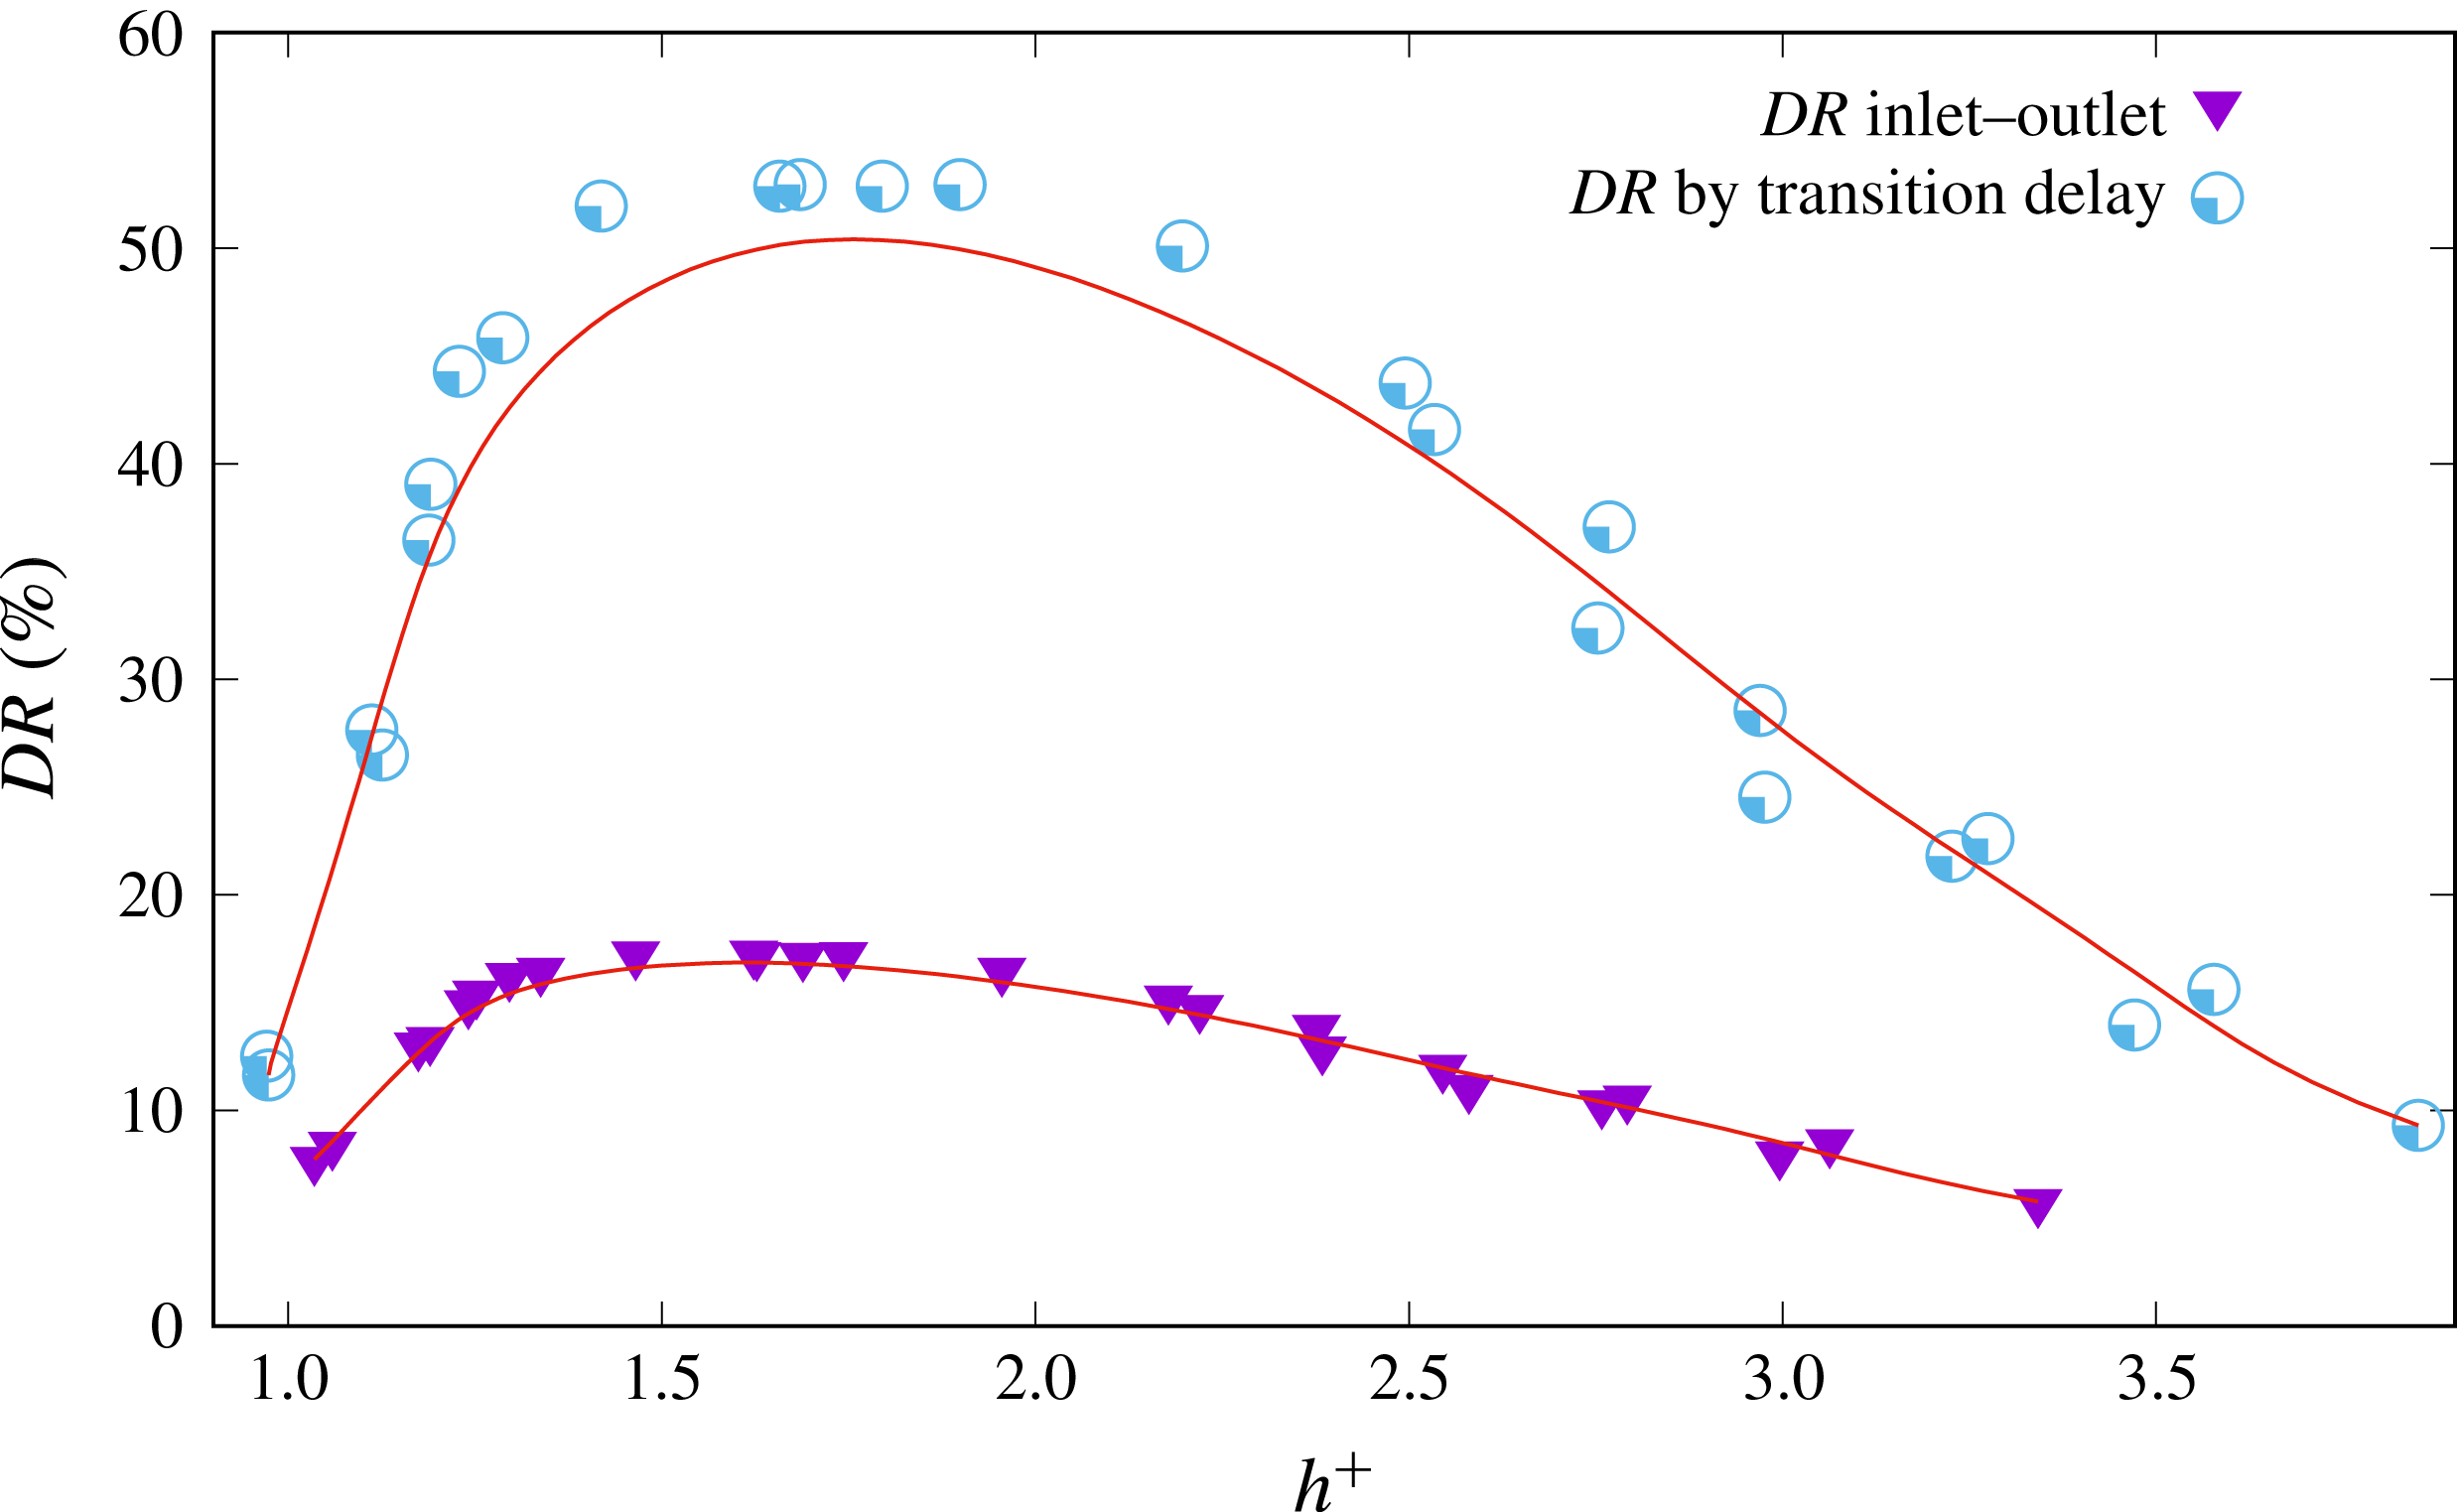
Figure 35. Drag reduction due to laminar flow control.
Figure 35 shows drag reduction results presented as a function of the dimensionless groove depth
 $h$
according to
$h$
according to
 $$\begin{eqnarray}\displaystyle & \displaystyle h^{+}={\displaystyle \frac{\tilde{u} _{\unicode[STIX]{x1D70F}}h}{\unicode[STIX]{x1D708}}}, & \displaystyle\end{eqnarray}$$
where the average value of the friction velocity,
 $\tilde{u} _{\unicode[STIX]{x1D70F}}$
, was determined from the pressure drop measured over the reference parts of the test section and the cross-sectional area of the channel with flat walls. The experimental results in figure 35 demonstrate that drag reduction was obtained in the range of the flow velocities corresponding to dimensionless groove depths between 1 and 3.5 viscous length scales. This range is substantially wider (as expected) than that achieved for the action of grooves in the turbulent flow regime presented in § 7.3. The data reveal that the maximum drag reduction
$\tilde{u} _{\unicode[STIX]{x1D70F}}$
, was determined from the pressure drop measured over the reference parts of the test section and the cross-sectional area of the channel with flat walls. The experimental results in figure 35 demonstrate that drag reduction was obtained in the range of the flow velocities corresponding to dimensionless groove depths between 1 and 3.5 viscous length scales. This range is substantially wider (as expected) than that achieved for the action of grooves in the turbulent flow regime presented in § 7.3. The data reveal that the maximum drag reduction
 $DR_{controlled\text{-}section}\approx 50\,\%$
arises from the rear stabilized section of the groove-modified channel, resulting in an overall net gain of about
$DR_{controlled\text{-}section}\approx 50\,\%$
arises from the rear stabilized section of the groove-modified channel, resulting in an overall net gain of about
 $DR_{inlet{-}outlet}\approx 17\,\%$
. There is good agreement between the present results and those reported by Jovanović et al. (Reference Jovanović, Frohnapfel, Srikantharajah, Jovanović, Lienhart and Delgado2011), who achieved partial success in stabilizing the flow over a considerably narrower range of flow velocities (
$DR_{inlet{-}outlet}\approx 17\,\%$
. There is good agreement between the present results and those reported by Jovanović et al. (Reference Jovanović, Frohnapfel, Srikantharajah, Jovanović, Lienhart and Delgado2011), who achieved partial success in stabilizing the flow over a considerably narrower range of flow velocities (
 $h^{+}\approx 1{-}2.5$
) compared with the present investigations.
$h^{+}\approx 1{-}2.5$
) compared with the present investigations.
8 Conclusions
Using direct numerical simulation at low Reynolds numbers, the flow development in a groove-modified channel was studied with the aim of achieving a delay of the laminar to turbulence transition and persistence of the laminar regime over one of the channel walls by suitable design of the surface morphology. It is shown that for highly disturbed inflow conditions, breakdown to turbulence is significantly delayed over the structured wall designed in the form of periodically embedded sharp grooves placed parallel to the flow direction.
The computation results reveal significant differences in the friction forces acting on channel walls. The friction force experienced by a grooved wall was much lower than that acting on a flat wall. This difference, interpreted as due to a reduction in the viscous drag, led to values in excess of
 $DR\approx 60\,\%$
.
$DR\approx 60\,\%$
.
These findings are well supported by anisotropy-invariant mapping of turbulence, which confirmed that suppression of turbulence development and preservation of the laminar state are due to the ability of the surface pattern to maintain statistical axisymmetry in the turbulent stresses. Complementary investigations of turbulent drag reduction in a grooved channel support the above-mentioned conjectures.
To support the numerical investigations, drag reduction experiments were performed in the inlet region of two-dimensional channel flow. The flow stabilization was achieved by employing the test section with grooved walls produced by mechanical milling resulting in surface contours that resemble the first iteration of the optimal design and is expected therefore to produce axisymmetry in
 $\overline{u_{i}u_{j}}$
and consequently a high drag reduction effect only under very special circumstances.
$\overline{u_{i}u_{j}}$
and consequently a high drag reduction effect only under very special circumstances.
Comparisons of the pressure-drop measurements made along flat and groove-modified test sections provided evidence for a favourable influence of a grooved surface on viscous drag, which was estimated quantitatively by relatively simple means. Application of grooved-surface morphology for laminar control of the boundary layer development revealed high drag reduction of the order of 50 % for the range of flow velocities corresponding to groove dimensions between 1 and 3.5 viscous length scales. This range was substantially wider than obtained for turbulent drag reduction, which was found to occur within groove dimensions between 1 to 1.5 viscous scales
Acknowledgements
Support for completing this work was provided by Kompetentzwerk für wissenschaftliches Höchleistungsrechnen in Bayern (KONWIHR-IV) through its regional centre at the University of Erlangen-Nuremberg under the direction of Professor G. Wellein and Dr T. Zeiser. This support is gratefully acknowledged. The simulation set-ups for this study were prepared in cooperation with Professor M. Perić. His contribution is greatly appreciated. This work benefited from encouragement received from the members of Fachkollegium 404 Strömungsmechanik, during application for projects Jo 240/9-1, Jo 240/10-1 and Jo 240/11-1, submitted for possible funding to the Deutsche Forschungsgemeinschaft, with Dr M. Lentze acting as chief coordinator and technical monitor. Dedicated to the memory of Professor J. Lumley, who introduced the projection of turbulence in the functional space defined in terms of the anisotropy invariants to provide not only the necessary understanding but also, more importantly, modelling and quantitative predictions leading to unified solutions for the continuing problems of viscous drag reduction, including laminar and turbulent flow controls engaged inherently in the processes of forward and inverse transitions, well supported by available numerical databases of wall-bounded flows.
Supplementary movie
Supplementary movie is available at https://doi.org/10.1017/jfm.2018.423.


 Open access