


1. Introduction
Acoustically driven bubbles play an important role in therapeutic ultrasound applications such as histotripsy (Coussios & Roy Reference Coussios and Roy2008; Brennen Reference Brennen2015; Bader, Vlaisavljevich & Maxwell Reference Bader, Vlaisavljevich and Maxwell2019). Large-amplitude volume oscillations of bubbles under high-intensity megasonic wave irradiation often result in extremely high pressure and temperature of the bubble contents at violent collapse, which can destroy malignant tumours. Since human tissues are viscoelastic, a better understanding of the role of viscoelasticity in acoustic bubble dynamics is desirable. Although a number of theoretical and numerical studies on bubble dynamics in soft matter have been reported (Brujan Reference Brujan2011; Dollet, Marmottant & Garbin Reference Dollet, Marmottant and Garbin2019), experimental data are yet lacking, and thus limiting model validation as well as quantitative evaluation of the viscoelasticity effects on bubble dynamics. In particular, acoustically induced nonlinear oscillations of a bubble in soft matter have not been systematically observed, and the corresponding nonlinear bubble dynamics remain elusive. For this reason, we experimentally study the nonlinear oscillations of a bubble in a gelatin gel under ultrasound irradiation and examine the role of viscoelasticity.
Essential features of bubble dynamics can be extracted from Rayleigh–Plesset-type equations under the assumption that bubbles keep their spherical shape (Leighton Reference Leighton1994; Brennen Reference Brennen1995). The effect of viscoelasticity of the medium surrounding bubbles can be incorporated into the Rayleigh–Plesset modelling (Prosperetti Reference Prosperetti1982; Yang & Church Reference Yang and Church2005; Gaudron, Warnez & Johnsen Reference Gaudron, Warnez and Johnsen2015; Warnez & Johnsen Reference Warnez and Johnsen2015). Yang & Church (Reference Yang and Church2005) studied ultrasound-induced nonlinear dynamics of spherical bubbles in linear Kelvin–Voigt solids and showed that the elasticity can suppress the oscillation amplitude. Warnez & Johnsen (Reference Warnez and Johnsen2015) examined more carefully effects of the viscoelasticity including stress relaxation on bubble dynamics. Gaudron et al. (Reference Gaudron, Warnez and Johnsen2015) coupled the Keller–Miksis equation, describing dynamics of spherical bubbles in compressible media (Keller & Miksis Reference Keller and Miksis1980; Prosperetti & Lezzi Reference Prosperetti and Lezzi1986), to a Kelvin–Voigt model with (nonlinear) neo-Hookean elasticity and showed that nonlinear elasticity can lead to milder bubble collapse.
Experimental observations of spherical cavitation bubbles in soft matter are required to validate the Rayleigh–Plesset-type equations equipped with constitutive equations of viscoelastic solids. Since acoustic bubble nucleation is a random event (Oguri & Ando Reference Oguri and Ando2018), the main target in most of the previous experiments is bubbles that are nucleated by focusing a laser pulse into a specific location (see, for example, Brujan & Vogel (Reference Brujan and Vogel2002)). With laser-nucleated bubbles in soft matter, one can observe both free and forced bubble oscillations with the aid of a high-speed camera. Estrada et al. (Reference Estrada, Barajas, Henann, Johnsen and Franck2018) observed free oscillations of laser-induced bubbles in a polyacrylamide gel and compared them with Rayleigh–Plesset calculations with a Kelvin–Voigt viscoelastic model; the nonlinear oscillations up to the third rebound are found to be reproduced by the model. Hamaguchi & Ando (Reference Hamaguchi and Ando2015) observed small-amplitude oscillations of spherical bubbles in a gelatin gel under 28 kHz ultrasound irradiation and compared them with the linearized solution of the Rayleigh–Plesset equation with the linear Voigt model; this comparison allows one to obtain viscosity and elasticity coefficients of the gel under the ultrasound forcing. Experimental observations of finite-amplitude nonlinear bubble oscillations under ultrasound irradiation are essential in the context of the therapeutic ultrasound, but yet are lacking.
The goal of this study is to examine the role of viscoelasticity in finite-amplitude oscillations of spherical bubbles in a viscoelastic solid under ultrasound irradiation. While a megasonic wave is often used in therapeutic ultrasound, we use a lower ultrasound frequency (28 kHz), which enables us to obtain sufficient temporal and spatial resolutions of the bubble dynamics. Following the approach of Hamaguchi & Ando (Reference Hamaguchi and Ando2015), we experimentally observe both small- and finite-amplitude oscillations of laser-nucleated bubbles in a gelatin gel under ultrasound irradiation. We use the small-amplitude bubble oscillations to obtain the gel's viscoelastic properties from their comparison with the linearized Rayleigh–Plesset solution; ultrasound intensity and the radius of bubbles at mechanical equilibrium are treated as parameters, respectively, to examine the extent of nonlinearity and resonance. We also examine the finite-amplitude bubble oscillations (with varying ultrasound intensity and equilibrium bubble radii) and compare them with Rayleigh–Plesset calculations that account for nonlinear elasticity of the gel (Gaudron et al. Reference Gaudron, Warnez and Johnsen2015). To the authors’ knowledge, this is the first time a nonlinear dynamics model for spherical bubbles in gels has been validated by a comparison with experiments.
In what follows, we first introduce theoretical and experimental methods to study spherical bubble dynamics in viscoelastic solids and then discuss the role of viscoelasticity through comparison between the theory and experiments.
2. Modelling of spherical bubble dynamics in viscoelastic solids
2.1. Full model
A model for spherical, nonlinear bubble dynamics in viscoelastic solids can be derived based on continuum mechanics (Keller & Miksis Reference Keller and Miksis1980; Prosperetti, Crum & Commander Reference Prosperetti, Crum and Commander1988; Gaudron et al. Reference Gaudron, Warnez and Johnsen2015; Estrada et al. Reference Estrada, Barajas, Henann, Johnsen and Franck2018; Mancia et al. Reference Mancia, Yang, Spratt, Sukovich, Xu, Colonius, Franck and Johnsen2021). Oscillations of a spherical bubble in terms of instantaneous radius  $R(t)$ can be described by the Keller–Miksis equation where liquid compressibility in the far-field is taken into account (Keller & Miksis Reference Keller and Miksis1980; Estrada et al. Reference Estrada, Barajas, Henann, Johnsen and Franck2018),
 $$\begin{gather} \left( 1 - \frac { \dot{R} } { c_0 } \right) R \ddot{R} + \frac { 3 } { 2 } \left( 1 - \frac { \dot{R} } { 3 c_0 } \right) \dot{R} ^ { 2 }\nonumber\\ = \frac { 1 } { \rho_0 } \left( 1 + \frac { \dot{R} } { c_0 } \right) \left( p_g - p_\infty - \frac { 2\sigma } {R} + {\mathcal{S}} \right) + \frac { R } { \rho_0 c_0 } \frac { d } { dt } \left( p_g - p_\infty - \frac { 2\sigma } {R} + {\mathcal{S}} \right), \end{gather}$$
where  $\rho _0$ and $c_0$ are the (undisturbed) density and sonic speed of the medium surrounding the bubble, respectively, the dot represents a temporal derivative, and $\sigma$ is the surface tension. The far-field pressure consists of atmospheric pressure and acoustic pressure $p_\infty (t) = p_0 + p_a(t)$. The stress integral $\mathcal {S}$ for the finite-deformation Kelvin–Voigt model is obtained as (Gaudron et al. Reference Gaudron, Warnez and Johnsen2015; Hamaguchi & Ando Reference Hamaguchi and Ando2015; Estrada et al. Reference Estrada, Barajas, Henann, Johnsen and Franck2018)
 \begin{equation} {\mathcal{S}} ={-} \frac{ G }{ 2 } \left[ 5 - 4\frac{l}{R} - \left( \frac{l}{R} \right)^{4} \right] - \frac{ 4 \mu \dot{R} }{ R }, \end{equation}
where  $\mu$ and $G$ are the shear viscosity and shear modulus of the surrounding medium, respectively, and $l$ is the bubble radius at strain-free state.
We assume that the bubble consists of non-condensable gases (say, air) only (with a negligible amount of vapour). The homobaric bubble pressure  $p_g(t)$ obeys (Prosperetti et al. Reference Prosperetti, Crum and Commander1988)
 \begin{equation} \dot{p}_g = \frac { 3 } { R } \left[ - \gamma p_g \dot{ R } + ( \gamma - 1 ) K \left. \frac { \partial T } { \partial r } \right| _ { r = R } \right], \end{equation}
where  $\gamma$ is the ratio of specific heats ( $\gamma = 1.4$ for air), $K(T)$ is the thermal conductivity of the gas, and the radial coordinate $r$ is measured from the bubble centre. We use the temperature-dependent thermal conductivity of air (Prosperetti et al. Reference Prosperetti, Crum and Commander1988),
 \begin{equation} K(T) = AT + B. \end{equation}
The temperature field  $T(r,t)$ inside the bubble is determined by solving
 \begin{equation} \rho_g C_p \left( \frac{\partial T}{\partial t} + u_g\frac{\partial T}{\partial r} \right) = \dot{p}_g + \frac{1}{r^{2}}\frac{\partial}{\partial r}\left( r^{2}K\frac{\partial T}{\partial r} \right), \end{equation}
where  $C_p$ is the specific heat of the gas at constant pressure. The velocity field inside the bubble $u_g(r,t)$ is given by
 \begin{equation} u_g = \frac{1}{\gamma p_g}\left[ - \frac{r}{3}\dot{p}_g + (\gamma - 1)K\frac{\partial T}{\partial r} \right]. \end{equation}
Equations (2.3) to (2.6) are valid when the gas inside the bubble follows the ideal gas law  $p_g = \rho _g \mathcal {R}_g T$, where $\mathcal {R}_g$ is the gas constant. We employ the cold liquid assumption (Prosperetti et al. Reference Prosperetti, Crum and Commander1988; Preston, Colonius & Brennen Reference Preston, Colonius and Brennen2007), so that the liquid temperature is undisturbed at room temperature $T_\infty$ (i.e. $T(R,t) = T_\infty$). In addition, the insulated boundary condition is applied at the bubble centre (i.e. $\partial T/\partial r (0,t) = 0$).
The bubble pressure at mechanical equilibrium (but with prestrain in the surrounding medium) is
 \begin{equation} p_{g,0} = p _ { 0 } + \frac { 2 \sigma } { R _ { 0 } } + \frac{ G }{ 2 } \left[ 5 - 4\frac{l}{R_0} - \left( \frac{l}{R_0} \right)^{4} \right], \end{equation}
where  $R_0$ is the bubble radius at mechanical equilibrium. Note that the equilibrium radius $l$ at which the medium surrounding the bubble is strain free allows one to account for prestrain effects on the bubble pressure. In the present experiment, the bubble nuclei are generated by focusing a pulsed laser into (originally strain free) gels of 6 wt% gelatin concentration (see § 3.1) so that prestrain will be built up after the laser focusing; ratio on the strain-free radius to the equilibrium radius is set to $l/R_0 = 0.6$, which is close to the prediction of Ando & Shirota (Reference Ando and Shirota2019).
In summary, the nonlinear oscillations of a spherical bubble in a viscoelastic medium are described by solving (2.1), (2.3) and (2.5) simultaneously. The model is solved numerically: we semidiscretize the partial differential equation (2.5) by central differences (Prosperetti et al. Reference Prosperetti, Crum and Commander1988), and integrate in time using the Cash–Karp Runge–Kutta method (Press et al. Reference Press, Teukolsky, Vetterling and Flannery2007). We use a computational domain  $y = r/R(t)$ where the number of a uniform spatial mesh is set to 200 with which the numerical solutions converge enough in our problems. The initial conditions are given by $R(0) = R_0$, $\dot {R}(0) = 0$, $p_g(0) = p_{g,0}$ and $T(r,0) = T_\infty$. The physical properties used in this model are summarized in table 1; the value of surface tension $\sigma$ is taken from Kikuchi, Sakai & Takagi (Reference Kikuchi, Sakai and Takagi1991), and the viscosity $\mu$ and shear modulus $G$ are fitted values (see § 4.1).
Table 1. Values of the physical properties of 6 wt% gelatin gel and air at standard temperature and pressure ( $T_\infty = 298.15 \ \textrm {K}$ and $p_0 = 101.3 \ \textrm {kPa}$) used in the Rayleigh–Plesset calculations.

2.2. Linearized solution
The linearized solution to the full model equations (2.1) to (2.7) can be derived by perturbation techniques, which enables one to obtain the viscosity and shear modulus of the surrounding medium from its comparison with small-amplitude bubble oscillation data (Hamaguchi & Ando Reference Hamaguchi and Ando2015). Given sinusoidal acoustic pressure  $p_a(t)=C\cos (2{\rm \pi} ft)$ with sufficiently small amplitude $C$ and frequency $f$, the bubble response is expected to be linearized ( $R = R_0(1+x$) where $|x|\ll 1$) and the bubble content tends to behave polytropically. In this limit, the full model equations reduce to the linear ordinary equation of a mass–damper–spring system
 \begin{equation} m\ddot{x} + c\dot{x} + kx = C\cos{(2{\rm \pi} ft)}, \end{equation}
where mass, damping and spring constants are given, respectively, by
 \begin{equation} m = \rho_0 R_0^{2}, \quad c = 4\mu_{eff}, \quad k = 3\kappa_{eff}p_{ g,0 } - \frac{2\sigma}{R_0}+2G\left[\frac{l}{R_0}+\left(\frac{l}{R_0}\right)^{4}\right]. \end{equation}
Here,  $\kappa _{eff}$ and $\mu _{eff}$ are the effective polytropic index and viscosity (Chapman & Plesset Reference Chapman and Plesset1971; Prosperetti Reference Prosperetti1977a; Ando, Colonius & Brennen Reference Ando, Colonius and Brennen2009),
 \begin{equation} \kappa_{ eff } = \frac{1}{3}\mathrm{Re}\{\varUpsilon\}, \quad \mu_{ eff } = \mu+\frac{p_{ g,0 }}{8{\rm \pi} f}\mathrm{Im}\{\varUpsilon\} + \frac{\rho_0(2{\rm \pi} f)^{2} R_0^{3}/(4c_0)}{1+(2{\rm \pi} fR_0/c_0)^{2}}, \end{equation}
where  $\varUpsilon$ is the complex transfer function of the Péclet number $Pe = R_0^{2}(2{\rm \pi} f) / \alpha _{ g }$,
 \begin{equation} \varUpsilon = \frac{3\gamma}{1-3(\gamma-1)\textrm{i}\, Pe ^{{-}1}(\sqrt{\textrm{i}\, Pe }\coth{\sqrt{\textrm{i}\, Pe }}-1)}. \end{equation}
Note that the nonlinear elasticity term of prestrain still remains in (2.7) and (2.9a–c), regardless of whether the bubble response is linear or nonlinear. When the prestrain is assumed to vanish (i.e.  $l=R_0$), the elastic model reduces to the linear model of Hamaguchi & Ando (Reference Hamaguchi and Ando2015).
The steady-state solution of the linearized equation (2.8) is given by
 \begin{equation} x(t) = X\cos{(2{\rm \pi} ft+\delta)}, \end{equation}
where  $X$ and $\delta$ are the oscillation amplitude and phase shift, respectively,
 \begin{gather} X = \frac{C/k}{\sqrt{[1-(f/f_{N})^{2}]^{2} + 4\zeta^{2}(f/f_{N})^{2}}}, \end{gather}
 \begin{gather}\delta = \mathrm{ arctan }\frac{2\zeta(f/f_{ N })}{1-(f/f_{ N })^{2}}. \end{gather}
Here,  $f_{ N }$ and $\zeta$ are the natural frequency and damping ratio, respectively,
 \begin{equation} f_{N} = \frac{1}{2{\rm \pi}}\sqrt{\frac{k}{m}}, \quad \zeta = \frac{c}{2\sqrt{mk}}, \end{equation}
with which the resonant frequency  $f_R$ can be defined as
 \begin{equation} f_{ R } = \sqrt{1-\zeta^{2}}f_{ N }. \end{equation}
In the present experiment, the equilibrium radius of bubbles,  $R_0$, is varied but the ultrasound frequency $f$ is fixed at 28 kHz. When it comes to constructing resonance curves of bubble oscillations, we can plot the oscillation amplitude $X$ as a function of the equilibrium bubble radius $R_0$, for the natural frequency $f_N$ and equilibrium radius $R_0$ are one-to-one through (2.9a–c) and (2.15a,b).
3. Experiments
3.1. Generation of a spherical gas bubble nucleus in a gelatin gel
We use a 6 wt% air-supersaturated gelatin gel as a viscoelastic solid. A sol generated by mixing powdered gelatin (G 2500, Sigma-Aldrich) and heated deionized water is poured into an acrylic case ( $38\ \mathrm {mm}\times 38\ \mathrm {mm}\times 15\ \mathrm {mm}$), whose bottom is sealed with a thin plastic wrap. The sol turns to a gel after overnight cooling at $4\,^{\circ }{\mathrm {C}}$. After returning to room temperature, the gel is supersaturated with dissolved air (Hamaguchi & Ando Reference Hamaguchi and Ando2015) since mass diffusion is much slower than heat diffusion. While viscoelastic properties of gels under strain rates up to approximately 100 Hz are measured commonly by commercial rheometers, those of the gel deformed under ultrasound irradiation cannot be measured in the same manner (Kwon & Subhash Reference Kwon and Subhash2010; Jamburidze et al. Reference Jamburidze, De Corato, Huerre, Pommella and Garbin2017; Saint-Michel & Garbin Reference Saint-Michel and Garbin2020) and thus need to be treated as unknown parameters in this study.
A spherical bubble nucleus can be generated by focusing a laser pulse into the gelatin gel as illustrated in figure 1(a). We use a Q-switched Nd:YAG laser (ULTRA 50 GRM, Quantel) delivering an infrared laser pulse whose wavelength and duration are 1064 nm and 6 ns, respectively. The laser pulse is focused into the gel through a microscope objective ( $\times 40$, $\textrm {NA}=0.6$). A micron-sized cavity with dissolved air appears as a result of laser-induced plasma and subsequent bubble formation. Since the surrounding gel is supersaturated with the dissolved gas, the cavity exhibits gradual growth as a spherical gas bubble as a result of the gas influx, see figure 1(b). The bubble growth is obtained approximately over one hour as shown in figure 1(c) and is thus so slow that (unsteady) dynamics of the bubble are totally unimportant. Namely, we can control the radius of the bubble at mechanical equilibrium, $R_0$, based on the mass diffusion.

Figure 1. (a) The optical system for generating a spherical bubble by focusing a laser pulse. (b) Snapshots of a growing bubble in the 6 wt% air-supersaturated gelatin gel. The image was taken through the objective lens in the same system. The scale bar represents 100  $\mathrm {\mu }$m. (c) Temporal evolution of the area-equivalent bubble radius (obtained from panel b).
It is instructive to report on the selection of gelatin concentration at 6 wt%. To confirm sphericity of the laser-induced gas bubble nuclei, we recorded the side view of the bubble in the gels of the 6 wt% and 12 wt% gelatin concentration, see figure 2. In the case of the higher gelatin concentration, deviation of the bubble shape from a sphere is further emphasized, given the same objective lens with  $\textrm {NA}=0.6$. Here, we define the bubble's roundness as $4{\rm \pi} \times {{\rm area}/{\rm (perimeter)}^{2}}$ where ‘area’ and ‘perimeter’ are calculated from the (two-dimensional) images of the bubbles (Hamaguchi & Ando Reference Hamaguchi and Ando2015). The roundness of the bubbles in the 6 wt% gel is $1.05\pm 0.01$ (out of five measurements including figure 2a), while that in the 12 wt% is $1.11\pm 0.06$ (out of five measurements including figure 2(b). For the bubble in the stiffer gel to be spherical, there is a need to use objective lenses with higher NA that enable pointwise plasma formation. However, the working distance of higher-NA objective lenses is shorter, making it more difficult to create bubbles away from the container's wall. Since the observation target of our concern is isolated bubble dynamics, laser-induced bubble nuclei need to be created sufficiently away from any boundaries. This technical difficulty hinders the study of isolated bubble dynamics in stiffer gels with higher gelatin concentration. The case with the 3 wt% gelatin concentration, on the contrary, will lead to more spherical bubble nuclei but give rise to shape instability more easily at smaller-amplitude oscillations (Hamaguchi & Ando Reference Hamaguchi and Ando2015). Thus, it is also an experimental challenge to obtain spherical oscillations of finite amplitude in the lower concentration case.

Figure 2. The side view of gas bubble nuclei within one minute after the laser focusing. The image was taken with the optical set-up in figure 3. The scale bar represents 100  $\mathrm {\mu }$m. (a) A bubble nucleus (of roundness 1.05) in the 6 wt% gel. (b) A bubble nucleus (of roundness 1.10) in the 12 wt% gel.

Figure 3. Schematic illustration of the experimental set-up for recording the bubble oscillations driven by a 28 kHz planer ultrasound wave. The bubble is placed at one half of the ultrasound wavelength above the piezoelectric transducer.
3.2. Recording bubble oscillations driven by ultrasound
The bubble oscillations driven by underwater ultrasound from a 28 kHz planer piezoelectric transducer (0.028Z45I, JAPAN PROBE, wavelength in water  $\lambda = 54\ \textrm {mm}$) are recorded by a high-speed camera (FASTCAM SA-X2, Photron, frame rate 300 kfps, resolution $2.88\ \mathrm {\mu }\textrm {m}\,\textrm {pixel}^{-1}$, exposure time 293 ns) with backlighting of LED illumination (SLG-150V, REVOX) and a zoom lens ( $\times 300$, CX-5040SZ, HIROX), as illustrated in figure 3. The transducer is attached on the bottom of an acrylic container filled with tap water. The distance between the transducer and the free surface of the water is set to $5\lambda /4$ in order to form a standing pressure wave (Yamashita & Ando Reference Yamashita and Ando2020). The bubble generated in the gel (see § 3.1) is located at the antinode of the standing wave (i.e. $\lambda /2$ above the transducer). Bitmap images taken from the high-speed recordings are converted to binary data using the graythresh function in MATLAB and the area of the projected bubble is obtained by the regionprops function to determine the area-equivalent radius.
There are two important parameters in our experiments:
(i) radius of the bubble at mechanical equilibrium $R_0$ (see § 3.1);
(ii) ultrasound pressure amplitude
$p_A$.


The acoustic pressure  $p_a(t)$ in the water (without the gel sample) is measured by a hydrophone (HCT0310, Onda). The acoustic pressure in the gel is expected to be similar to the underwater pressure, for their acoustic impedances are similar. In the experiment, the pressure amplitude $p_A=\max (p_a)$ is set either at 0.03 atm (for linearized oscillation) or at 0.24 atm (for finite-amplitude oscillation).
In the high-speed camera recording, we consistently use the same gas bubble nucleus created in a specific position of the gel sample. Note that the structure of gels is inhomogeneous in space and the gel viscoelasticity field is essentially non-uniform (Shibayama Reference Shibayama1998). This approach thus enables us to eliminate effects of the gel's inhomogeneity on the analysis of bubble dynamics for each value of  $R_0$.
4. Results and discussion
4.1. Small-amplitude bubble oscillations
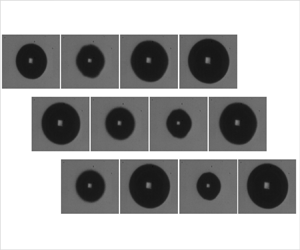
First, we consider the case of small-amplitude bubble oscillations under low-amplitude ultrasound pressure  $p_A=0.03$ atm. In figure 4, as a representative example, we present the result for the bubble (under resonance $f/f_R = 1.00$) whose equilibrium radius is dimensionally at $R_0=115.9\ \mathrm {\mu }\textrm {m}$. It follows from a series of recorded images (figure 4a) that the bubble keeps its spherical shape for the duration of our observation. From the evolution of the area-equivalent bubble radius (figure 4b), it turns out that the oscillation amplitude in the radius during both the growth and shrinkage phases is approximately $0.05 R_0$. We may thus say that the oscillation amplitude is sufficiently small for the dynamics to be linearized.

Figure 4. (a) Small-amplitude spherical oscillations of a resonant bubble in the 6 wt% gelatin gel under 28 kHz ultrasound irradiation ( $R_0 = 115.9 \ {\mathrm {\mu }}$m, $f/f_{ R } = 1.00$). The scale bar represents $100\ \mathrm {\mu }\textrm {m}$. (b) Evolution of the area-equivalent bubble radius and the ultrasound pressure wave with $p_A \approx 0.03$ atm. Here $t^{*} = t \times 28 \ \textrm {~kHz}$ is the dimensionless time.
We repeated the same experiment as in figure 4, but varying the equilibrium radius  $R_0$ of the same gas bubble nucleus based on the diffusion-driven growth (§ 3.1), while the ultrasound frequency and amplitude were both fixed. This procedure allows for constructing the resonance curve, i.e. the relation between the oscillation amplitude $\max (R)$ and the equilibrium bubble radius $R_0$ as in figure 5 where the distinct experimental results with different $R_0$ are denoted by circles. Now that the oscillation amplitude is small and the dynamics are expected to be linearized as supported by figure 4 (for the case of the resonant bubble), we compare the resonance curve with linear theory (§ 2.2). In this comparison, we use MATLAB's built-in function lsqcurvefit for unknown shear viscosity $\mu$ and shear modulus $G$ of the gel to be fitted. The fitted solution is also shown in figure 5, which reasonably agrees with the experimentally determined resonance curve. The fitted values of the shear viscosity and shear modulus are $\mu =18.3 \ \textrm {mPa}\,\textrm {s}$ and $G=4.0 \ \textrm {kPa}$, respectively, and used for analysis in the succeeding sections. Finally, we note that these fitted values are lower than those reported in Hamaguchi & Ando (Reference Hamaguchi and Ando2015), for viscosity and rigidity coefficients of the gel are sensitive to its production and storage processes (te Nijenhuis Reference te Nijenhuis1981) and can vary between different gel samples even at the same gelatin concentrations.

Figure 5. Resonance curve of the small-amplitude oscillations (under the 28 kHz ultrasound irradiation with  $p_A \approx 0.03 \ \textrm {atm}$) as a function of the equilibrium bubble radius $R_0$. The circles represent the experiments; the red one shows the case in figure 4. The solid line is the linearized solutions (2.13) with the gel's shear viscosity and shear modulus fitted at $\mu = 18.3 \ \textrm {mPa}\,\textrm {s}$ and $G = 4.0 \ \textrm {kPa}$, respectively.
4.2. Finite-amplitude bubble oscillations
Next, we consider the case of finite-amplitude bubble oscillations under the high ultrasound pressure  $p_A=0.24$ atm. In figure 6(a), we present a visualization example of spherical oscillation of the bubble with $R_0=124.0\ \mathrm {\mu }\textrm {m}$ (and $f/f_R=1.06$). The evolution of the corresponding area-equivalent bubble radius is shown in figure 6(b), illustrating that the amplitude during the growth phase is approximately $0.3 R_0$ but that during the shrinkage phase is smaller, which is a sign of the nonlinearity. The full model predictions (§ 2.1) are also shown in this figure. In the simulation, we use the shear viscosity and shear modulus obtained from the linear analysis (§ 4.1); for comparison, we also consider the case of no elasticity ( $G=0$). It follows from the comparison that the simulation agrees well with the experiment but that with the assumption of no elasticity gives rise to an underestimate in the oscillation amplitude; we discuss this trend in § 4.3. In short, the nonlinear dynamics of the spherical bubble in this particular example can be reproduced by the Rayleigh–Plesset-type model that is coupled to a Kelvin–Voigt constitutive equation with neo-Hookean elasticity, provided values of the shear viscosity and shear modulus are properly tuned, say, based on linear analysis.

Figure 6. (a) Finite-amplitude spherical oscillations of a bubble in the 6 wt% gelatin gel under 28 kHz ultrasound irradiation ( $R_0 = 124.0$ $\mathrm {\mu }$m, $f/f_{ R } = 1.06$). The scale bar represents $100\ \mathrm {\mu }\textrm {m}$. (b) Evolution of the area-equivalent bubble radius and the ultrasound pressure wave with $p_A \approx 0.24$ atm. The measured bubble oscillations are compared with numerical solutions of the full model (§ 2.1) with the gel's shear viscosity $\mu = 18.3\ \textrm {mPa}\,\textrm {s}$.
It is instructive to report on the larger-amplitude bubble oscillations even under the same pressure amplitude  $p_A=0.24$ atm. In figure 7(a), we present a visualization example of the bubble oscillations with $R_0=107.8$ $\mathrm {\mu }$m (and $f/f_R=0.93$). In this case, the bubble initially shows spherical oscillations (with larger amplitude in comparison with figure 6), but later non-spherical oscillations of mode 1 appear (in addition to the volume oscillations of mode 0) after $t^{*}\approx 13.0$. Note that non-spherical oscillations of mode 1 cannot happen in water with no rigidity (Prosperetti Reference Prosperetti1977b; Versluis et al. Reference Versluis, Goertz, Palanchon, Heitman and van der Meer2010; Liu et al. Reference Liu, Sugiyama, Takagi and Matsumoto2012), but can appear in our case, for the gelatin gel possesses rigidity that works as restoring force in the translational direction, as predicted by the analysis of Murakami, Gaudron & Johnsen (Reference Murakami, Gaudron and Johnsen2020). In figure 7(b), we present the evolution of the corresponding area-equivalent bubble radius and compare it with the full model predictions. As in figure 6(b), we obtain reasonable agreement between the experiment and simulation, provided the bubble oscillates spherically. Once non-spherical oscillations appear after $t^{*}\approx 13.0$, the oscillation amplitude in volume is reduced, for some of the inputted ultrasound energy is used in the shape oscillations (Feng & Leal Reference Feng and Leal1997). In this case, the Rayleigh–Plesset simulation for spherical bubble dynamics gives rise to an overestimate in the volume oscillation amplitude.

Figure 7. As figure 6, but with the smaller equilibrium radius ( $R_0 = 107.8\ \mathrm {\mu }$m, $f/f_R=0.93$), leading to non-spherical shape oscillations after $t^{*}\approx 13.0$.
To understand the origin of the nonlinear response, we performed supplemental simulation for the same conditions as in figure 7 but with the linear elastic model (Hamaguchi & Ando Reference Hamaguchi and Ando2015); see figure 9 in Appendix A. The simulation result with the linear elastic model is virtually indistinguishable from that with the neo-Hookean model. This observation means that the nonlinearity in the spherical bubble oscillations does not arise from the neo-Hookean modelling of the elastic stresses, but rather from other nonlinear terms in the full model formulated in § 2.1 (specifically, the inertial terms in the Keller–Miksis equation (2.1)). Nonlinear elasticity plays a more important role in larger-amplitude oscillations of spherical bubbles, particularly at radii smaller than equilibrium (Gaudron et al. Reference Gaudron, Warnez and Johnsen2015). For these effects to be visible, a far larger far-field pressure forcing (say, at tenfold amplitude  $p_A$ in comparison with figure 7) would be necessary; see figure 10 in Appendix A. However, such large pressure forcing would give rise to significant departures from spherical oscillations.
We repeated the same experiment with the pressure amplitude fixed at  $p_A=0.24$ atm but with varying the equilibrium bubble radius $R_0$, which allows for constructing the resonance curve (including the data from figures 6 and 7) for the finite-amplitude bubble oscillations as presented in figure 8. For easier comparison, the resonance curve of the small-amplitude oscillations is also included in this figure. The resonance curve of the large-amplitude oscillations shows nonlinear characteristics. To be specific, the peak is shifted to the smaller equilibrium radius or the resonant bubble radius is reduced in other words. This nonlinear feature is known as spring softening and is reported in numerical studies for bubbles in water (Lauterborn Reference Lauterborn1976; Fujiwara & Shima Reference Fujiwara and Shima1980; Kubo et al. Reference Kubo, Sato, Ito and Sugiura2012). While bubbles oscillating in water give rise to fission (Brennen Reference Brennen2002), the bubbles in the gel are rather stable against fission, allowing for experimental confirmation of the spring softening feature.

Figure 8. Resonance curve of the finite-amplitude oscillations (under the 28 kHz ultrasound irradiation with  $p_A \approx 0.24$ atm) as a function of the equilibrium bubble radius $R_0$; for reference, that of the small-amplitude oscillations (under the ultrasound irradiation with $p_A \approx 0.03$ atm in figure 5) is also shown. The filled circles represent the experiments: the green and red ones show the cases in figures 6 and 7, respectively. The lines are the resonance curves obtained from numerical simulation of the full model (§ 2.1) with varying the shear viscosity and shear modulus of the gel.
4.3. The role of viscoelasticity
Finally, we conduct parametric studies on the resonance curve with the shear viscosity and shear modulus to discuss the role of viscoelasticity. In figure 8, the solid blue line is the resonance curve obtained from the full model with the gel's shear viscosity and shear modulus  $\mu = 18.3 \ \textrm {mPa}\,\textrm {s}$ and $G = 4.0 \ \textrm {kPa}$. In addition, the resonance curves obtained from the full model with no shear viscosity $\mu = 0$ and doubled shear viscosity $\mu = 36.6 \ \textrm {mPa}\,\textrm {s}$ (but with the same shear modulus) are shown as red lines, and those with no shear modulus $G = 0$ and doubled shear modulus $G = 8.0 \ \textrm {kPa}$ (but with the same shear viscosity) are shown as green lines. Shear viscosity suppresses the oscillation amplitude, thus reducing the soft spring feature and increasing the resonant bubble radius. Shear modulus increases the resonant bubble radius, while it has a small impact on the oscillation amplitude.
The discrepancy in the resonance curves for the higher-intensity ultrasound between the experiment and the full model ( $\mu =18.3$ mPa and $G=4.0$ kPa) is found to be emphasized especially for the case of the bubble whose equilibrium radius is smaller than the resonant radius. We note that all the experimental data reported in figure 8 are based on the same bubble nucleus and the order of the experimental runs is from the smallest to largest size of the bubble growing under gas supersaturation, with alternately using the higher- and lower-intensity ultrasound. We thus speculate that such a trend in the discrepancy is due to reduced viscosity and rigidity of the gel structure damaged by the larger bubble oscillations at the resonant condition (Movahed et al. Reference Movahed, Kreider, Maxwell, Hutchens and Freund2016). For example, the gel in figure 4 (corresponding to the red circle in figure 8) had already been damaged by larger-amplitude bubble oscillations at the stage of figure 7 (corresponding to the red filled circle in figure 8). This implies that our fitted viscoelastic parameters dominantly correspond to the damaged gel. This supports the observation that the full model with the higher viscoelastic coefficients (chain lines) yields better agreement with the experimental data for the smaller bubble near which the gel was not yet damaged significantly.
At this stage, we revisit the simulation results in figures 6(b) and 7(b), respectively, for the case of smaller- and larger-amplitude oscillations. In these simulations, we consistently use a viscosity of  $\mu =18.3$ $\textrm {mPa}\,\textrm {s}$ (fitted from the resonance curve in figure 5). However, there is no need to stick to the fitted value, for the gel damage is expected to occur during the repeated experiments with the same bubble oscillating at finite amplitude. To quantitatively illustrate the viscous effect on the bubble dynamics, we perform supplemental simulations for the cases of $\mu =0$ (inviscid) and $\mu =36.6$ $\textrm {mPa}\,\textrm {s}$ (doubled) and compare them with that with $\mu =18.3$ $\textrm {mPa}\,\textrm {s}$ in figures 11 and 12, respectively, for the smaller- and larger-amplitude oscillations (see Appendix A). If the oscillation amplitude is small as in figure 11, the bubble dynamics is rather insensitive to the value of $\mu$. On the contrary, as the oscillation amplitude gets larger as in figure 12, viscosity will play a more important role; we can clearly observe that the oscillation amplitude is reduced by viscous damping. When it comes to exploring a better fitting of the individual bubble dynamics simulation to the experiment particularly for the case of large-amplitude oscillations, we need to look, instead, for the optimum values of $\mu$ and $G$ for each experimental run with a specific bubble nucleus of $R_0$.
Finally, we make a comment on the non-spherical oscillations of mode 1 in figure 7(a). According to Murakami et al. (Reference Murakami, Gaudron and Johnsen2020), the most unstable mode  $n$ of non-spherical bubble oscillations may be predicted based on the $n$th-order natural frequency (of linearized oscillations),
 \begin{equation} \omega_n = \sqrt{ (n-1)(n+1)(n+2)\frac{\sigma}{\rho_0 R_0^{3}} + (n+1)\left[ 4+\frac{n(n+4)}{3} \right]\frac{G}{\rho_0 R_0^{2}} }. \end{equation}
This instability occurs when  $\omega =2{\rm \pi} f= 2\omega _n$. In the case in figure 7(a), the equilibrium radius is $R_0=107.8\ \mathrm {\mu }$m and the ultrasound frequency is fixed at $f=28$ kHz, which enables one to find the most unstable mode $n$ (given surface tension $\sigma$, density $\rho _0$ and shear modulus $G$ of the gel). If using $G=4.0$ kPa (i.e. the fitted value from the comparison between the linearized theory and the experiment of the small-amplitude oscillations in figure 5), the most unstable mode is predicted at $n=2$, which is inconsistent with the observed result ( $n=1$). However, following the observation in figure 8 that the nonlinear Rayleigh–Plesset calculation with the doubled shear modulus can yield a better prediction on the resonant bubble radius for the finite-amplitude oscillation, we may use $G=8.0$ kPa instead, leading to the most unstable mode at $n=1$. This suggests that the linear theory represented by (4.1) may be capable of predicting the most unstable mode appearing in finite-amplitude bubble oscillations, as in figure 7(a).
5. Conclusions
We studied, with experiments and simulation, nonlinear oscillations of a spherical bubble in a 6 wt% gelatin gel under 28 kHz ultrasound irradiation. Ultrasound intensity and the bubble radius at mechanical equilibrium were treated as parameters in our experiments. The shear viscosity and shear modulus of the gel were obtained by fitting the resonance curve of small-amplitude bubble oscillations as a function of the equilibrium radius to the linearized solutions of the Rayleigh–Plesset model that accounts for the gel's elasticity. We also obtained the resonance curve for larger-amplitude bubble oscillations experimentally and numerically, showing the so-called spring softening effect. To reproduce the experimentally determined resonance curve for larger-amplitude oscillations, it is of great importance to properly select coefficients of the gel viscoelasticity in the Rayleigh–Plesset model, for the resonant radius and peak amplitude are sensitive to the shear modulus and viscosity, respectively. On the other hand, when it comes to exploring a better fit of individual bubble dynamics simulation to the observation of a given experimental run, we need to look for the optimum coefficients of the gel viscoelasticity, instead of those determined from the fitting to the resonance curve for the smaller-amplitude oscillations, as inferred from the supplemental simulations. This implies that the gel structure in the vicinity of the bubble nucleus is expected to be damaged by finite-amplitude oscillations of the bubble.
In our experiments, we observed non-spherical bubble oscillations of mode 1, while we put a focus on spherical bubble dynamics in this study. It is expected that higher-mode shape oscillations appear as gel concentration or ultrasound frequency is reduced (Hamaguchi & Ando Reference Hamaguchi and Ando2015; Murakami et al. Reference Murakami, Gaudron and Johnsen2020). Our results showed that the amplitude of volume oscillations of the bubble with the shape oscillations is overestimated by the Rayleigh–Plesset-type simulation, which is a critical drawback when it comes to predicting bubble collapse pressure in the context of therapeutic ultrasound. One future work of interest is to examine effects of shape oscillations on the pressure of bubbles collapsing in viscoelastic solids.
Acknowledgements
The authors would like to express their thanks to A. Inatomi for his help with the experimentation, and T. Katashima and T. Sakai for their comment on gel rheology.
Funding
K.A. acknowledges support by JSPS KAKENHI (grant no. 17H04905), Precise Measurement Technology Promotion Foundation (PMTP-F), and Creativity Initiative of the Research Project Keio 2040. E.J. acknowledges support by ONR grant N00014-17-1-2058 (under Dr. T. Bentley). K.M. acknowledges the Overseas Scholarship from the Funai Foundation for Information Technology.
Declaration of interests
The authors report no conflict of interest.
Appendix A. Supplemental simulations
First, we perform the bubble-dynamic simulation with the same condition as in figure 7(b) (based on the nonlinear elasticity model of neo-Hookean type) but with the linear elasticity model (Hamaguchi & Ando Reference Hamaguchi and Ando2015) and make a comparison between the two cases in figure 9. We also perform the same simulations based on the linear and nonlinear elasticity models but with the acoustic pressure  $p_A$ set at 10 times larger than that in figure 7, and compare them in figure 10. These supplemental figures support discussion in § 4.2.

Figure 9. As figure 7(b), but with comparison with the case of the linear elasticity model with  $G=4.0$ kPa.

Figure 10. As figure 9, but with the acoustic pressure  $p_A$ set at 10 times.
Second, we perform the bubble-dynamic simulations as in figure 6(b) (for the case of smaller-amplitude oscillation under  $f/f_R=1.06$) and figure 7(b) (for the case of larger-amplitude oscillation under $f/f_R=0.93$) with rigidity fixed at $G=4.0$ kPa, but with varying viscosity $\mu$; see figures 11 and 12, respectively, for the smaller- and larger-amplitude oscillations. These parametric studies support the discussion in § 4.3.

Figure 11. As figure 6(b) for the case of  $f/f_R=1.06$ with $G=4.0$ kPa, but with different viscosity $\mu$.

Figure 12. As figure 7(b) for the case of  $f/f_R=0.93$ with $G=4.0$ kPa, but with different viscosity $\mu$.


 Open access