


1. Introduction
Large-scale pulsating bubbles are affected by two opposite pressure gradients near the free surface, including the upward pressure gradient from the free surface and the downward hydrostatic pressure gradient, which are closely related to underwater explosions (Klaseboer et al. Reference Klaseboer, Hung, Wang, Wang, Khoo, Boyce, Debono and Charlier2005a; Song et al. Reference Song, Chen, Long, Zhong and Wu2017; Javier et al. Reference Javier, Galuska, Papa, LeBlanc, Matos and Shukla2021; Nguyen et al. Reference Nguyen, Phan, Duy and Park2021), air-gun exploration (Ziolkowski et al. Reference Ziolkowski, Parkes, Hatton and Haugland1982; Babak & Martin Reference Babak and Martin2018; Khodabandeloo & Landro Reference Khodabandeloo and Landro2018; Ziolkowski Reference Ziolkowski2021) and submarine volcanic eruptions (Lyons et al. Reference Lyons, Haney, Fee, Wech and Waythomas2019; Mendoza, Clemente & Hernandez Reference Mendoza, Clemente and Hernandez2020). In some cases, the upward buoyancy essentially balances the effect of the free surface, causing the bubble to bear no upward or downward momentum at the end of bubble collapse, which is called ‘vertically neutral collapse’ in this study. The bubble has no migration trend in the vertical direction in the ‘vertically neutral collapse’ state, and similar features also occur when a buoyant bubble is near the rigid bottom (Brujan, Pearson & Blake Reference Brujan, Pearson and Blake2005), when a cavity is near the composite surfaces (Shima et al. Reference Shima, Tomita, Gibson and Blake1989) or in a liquid gap (Gonzalez-Avila et al. Reference Gonzalez-Avila, Evert, Boo Cheong and Claus-Dieter2011). When the vertically neutral collapse occurs, the bubble behaviour is more complicated than those cases when a Bjerknes force from any boundary dominates (Blake, Taib & Doherty Reference Blake, Taib and Doherty1986, Reference Blake, Taib and Doherty1987). An in-depth understanding of the vertically neutral collapse of bubbles, such as bubble morphology and jet direction, can help to rationalize the use of explosives or air-guns and prevent disasters caused by buoyant bubbles.
Bubble dynamics in the vicinity of a single free surface have been extensively studied in previous works. When the buoyancy effect is weak, the generation of a downward liquid jet is the most essential feature of the bubble (Chahine Reference Chahine1977; Blake Reference Blake1981; Tomita, Kodama & Shima Reference Tomita, Kodama and Shima1991; Li et al. Reference Li, Zhang, Wang, Li and Liu2019b; Saade et al. Reference Saade, Jalaal, Prosperetti and Lohse2021; Zhang et al. Reference Zhang, Li, Cui, Li and Liu2023a). As the buoyancy increases, the influence of the free surface on the downward bubble migration is counteracted to varying degrees, resulting in vertically neutral collapses or upward liquid jets (Blake et al. Reference Blake, Taib and Doherty1987; Wang et al. Reference Wang, Yeo, Khoo and Lam1996a,Reference Wang, Yeo, Khoo and Lamb; Zhang et al. Reference Zhang, Cui, Cui and Wang2015; Li, Zhang & Liu Reference Li, Liu, Wang and Zhang2021; Liu et al. Reference Liu, Zhang, Miao, Ming and Liu2023). However, in practical cases, other boundaries, such as the seacoast or structures, often exist in the neighbourhood of the bubble below the free surface. As vertically neutral collapse occurs, the bubble undergoes no obvious upward or downward migration. Thus, the bubble migrates only towards the surrounding structure, damaging the structure directly (Lechner et al. Reference Lechner, Koch, Lauterborn and Mettin2017, Reference Lechner, Lauterborn, Koch and Mettin2019; Tian et al. Reference Tian, Liu, Zhang, Tao and Chen2020) or by transferring energy to suspended solids in water (Borkent et al. Reference Borkent, Arora, Ohl, De Jong, Versluis, Lohse, Mørch, Klaseboer and Khoo2008; Wu et al. Reference Wu, Zuo, Stone and Liu2017; Zhang et al. Reference Zhang, Xie, Zhang, Zhang and Du2019). However, it is difficult to determine the direction and intensity of bubble migration due to the complicated behaviour of the bubble as vertically neutral collapse occurs, which is a motivation of this study.
Previous studies on the interaction between the bubble and nearby structures below the free surface have paid more attention to the physical phenomena in some specific engineering scenarios, such as the rise and fall of the free surface (Liu et al. Reference Liu, Wang, Wang and Zhang2016; Zhang et al. Reference Zhang, Zhang, Wang and Cui2017), interaction between the bubble and a vessel (Klaseboer, Khoo & Hung Reference Klaseboer, Khoo and Hung2005b; Zhang & Zong Reference Zhang and Zong2011; Zhang, Zong & Zhang Reference Zhang, Zong and Zhang2014), and deformation of the floating structure caused by bubble pulsations (Klaseboer et al. Reference Klaseboer, Hung, Wang, Wang, Khoo, Boyce, Debono and Charlier2005a; Zong et al. Reference Zong, Wang, Zhou and Zhang2015). Some parametric analysis of the bubble collapse has been conducted: Kiyama et al. (Reference Kiyama, Shimazaki, Gordillo and Tagawa2021) and Tagawa & Peters (Reference Tagawa and Peters2018) used the method of images to develop a theoretical model for determining the jet direction when a cavity is near a corner; Molefe & Peters (Reference Molefe and Peters2019) studied the jet direction when a cavity is within rectangular and triangular channels; Andrews, Rivas & Peters (Reference Andrews, Rivas and Peters2020) predicted the jet direction near a slot with the boundary integral method (BIM); and Brujan conducted comprehensive studies on the corner of two or three rigid boundaries (Brujan et al. Reference Brujan, Noda, Ishigami, Ogasawara and Takahira2018; Brujan, Hiroyuki & Toshiyuki Reference Brujan, Hiroyuki and Toshiyuki2019; Brujan et al. Reference Brujan, Zhang, Liu, Ogasawara and Takahira2022). These parametric studies provide references for quantifying the collapse characteristics of bubbles, but no buoyant bubbles are involved in their works. However, the strong buoyancy effect for large-scale bubbles would change the collapse characteristics of bubbles significantly. In our previous studies (Li et al. Reference Li, Zhang, Wang and Zhang2019a), the jet characteristics are investigated for typical buoyancy effects when the bubble is initiated near a free surface and two crossed walls. However, as a special case, a theoretical criterion for the occurrence of vertically neutral collapse and quantitative analysis of bubble dynamics are worthy of further study, which will help to enhance the understanding of bubble dynamics in the entire buoyancy-distance parameter domain and better control the effects of bubble collapse. In general, systematic research on the dynamics of bubbles with obvious buoyancy near the free surface and structures was rare in previous studies, which is an important purpose behind this study.
In this study, we combine theoretical and numerical methods to study the vertically neutral collapse of a pulsating bubble at the corner of the free surface and a semi-infinite vertical rigid wall, which is the most fundamental physical scene for bubble dynamics affected by nearby structures below the free surface. An in-depth understanding of the physical mechanisms for such basic boundary conditions can provide a foundation for solving more complex problems in the future. First, the occurrence condition for vertically neutral collapses is one of the difficult issues. Kelvin impulse theory provides a valuable way to link the buoyancy of the bubble and the distances to boundaries. The Kelvin impulse, which is the time integral of the force acting on the bubble surface, was used by Blake et al. (Reference Blake, Taib and Doherty1986, Reference Blake, Taib and Doherty1987) to determine the jet direction of a buoyant bubble near a single wall or free surface. A quantitative relationship between the buoyancy and the distance parameters (we call it the ‘Blake criterion’) is given in his works. Brujan et al. (Reference Brujan, Pearson and Blake2005) also concluded that the Kelvin impulse can reflect the jet pattern and orientation near a rigid wall, and other applications, including the inertial boundary and two-fluid interface, were also well developed (Blake, Leppinen & Wang Reference Blake, Leppinen and Wang2015; Han et al. Reference Han, Zhang, Tan and Li2022). Based on their ideas that we combine with the method of the mirror source/sink, we deduce and develop the quantitative relationship among the buoyancy, the bubble-free surface distance and the bubble–wall distance when vertically neutral collapse occurs.
Regarding the numerical method, the BIM has been widely applied in modelling bubble dynamics because of its high accuracy and efficiency in dealing with the three-dimensional problem (Shima & Sato Reference Shima and Sato1980; Wang & Blake Reference Wang and Blake2010, Reference Wang and Blake2011; Zhang & Liu Reference Zhang and Liu2015; Li et al. Reference Li, Zhang and Liu2021; Zhang et al. Reference Zhang, Li, Cui, Li and Liu2023b). Therefore, BIM is adopted to simulate the behaviour of the bubble and free surface, with the rigid wall equivalent to the mirror bubble and free surface. The free surface is processed as an open plane instead of a closed area to improve the computational accuracy and efficiency. The numerical codes are validated against several buoyant bubble experiments.
Finally, a comprehensive study on the vertically neutral collapse characteristics over a large parametric range (except for those cases where the bubble contacts boundaries) is carried out. Four collapse patterns of the bubble are performed based on the distance to boundaries, i.e. ‘formally downward jet’, ‘annular collapse’, ‘horizontal jet’ and ‘weak jet’. Among them, in the ‘horizontal jet’ pattern, the bubble only migrates towards the rigid wall, and this pattern occupies most of the parameter domain of interest. Therefore, we conduct parametric research on the essential features, including the moment of the jet impact, jet velocity and bubble displacement. Compared with the situation in which a cavity is near a single rigid wall (Supponen et al. Reference Supponen, Obreschkow, Tinguely, Kobel, Dorsaz and Farhat2016), the power laws of the three characteristic parameters with the theoretical Kelvin impulse are found and summarized.
The structure of this paper is as follows. We first present the numerical method in § 2 and define the standard of the vertically neutral collapse in § 3. The theoretical conditions for the vertically neutral collapse of a spherical bubble are derived using Kelvin impulse theory in § 4. Moreover, several mechanistic experiments are used to verify the numerical algorithm in § 5. Then, we discuss the applicability of Kevin impulse theory in § 6. Four typical features for vertically neutral bubble collapse are illustrated in § 7. Finally, we carry out the parameter analysis on the most important feature (‘horizontal jet’) in § 8 and summarize the work in § 9.
2. Physical model
2.1. Parameter definition
The schematic representation of the physical model is illustrated in figure 1. The origin is taken at the centre of the initial bubble, with the  $y$-axis horizontally to the right and the $z$-axis vertically upward. The vertical rigid wall intersects the free surface in the negative $y$-axis direction, as shown in the left half of figure 1. Two distance parameters are studied: the bubble-free surface distance $d_{{f}}$ and bubble–wall distance $d_{{w}}$. In subsequent theoretical derivations, three singularities are adopted to include the influence of the free surface and sidewall, as shown in the right half of figure 1. The positive circle denotes the same source/sink strength as the bubble, and the negative circles indicate the converse strength.

Figure 1. Schematic of the physical model.
2.2. Numerical implements
To obtain the general results, all physical quantities are dimensionless unless otherwise specified. The bubble radius at the maximum volume  $R_{{m}}$ is taken as the reference length, with the density of the liquid $\rho$ as the reference density and the hydrostatic pressure at the origin $P_{{a}}$ as the reference pressure. We first provide the three most important dimensionless parameters, namely, the bubble-free surface distance $\gamma _{{f}}$, the bubble–wall distance $\gamma _{{w}}$ and the buoyancy parameter $\delta$:
 \begin{equation} {\gamma_{{f}}} = \frac{{{d_{{f}}}}}{{{R_{{m}}}}},\quad {\gamma_{{w}}} = \frac{{{d_{{w}}}}}{{{R_{{m}}}}},\quad\delta = \sqrt {\frac{{\rho g{R_{{m}}}}}{{{P_{a}}}}}. \end{equation}
The bubble pulsation in this study is a transient process that begins with an initial small high-pressure bubble. The flow field can be reasonably regarded as inviscid, irrotational and incompressible (Blake & Gibson Reference Blake and Gibson1987; Wang & Blake Reference Wang and Blake2010). Therefore, the potential flow theory is adopted to control the fluid domain and the fluid velocity potential satisfies the Laplace equation:
 \begin{equation} {\nabla^2}\varphi = 0, \end{equation}
where  $\varphi$ represents the dimensionless velocity potential with the reference quantity of ${R_m}\sqrt {P_a/\rho }$.
Equation (2.2) can be transformed into the boundary integral equation (Wang Reference Wang2013; Wang, Kawa & Michael Reference Wang, Kawa and Michael2015) by Green's three theorems:
 \begin{equation} \lambda \varphi = \oint\limits_s {\left( {G_r\frac{{\partial \varphi }}{{\partial n}} - \varphi\frac{{\partial G_r}}{{\partial n}}} \right){\rm d}s} , \end{equation}
where  $\lambda$ is the solid angle, $s$ is the surface of all boundaries and $G_r$ is the Green function ( $G_r = 1/|{\boldsymbol {p} - \boldsymbol {q}}|$; $\boldsymbol {p}$ is the field point and $\boldsymbol {q}$ is the integral point).
The dynamic boundary conditions (Chahine et al. Reference Chahine, Kapahi, Choi and Hsiao2016; Gong et al. Reference Gong, Ohl, Klaseboer and Khoo2018) for the bubble surface and the free surface are determined by the Bernoulli equation:
 $$\begin{gather}
\frac{{{\rm d}\varphi}}{{{\rm d}t}} = 1 - \varepsilon {\left( {\frac{V_o}{{{V}}}} \right)^{\kappa} } + \frac{1}{2}{\left| {\nabla \varphi} \right|^2}- {\delta ^2}z
\end{gather}$$
$$\begin{gather}
\frac{{{\rm d}\varphi}}{{{\rm d}t}} = 1 - \varepsilon {\left( {\frac{V_o}{{{V}}}} \right)^{\kappa} } + \frac{1}{2}{\left| {\nabla \varphi} \right|^2}- {\delta ^2}z
\end{gather}$$ $$\begin{gather}\frac{{{\rm d}\varphi}}{{{\rm d}t}} = \frac{1}{2}{\left| {\boldsymbol{\nabla} \varphi} \right|^2} - {\delta ^2}( z - \gamma_{{f}} ), \end{gather}$$
where  $\varepsilon$ is the strength parameter denoting the dimensionless initial inner pressure of the bubble; $V_o$ and $V$ are the bubble volumes at the initial and present moment, respectively; and $\kappa$ is the ratio of specific heats.
The boundary consists of three parts: the bubble surface, the free surface and the rigid sidewall. The rigid wall can be included by the influence of the symmetrical bubble and free surface about the wall. The boundary integral equation is ultimately discretized into a matrix form:  $G_{ij} \partial \varphi _{j}/\partial n_{j} = H_{ij} \varphi _{j}$. The calculation method of $G_{ij}$ and $H_{ij}$ and the implementation of the matrix can be found in the previous literature (Wang et al. Reference Wang, Kawa and Michael2015). Notably, two bubbles and an infinite free surface, including the real and mirrored nodes, are considered in the matrix here.
Since (2.3) requires the computed boundaries to form a closed surface, additional nodes must be discretized above the free surface, reducing the computational efficiency and accuracy. In this study, the influence of additional nodes is included by the induced velocity potential of a virtual vortex based on the equivalence of a vortex ring and the distributed dipole (Zhang et al. Reference Zhang, Yeo, Khoo and Wang2001). The virtual vortex ring consists of the outermost circle of the meshed free surface. The scale of the free surface established in numerical simulations is 15 times  $R_{m}$ to reduce the error caused by the influence of the far-field free surface to less than 1 % (Liu et al. Reference Liu, Wang, Wang and Zhang2016). Here, we provide a modified expression for the diagonal elements of the matrix $H$:
$H$:
 \begin{equation} {H_{ii}} =- \sum_{j = 1,n \atop j \ne i} {{H_{ij}}} - \frac{1}{{4{\rm \pi} }}\oint\limits_{{C_1} + {C_2}} {\left( {\frac{{{r_z}}}{{\sqrt {{r_x}^2 + {r_y}^2 + {r_z}^2} }} - 1} \right)\frac{{{\rm d}{l_x}\, {\cdot}\, {r_y} - {\rm d}{l_y}\, {\cdot}\, {r_x}}}{{{r_x}^2 + {r_y}^2}}} - 1, \end{equation}
where  $i$ and $j$ are the node numbers; $C_1+C_2$ is the virtual vortex consisting of the outermost circle of the real and mirrored free surface; $\boldsymbol {r}$ is the vector from the virtual vortex ring to the nodes on the boundary; taking the normal direction of the virtual vortex as the $z$ direction, $r_x$, $r_y$ and $r_z$ are the three components of $\boldsymbol {r}$ in the local coordinate system; and ${\rm d} \boldsymbol {l}$ is the element vector of the virtual vortex with the two tangential components of ${\rm d}l_x$ and ${\rm d}l_y$.
Finally, we merge the symmetrical parts of matrices  $G$ and $H$ with the rigid wall according to the image method. In this way, the matrix dimension can be reduced by half when the matrix $G$ is inverted.
2.3. Vortex model
In some cases, the bubble becomes a ring-shaped bubble due to the collision of the bubble walls, and the velocity potential of the bubble surface is no longer a single-valued function. A 3D vortex model is used to address this problem by adding a vortex ring inside the bubble, which has been fully developed in bubble dynamics (Wang & Blake Reference Wang and Blake2011; Li et al. Reference Li, Han, Zhang and Wang2016). Then,  $\varphi$ is decomposed into the induced velocity potential $\varphi _{v}$ and the residual velocity potential $\varphi _{r}$:
 \begin{equation} \varphi = \varphi _{v} + \varphi _{r}. \end{equation}
 The residual velocity potential  $\varphi _{r}$ can be updated according to the process in § 2.2, while the induced velocity $u_{v}$ and velocity potential $\varphi _{v}$ need to be calculated by Biot–Savart's law and a semi-analytic method (Zhang & Liu Reference Zhang and Liu2015), respectively:
 $$\begin{gather} {u_{{v}}} = \frac{{K}}{{4{\rm \pi} }}\oint\limits_{{C'_1} + {C'_2}} {\frac{{\boldsymbol{r} \times {\rm d} {\boldsymbol{l}}}}{{{{\left| {\boldsymbol{r}} \right|}^3}}}} , \end{gather}$$
 $$\begin{gather}{\varphi _v} = \frac{K}{{4{\rm \pi} }}\oint\limits_{{C'_1} + {C'_2}} {\left( {\frac{{{r_z}}}{{\sqrt {{r_x}^2 + {r_y}^2 + {r_z}^2} }} \pm 1} \right)\frac{{{\rm d}{l_x}\, {\cdot}\, {r_y} - {\rm d}{l_y}\, {\cdot}\, {r_x}}}{{{r_x}^2 + {r_y}^2}}} , \end{gather}$$
where  $K$ is the jump of the velocity potential on the impacted nodes; the definitions of $\boldsymbol {r}$ and ${\rm d} \boldsymbol {l}$ are the same as those in (2.6) with the normal direction of the vortex inside the bubble as the $z$ direction; $C'_1$ and $C'_2$ denote the vortex ring inside the bubble and its mirror with the sidewall, respectively; and ‘ $\pm$’ depends on the position of nodes in which ‘ $+$’ is adopted when the nodes are underneath the vortex and ‘ $-$’ is employed otherwise.
3. Definition of vertically neutral collapse
In this study, the vertically neutral collapse of a bubble means that the vertical momentum of the bubble is zero at the end of collapse; that is, the bubble has no tendency to continue migrating vertically after the first cycle of pulsation. Since the migration velocity of the bubble is zero, the momentum of the bubble can be calculated by the Kelvin impulse (Blake et al. Reference Blake, Taib and Doherty1986, Reference Blake, Taib and Doherty1987), which is the time integral of the ‘forces’ acted upon by the buoyancy and boundaries:
 \begin{equation} \boldsymbol{I}_{b} = \oint\limits_{s_{{b}}} {\varphi {\boldsymbol{n}}\,{\rm d}s}, \end{equation}
where  $s_{{b}}$ and $\boldsymbol {n}$ are the bubble surface and its unit normal vector, respectively.
In BIM simulations, the bubble undergoes large deformation, resulting in an uneven distribution of the velocity potential on the bubble surface. The Kelvin impulse of the bubble can be obtained by integrating the velocity potential of the bubble surface through (3.1). In this study, we define the Kelvin impulse of the bubble in numerical simulations as  $\boldsymbol {I}_{s}$:
 \begin{equation} \boldsymbol{I}_{s} = \sum_{i=1}^{m} \varphi_{i} s_{i} \boldsymbol{n_{i}}, \end{equation}
where  $m$ is the number of elements on the bubble surface; and $\varphi _{i}$, $s_{i}$ and $n_{i}$ denote the velocity potential, area and unit normal vector of element $i$, respectively.
Here,  $\boldsymbol {I}_{s}$ is used to reflect the momentum of the deformable bubble in the simulations. Thus, ${I}_{sz}=0$ ( ${I}_{sz}$ denotes the component along the $z$ axis) at the end of bubble collapse is the standard to determine the vertically neutral collapse state.
4. Kelvin impulse theory based on the assumption of spherical bubbles
When we ignore the deformation of the bubble and regard it as a time-varying point source or sink, the expression of the above equation under different boundary conditions can be solved theoretically. For example, two equal-intensity point sources are equivalent to an infinite rigid wall on their perpendiculars, and one point source plus one equal-intensity sink are equivalent to a free surface without fluctuations. The velocity potential produced by a point source with an intensity of  $m(t)$ and at a point $(x_0, y_0, z_0)$ is
 \begin{equation} \varphi =- \frac{{m\left( t \right)}}{{4{\rm \pi} \sqrt {{{\left( {x - {x_0}} \right)}^2} + {{\left( {y - {y_0}} \right)}^2} + {{\left( {z - {z_0}} \right)}^2}} }}. \end{equation}
 Since the bubble is regarded as a point source, the influence of the boundary can be equivalent to one point source symmetric to the rigid wall and two sinks symmetric to the free surface, as shown in figure 1. Thus, the induced velocity  $\varphi$ at the bubble can be written as
 \begin{equation} \boldsymbol{\nabla} \varphi =- \frac{{m\left( t \right)}}{{4{\rm \pi} }}\left( { - \frac{1}{{{{\left( {2{\gamma _{{w}}}} \right)}^2}}}{\boldsymbol{y}} + \frac{1}{{{{( {2{\gamma _{{f}}}} )}^2}}}{\boldsymbol{z}} + \frac{1}{{{{\left( {2\sqrt {\gamma _{{w}}^2 + \gamma _{{f}}^2} } \right)}^2}}}\frac{{ - {\gamma _{{w}}}{\boldsymbol{y}} + {\gamma _{{f}}}{\boldsymbol{z}}}}{{\sqrt {\gamma _{{w}}^2 + \gamma _{{f}}^2} }}} \right). \end{equation}
The Kelvin impulse of the bubble caused by the boundaries (Best & Blake Reference Best and Blake1994) can be obtained from
 \begin{equation} I = \int_0^t { - m(t)\boldsymbol{\nabla} \varphi \,{\rm d}t}, \end{equation}
where the source intensity  $m(t)$ is calculated by the pulsation velocity of the Rayleigh bubble (Blake et al. Reference Blake, Taib and Doherty1987; Rayleigh Reference Rayleigh1917) with the constant inner bubble pressure of saturated vapour pressure:
 \begin{equation} m\left( t \right) = 4{\rm \pi} {R^2}\sqrt {\frac{2}{3}\left( {\frac{1}{{{R^3}}} - 1} \right)}. \end{equation}
Taking into account the buoyancy effect, the Kelvin impulse is transformed into
 \begin{align} I &= \oint\limits_{s'} {\left( { - m(t)\boldsymbol{\nabla} \varphi + {\delta ^2}{\boldsymbol{z}}} \right){\rm d}s'} \nonumber\\ & = \frac{1}{{4{\rm \pi} }}\left( { - \frac{1}{{{{\left( {2{\gamma _{{w}}}} \right)}^2}}}y + \frac{1}{{{{( {2{\gamma _{{f}}}} )}^2}}}{\boldsymbol{z}} + \frac{1}{{{{\left( {2\sqrt {\gamma _{{w}}^2 + \gamma _{{f}}^2} } \right)}^2}}}\frac{{ - {\gamma _{{w}}}{\boldsymbol{y}} + {\gamma _{{f}}}{\boldsymbol{z}}}}{{\sqrt {\gamma _{{w}}^2 + \gamma _{{f}}^2} }} + {\delta ^2}{\boldsymbol{z}}} \right)\int\limits_0^t {{m^2}(t)\,{\rm d}t} . \end{align}
 Simplifying the above formula, the value of the Kelvin impulse components  $(t=1.83)$ in the horizontal and vertical directions can be obtained:
 $$\begin{gather} {I_y} = \frac{{2\sqrt 6 {\rm \pi}}}{9}\left[ {\left( {\frac{1}{{\gamma _{{w}}^2}} - \frac{1}{{\gamma _{{w}}^2 + \gamma _{{f}}^2}}\frac{{{\gamma _{{w}}}}}{{\sqrt {\gamma _{{w}}^2 + \gamma _{{f}}^2} }}} \right)} \right]B\left( {\frac{7}{6},\frac{3}{2}} \right), \end{gather}$$
 $$\begin{gather}{I_z} = \frac{{2\sqrt 6 {\rm \pi}}}{9}\left[ {\left( {\frac{1}{{\gamma _{{f}}^2}} + \frac{1}{{\gamma _{{w}}^2 + \gamma _{{f}}^2}}\frac{{{\gamma _{{f}}}}}{{\sqrt {\gamma _{{w}}^2 + \gamma _{{f}}^2} }}} \right)B\left( {\frac{7}{6},\frac{3}{2}} \right) - 2{\delta ^2}B\left( {\frac{{11}}{6},\frac{1}{2}} \right)} \right], \end{gather}$$
where  $\boldsymbol {B}$ is the beta function.
We let  $I_z$ be zero, and we obtain the algebraic relationship for vertically neutral collapse of a spherical bubble (the process can be seen in Appendix A):
 \begin{equation} {\gamma _{{f}}}\delta = 0.442\sqrt {1 + {{\sin }^3}\left( {\arctan \left( {\frac{{{\gamma _{{f}}}}}{{{\gamma _{{w}}}}}} \right)} \right)}. \end{equation}
 When the vertical wall does not exist, the above formula degenerates into the classical ‘Blake criterion’ ( ${\gamma _{{w}}} \to \infty$) for determining the direction of the bubble jet in the vicinity of the single free surface:
 \begin{equation} {\gamma _{{f}}}\delta = 0.442. \end{equation}
5. Comparison between the numerical and experimental results
To validate the numerical procedure used in this paper, three buoyant bubble experiments are compared with the computed bubble dynamics. First, two sets of underwater explosions are conducted in a  $4\ {\rm m}\times 4\ {\rm m} \times 4\ {\rm m}$ steel water tank, and a detailed introduction of the experimental site and devices can be found in the works of Liu et al. (Reference Liu, Zhang, Cui, Wang and Li2021). Combined with the idea of the image method, we place two explosives with the same equivalence horizontally to include the influence of the vertical rigid wall.
In the first case, 4 g Hexokin explosives generate a pulsating bubble with  $R_{m}$ of 26 cm. The two explosive charges are 70 cm apart and initially 40 cm below the free surface. Thus, the dimensionless distance and buoyancy parameters can be obtained: $\gamma _{w}=1.35$, $\gamma _{f}=1.54$ and $\delta =0.16$. We estimate the initial bubble radius $R_0$ in the numerical simulation by the traditional Rayleigh–Plesset equation (Plesset & Prosperetti Reference Plesset and Prosperetti1977), and an arbitrary choice in a reasonable range can be made for the initial strength parameter (120 in this study) because the numerical results are almost the same when it is set from 100 to 500 in dimensionless form (Turangan et al. Reference Turangan, Ong, Klaseboer and Khoo2006). The adiabatic coefficient $\kappa$ is taken as 1.22 to match the experimental bubble period since a small difference in the bubble period can be found when $\kappa$ is in the range from 1.1 to 1.4 (Li et al. Reference Li, Han, Zhang and Wang2016). Figure 2(a) shows a comparison of the bubble profile between the simulation and the experiment at typical moments during bubble collapse. The bubble is almost spherical during the expansion stage and thus not shown. Figure 2 shows the bubble profiles on the right, which indicates that a vertical rigid wall exists 35 cm from the initial bubble on the left. When the bubble expands to the maximum volume (the first frame), the bubble surface near the wall is slightly flattened. Subsequently, the upper bubble surface collapses downward at a larger velocity, forming an oblique downward liquid jet under the combined action of the free surface and the rigid wall (Frames 2–4). The bubble surface farther away from the rigid wall continuously collapses towards the wall (Frames 5 and 6). Finally, the liquid jet impacts the bubble surface to form a ring-shaped bubble (Frame 7). The numerical results reproduce the experimental phenomena well. To quantitatively validate the numerical results, we compare the displacements of the uppermost, lowermost, rightmost and leftmost points of the bubble surface with the experimental measurements, as shown in figure 2(b). The bubble displacement in the numerical simulation agrees well with the experimental measurements, with slight differences originating from measurement errors or the numerical smoothing techniques.

Figure 2. Experimental and numerical bubble dynamics of an underwater explosion bubble for  $\gamma _{w}=1.35$, $\gamma _{f}=1.54$ and $\delta =0.16$. (a) Comparison of the bubble profile at typical moments: the first row is the numerical results, and the colour of the bubble surface represents the velocity potential; the second row is the experimental results shot by a high-speed camera at a frame rate of $10\,000\ {\rm frames}\ {\rm s}^{-1}$; the frame number of each image is marked in the lower right corner, and the corresponding moment is marked in the upper left corner; the ruler of the pictures is drawn on the far left. (b) Comparison of the displacement curves of the uppermost, lowermost, rightmost and leftmost points of the bubble.
Next, we compare the other two buoyant bubble experiments with the computed bubble profiles because of the similar dynamic characteristics to the case of vertically neutral collapse, as shown in figure 3. The first case is the underwater explosion bubble, and the experimental system is the same as that in figure 2, as shown in figure 3(a). Two Hexokin explosives at a distance of 53 cm with a charge of 10 g are detonated at a depth of 1.8 m, producing two bubbles with a maximum radius of 35 cm. This is equivalent to a rigid wall placed 26.5 cm horizontally away from the bubbles. The dimensionless distance and buoyancy parameters are  $\gamma _{w}=0.75$, $\gamma _{f}=5.62$ and $\delta =0.17$. The dimensionless initial conditions of the bubble in the BIM model are the same as those in figure 2. During bubble expansion, the left side of the bubble is flattened by the equivalent rigid wall. An obliquely upward liquid jet is generated due to the weak effect of the free surface, which agrees with the computed bubble dynamics very well. If the explosive charge could be adjusted precisely to the case in which the buoyancy effect is exactly offset by the free surface, the bubble would reach the vertically neutral collapse state and the liquid jet would be directed horizontally.

Figure 3. Comparison of the bubble profile in simulations with two typical buoyant bubble experiments. (a) An underwater explosion experiment for  $\gamma _{w}=0.75$, $\gamma _{f}=5.62$ and $\delta =0.17$. (b) A buoyant bubble near a single free surface in a decompression tank for $\gamma _{f}=1.74$ and $\delta =0.248$ from the works of Zhang et al. (Reference Zhang, Cui, Cui and Wang2015). The ruler of the first three frames is drawn on the far left, and the three frames inside the black box are the enlarged view to visualize more details.
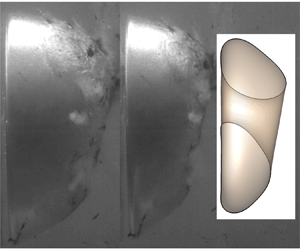
Figure 3(b) presents a spark-induced bubble near the single free surface with a stronger buoyancy effect ( $\delta =0.248$). The experimental image is obtained from Zhang et al. (Reference Zhang, Cui, Cui and Wang2015) by reducing the pressure of air to increase the buoyancy of bubbles. The initial dimensionless distance of the bubble from the free surface $\gamma _{ f}$ is 1.74. The computed initial conditions of the bubble are set to $\varepsilon =100$ and $\kappa =1.4$. The upper side of the bubble is first flattened under the action of the free surface, and subsequently, the left and right sides of the bubble sag inward. At the end of bubble collapse, an annular jet is formed accompanied by a bulge above the bubble. In this case, the bubble does not show obvious upward or downward migration, which is very close to the case of vertically neutral collapse. The computed bubble dynamics are compared with the experimental images at typical moments in which good agreement is achieved. Notably, the bubble in the numerical simulation is larger than the sparked-induced bubble near the minimum bubble volume (the last frame). The most likely reason for the visible discrepancies is the lack of the effect of non-equilibrium evaporation and condensation on the bubble surface in the numerical procedure. However, in general, the BIM simulation reproduces the main features of jet formation and development well.
6. Condition and error of vertically neutral collapse
The condition of vertically neutral collapse is associated with  $\delta$, $\gamma _{{f}}$ and $\gamma _{{w}}$. It is expected that the condition for a spherical bubble (4.8) can be applicable with acceptable errors when the bubble is relatively far from the boundaries. According to the definition of vertically neutral collapse in § 3, the absolute value of $I_{{sz}}$ at jet impact is regarded as the error (in a few cases, when the jet is too weak to impact the bubble surface, $I_{{sz}}$ at the moment of the minimum bubble volume is taken as the error). To clarify the condition and error of vertically neutral collapse, we use the buoyancy parameter $\delta$ calculated by (4.8) to model the bubble behaviour for various $\gamma _{{f}}$ and $\gamma _{{w}}$ in BIM simulations. Figure 4 shows the distribution of the errors for different $\gamma _{{f}}$ and $\gamma _{{w}}$. The value of the error decreases as the bubble moves away from the boundaries because the bubble is closer to spherical oscillation if it is less affected by the boundaries. A contour line with a magnitude of 3 % is plotted, as shown by the black dashed line in figure 4. Areas with an error higher than 3 % are mainly concentrated near the corner of the free surface and the rigid wall.

Figure 4. Distribution of errors for Kelvin impulse theory. The black dashed line indicates an error contour of 0.03.
In this study, we use the value of 3 % as an acceptable threshold of errors, which is attributed to the influence of the error on the characteristic parameters of the bubble. Figure 5 illustrates the variation of the bubble displacement  $D$ with $\gamma _{{w}}$ for three typical $\gamma _{{f}}$ values ( $\gamma _{{f}}=2$, 3 and 5), in which the blue line represents the result under the $\delta$ calculated using (4.8), and the result of the red line modifies (4.8) to make $|I_{{sz}}|$ drop below 0.01 by adjusting $\delta$. When $\gamma _{{f}} = 2$, a visible difference between the bubble displacement $D$ before and after modification occurs when $\gamma _{{w}}$ is less than approximately 1.5; when $\gamma _{{f}} = 3$, the visible difference occurs when $\gamma _{{w}}$ is less than 1.3; and when $\gamma _{{f}} = 5$, the bubble displacement before and after modification is almost the same. In these examples, the $\gamma _{{f}}$ and $\gamma _{{w}}$ corresponding to significant changes in the bubble displacement before and after modification almost fall on the contour line of 0.03 in figure 5. Therefore, in subsequent investigations, we adjust $\delta$ to reduce $I_{{sz}}$ below 0.03 to make the bubble reach a vertically neutral collapse state when $|I_{{sz}}|$ is greater than 0.03. In conclusion, (4.8) can accurately predict the vertically neutral collapse of the bubble when the error is within 0.03. If the bubble is near the boundaries when the error exceeds 0.03, $\delta$ needs to be obtained separately for the fixed $\gamma _{{f}}$ and $\gamma _{{w}}$ to match the vertically neutral collapse, and specific values of $\delta$ for different $\gamma _{{f}}$ and $\gamma _{{w}}$ are given in a later section.

Figure 5. Comparison of the bubble displacement before and after modification for different  $\gamma _{{f}}$ and $\gamma _{{w}}$. The results before modification are simulated directly using (4.8); the results after modification are corrected by adjusting $\delta$ until $|I_{{sz}}|$ is less than 0.01.
7. Results
Four typical collapse patterns are discussed in terms of the bubble behaviour, bubble migration and Kelvin impulse to gain a qualitative understanding of the vertically neutral collapse behaviour of bubbles. The dimensionless computed initial conditions of the bubble are set as  $R_0=0.14$, $\varepsilon =120$ and $\kappa =1.25$.
7.1. Formally downward jet
In the first case, the bubble initiated close to the free surface is considered for  $\gamma _{{f}} = 1$ and $\gamma _{{w}} = 2$. The bubble behaviour, the surrounding pressure and velocity field at typical moments are provided, as shown in figure 6. The bubble remains almost spherical for most of the expansion process. However, the free surface sinks the upper part of the bubble near the maximum bubble volume, so we show only the collapse process of the bubble. After the bubble reaches the maximum volume (the first frame), the free surface directly above the bubble is significantly raised. The upper part of the bubble is flattened, producing a downward liquid jet. This downward liquid jet results from the conserved momentum of the flow field and a local high-pressure zone between the bubble and free surface, as shown at $t=1.476$, which is observed and clarified in many works related to bubble-free surface interaction (Wang et al. Reference Wang, Yeo, Khoo and Lam1996a; Zhang et al. Reference Zhang, Zhang, Wang and Cui2017; Li et al. Reference Li, Zhang, Wang, Li and Liu2019b). After $t = 1.569$, the liquid jet impacts the lower bubble surface, and then the flow field becomes a double-connected region. Subsequently, the bubble rebounds with an annular shape. As seen from the last two frames, the lower part of the bubble produces an upwardly developing protrusion during the rebounding stage instead of developing downward. Although the jet direction is downward in the first cycle, the bubble exhibits no evident downward migration during the rebounding stage due to the buoyancy effect. We call this collapse pattern the ‘formally downward jet’.

Figure 6. Bubble behaviour and surrounding pressure distribution at the collapse stage for  $\gamma _{{f}} = 1$, $\gamma _{{w}} = 2$ and $\delta = 0.461$.
Interestingly, the ‘formally downward jet’ concept seems to challenge the premise of the ‘vertically neutral collapse’ state in terms of the jet morphology. To validate that the ‘formally downward jet’ is indeed in the ‘vertically neutral collapse’ state, figure 7 compares the bubble profile for three different buoyancy parameters ( $\delta =0.3, 0.461, 0.6$), under which the jetting behaviour of the bubble can be easily distinguished. Figures 7(a) and 7(b) show the evolution of bubbles for $\delta =0.3$ and 0.6, respectively. As $\delta =0.3$, after the liquid jet penetrates the lower bubble wall ( $t=1.701$), an obvious protrusion is formed on the lower bubble surface, which indicates that the downward momentum of the liquid jet is significantly higher than the upward momentum of the lower bubble wall. As $\delta =0.6$, the lower bubble surface is obviously concave upward driven by buoyancy in the collapse stage. At $t=1.701$, two opposite liquid jets are observed, but the upward momentum of the bubble plays a dominant role. After the two jets collide, the upward liquid jet continues to develop upward, creating a protrusion on the upper bubble surface. Unlike the case in figure 6, the bubble has significant downward or upward momentum at the collapse stage under these two $\delta$. Next, we compare the pressure distribution and velocity field surrounding the bubble at the moment of jet impact under the three $\delta$, as shown in figure 7(c). As $\delta$ increases, the high-pressure zone around the bubble gradually transitions from top-to-bottom. When $\delta$ is 0.461, this high-pressure area surrounds the right bubble surface, which confirms that the bubble is closest to the ‘vertically neutral collapse’ state under this $\delta$.

Figure 7. Comparison of bubble behaviours for different buoyancy parameters. Temporal development of the bubble shape for (a)  $\delta =0.3$, (b) $\delta =0.6$; (c) the pressure distribution surrounding the bubble at jet impact for three $\delta$.
If we use the  $\delta$ calculated directly by the ‘Blake criterion’, the buoyancy effect of the bubble is relatively weak ( $\delta =0.442$). Figure 8 shows the bubble shapes at the moment of the jet impact, the time-history curves of the centroid and the Kelvin impulse of the bubble under four $\delta$. The horizontal displacement of the bubble $C_y$ is very small during most of the pulsation period due to the downward liquid jet, except when the bubble migrates towards the wall significantly at the end of the collapse. The horizontal Kelvin impulse of the bubble $I_{{sy}}$ always remains negative, which is the reason why the bubble decelerates away from the wall in the first half of the cycle and accelerates towards the wall in the last half. The vertical migration of the bubble gradually changes from downward to upward with the increase in $\delta$. In the early stage of bubble expansion, $I_{{sz}}$ is negative, but $I_{{sz}}$ gradually becomes positive at the late stage of bubble collapse for $\delta =0.6$ and 0.461, resulting in the deflection in the direction of the vertical bubble migration. When the bubble reaches the vertically neutral collapse, $I_{{sz}}$ at the end of the bubble collapse is close to zero ( $|I_{{sz}}|<0.03$). Here, $I_{{sz}}$ at the end of the bubble collapse (0.024) is closer to zero for $\delta = 0.461$ than for the other three $\delta$ values. These results confirm that using our derived $\delta$ can predict the vertically neutral collapse of the bubble more accurately in this $\gamma _{{f}}$ and $\gamma _{{w}}$. As the bubble gradually approaches the vertically neutral collapse, $C_{z}$ and $I_{{sz}}$ decrease relative to $C_{y}$ and $I_{{sy}}$, respectively.

Figure 8. Time history curves of the bubble centre and Kelvin impulse in numerical simulations for different buoyancy parameters.
Next, we discuss the morphological changes of the bubble when  $\gamma _{{f}}$ and $\gamma _{{w}}$ decrease. Figure 9 shows the bubble shapes at the collapse stage when the bubble is closer to the wall ( $\gamma _{{f}}=1$, $\gamma _{{w}}=1.5$ and 0.9). When $\gamma _{{w}}=1.5$, compared with figure 6, the right bubble surface shrinks faster relative to the left part, resulting in the position of jet impact being closer to the right extremity of the bubble, as shown in figure 9(a). When $\gamma _{{w}}$ is less than 1 ( $\gamma _{{w}}=0.9$, as shown in figure 9b), the bubble surface close to the wall is flattened and the right lower surface of the bubble is also concave upward at the end of the bubble collapse, but the curvature of the upward concave surface is very small compared with the inclined downward liquid jet. Thus, we still regard this bubble collapse as the ‘formally downward jet’. At the moment of jet impact ( $t=1.614$), the curvature of the right surface of the bubble becomes high due to the local opposite developing direction of the bubble walls; thus, a focused local high-pressure zone is generated on the right extremity of the bubble. Had the simulations been allowed to continue, the right extremity of the bubble would splash and develop towards the wall.

Figure 9. Bubble shape and surrounding pressure distribution at typical moments for (a)  $\gamma _{{f}}=1$, $\gamma _{{w}}=1.5$ and $\delta = 0.472$ and (b) $\gamma _{{f}}=1$, $\gamma _{{w}}=0.9$ and $\delta = 0.515$.
Figure 10 shows the jetting behaviour of the bubble nearer to the free surface for  $\gamma _{{f}}=0.8$ and $\gamma _{{w}}=1.8$, 1.3 and 0.8. When $\gamma _{{w}}=1.8$, the bubble produces a downward jet under the action of the local high-pressure zone between the bubble and the free surface. Simultaneously, the higher hydrostatic pressure below the bubble also drives the lower bubble surface to collapse at a high speed. The pressure distribution surrounding the bubble is similar to the situation in figure 6, but the bubble shape is more symmetrical in the horizontal direction due to stronger free surface effects. As $\gamma _{{w}}$ decreases ( $\gamma _{{w}} = 1.3$), the bubble assumes a more asymmetric shape at the collapse stage, and the jet is more inclined to the wall under the action of the more asymmetric pressure and velocity field. When $\gamma _{{w}}$ is less than 1 ( $\gamma _{{w}}=0.8$), the bubble surface close to the wall is flattened and the downward liquid jet is more inclined to the wall. At the moment of jet impact, a focused local high-pressure zone is formed on the side of the bubble farther away from the wall, which is similar to figure 9(b). However, for this $\gamma _{{f}}$, the stronger free surface effect causes the liquid jet to develop downward more fully. It could be learned from the values of $\delta$ provided in figures 9 and 10 that (4.8) overestimates the buoyancy effect required for the vertically neutral collapse of the bubble in the near boundary region.

Figure 10. Bubble shape and surrounding pressure distribution at typical moments for (a)  $\gamma _{{f}}=0.8$, $\gamma _{{w}}=1.8$ and $\delta = 0.560$; (b) $\gamma _{{f}}=0.8$, $\gamma _{{w}}=1.3$ and $\delta = 0.562$; and (c) $\gamma _{{f}}=0.8$, $\gamma _{{w}}=0.8$ and $\delta = 0.565$.
7.2. Annular collapse
Figure 11 shows the bubble behaviour and surrounding pressure distribution at the collapse stage when  $\gamma _{{f}} = 2$, $\gamma _{{w}} = 4$ and $\delta = 0.231$ (the lift of the free surface is very weak; thus, it is not shown, and the same is true in the following pictures). In this case, the effect of the free surface in the vertical direction decreases, so the corresponding buoyancy is also weaker compared with that in figure 6. The liquids above and below the bubble flow more quickly than on the left and right sides during the bubble collapse. Thus, the bubble takes the shape of a horizontally placed egg (Frames 4–5). As a result, the greater curvature of the bubble surface near and away from the wall subsequently causes a faster contract velocity, which is the same result as Lauterborn's statements (Lauterborn Reference Lauterborn and Wijngaarden1982) on the pulsating velocity of the bubble: the bubble surface with higher curvature shrinks quicker and is more prone to jets. An asymmetric annular jet (Frame 7) is formed under the action of two local high-pressure zones on the left and right sides (Frames 5 and 6), in which the right high-pressure zone is stronger because the effect of the sidewall causes the bubble surface farther from the wall to contract faster. At $t = 1.785$ (Frame 8), the annular jet far from the sidewall is concave inward accompanied by an oblique downward liquid jet. In this pattern, an annular jet forms during bubble collapse. This produces a bulge with a high curvature above the bubble, which we call ‘annular collapse’.

Figure 11. Bubble behaviour and surrounding pressure distribution at the collapse stage for  $\gamma _{{f}} = 2$, $\gamma _{{w}} = 4$ and $\delta = 0.231$.
The bubble morphology, the time-history curves of the geometric centre and the Kelvin impulse are provided for increasing  $\delta$ in figure 12. As shown in figure 12(a), for the case of small buoyancy, the bubble produces a wide downward jet ( $\delta = 0.1$); as the buoyancy increases, the tip of the downward liquid jet begins to bulge upward ( $\delta = 0.17$), and this bulge gradually becomes apparent as the buoyancy continues to increase until the bubble produces an annular jet ( $\delta = 0.221$ and 0.231). Furthermore, the increasing $\delta$ causes the liquid jet to develop upward entirely ( $\delta = 0.27$ and 0.3). Moreover, the greater $\delta$ leads to a wider upward jet. The horizontal displacement and Kelvin impulse of the bubble are relatively small under these buoyancy parameters. Here, $\delta =0.221$ is obtained directly using Blake's criterion, and $\delta =0.231$ is calculated by (4.8), under which $C_{{z}}$ and $I_{{sz}}$ at the end of the bubble collapse are closer to zero than for the other $\delta$ values.

Figure 12. Comparison of bubble shapes for increasing buoyancy parameters when  $\gamma _{{f}} = 2$ and $\gamma _{{w}} = 4$: (a) bubble shapes; (b) time history curves of the bubble centre; (c) time history curves of the Kelvin impulse of the bubble.
Figure 13 illustrates two examples of the bubble profiles and the surrounding pressure distribution when the bubble moves away from the sidewall ( $\gamma _{{f}} = 2$, $\gamma _{{w}} = 6$, 8). In the first case, as shown in figure 13(a), the right side of the bubble collapses quicker than the left, but the asymmetry of the annular jet decreases distinctly relative to that in figure 11. The decrease in the influence of the sidewall leads to gradual weakening in the oblique downward development of the annular jet. In the second case, as shown in figure 13(b), the bubble assumes an almost symmetrical ‘gourd’ shape with the symmetrical pressure distribution surrounding the bubble, and similar results in axisymmetric numerical simulation near a single free surface are also modelled and discussed in the work of Wang et al. (Reference Wang, Yeo, Khoo and Lam1996a).

Figure 13. Bubble shape and surrounding pressure distribution at typical moments for (a)  $\gamma _{{f}}=2$, $\gamma _{{w}}=6$ and $\delta = 0.224$ and (b) $\gamma _{{f}}=2$, $\gamma _{{w}}=8$ and $\delta = 0.223$.
We then compare the collapse behaviour of the bubble in the ‘annular collapse’ pattern for different  $\gamma _{{f}}$ ( $\gamma _{{w}} = 5$, $\gamma _{{f}} = 1.5$, 1.75, 2, 2.25) in figure 14. The velocity vector and pressure distribution surrounding the bubble in the first case are given here, and others can be found in Appendix B. The four frames for each case correspond to the maximum bubble volume, jet formation, jet development and jet impact. A smaller $\gamma _{{f}}$ indicates that the two opposing ‘forces’ acting on the bubble in the vertical direction are stronger, causing the bubble to be compressed flatter during jet development. The annular jet is generated later with the increase in $\gamma _{{f}}$ because the ‘forces’ acting on the bubble surface are smaller. As shown in figure 14(a), the annular jet is generated under the action of the left and right local high-pressure zones above the bubble. The formation position of the annular jet gradually moves downward along the bubble surface with increasing $\gamma _{{f}}$, as illustrated in figures 14(b)–14(d). During jet development, the bulge generated above the annular jet becomes more pronounced with the increase in $\gamma _{{f}}$. When $\gamma _{{f}} = 2.25$, the bubble rebounds in volume at jet impact. Thus, the jet cannot contact the lower bubble surface, as seen in figure 14(d); the annular jet farther away from the wall is inclined downward, and the bubble profile becomes asymmetrically driven by the more asymmetric pressure field compared with the other cases (see Appendix B). Thus, we conclude that a smaller $\gamma _{{f}}$ and a larger $\gamma _{{w}}$ cause a more symmetrical annular jet.

Figure 14. Comparison of the bubble shapes at typical moments for (a)  $\gamma _{{f}}=1.5$, $\gamma _{{w}}=5$ and $\delta = 0.298$; (b) $\gamma _{{f}}=1.75$, $\gamma _{{w}}=5$ and $\delta = 0.257$; (c) $\gamma _{{f}}=2$, $\gamma _{{w}}=5$ and $\delta = 0.227$; and (d) $\gamma _{{f}}=2.25$, $\gamma _{{w}}=5$ and $\delta = 0.203$.
7.3. Horizontal jet
Since the bubble moves farther away from the free surface, the buoyancy effect required for vertically neutral collapse decreases. Figure 15 shows the collapse process of the bubble generated far from the free surface and close to the sidewall for  $\gamma _{{f}} = 4$, $\gamma _{{w}} = 2$ and $\delta = 0.145$. Due to the relatively weak effect of the free surface and buoyancy, the bubble maintains a spherical contraction at the early stage of bubble collapse. At $t = 1.949$ (Frame 3), the bubble surface farther away from the sidewall sags inward under the action of the local high-pressure zone on the right, producing a liquid jet directed to the wall. The bubble is almost symmetrical about the horizontal plane, similar to those cases near a single rigid wall (Li et al. Reference Li, Han, Zhang and Wang2016). After the liquid jet penetrates the opposite bubble wall, it develops towards the wall, forming a protrusion on the bubble surface near the wall. At $t = 1.985$, the bubble appears as a ‘butterfly’ shape, and the protrusion increases in volume as the liquid jet develops towards the sidewall, causing the right part of the bubble to shrink away from the sidewall under the action of two local high-pressure zones at the root of the protrusion. We refer to the situation in which the liquid jet is directed towards the sidewall as the ‘horizontal jet’ pattern.

Figure 15. Collapse behaviour of the bubble at the collapse stage for  $\gamma _{{f}} = 4$, $\gamma _{{w}} = 2$ and $\delta = 0.145$.
Figure 16 shows the bubble shape at the moment of jet impact, the time-history curves of the centroid position and the Kelvin impulse of the bubble for four different  $\delta$ values, in which $\delta = 0.11$ is calculated by the ‘Blake criterion’ and $\delta = 0.145$ is obtained by (4.8). In figure 16(a), the liquid jet rotates clockwise with the increase in $\delta$ and is directed perpendicularly to the sidewall when $\delta = 0.145$. The centroid position and $z$-direction Kelvin impulse of the bubble at jet impact are closest to zero when $\delta = 0.145$, as illustrated in figure 16(b,c). The migration amplitude of the bubble towards the wall in this collapse pattern is significantly larger than that in the two previously mentioned patterns; $I_{{sy}}$ at the end of the first cycle exceeds two times that in the previous two patterns. Therefore, in the ‘horizontal jet’ pattern, the bubble has the greatest potential to attack the wall.

Figure 16. Comparison of bubble shapes for increasing buoyancy parameters when  $\gamma _{{f}} = 4$ and $\gamma _{{w}} = 2$: (a) bubble shapes; (b) time history curves of the bubble centre; (c) time history curves of the Kelvin impulse of the bubble.
7.4. Weak jet
In this section, the dynamics of the bubble far from the boundaries are discussed. Figure 17 shows the temporal development of the bubble for  $\gamma _{{f}} = 4$, $\gamma _{{w}} = 5$ and $\delta = 0.123$. The bubble remains almost spherical throughout the contraction stage, which indicates that the effects of the boundaries and buoyancy are much weaker relative to the previous cases. The liquid jet is formed during the rebounding stage (Frame 5). Subsequently, due to the rapid expansion of the bubble, the development of the liquid jet towards the wall is hindered; thus, it is difficult for the liquid jet to penetrate the opposite bubble surface. In this case, the weak jet leads to the nearly spherical oscillation of the bubble. We compare the time history curve of the bubble radius with theoretical results in figure 18. The unified equation of the oscillation bubble proposed by Zhang et al. (Reference Zhang, Li, Cui, Li and Liu2023a) is employed:
 \begin{equation} \left( {\frac{{C - \dot{R}}}{R} + \frac{\mathrm{d}}{{\mathrm{d}t}}} \right)\left[ {\frac{{{R^2}}}{C}\left( {\frac{1}{2}{{\dot{R}}^2} + \frac{1}{4}{v^2} + H} \right)} \right] = 2R{{\dot{R}}^2} + {R^2}\ddot{R}, \end{equation}
where  $C$ is sound speed in water; $R$,
$R$,  $\dot {R}$ and $\ddot {R}$ are bubble radius, oscillation velocity and acceleration, respectively; $v$ denotes the migration velocity of the bubble; and $H$ is the enthalpy difference at the bubble surface. To match our numerical results based in the incompressible fluid domain, the sound speed $C$ needs to be infinity. In addition, $H$ is modified to account for the influence of boundaries by adding three mirrored bubbles similar to that in figure 1.

Figure 17. Collapse behaviour of the bubble at the collapse stage for  $\gamma _{{f}} = 4$, $\gamma _{{w}} = 5$ and $\delta = 0.123$. The corresponding moments of the eight frames are 1.080, 1.725, 1.825, 1.881, 1.895, 1.899, 1.904 and 1.911, respectively.

Figure 18. Comparison between the numerical and theoretical results of the bubble radius for  $\gamma _{{f}} = 4$, $\gamma _{{w}} = 5$ and $\delta = 0.123$.
The numerical bubble radius agree with the theoretical results well, which means that the evolution of the bubble in this pattern is similar to spherical bubble dynamics. We refer to the case in which the bubble resembles spherical oscillations as the ‘weak jet’ pattern. Figure 19 shows the bubble profiles at the end of the bubble collapse for different  $\delta$, along with the centroid position and Kelvin impulse of the bubble, in which $\delta = 0.111$ and 0.123 are calculated with (4.9) and (4.8), respectively. Similar to that in figure 16, $C_{{z}}$ and $I_{{sz}}$ are closest to zero using our derived $\delta$. Notably, when the bubble significantly deviates from the ‘vertically neutral collapse’ state, the liquid jet develops fully in the first cycle because the bubble is subjected to a stronger pressure gradient in the vertical direction. However, the vertical pressure gradient acting on the bubble surface reaches equilibrium when the bubble is close to the vertically neutral collapse state, and the horizontal pressure gradient is also very weak, resulting in a weak jet.

Figure 19. Comparison of bubble shapes for increasing buoyancy parameters when  $\gamma _{{f}} = 4$ and $\gamma _{{w}} = 5$: (a) bubble shapes; (b) time history curves of the bubble centre; (c) time history curves of the Kelvin impulse of the bubble.
8. Discussion
8.1. Classification
We classify the vertically neutral collapse behaviour of bubbles for different  $\gamma _{{f}}$ and $\gamma _{{w}}$ in figure 20 through systematic simulations, and the distribution of $\delta$ corresponding to various $\gamma _{{f}}$ and $\gamma _{{w}}$ is provided in the form of a heatmap. In the region close to the free surface, the required $\delta$ for the bubble to reach the vertically neutral collapse is significantly higher than in other regions. As $\gamma _{{f}}$ or $\gamma _{{w}}$ increases, the corresponding $\delta$ gradually decreases. The cases with an error of more than 0.03, such as that in figure 4, are marked with the corresponding value of $\delta$, and the rest of the cases are obtained directly using (4.8). The dynamic characteristics of the bubble under the four collapse patterns are discussed in detail in the previous section and are not repeated here. The occurrence of the ‘horizontal jet’, which occupies most of the parameter space when the bubble is relatively far from the free surface, is important. The bubble in the ‘horizontal jet’ pattern has a significant momentum towards the wall, as discussed in § 7.3. The dynamics characteristics of the bubbles at various $\gamma _{f}$ when the ‘horizontal jet’ occurs are not entirely consistent, as seen from the transition between the collapse patterns. The ‘annular collapse’ or ‘weak jet’ transforms into the ‘horizontal jet’ at larger $\gamma _{{w}}$ for larger $\gamma _{f}$. Therefore, a parametric analysis of the collapse characteristics of bubbles in the ‘horizontal jet’ pattern is carried out.

Figure 20. Classification of different collapse patterns for the vertically neutral collapse of the bubble near the free surface and a vertical wall as a function of  $\gamma _{{w}}$ and $\gamma _{{f}}$. Four types of bubble behaviour are summarized: formally downward jet, annular collapse, horizontal jet, and weak jet. The heatmap represents the change in $\delta$ corresponding to the vertically neutral collapse for different distance.
8.2. Parametric analysis of the ‘horizontal jet’
8.2.1. Bubble behaviour for different  $\gamma _{{w}}$ and $\gamma _{{f}}$


Figure 21 compares the dynamic features of the horizontal jets for different  $\gamma _{{f}}$ at fixed $\gamma _{{w}}$ ( $\gamma _{{w}} = 2$, $\gamma _{{f}} = 2$, 2.5, 3, 3.5). The pressure distribution and velocity vector surrounding the bubble for $\gamma _{{f}} = 2$ are provided here, and others can be found in Appendix B. The liquid jets are all formed on the bubble surface farther away from the wall under the action of a fan-shaped local high-pressure zone. The smaller $\gamma _{{f}}$ causes the bubble to be flatter at jet formations due to the stronger pressure gradient above and below the bubble, resulting in a larger local curvature at the position of jet formation. During jet development, the contract velocity of the jet root cannot be maintained with the development of the jet tip towards the wall, causing the jet tip to be broad and the jet root to be thin at jet impact. With the increase in $\gamma _{{f}}$, the bubble surface at the position of jet formation gradually becomes flat with a thin jet tip and broad jet root, which is similar to the situation near a single rigid wall. Notably, regarding this $\gamma _{{w}}$, the jet impact occurs on the bubble surface nearer the sidewall.

Figure 21. Comparison of the bubble shapes at typical moments for (a)  $\gamma _{f}=2$, $\gamma _{{w}}=2$ and $\delta = 0.257$; (b) $\gamma _{{f}}=2.5$, $\gamma _{{w}}=2$ and $\delta = 0.215$; (c) $\gamma _{{f}}=3$, $\gamma _{{w}}=2$ and $\delta = 0.185$; and (d) $\gamma _{{f}}=3.5$, $\gamma _{{w}}=2$ and $\delta = 0.162$.
We then illustrate the formation and development of the horizontal jets at different  $\gamma _{{w}}$ ( $\gamma _{{f}} = 2$, $\gamma _{{w}} = 2.2$, 2.6, 3, 3.2) in figure 22. Additionally, we provide only the pressure distribution and velocity vector of the first case here. Compared with figure 21, the most prominent feature is that the horizontal jet no longer impacts the left bubble surface with the increase in $\gamma _{{w}}$ but the lower bubble surface. We provide an explanation as follows: when the bubble is far away from the wall, the influence of the wall on the bubble is weaker than that of the free surface and buoyancy; thus, the longitudinal contraction of the bubble is more likely to affect the development of the horizontal jet. In figure 6, the vertically neutral collapse of the bubble is reached at the end of the bubble collapse, but the free surface makes the upper bubble surface more concave than the lower part. Similarly, for this $\gamma _{{f}}$, the bubble surface at the jet root is slightly concave downward in the case of $\gamma _{{w}} = 3$ and 3.2 under the action of the free surface, causing the local curvature of the bubble to be asymmetric to the horizontal plane. This is also reflected in the sloped local high-pressure zone at jet formation, as seen in figure 35 of Appendix B. The phenomenon of jets striking the lower bubble surface also indicates that the jet impact occurs earlier and that the bubble migration is hindered earlier.

Figure 22. Comparison of the bubble shapes at typical moments for (a)  $\gamma _{{f}}=2$, $\gamma _{{w}}=2.2$ and $\delta = 0.252$; (b) $\gamma _{{f}}=2$, $\gamma _{{w}}=2.6$ and $\delta = 0.245$; (c) $\gamma _{{f}}=2$, $\gamma _{{w}}=3$ and $\delta = 0.239$; and (d) $\gamma _{{f}}=2$, $\gamma _{{w}}=3.2$ and $\delta = 0.237$.
8.2.2. Moment of jet impact
In the previous work of Supponen et al. (Reference Supponen, Obreschkow, Tinguely, Kobel, Dorsaz and Farhat2016), the time interval from the jet impact to the minimum bubble volume  $\Delta t_{{jet}}$ is studied near a rigid wall for a Rayleigh bubble; however, in this study, the bubble with the high initial internal pressure does not continuously collapse as it gradually moves away from the wall; thus, the jet impact may occur earlier or later than the moment of the minimum bubble volume. Therefore, we choose to study the dimensionless moment of the jet impact. The dimensionless moment of the jet impact $t_{{jet}}$ for different $\gamma _{{f}}$ and $\gamma _{{w}}$ is displayed in figure 23. Since the effect of the free surface is removed, the physical model degenerates to the classic situation near a single rigid wall, as shown by the yellow squares. The jet impact occurs earlier at a smaller $\gamma _{{f}}$ because the free surface accelerates the pulsation of the bubble, which was demonstrated by the change in the kinetic energy of the volume of the liquid outside the bubble in the work of Gregorcic, Petkovsek & Mozina (Reference Gregorcic, Petkovsek and Mozina2007). Here, $t_{{jet}}$ increases with the decrease in $\gamma _{{w}}$ since the rigid wall impedes the bubble pulsation, which has been observed in many works (Philipp & Lauterborn Reference Philipp and Lauterborn1998; Vogel & Lauterborn Reference Vogel and Lauterborn1988) on bubble–wall interactions. With increasing $\gamma _{{f}}$, the gap of $t_{{jet}}$ for different $\gamma _{{f}}$ gradually decreases, resulting from the decreasing forces acting on the bubble surface in the vertical direction. A slight increase in $t_{{jet}}$ with $\gamma _{{w}}$ occurs because the jet is generated late as $\gamma _{{w}}$ is large; as a result, the bubble is in the rebounding stage during jet development, delaying the occurrence of the jet impact.

Figure 23. Dimensionless moment of the jet impacts for different  $\gamma _{{f}}$ and $\gamma _{{w}}$.
To further quantitatively explore the variation law of  $t_{{jet}}$ with the distance parameters, we define a relative moment of the jet impact $t_{{jet}}'$:
 \begin{equation} t_{{jet}}' = t_{{jet}} - t_{{f}}, \end{equation}
in which  $t_{{f}}$ is the bubble period for the case with the same $\gamma _{{f}}$ and without the influence of the sidewall. Compared with $t_{{jet}}$, $t_{{jet}}'$ can better reflect the effect of the rigid sidewall on the bubble dynamics under different $\gamma _{{f}}$, and its value can be converted to a relatively small range with the change in $\gamma _{{f}}$.
Figure 24(a) shows the variation of  $t_{{jet}}'$ with respect to $\gamma _{{w}}$ for different $\gamma _{{f}}$. The variation in $t_{{jet}}'$ with $\gamma _{{w}}$ almost converges to the cases near a single rigid wall when $\gamma _{{f}}$ reaches 6. This means that the bubble–sidewall interaction is physically close to the classical case of a single rigid wall, although the free surface and weak buoyancy still combine to accelerate bubble collapse, as shown in figure 23. Furthermore, we present the variation in $t_{{jet}}'$ with $I_{{y}}$ in logarithmic form, as shown in figure 24(b). In most of the parameter space, $\log (t_{{jet}}')$ varies linearly with $\log (I_{{y}})$, from which we can give the power law by fitting the data in figure 24(b):
 \begin{equation} t_{{jet}}' \propto I_{{y}}^{0.78}. \end{equation}
Figure 24. Variation in the relative moment of the jet impact  $t_{{jet}}$ as functions of (a) the bubble–wall distance $\gamma _{{w}}$ and (b) theoretical Kelvin impulse in horizontal $I_{{y}}$ in logarithmic form.
First, we conduct an idealized scaling analysis on the feature time. We take the feature length as the bubble radius  $R$. According to the collapse velocity of the Rayleigh bubble, the feature velocity satisfies $v = {R^{ - 3/2}}$. Therefore, the momentum can be scaled as $mv \propto {R^3}\, {\cdot }\, {R^{ - 3/2}} = {R^{3/2}}$. The Kelvin impulse of the bubble is proportional to the momentum, $mv \propto {I_y}$, so the feature time $t$ and Kelvin impulse satisfy the power law: $t \propto I_{y}^{5/3}$. Supponen et al. (Reference Supponen, Obreschkow, Tinguely, Kobel, Dorsaz and Farhat2016) provided the power law of $\Delta t_{{jet}} \propto I_{{y}}^{5/3}$ by fitting $\Delta t_{{jet}}$ of a Rayleigh bubble and some experimental data, which is consistent with the result of scaling analysis. The $\Delta t_{{jet}}$ decays significantly faster with $\gamma _{{w}}$ than with $t_{{jet}}'$ because the moment of the jet impact gradually approaches the minimum bubble volume as $\gamma _{{w}}$ increases. However, in this study, the time gap between the jet impact and $t_{{f}}$ always exists, resulting in a significantly smaller exponential coefficient. In addition, it is worth noting that $t_{{jet}}'$ deviates significantly from the power law as $\log (I_{{y}})<-4.5$ or $\log (I_{{y}})>-2$. When $\log (I_{{y}})<-4.5$, the bubble is far from the sidewall, so the bubble rebounds before the jet impact, as mentioned before, which delays the occurrence of the jet impact. When $\log (I_{{y}})>-2$, the bubble is very close to the sidewall and begins to deviate from the spherical shape during the expansion phase. This causes the liquid jet to generate relatively earlier, which accelerates the occurrence of the jet impact.
8.2.3. Jet velocity
In this section, we discuss the variation law of the jet velocity  $v_{{jet}}$ (the velocity of the jet tip at jet impact) for different $\gamma _{{f}}$ and $\gamma _{{w}}$, as shown in figure 25. As $\gamma _{{f}}$ reaches 3, the changing trend is related to $t_{{jet}}$. Here, $v_{{jet}}$ first increases and then decreases with increasing $\gamma _{{w}}$ for fixed $\gamma _{{f}}$, except when the bubble is very close to the rigid wall ( $\gamma _{{w}}<1.5$), and $v_{{jet}}$ fluctuates with the variation in $\gamma _{{w}}$. The fluctuation was also observed and confirmed near a single wall in the works of Tomita & Shima (Reference Tomita and Shima1986) and Zhang et al. (Reference Zhang, Zhang, Wang and Cui2017). The $\gamma _{{w}}$ corresponding to the peak jet velocity is consistent with the $\gamma _{m{w}}$ corresponding to the minimum $t_{{jet}}$ in figure 23; as explained in § 8.2.2, when the bubble rebounds in volume during jet development for large $\gamma _{{w}}$, the rapid expansion of the bubble delays the occurrence of the jet impact, resulting in the decreasing $v_{{jet}}$ with increasing $\gamma _{{w}}$. When the bubble continuously contracts during the jet development for small $\gamma _{{w}}$, the liquid jet is accelerated constantly, causing $v_{{jet}}$ to increase with increasing $\gamma _{{w}}$. Notably, the amplitude of the jet velocity when $\gamma _{{f}}<3$ is higher than when $\gamma _{{f}}$ reaches 3, which is attributed to the strong effect of the free surface and buoyancy on the jet development; the strong pressure acting on the bubble surface compresses the bubble to a smaller volume when the liquid jet is further accelerated, as illustrated in figures 21 and 22. As $\gamma _{{f}}$ increases, the variation in the jet velocity with $\gamma _{{w}}$ gradually approaches the situation near a single wall.

Figure 25. Variation in the jet velocity  $v_{{jet}}$ as functions of (a) the bubble–wall distance $\gamma _{{w}}$ and (b) theoretical Kelvin impulse in horizontal $I_{{y}}$ in logarithmic form.
Furthermore, figure 25(b) shows the change law of  $\log (v_{{jet}})$ with $\log (I_{{y}})$. Similar to figure 24(b), $\log (v_{{jet}})$ changes linearly with $\log (I_{{y}})$ over most of the parameter space, from which we can give the power law:
 \begin{equation} v_{{jet}} \propto I_{{y}}^{-0.44}. \end{equation}
 Supponen's power law for the jet velocity of a Rayleigh bubble is  $v_{{jet}} \propto I_{{y}}^{-1}$, which agrees with the result of scaling analysis but obviously overestimates the increasing rate of the jet velocity with $\gamma _{{w}}$ because the Rayleigh bubble continuously accelerates to collapse even when $\gamma _{{w}}$ exceeds 10; however, for bubbles with a high initial internal pressure in this study, the bubble rebounds in volume after collapsing to a larger size as $\gamma _{{w}}$ exceeds approximately 3. Therefore, the exponential coefficient is significantly greater than $-$1. In addition, fluctuations in $v_{{jet}}$ in the near-wall region cause $v_{{jet}}$ to deviate significantly from the power law at $\log (I_{{y}})>-2$. As $\log (I_{{y}})<-4.5$, the liquid jet becomes relatively weak due to the large bubble–wall distance, and the bubble begins to expand before the jet impact, which corresponds to cases when $\gamma _{{w}}$ exceeds 3 in figure 25(a). Thus, the jet impact is alleviated by the high pressure inside the bubble in the early stage of the second cycle, resulting in the jet velocity at the moment of jet impact decreasing with decreasing $\log (I_{{y}})$.
8.2.4. Bubble displacement
Figure 26(a) displays the bubble displacement at jet impact  $D$ for different $\gamma _{{f}}$ and $\gamma _{{w}}$, in which we ignore the bubble displacement in the vertical direction due to its weak effect (see Appendix C). The $D$ increases slightly with increasing $\gamma _{{f}}$ but shows a consistent downward trend with $\gamma _{{w}}$ at all $\gamma _{{f}}$. To quantitatively describe the changing trend of $D$ with respect to $\gamma _{{w}}$, we fit the data in figure 26(a) for all $\gamma _{{f}}$ and obtain a power law:
 \begin{equation} D \propto \gamma _{w}^{-1.37} . \end{equation}
Figure 26. Variation in the bubble displacement at jet impact  $D$ as functions of (a) the bubble–wall distance $\gamma _{{w}}$ and (b) theoretical Kelvin impulse in horizontal $I_{{y}}$ in logarithmic form.
Furthermore, we show the variation in  $D$ with respect to $I_{{y}}$ in logarithmic coordinates, as illustrated in figure 26(b). We can provide a power law with regards to $D$ and $I_{{y}}$ by fitting the data in figure 26(b):
 \begin{equation} D \propto I_{{y}}^{0.56} . \end{equation}
 A notable feature of the bubble displacement is that the exponential coefficient of the above two power laws increases monotonically with increasing  $\gamma _{{f}}$. Thus, we provide the two coefficients $\theta$ and $\beta$ in figure 27 ( $D \propto \gamma _{w}^{\theta } \propto I_{{y}}^{\beta }$). First, it is worth noting that Supponen et al. (Reference Supponen, Obreschkow, Tinguely, Kobel, Dorsaz and Farhat2016) combined experiments and numerical simulations to provide a power law for the migration distance of a no-buoyancy bubble near a single rigid wall: $D \propto {I_{{y}}^{0.6}}$. As they stated, for real bubbles, the contraction speed at the minimum volume is smaller than that of the Rayleigh bubble, $v < {R^{ - 3/2}}$, so the power-law exponent is expected to be lower than the $2/3$ value obtained through scaling analysis. However, even so, $\beta$ in our study does not reach 0.6, as figure 27 shows.

Figure 27. Variation of  $\theta$ and $\beta$ with respect to $\gamma _{{f}}$.
In fact,  $\beta$ is small when the bubble is close to the free surface, which indicates that the horizontal displacement of the bubble decays faster with $\gamma _{{w}}$ than for larger $\gamma _{{f}}$. We learn from (4.6) that $I_y$ is related only to $\gamma _{{w}}$ if we ignore the effect of the free surface. Then, it is expected that ${I_y} \propto \gamma _{w}^{ - 2}$, resulting in $\theta = - 2\beta$. However, as figure 27 shows, $\theta$ is much less than $- 2\beta$, especially when $\gamma _{{f}}$ is small. This is the consequence of the extra term in (4.6) caused by the free surface. The relation of $\theta < - 2\beta$ illustrates that the free surface reduces the momentum of the bubble migrating towards the wall. Even though the buoyancy balances out the effect of the free surface, the bubble is less likely to migrate towards the surrounding structures near the free surface. In addition, when $\gamma _{{f}}$ is small, the collapse pattern gradually transitions from the ‘horizontal jet’ to the ‘annular collapse’ in which the horizontal displacement of the bubble in the first period is greatly weakened, as shown in figure 12. The position of the jet impact can also partly explain the variation trend of $D$. As figure 22 shows, the liquid jet impacts the lower surface of the bubble before it reaches the left wall of the bubble when $\gamma _{{f}} = 2$, delaying the continued increase in $D$.
$D$.
It is expected that  $\theta$ increases with increasing $\gamma _{{f}}$ even if the bubble is far away from the free surface when ‘annular collapse’ does not occur. Since the smaller $\gamma _{{f}}$ results in the bubble being subjected to greater ‘forces’ from above and below, the bubble is pressed in the vertical direction to a greater extent. As a result, the movement of the bubble in the horizontal direction is hindered and limited. As $\gamma _{{f}}$ increases, $\beta$ gradually approaches the 0.6 value obtained by Supponen for the case of no free surface and no buoyancy. In fact, when the influence of the free surface is removed, the bubble is no longer subjected to an additional pressure gradient in the direction parallel to the rigid wall. Thus, the bubble achieves vertically neutral collapse without the need for buoyancy. When the free surface is removed, as shown by the yellow marks in figure 27, $\beta$ reaches 0.6 when $\theta$ is equal to $-2 \beta$.
9. Summary and conclusion
In this paper, the vertically neutral collapse of a pulsating bubble (the buoyancy balances the effect of the free surface) near the free surface and a vertical rigid wall is systematically studied combined with theoretical and numerical methods. The BIM is adopted to simulate the bubble behaviour, and the free surface is treated as an open-domain area through a virtual vortex. Three key characteristic parameters are mainly studied: the bubble-free surface distance  $\gamma _{{f}}$, bubble–wall distance $\gamma _{{w}}$ and buoyancy parameter $\delta$. Combined with the mirror point source/sink method, the Kelvin impulse of the bubble is derived to determine the relationship among the three parameters for vertically neutral collapse.
Kelvin impulse theory can accurately predict vertically neutral bubble collapse when the bubble is relatively far from the boundaries (see figure 4). As the value of  $\delta$ for vertically neutral collapse at fixed $\gamma _{{f}}$ and $\gamma _{{w}}$ is determined, the collapse pattern of the bubble depends fully on $\gamma _{{f}}$ and $\gamma _{{w}}$. Four collapse patterns are performed, namely, ‘formally downward jet’, ‘annular collapse’, ‘horizontal jet’ and ‘weak jet’. The ‘formally downward jet’ originates from the strong interaction between the bubble and the free surface. Although the upper bubble surface is concave downward to produce a downward liquid jet, the lower surface has a considerable upward velocity at the end of the bubble collapse, resulting in the bubble oscillating without obvious momentum in the vertical direction during the rebounding phase. With the decrease in $\gamma _{{w}}$, the curvature of the bubble surface farther away from the wall becomes large at jet impact, resulting in a bubble with increasing momentum towards the wall. As $\gamma _{{w}}<1$, the extremity of the bubble wall far away from the wall becomes very sharp at jet impact, and a focused local high-pressure zone is generated nearby. The ‘annular collapse’ indicates that an annular jet is generated at the end of the bubble collapse. The two local high-pressure zones generated during bubble collapse at the left and right extremities of the bubble cause the formation of a bulge with high curvature above the bubble. The smaller $\gamma _{{f}}$ and the larger $\gamma _{{w}}$ lead to a more symmetrical annular jet accompanied by a more symmetrical pressure distribution of the flow field. The ‘weak jet’ occurs when the bubble is far from the boundaries and the liquid jet is developed late without penetrating the bubble surface.
Among the four collapse patterns, the ‘horizontal jet’ has the greatest potential to attack the wall. The Kelvin impulse and the bubble displacement towards the wall are much larger than the other three patterns at the late stage of bubble collapse. The moment of the jet impact  $t_{{jet}}$ increases with increasing $\gamma _{{f}}$ and decreasing $\gamma _{{w}}$ on the whole, but increases slightly with decreasing $\gamma _{{w}}$ when the bubble is far from the free surface. This is the consequence of the bubble rebounding before the jet impact as $\gamma _{{f}}$ is large, which also hinders the development of the liquid jet. As a result, the jet velocity $v_{{jet}}$ increases first and then decreases with increasing $\gamma _{{w}}$, with $\gamma _{{w}}$ corresponding to the peak velocity increasing with increasing $\gamma _{{f}}$ as $\gamma _{{f}}$ is large. As $\gamma _{{f}}$ is small, a peak of $v_{{jet}}$ with increasing $\gamma _{{w}}$ also exists due to the gradual transition of the collapse pattern.
In the ‘horizontal jet’ pattern, the power laws of the relative moment of the jet impact to the case of a single free surface  $t_{{jet}}$, the jet velocity $v_{{jet}}$ and the bubble displacement at jet impact $D$ with respect to $I_y$ are found when the bubble is relatively far from the rigid wall ( $\log (I_{{y}})<-2$): $t_{{jet}}' \propto I_y^{0.78}$, $v_{{jet}} \propto I_y^{-0.44}$, $D \propto I_y^{0.56}$. The high initial internal pressure of the bubble causes the power laws of $t_{{jet}}'$ and $v_{{jet}}$ to fail at a large $\gamma _{{w}}$ ( $\log (I_{{y}})<-4.5$), and it is also an important reason why the power-law exponent of $v_{{jet}}$ is significantly larger than the result of scaling analysis. The power-law exponent of the bubble displacement increases with increasing $\gamma _{{f}}$ ( $D \propto \gamma _{w}^\theta \propto I_y^\beta$) and converges to the case with a single wall. Scaling analysis indicates that the free surface reduces the momentum of the bubble migrating towards the sidewall, resulting in $\theta < - 2\beta$. In addition, at small $\gamma _{{f}}$, the change in the jet behaviour, such as the position of the jet impact shifting from the left to lower bubble surface, is also responsible for the small $\theta$.
Funding
This work is funded by the National Natural Science Foundation of China (nos. 52088102, 51979049) and the National Key R&D Program of China (no. 2022YFC2803500).
Declaration of interests
The authors report no conflict of interest.
Appendix A. Supplement of the derivation of (4.8)
A polar coordinate system is established by taking the intersection point of the free surface and rigid wall in a two-dimensional plane as the origin, and the line between the point source/sink and the intersection point as the polar axis. Then, we have  $\gamma ^2=\gamma _{f}^2 + \gamma _{w}^2$ and $\gamma _{f}=\gamma \sin (\omega )$. Thus, we let $I_{z}$ be zero, and (4.7) can be transformed into
 \begin{equation} - \frac{{2\sqrt 6 {\rm \pi}}}{9}\left[ {\left( {\frac{1}{{\gamma _f^2}} + \frac{1}{{{{( {{{{\gamma _f}} / {\sin \omega }}} )}^2}}}\sin \omega } \right)B\left( {\frac{7}{6},\frac{3}{2}} \right) - 2{\delta ^2}B\left( {\frac{{11}}{6},\frac{1}{2}} \right)} \right] = 0. \end{equation}
Simplifying the above equation, we obtain
 \begin{equation} \frac{1}{{\gamma _f^2}}\left( {1 + {{\sin }^3}\omega } \right)B\left( {\frac{7}{6},\frac{3}{2}} \right) = 2{\delta ^2}B\left( {\frac{{11}}{6},\frac{1}{2}} \right), \end{equation}
based on which (4.8) can be obtained by converting the polar coordinate back to Cartesian coordinates.
Appendix B. Bubble shape and surrounding pressure distribution
In this section, we supplement the velocity field and pressure distribution not provided in §§ 7.2 and 8.2.1, as seen from figures 28–35.

Figure 28. Bubble shape and surrounding pressure distribution at typical moments for  $\gamma _{{f}}=1.75$, $\gamma _{{w}}=5$ and $\delta = 0.257$.

Figure 29. Bubble shape and surrounding pressure distribution at typical moments for  $\gamma _{{f}}=2$, $\gamma _{{w}}=5$ and $\delta =0.226$.

Figure 30. Bubble shape and surrounding pressure distribution at typical moments for  $\gamma _{{f}}=2.25$, $\gamma _{{w}}=5$ and $\delta = 0.203$.

Figure 31. Bubble shape and surrounding pressure distribution at typical moments for  $\gamma _{{f}}=2.5$, $\gamma _{{w}}=2$ and $\delta = 0.215$.

Figure 32. Bubble shape and surrounding pressure distribution at typical moments for  $\gamma _{{f}}=3$, $\gamma _{{w}}=2$ and $\delta = 0.185$.

Figure 33. Bubble shape and surrounding pressure distribution at typical moments for  $\gamma _{{f}}=5$, $\gamma _{{w}}=2$ and $\delta = 0.119$.

Figure 34. Bubble shape and surrounding pressure distribution at typical moments for  $\gamma _{{f}}=2$, $\gamma _{{w}}=2.6$ and $\delta = 0.245$.

Figure 35. Bubble shape and surrounding pressure distribution at typical moments for  $\gamma _{{f}}=2$, $\gamma _{{w}}=3$ and $\delta = 0.239$.
Appendix C. Variation in the total displacement in the ‘horizontal jet’ pattern
In this section, we give the variation in the total bubble displacement  $D$ (
$D$ ( $D=\sqrt {D_{y}^2+D_{z}^2}$) with $\gamma _{{w}}$ and the total Kelvin impulse $I$ in the ‘horizontal jet’ pattern for three $\gamma _{{f}}$, as shown in figure 36. The change law of $D$ with $\gamma _{{w}}$ is consistent with $D_{y}$ with negligible differences, so the vertical displacement of the bubble does not change the variation in the bubble displacement or the associated power law.

Figure 36. Comparison of the total and horizontal displacement of the bubble at jet impact for different  $\gamma _{{f}}$ and $\gamma _{{w}}$: (a) variation in the displacement with $\gamma _{{w}}$; (b) variation in the displacement with theoretical Kelvin impulse $I$ in logarithmic form.


 Open access