


INTRODUCTION
Rotorcraft gas turbine engines operating under environmentally degraded conditions (e.g., sandstorms, volcanic ash clouds, etc.) experience critical performance losses due to the ingestion of foreign matter particulates into the propulsion system. The most common types of ingested particulates range from volcanic ash to desert sand, to dust, or salt, in the form of molten particulates referred to as calcia–magnesia–alumino–silicates (CMAS) from here onwards, that often vary in composition depending on the geographical location. Although engine particle separator systems offer a potential solution to limit the amount of ingested contaminants, sufficiently smaller particles (<50 μm) mostly evade removal and are still entrained into the turbine stage [Reference Filippone and Bojdo1]. The chamber temperatures of these engines have been increasing in the quest to improve efficiencies and thrust over the last few decades owing to substantial improvement in materials technologies, which has had an unintended consequence on ingested sand particles—they melt as they pass through the high-temperature combustor. The undesired entrainment of CMAS particulates and its evolution leads to multiple issues, including loss of efficiency and surge margin in the compressor, clogging of the fuel spray nozzles in the combustor, and clogging of the nozzle vanes and cooling channels in the turbine hot section [Reference Murugan, Ghoshal, Nieto, Walock, Bravo, Jain, Pepi, Swab, Zhu, Pegg, Rowe, Flatau and Kerner2]. This, in turn, leads to rapid deterioration of material system components, increased maintenance, and the risk of critical loss of operation. To mitigate the detrimental effects of CMAS droplets deposited on the turbine blades, environmental- and thermal-barrier coatings (E/TBCs) along with film cooling of superalloy or ceramic matrix composites (CMC) components are used in today's engines to increase the durability of the materials. Without protective E/TBCs, the moisture in the combusting atmosphere will rapidly degrade the underlying substrate material due to the formation and volatilization of harmful gases [Reference Larry Fehrenbacher, Kutsch, Vesnovsky, Fehrenbacher, Ghoshal, Walock, Murugan, Nieto, Mahmoud, Sridharan, Colorado, Bhalla, Singh, Gupta, Langhorn, Jitianu and Manjooran3]. Although T/EBCs are effective at its current capability of 2400 F, these strategies do not yet provide a robust solution to protect against increased CMAS attack at the ultimate goal of 3000 F (or higher temperatures), and as a result, still undergo severe degradation.
A necessary prerequisite to the development of effective TBCs is a thorough understanding of fundamental behaviors governing the interactions between CMAS droplets, while they are still in the combustion chamber, and subsequently, their interactions with the blade surface. While several research efforts have investigated the interactions between CMAS droplets and blade coatings, the associated deposition characteristics [Reference Murugan, Ghoshal, Nieto, Walock, Bravo, Jain, Pepi, Swab, Zhu, Pegg, Rowe, Flatau and Kerner2, Reference Ghoshal, Murugan, Walock, Nieto, Bravo, Barnett, Pepi, Hoffmeister Mock, Swab and Hirsch4, Reference Whitaker and Bons5, Reference Yu and Tafti6, Reference Song, Yang, Fukumoto, Lavallée, Lokachari, Guo, You and Dingwell7, Reference Singh and Tafti8, Reference Pearson and Brooker9, Reference Libertowski, Plewacki and Bons10, Reference Hsu, Barker, Varney, Boulanger, Nguyen and Ng11, Reference Guha12, Reference Crowe and Bons13, Reference Bons, Prenter and Whitaker14, Reference Bojdo, Ellis, Filippone, Jones and Pawley15, Reference Murugan, Ghoshal, Walock, Barnett, Pepi and Kerner16, Reference Murugan, Ghoshal, Walock, Nieto, Bravo, Barnett, Pepi, Swab, Pegg, Rowe, Zhu and Kerner17, Reference Ghoshal, Murugan, Walock, Nieto, Barnett, Pepi, Swab, Zhu, Kerner, Rowe, Shiao, Hopkins and Gazonas18], and the trajectories of particles in turbulent flowfield [Reference Bravo, Xue, Murugan, Ghoshal, Walock and Flatau19, Reference Jain, Bravo, Bose, Kim, Murugan, Ghoshal and Flatau20], the limited literature exists on the phenomena dictating CMAS droplet–droplet interactions when they are still inside the combustion chamber. Knowledge of the droplet–droplet interaction outcomes is critically important to inform the development of deposition and accretion models of CMAS in the hot section. Therefore, the purpose of this paper is to elucidate the binary interactions between equal-sized CMAS droplets at operating pressure and temperatures representative of contemporary gas turbine combustion chambers.
Binary droplet collision for liquids, such as water and hydrocarbons relevant to propulsion applications, have been extensively studied in the past, and the detailed collision dynamics, atomization, and breakup regimes are fairly well established [Reference Qian and Law21, Reference Pan, Law and Zhou22, Reference Nobari, Jan and Tryggvason23, Reference Liu and Bothe24, Reference Kuan, Pan and Shyy25, Reference Jia, Yang, Zhang and Ni26, Reference Chen, Ma, Khare and Yang27, Reference Ashgriz and Poo28, Reference Chen, Ma, Khare and Yang29]. While the effect of viscosity on droplet collision has been studied in the past [Reference Gotaas, Havelka, Jakobsen, Svendsen, Hase, Roth and Weigand30, Reference Focke and Bothe31, Reference Sommerfeld and Kuschel32], CMAS viscosity and surface tension are at least two orders of magnitude higher than any liquid studied in the literature. Furthermore, there is wide uncertainty in CMAS physical properties, due to disparity in composition in different geographical regions, which will affect the fluid dynamic characteristics. Therefore, the behaviors of CMAS droplet collisions are expected to be very different as compared to previously investigated liquids [Reference Jain, Bravo, Bose, Kim, Murugan, Ghoshal and Flatau20].
To the best of our knowledge, no literature exists on the collision dynamics of CMAS droplets. This is primarily due to the challenges in making accurate measurements at temperatures corresponding to gas turbine combustion chamber conditions. It should be noted that at low temperatures, CMAS exists as a solid sand particle; therefore, CMAS droplet behaviors cannot be studied in ambient temperature conditions. This study aims to understand the process of binary collision of CMAS droplets in head-on and off-center configurations using high-fidelity Eulerian–Eulerian-based computational methodology. The current paper presents our investigation on equal-sized droplet collisions, and in a subsequent manuscript, we will discuss the collision outcomes of unequal CMAS droplets. To compare and contrast the role of CMAS viscosity, computations are also conducted on a fluid with the same physical properties as CMAS, except that the viscosity is reduced by one-tenth. The outcomes of this research will not only contribute to the collision physics of highly dense and viscous CMAS droplets but also provide estimates of the size distribution of droplets that will interact with turbine blades, which, in turn, determines the deposition characteristics.
The rest of the manuscript is organized into three major sections. In the next section, before discussing our results, we will describe the model validation and grid sensitivity analyses. Next, we will discuss the physics associated with CMAS droplet collision in head-on, off-center, and grazing configurations. The quantitative analysis is based on the temporal evolution of surface, kinetic, and dissipation energies. This will be followed by the summary and conclusions that can be drawn from the research. In the last section, we will describe our methodology, including the governing equations, the numerical methods, and the grid adaptation technique used in this research effort.
RESULTS AND DISCUSSION
The results are organized into four subsections. First, we will describe relevant nondimensional numbers and the energies that will be used in our analysis. This will be followed by model validation and grid sensitivity studies. Finally, we will discuss CMAS collision physics both qualitatively using time evolution of the liquid volume fraction defined by c = 0.5, and quantitatively using the energy budget and the evolution of kinetic, surface, and viscous dissipation energies. We will also contrast CMAS droplet behaviors with a fictitious liquid with the same physical properties as CMAS except that the viscosity is one-tenth of it.
Relevant nomenclature, nondimensional numbers, and energies
The phenomenon of droplet collisions is described using Laplace number (La), droplet size ratio (Δ), and an impact parameter (B). Laplace number estimates the ratio of viscous forces to surface tension forces as
 $${\rm La} = \left({\displaystyle{{\rm We} \over {{\rm Re}}}} \right),$$
where We and Re are the Weber and Reynolds numbers, respectively. The droplet size ratio is defined as follows:
 $$\Delta = \left({\displaystyle{{d_{{\rm small}}} \over {d_{{\rm large}}}}} \right).$$
Figure 1 shows the geometric parameters relevant to binary droplet collision. The impact parameter B varies between 0 and 1, where 0 corresponds to head-on and 1 to grazing collision. B can be defined for droplets with different diameters D 1 and D 2, approaching each other with velocity U, and a projected separation χ, given by
 $$\eqalign{ B &= \left({\displaystyle{{\rm \chi} \over {R_1 + R_2}}} \right)\comma\quad \lpar {R_1\ne R_2} \rpar; \cr B &= \left({\displaystyle{{\rm \chi} \over {2R}}} \right)\comma \;\quad \lpar {R_1 = R_2} \rpar.} $$
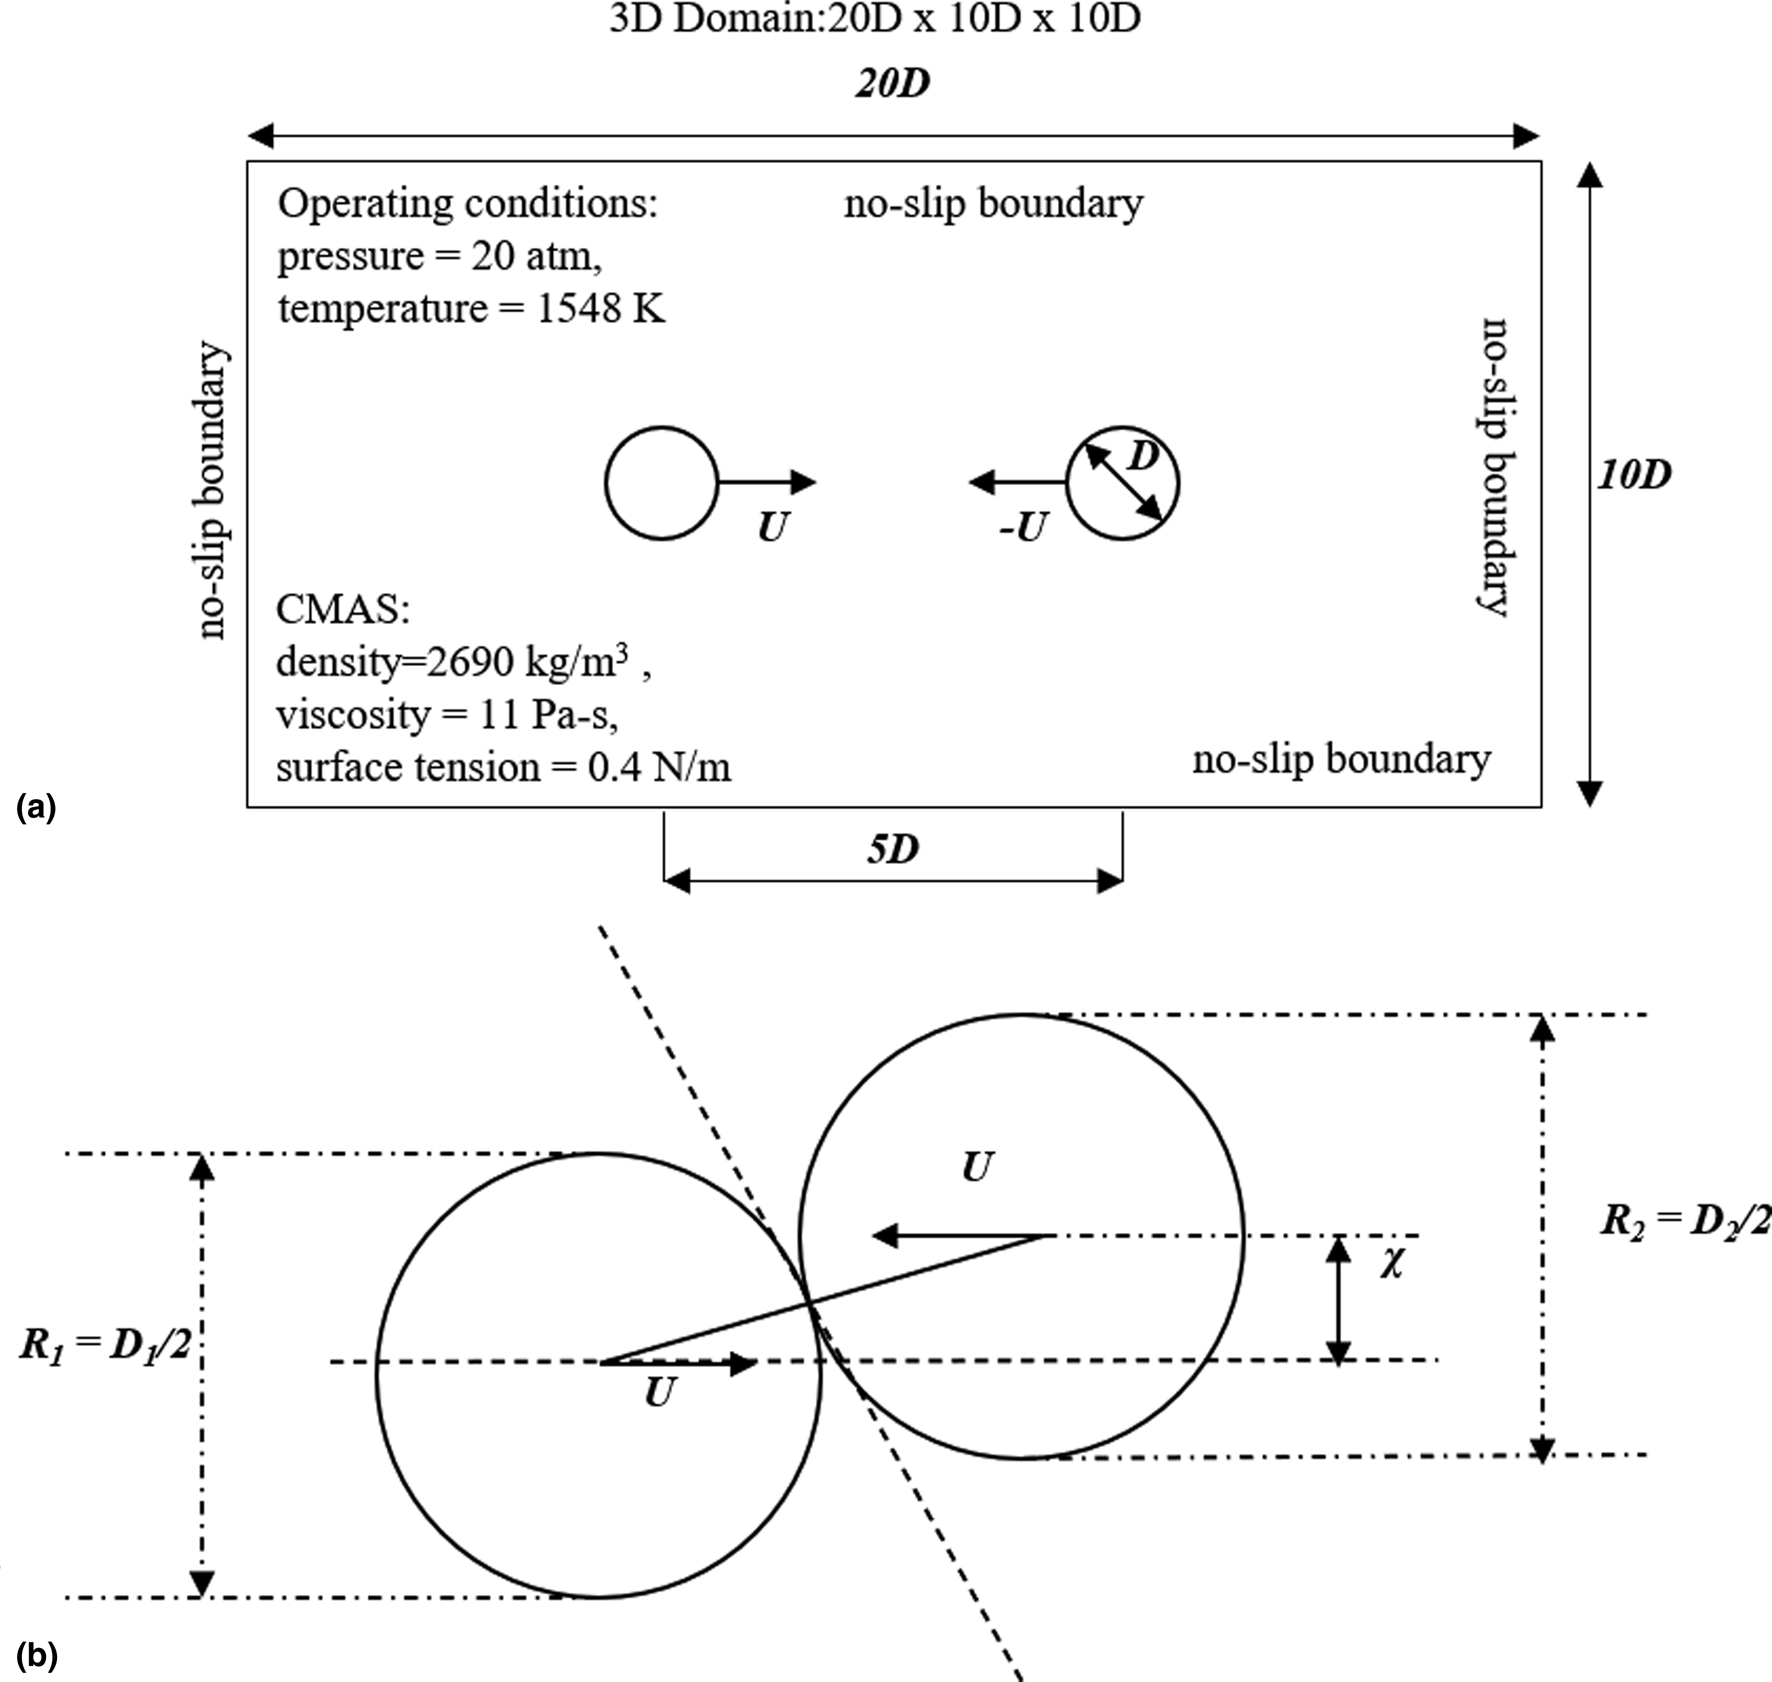
Figure 1: (a) Schematic of the computational setup and (b) relevant geometrical parameters governing droplet collision physics.
The results will be analyzed using the energy budget that consists of kinetic (KE), surface (SE), and dissipation (DE) energies, similar to the analysis conducted by other researchers in the past [Reference Pan, Law and Zhou22, Reference Chen, Ma, Khare and Yang29]. KE of the system is calculated using a volume-weighted sum of the liquid phase kinetic energy, whereas SE is calculated as the product of the surface tension and interfacial area. DE is defined as the time integral of the volume-weighted sum of the viscous deformation rate (VDR) given by [Reference Cohen, Kundu and Dowling33, Reference White34]
 $$ {\rm VDR}\comma \;\Phi = {\rm \mu} \left[{2{\left({\displaystyle{{ {\rm \partial} u} \over {{\rm \partial} x}}} \right)}^2 + 2{\left({\displaystyle{{{\rm \partial} v} \over {{\rm \partial} y}}} \right)}^2 + 2{\left({\displaystyle{{{\rm \partial} w} \over {{\rm \partial} z}}} \right)}^2 + {\left({\displaystyle{{{\rm \partial} v} \over {{\rm \partial} x}} + \displaystyle{{{\rm \partial} u} \over {{\rm \partial} y}}} \right)}^2 + {\left({\displaystyle{{{\rm \partial} w} \over {{\rm \partial} y}} + \displaystyle{{{\rm \partial} v} \over {{\rm \partial} z}}} \right)}^2 + {\left({\displaystyle{{{\rm \partial} u} \over {{\rm \partial} z}} + \displaystyle{{{\rm \partial} w} \over {{\rm \partial} x}}} \right)}^2} \right] + {\rm \lambda} \left({\displaystyle{{{\rm \partial} u} \over {{\rm \partial} x}} + \displaystyle{{{\rm \partial} v} \over {{\rm \partial} y}} + \displaystyle{{{\rm \partial} w} \over {{\rm \partial} z}}} \right)^2. $$
Here, μ is the viscosity of the liquid phase and λ, based on Stokes’ hypothesis, is −2/3μ. For very high Laplace numbers, such as the current study, VDR is expected to be significantly high [Reference Ashgriz and Poo28] which implies that reflexive or stretching separations that are responsible for the breakup of the liquid droplets after coalescence, will be restricted. It should be noted that since the energy equation is not explicitly solved in the current simulations, the sum of KE, SE, and DE will be defined as the total energy, TE. Later in the results section, the discussion will be based on KE, SE, and DE normalized by the maximum TE during the process.
Physical properties of CMAS and computational setup
The computational domain consists of 20D x 10D x 10D, where D is the diameter of the droplet (equal in this manuscript). All the numerical calculations are conducted at a pressure of 20 atm and temperature of 1548 K, conditions representative of a gas turbine combustor. At these conditions, the viscosity and density of air are 5.165 × 10⁻⁴ N s/m2, and 4.56 kg/m3, respectively. At these conditions, the physical properties of CMAS consist of [Reference Jain, Bravo, Bose, Kim, Murugan, Ghoshal and Flatau20] density, ρCMAS = 2690 kg/m3; surface tension between CMAS/air, σCMAS = 0.40 N/m; and viscosity, μCMAS = 11.0 N s/m2. Based on guidance from the work by Bravo et al. [Reference Bravo, Xue, Murugan, Ghoshal, Walock and Flatau19], two droplets of diameter 1 mm are given a velocity of 50 m/s in the opposite direction for each case studied in this research. To elucidate the effect of viscosity, droplet collision of a fictitious fluid with the same properties as CMAS except for viscosity that is lowered by a factor of 10 is also studied. The Laplace numbers corresponding to CMAS and the fictitious fluid droplet collision are 112.45 and 1.12, respectively.
Computational challenges, model validation, and grid sensitivity analysis
Irrespective of the numerical method, the challenges accompanying numerical simulation of incompressible two-phase systems increase dramatically as the density ratio increases [Reference Desjardins and Moureau35, Reference Gorokhovski and Herrmann36]. The time integration scheme used in the current approach involves a classical time-splitting projection method, which requires the solution of the Poisson equation to obtain the pressure field:
 $$\nabla \cdot \left[{\displaystyle{{\Delta t} \over {{\rm \rho}_{n + {1 \over 2}}}}\nabla p_{n + {1 \over 2}}} \right] = \nabla \cdot u_\ast. $$
Equation (5) is solved using a standard multigrid V-cycle methodology, and for large density and viscosity ratios, its solution suffers from slow convergence rates. One of the ways to overcome this issue is by using high grid resolution to resolve the steep density and viscosity gradients at the interface to ensure consistency in the momentum equation. Another method of speeding up the convergence rate is to spatially filter the interface during reconstruction. Even though the current methodology performs very well for the current configuration of droplet interaction at high viscosity and density ratios, the convergence can seriously degrade, depending on the problem and interface topology [Reference Popinet37], in comparison with other methods [Reference Gerlach, Tomar, Biswas and Durst38]. Therefore, for all the cases conducted as a part of this research effort, including the validation study described in the next section, we have used both the aforementioned strategies to ensure accuracy: high grid resolution and spatially filtering (at least once) to ensure numerical accuracy and adequate resolution of the gas–liquid interface.
As a first step, grid sensitivity analysis is conducted to ensure appropriate grid resolution and is used to resolve the physics under consideration. The canonical configuration of equal CMAS droplets colliding head-on (B = 0.0) is selected for the grid sensitivity study. Figure 2 shows a comparison of the liquid morphology for four different refinement levels described below:
(i) level 6 at liquid/gas interface, level 5 for the droplet interior, and level 3 for the rest of the domain—L6.
(ii) level 7 at liquid/gas interface, level 6 for the droplet interior, and level 3 for the rest of the domain—L7.
(iii) level 8 at liquid/gas interface, level 7 for the droplet interior, and level 4 for the rest of the domain—L8.
(iv) level 9 at liquid/gas interface, level 8 for the droplet interior, and level 5 for the rest of the domain—L9.

Figure 2: Time evolution of the liquid interface when two tetradecane droplets collide at an impact factor, B = 0.06. (a) Experimental images of Qian and Law [Reference Qian and Law21] shown on the left and (b) results from current simulations.
As seen clearly, L6 is unable to refine the interface sufficiently. While L7 resolves the interface better to ensure that the gas film when the droplets come closer to each other is resolved, L8 and L9 were investigated, which show almost identical results for interface deformation and evolution as well as the gas film. Therefore, for this study, L8 was selected as the grid resolution. While for high Weber number droplet collision, such as the current study, bouncing is not expected to be an outcome, in addition to gradient and value-based refinements, distance-based refinement is employed to ensure that the gas film is resolved accurately.
Next, model validation is conducted by simulating the experiments conducted by Qian and Law [Reference Qian and Law21]. It should be noted that since no study in the past has investigated CMAS droplet collision, we have to resort to using data on tetradecane droplet collision for validation purposes. We chose a case that incorporates merging, retracting, and formation of satellite droplets to ensure that our framework can accurately model different aspects of the droplet collision phenomena. In this experiment, conducted at a pressure of 1 atm and 300 K, two droplets of diameter 336 μm with 2.48 m/s collide. The density and viscosity of air at these conditions are 1.18 kg/m3 and 1.79 × 10⁻⁴ N s/m2, and that of tetradecane is 785.88 kg/m3 and 2.21 × 10⁻³ N s/m2, respectively. The surface tension between tetradecane and air is 0.02656 N/m. Figure 3 shows the time evolution of events that take place as these droplets collide. The left side shows the experimental measurements and the right are results from the current simulation, showing excellent comparison. All flow features, including droplet coalescence, ligament formation and elongation, subsequent separation by pinching, and satellite droplet formation are accurately captured.

Figure 3: Grid sensitivity study based on levels 6, 7, 8, and 9. (b) shows an overlay of the liquid interface for these levels.[Reference Qian and Law21].
CMAS droplet collision
In the next few sections, we will discuss the dynamics of binary droplet collision for CMAS and the fluid that has a viscosity one-tenth that of CMAS. As mentioned before, the quantitative analysis is based on the energy budget that consists of kinetic, surface, and dissipation energies. The discussion will be based on the normalized values of these energies.
Head-on collision (B = 0.00)
Figure 1(a) shows the schematic of the computational setup. Two CMAS droplets of 1 mm diameter, separated by a distance of 5 mm are given equal and opposite velocities of 50 m/s. The corresponding La number is 112.45. Figures 4(a) and 4(b) show the time evolution of the front and side views, respectively, of this phenomenon. As the droplets travel toward each other, no apparent deformation is observed because of the high surface tension and viscosity. This is also confirmed quantitatively by looking at the surface energy plot in Fig. 6(a) that remains horizontal until the droplets come in contact with each other at T = 0.3. As the droplets come closer, a gas film is developed between them. However, since the relative velocity is quite high (100 m/s), the inertial forces overcome this air cushion, expelling it tangentially to the droplet motion, and come in contact with each other. This is followed by deformation and the development of a tangential contact plane leading to the eventual merging of the two droplets. A toroidal ridge is formed along the tangential plane, resulting in the formation of two rounded mushroom caps. These caps expand radially outward along the tangential plane after initial contact, as shown in the side view in Fig. 4(b). The reflexive movement within the larger droplet is severely restricted due to surface tension and high viscosity of CMAS. This leads to a gradual deformation of the resulting drop that stabilizes a short time after impact. These features are also reflected in the surface energy, shown in Fig. 6(a) which increases after the initial contact between the droplets and reaches a stationary state after a short time. Features such as a toroidal rim, extrusion disc, and surface instabilities that have been observed for high Weber number collisions in the literature [Reference Liu and Bothe24, Reference Kuan, Pan and Shyy25] are not observed as any perturbations and surface phenomena are damped because of high viscosity and surface tension of CMAS. The overall outcome is the coalescence of both droplets into a larger stationary drop with the formation of a toroidal ridge along the merging plane.

Figure 4: Time evolution of the liquid interface when two CMAS droplets collide at an impact factor, B = 0. (a) front view and (b) side view. Nondimensional time T = t/(D/U).
In contrast, as the droplets with one-tenth the viscosity of CMAS (referred to as μCMAS/10) approach each other, they form a radially expanding extrusion disc that gets shattered due to fingering and ligamentation forming multiple smaller droplets, as shown in Figs. 5(a) and 5(b). Since this fluid has the same density and velocity as that of CMAS, it expels the gas film similar to the previous case, but because of lower viscosity, the inertia of the droplets leads to significant deformation followed by the breakup of the merging droplets. Since viscosity is much lower, after the droplets merge, the resulting droplet keeps deforming radially outwards and creates a thin sheet—this growth is observed in the front and side views in Fig. 5 from T = 0.6–1.0. As this sheet grows thinner, a toroidal Taylor–Culick rim and the extrusion disc with Rayleigh Plateau type instabilities are formed. These features have been observed by other researchers in the past [Reference Liu and Bothe24, Reference Kuan, Pan and Shyy25]. The disc is subjected to rapid thinning followed by lamellar destabilization leading to ligamentation with complete shattering into smaller droplets. Because of the formation of many droplets the surface energy increases significantly, as seen in the energy budget in Fig. 6(b). These smaller droplets have a radially outward velocity component on the tangential plane and retain part of the initial KE.

Figure 5: Time evolution of the liquid interface when two μCMAS/10 droplets collide at an impact factor, B = 0. (a) front view and (b) side view. Nondimensional time T = t/(D/U).

Figure 6: Time evolution of kinetic, surface, dissipation, and viscous dissipation rate for droplet collision at B = 0 for (a) CMAS droplets and (b) droplets with one-tenth the viscosity of CMAS.
In general, as the droplets move and collide, the exchange of energy takes place between KE, SE, and DE. Figure 6(a) shows the energy budget for CMAS droplet collision described in the previous section. As the CMAS droplets move toward each other, because of the high surface tension, there is little to no deformation, reflected by no change in surface energy till T = 0.3. During this time, because of the high viscosity, the viscous dissipation rate (VDR), calculated using Eq. (4), and consequently, DE (time integral of viscous dissipation energy) increases steadily. As these viscous droplets come in contact with each other (T = 0.3–0.9), there is a significant decrease in KE and an increase in SE corresponding to an increase in surface area. Simultaneously, the DE increases at a much higher rate because of the merging of highly viscous CMAS droplets. In contrast, for the fictitious liquid (μCMAS/10), after the droplets collide, significant deformation takes place because of the lower viscosity, as observed by the evolution of SE in Fig. 6(b). VDR spikes at the time of impact, followed by a rapid decrease. SE has a small reduction at impact when the droplets star merging, owing to a small reduction in the surface area.
Off-center collision (B = 0.50)
Figure 7 shows the time evolution of the liquid interface for the off-center collision of CMAS droplets. The operating conditions, including the droplet velocities, are identical to the head-on collision case. For this case, as the CMAS droplets impinge on each other, they slide and deform along the tangential plane and transform into a hemispherical shape. Because of the high inertia of these droplets, their momentum keeps them moving. Simultaneously, the surface tension and viscous forces that are acting at the contact point result in the adhesion of these droplets as they try to slide. As a result, the momentum of the liquid at the contact point is lost, but the top and bottom droplet parts still try to move along the original direction, resulting in a torque causing rotational motion along an axis through the contact point and parallel to the tangential plane. The merged structure stretches until all momentum is lost and the droplet can no longer stretch, as observed from T = 1.6–1.8 in Fig. 7. Stretching separation is not observed because of high viscosity; however, the surface area continuously increases due to stretching of the resulting structure. These trends are also observed in the energy budget shown in Fig. 10(a), which in general are similar to that of the head-on collision, except that the SE, in this case, increases because of stretching.
Figure 7: Time evolution of the liquid interface when two CMAS droplets collide off-center at an impact factor, B = 0.5. Nondimensional time T = t/(D/U).
As shown in Fig. 8(a), the initial events as droplets of the fictitious liquid (μCMAS/10) approach each other are similar to that of CMAS—they deform along the tangential plane and form hemispherical bulges as the momentum of the droplets moves them apart. Because the surface tension of these droplets is the same as CMAS (which is very high as compared to most liquids that are studied in the literature), they adhere to each other; however, since the viscosity is one-tenth of CMAS, there is stretching during the deformation process along the tangential plane. The bulk of the mass in the merged droplet is at the ends which through deformation and stretching creates a rim at the ends, and a sheet in the middle along the tangential plane. As stretching continues, the sheet becomes thinner and form fingers, as seen at T = 1.4–1.8 in Fig. 8(a). If we take a look at the side view at T = 2.0, shown in Fig. 8(b), breakup behaviors similar to beads-on-a-string are observed. These characteristics have been observed in the literature for droplet breakup of shear thinning non-Newtonian and very viscous droplets [Reference Khare and Yang39]. The energy budget for the off-center collision of lower viscosity liquid is very similar to that of the head-on collision case, except that the kinetic energy is retained throughout the process because of the continuous stretching of the merged structure. These trends are quantitatively shown in Fig. 10(b).

Figure 8: (a) Time evolution of the liquid interface when two μCMAS/10 droplets collide off-center at an impact factor, B = 0.5 and (b) zoomed side view of the liquid interface at T = 2.0 showing beads-on-a-string type structures. Nondimensional time T = t/(D/U).
Grazing collision (B = 0.80)
Figure 9(a) shows the time evolution of the liquid interface when two CMAS droplets undergo collision, corresponding to B = 0.8. Similar to the off-center collision at B = 0.5, the droplets come in contact with each other tangentially and deform to form a tear-drop shaped lobe. However, since they are further apart along the horizontal axis, the surface tension acts at a much smaller contact area at the liquid–liquid interface. Two competing forces are acting on this two droplet system—the inertial force trying to maintain the momentum of the two droplets in opposite directions and the surface tension and viscous forces trying to merge the droplets. Different from the head-on and slightly off-center collision cases, the inertia dominates and instead of merging, the tear-shaped droplets maintain their motion and separate from each other with the creation of a satellite droplet. In addition to translational motion, because of their brief contact, slight rotation in the equal and opposite direction is imparted to the two droplets. The corresponding energy budget is shown in Fig. 10(c). As observed from the figure, there is a slight but progressive increase in the SE corresponding to the formation and stretching of the tear-drop shape, and a monotonic decrease in KE as both the droplets dissipate energy to the air.

Figure 9: Time evolution of the liquid interface for grazing droplet collision at an impact factor, B = 0.8 for (a) CMAS droplets and (b) droplets with one-tenth the viscosity of CMAS. Nondimensional time T = t/(D/U).

Figure 10: Time evolution of kinetic, surface, dissipation, and viscous dissipation rate for droplet collision for (a) CMAS droplets at B = 0.5; (b) droplets with one-tenth the viscosity of CMAS at B = 0.5; (c) CMAS droplets at B = 0.8; and (d) droplets with one-tenth the viscosity of CMAS at B = 0.8.
Figure 9(b) shows the time evolution of the liquid interface for the other liquid (μCMAS/10). Similar to CMAS, the smaller contact area of the two droplets lead to the formation of lobes, which due to the higher malleability (due to lower viscosity) of this liquid leads to the formation of a thin lamellar central region. Since the bulk of the droplet mass does not interact, a significant fraction of momentum and KE is retained by the droplets. Unlike the CMAS droplets, for this fluid, the thin lamella at the contact surface stretches and eventually breaks up due to capillary instabilities. Breakup of the lamella leads to relaxation of the separating droplets that causes a small decrease in the surface area, followed by an increase due to formation of satellite droplets. The energy budget is significantly different as compared to B = 0.5 case primarily because of the significantly reduced deformation for this case that leads to only a slight increase in SE. The DE increases slightly when the droplets interact, marked by the spike in VDR in the neighborhood of T = 0.6, after which it remains practically constant. KE maintains a constant fraction of the total energy for the entire duration of the phenomena. These trends are shown in Fig. 10(d).
SUMMARY
Collisions of equal-sized CMAS droplets (Δ = 1.0) for three different impact parameters (B = 0.0, 0.5, and 0.8) were numerically simulated at conditions representative of a gas turbine combustor to elucidate the fundamental processes and mechanisms that dictate their interactions. CMAS is in liquid form at these conditions and, therefore, was modeled as a liquid with appropriate density, viscosity, and surface tension—these physical properties have been previously reported in the literature. To identify the effect of the high viscosity of CMAS (it should be noted that the surface tension and viscosity of CMAS are at least two orders of magnitude higher than most hydrocarbons), a fictitious fluid with all properties identical to CMAS except viscosity, which was reduced by a tenth, was also studied. The droplets are given an initial velocity of 50 m/s, as they approach each other either head-on or off-center. It is found that for B = 0 and 0.5, due to the high Laplace number, results in the coalescence of CMAS droplets; a pear shape in the former and a stretched rotating structure with lobes at the end in the latter. For the lower viscosity fluid, while the droplets coalesce for both these cases too, they stretch significantly, forming thin films/structures, and eventually break up due to pinch-off. Separation occurs for grazing case (B = 0.8) for both CMAS and the fictitious fluid, however, the mechanism leading to it are completely different. For CMAS, the droplets deform into angled tear-drop shapes and continue in their original direction producing a satellite drop. In contrast, the collision of droplets of the fictitious fluid leads to the development of a bridge that stretches, rotates, and then separates creating several satellite droplets. The droplet collision physics was quantified using the evolution of the normalized kinetic, dissipation, and surface energies.
METHODOLOGY
Current research poses two stringent challenges that need to be addressed to quantitatively identify the underlying physical processes present when two CMAS droplets interact. The challenges are (i) the presence of multiple phases and frequent interfacial topology changes and (ii) the existence of widely disparate length and time scales that need to be resolved in an accurate and computationally efficient manner. To accurately address the first issue, the most appropriate approach to investigating the flow physics of interest with high fidelity is based on a Eulerian–Eulerian framework, that is, all relevant phases (liquid and gaseous) being treated as continuous, and the interface between them is captured. This approach is also called the one-fluid approach in the literature [Reference Tryggvason, Scardovelli and Zaleski40]. To appropriately resolve the wide range of spatial and temporal scales, an adaptive mesh refinement (AMR) methodology is adopted such that high resolution is achieved in reasonable turnaround time. Based on this rationale, the next subsection details the theoretical framework and numerical methods that are used in this research effort.
Governing equations
The formulation is based on the three-dimensional, incompressible, variable density form of the Navier–Stokes equations with surface tension. The mass conservation equation is given by
 $$\displaystyle{{{\rm \partial \rho }} \over {{\rm \partial} t}} + \overrightarrow u \cdot \nabla {\rm \rho} = 0$$
which, considering incompressibility becomes
 $$\overrightarrow {\nabla \cdot u} = 0. $$
Conservation of momentum is given as
 $$\displaystyle{{{\rm \partial \rho} \overrightarrow u } \over {{\rm \partial} t}} + \nabla \cdot \lpar {{\rm \rho} \overrightarrow u \overrightarrow u } \rpar = {-}\nabla p + \nabla \cdot \tilde{\rm \tau } + \vec{F}_{\rm st},$$
where F st is the surface tension force per unit volume and τ is the shear stress tensor.
 $$\tilde{\rm \tau } = {\rm \mu} \lpar {\nabla \vec{u} + {\lpar {\nabla \vec{u}} \rpar }^T} \rpar. $$
A state-of-the-art, high-resolution, VOF) interface capturing method is adopted for large-scale interfacial evolution. Surface tension is accommodated as a Dirac distribution function on the interface. Governing equations are written in a Eulerian reference frame to capture the gas–liquid interface. A VOF scalar variable c, to trace the multi-fluid interface is given as follows:
 $$c = \left\{{\matrix{ 0, & {{\rm fluid\ 1}} \cr 1, & {{\rm fluid\ 2}} \cr } } \right.$$
Density and viscosity for each computational cell are defined as linear functions of c as follows:
 $$\eqalign{{\rm \rho} \lpar c\rpar & = c{\rm \rho} _1 + \lpar 1-c\rpar {\rm \rho} _2, \cr {\rm \mu} \lpar c\rpar & = c{\rm \mu} _1 + \lpar 1-c\rpar {\rm \mu} _2.} $$
The advection equation for density can then be written as an equivalent equation for the volume fraction:
 $$\displaystyle{{{\rm \partial} c} \over {{\rm \partial} t}} + \lpar \overrightarrow u \cdot \nabla c\rpar = 0.$$
The conservation equations are written for the different phases without using the jump condition at the interface, which translates to singularities in the governing equations. It can be shown that this formulation is equivalent to that written for each phase separately with the pressure jump condition at the interface. As pointed out by Tryggvason et al. [Reference Tryggvason, Scardovelli and Zaleski40], the one-fluid approach can be interpreted in two ways, in a weak sense, in which the governing equations are satisfied only in the integral form, or by admitting solutions using step and delta functions. In this study, we use the latter approach by modeling the surface tension effects using the continuum surface force model developed by Brackbill et al. [Reference Brackbill, Kothe and Zemach41]:
 $$\vec{F}_{\rm st}\lpar \vec{x}_1\rpar = {\rm \sigma} \int_S {{\rm \kappa} \lpar {\vec{x}}_2\rpar \hat{n}\lpar {\vec{x}}_2\rpar {\rm \delta} \lpar {\vec{x}}_1-{\vec{x}}_2\rpar {\rm d}S}, $$
where σ is the surface tension force, κ is the local curvature, and δ is the Dirac delta function. κ is evaluated as follows:
 $${\rm \kappa} = \displaystyle{1 \over {R_1}} + \displaystyle{1 \over {R_2}},$$
where R 1 and R 2 are the principal radii of curvature. Surface tension force for each cell at the interface is approximated by
 $$\vec{F}_{\rm st}\approx {\rm \sigma \kappa \delta} \hat{n}.$$
Numerical approach and mesh adaptation
The governing equations described above are solved using a projection method based on variable density fractional step numerical methodology using a Gerris framework [Reference Popinet37, Reference Popinet42]. The interim velocity is computed in the first step. The pressure field is then computed by solving the Poisson equation and projecting the interim velocity onto a divergence-free velocity field. Quad/octree spatial discretization is used in combination with a multigrid V-cycle Poisson solver to obtain the pressure distribution. The primitive variables, such as momentum components, pressure, and volume fraction, are volume averaged and collocated at the cell centers of the discretized volume. This collocated definition of primitive variables is useful for mesh adaptation and facilitates the implementation of the Godunov scheme for the nonlinear convective terms. To treat the viscous terms accurately, an approximate projection method developed by Almgren et al. [Reference Almgren, Bell and Crutchfield43] is used. The scalar VOF variable c is obtained by solving the advection equation for the volume fraction. A piecewise-linear geometrical VOF scheme generalized for quad/octree spatial discretization is used to solve Eq. (7). The value of c in each cell then corresponds to the fraction of the finite volumes filled with different phases. Computational cells completely filled with fluid 1 are characterized by c = 0 and fluid 2 by c = 1, and cells containing the interface are characterized by 0 < c < 1. Since face-centered velocities are divergence-free, and the function c is then advected using the computed velocity field. Details of the various numerical algorithms used in this paper can be found elsewhere [Reference Popinet37, Reference Popinet42, Reference Khare44].
Even though fixed mesh algorithms have been used successfully for dynamically evolving interfacial flows, it is extremely computationally expensive and often cost-prohibitive. AMR is one of the most efficient ways to mitigate this problem. The AMR implementation used in the present research is based on structured grids to facilitate the implementation of the various numerical algorithms and reduce the computational overhead while providing excellent mass conservation characteristics. The octree discretization further assists in the implementation of the multigrid V-cycle solver for the solution of the Poisson equation. The structured adaptive mesh refinement (SAMR) grid methods have been successfully used by researchers to explore a wide range of physical phenomena, ranging from large-scale numerical relativity to fluid dynamics and combustion simulations [Reference Bell, Plewa, Linde and Weirs45, Reference Jourdren, Plewa, Linde and Weirs46, Reference Myers, Baden, Chrisochoides, Gannon and Norman47, Reference Pernice, Bockelie, Swensen, Smith, Baden, Chrisochoides, Gannon and Norman48].
Therefore, to ensure that the wide range of spatial and temporal scales are resolved with high fidelity, an AMR technique is implemented to improve the solution accuracy and efficiency. The adaptive quad/octree spatial discretization is especially useful for the liquid–gas and liquid–liquid interface refinement. The grid adaptation criterion depends on physics under consideration. Several refinement criteria, including value, gradient, distance, and thickness based are implemented to resolve the interfacial and interior characteristics of the CMAS droplet collision phenomena. The grid is refined or coarsened by comparing the refinement indicator in each cell to a predefined threshold value. Further, the code is parallelized based on message passing interface libraries for massively parallel computations. This framework has been used extensively for a wide range of multiphase flow problems, including liquid jet atomization in the presence of broadband inlet fluctuations, impinging liquid jets, droplet breakup, and collision phenomena [Reference Chen, Ma, Khare and Yang29, Reference Gamertsfelder, Khare and Bravo49, Reference Notaro, Khare and Lee50, Reference Ma, Chen, Khare and Yang51].
Various numerical schemes used for the spatial discretization impose restrictions on the maximum allowable time step that can be used to ensure numerical stability. These constraints are determined by the convective, viscous, and surface tension terms, and the time step is calculated based on the following criteria:
Convective term: this constraint is probably the most well-known and is defined by the Courant Friedrichs and Lewy (CFL) condition given by the following equation:
 $${\bf max}\left[{\displaystyle{{\vert {u}_{i\comma j\comma k}\vert \Delta t_{{\rm convection}}} \over \Delta }} \right]\lt {\rm CFL}_{\max }.$$
This restriction ensures that the fluid volume convected to the neighboring cell is not more than the amount of fluid in the cell. We used a conservative value of 0.5 for the CFL number during our simulations to ensure consistency and accuracy.
Surface tension term: the stability condition for the explicit treatment of surface tension is restricted by the appropriate time step resolution of the capillary waves given by [Reference Brackbill, Kothe and Zemach41]
 $$\Delta t_{\rm st} = \sqrt {\displaystyle{{{\rm \rho} _L + {\rm \rho} _g} \over {4{\rm \pi \sigma }}}\Delta ^3}. $$
Viscous term: the time step restriction imposed by this term is given by
 $$\Delta t_{\rm visc} = {\rm min}\left[{\displaystyle{{{\rm \rho} {\lpar c\rpar }_{i\comma j\comma k}} \over {{\rm \mu} {\lpar c\rpar }_{i\comma j\comma k}}}\displaystyle{{\Delta^2} \over 6}} \right].$$
The time step chosen for a given instant is given by the minimum of these three times.
Acknowledgments
The authors gratefully acknowledge the Advanced Research Computing Center at the University of Cincinnati for their support. Luis Bravo was supported by the US Army Research Laboratory 6.1 basic research program in propulsion sciences.


