


Introduction
Pop-in during indentation testing or uniaxial micro-scale testing is a commonly used term to indicate the sudden displacement burst in a force-controlled test. In some cases, it is associated with the onset of yielding [Reference Page, Oliver and McHargue1]. Studying the pop-in behavior of materials has been of great interest to the small-scale mechanics community [Reference Uchic, Shade and Dimiduk2, Reference Oliver, Lawn, Cook, Reitsma, Bradby, Williams and Munroe3, Reference Wang, Bei, George and Pharr4, Reference Wang and Ngan5, Reference Li, Gao, Bei and George6, Reference Schuh and Nieh7, Reference Lorenz, Zeckzer, Hilpert, Grau, Johansen and Leipner8, Reference Shim, Bei, George and Pharr9, Reference Durst, Backes, Franke and Göken10, Reference Sudharshan Phani, Johanns, George and Pharr11]. It has been often used to understand size dependence of strength at small scales during uniaxial [Reference Uchic, Shade and Dimiduk2, Reference Sudharshan Phani, Johanns, George and Pharr11] and indentation testing [Reference Sudharshan Phani, Johanns, George and Pharr12]. Although some studies [Reference Wang, Bei, George and Pharr4, Reference Li, Gao, Bei and George6, Reference Lorenz, Zeckzer, Hilpert, Grau, Johansen and Leipner8, Reference Shim, Bei, George and Pharr9, Reference Sudharshan Phani, Johanns, George and Pharr11, Reference Sudharshan Phani, Johanns, George and Pharr12] analyze the load at the onset of pop-in, there are others [Reference Uchic, Shade and Dimiduk2, Reference Dimiduk, Dennis, Woodward, LeSat and Uchic13, Reference Zaiser, Schwerdtfeger, Schneider, Frick, Clark, Gruber and Arzt14, Reference Ng and Ngan15, Reference Brinckmann, Kim and Greer16, Reference Csikor, Motz, Weygand, Zaiser and Zapperi17, Reference Sparks, Phani, Hangen and Maa18] that analyze the statistics of the displacement burst size (length) or velocity and the associated load and have also proposed possible plasticity mechanisms [Reference Dimiduk, Dennis, Woodward, LeSat and Uchic13, Reference Brinckmann, Kim and Greer16, Reference Csikor, Motz, Weygand, Zaiser and Zapperi17, Reference Maaß, Derlet and Greer19] that can explain the experimental observations. The large body of literature clearly demonstrates the value of using the pop-in behavior to study small-scale plasticity. However, most of the prior work that utilizes the size of the strain burst is based on analyzing the pop-in as a strain burst event that occurs instantaneously without considering the dynamics of the instrument. This may appear to be a valid approach considering the experimental limitations in terms of measurement speed available in commercially available nanoindenter over the past few decades. However, the very fact that these events happen quickly makes a strong case for analyzing the results from a dynamics perspective, which is one of the main objectives of the present work.
Before analyzing the dynamics of the pop-in event, it is pertinent to consider some of the key aspects of the event typically reported in the literature. Figure 1, adapted from Shim et al. [Reference Shim, Bei, George and Pharr9], shows a typical load–depth plot during spherical indentation into single crystal Ni, showing a large pop-in event. The experiment was performed on a force-controlled system. It has been demonstrated (through unloading before pop-in) that the material exhibits a nearly reversible, elastic response up to the onset of pop-in, followed by a displacement burst characterized by the horizontal region after the onset of pop-in. Before the pop-in, the Hertzian theory was used to model the material behavior. Subsequent to the displacement burst, there is a transition region, wherein the slope of the curve is steeper than that at larger depths, followed at larger depths by a region where the load–depth curve behaves in a nearly linear fashion, as expected for elastic–plastic indentation with a sphere. However, these observations and explanations are based on the experimental data typically collected at data acquisition rates in the range of 100–1000 Hz with a displacement time constant of the order of milliseconds and hence may not be able to capture the actual response during the pop-in that can potentially occur in the microsecond time scale.

Figure 1: Typical load–depth plot measured during spherical indentation pop-in [Reference Shim, Bei, George and Pharr9].
Given the recent advances in measurement instrumentation and the availability of simple dynamic models to accurately describe the instruments' dynamic response, the response of the material during a pop-in can be experimentally determined at very high data acquisition rates and fast measurement time constants to provide new insights. Specifically, this work attempts to provide insights on the following issues.
(i) Given that a pop-in event can occur in the microsecond time scale, what is the actual load experienced by the sample during the pop-in event?
(ii) What is the actual pop-in displacement and does it represent the material only behavior or is there a significant contribution from instruments' dynamics?
(iii) What causes the increased slope in the load–depth curve at the end of the pop-in?
(iv) Can we explain the experimental observations with a simple continuum plasticity-based model?
To address the abovementioned issues, high-speed experimental data during a spherical indentation test on single crystal sapphire, which shows a single clear pop-in event, are presented. The data are subsequently analyzed by considering the dynamic response of the measuring instrument. The experimental data are compared with the predictions from a simple model that considers the dynamics of the instrument and the strain rate effects on the strength of a material. Finally, the implications of these findings on the determination of length and/or velocity of pop-in, and also for performing displacement-controlled testing involving closed loop control, are discussed.
A simple method to simulate a spherical indentation pop-in event
In this section, a simple method is presented to simulate the pop-in event during spherical indentation, considering the dynamics of the testing instrument. Although the procedure presented here is specific to spherical indentation, the approach is readily applicable to other related problems such as pop-in during micro-pillar compression/tension or indentation pop-in with pyramidal/conical tip geometries. The two major aspects of the method are as follows: modeling the dynamic response of the material during the fast pop-in event and the incorporation of the dynamic effects of the instrument during such an event.
In the case of the material response, the elastic and elastic–plastic responses have to be considered separately. The load–depth response before the pop-in event can be assumed to be governed by Hertzian elastic response, wherein the load is proportional to the depth raised to the power 1.5, as shown in Fig. 2. The proportionality coefficient can be determined from the tip radius and reduced elastic modulus of the material or from directly fitting the experimental data before pop-in. Unlike the elastic response before pop-in, modeling the elastic–plastic material response after the onset of pop-in is challenging. In this regard, we propose a few assumptions to simplify the problem based on continuum plasticity concepts. As shown in Fig. 2, at the onset of pop-in represented by the point (h pop, P pop), the strength of the material is assumed to drop instantaneously. In the absence of any rate dependence on strength, the load drop can be determined from the extrapolation of the large depth data to the depth at the onset of pop-in (h pop). At large depths, well away from the pop-in, the load–depth response can be assumed to be linear, which is a reasonable assumption for spherical indentation as reported by Taljat et al. [Reference Taljat, Zacharia and Kosel20], who showed that beyond the initial transition (depth/radius >0.01), the load–depth curves are linear with a weak dependence on the work-hardening exponent. Based on these assumptions, the load–depth response can be written as follows:
 $$P = {P_{\rm{o}}} + {C_{\rm{p}}}\left( {h - {h_{{\rm{pop}}}}} \right)\quad ,$$
where C p is the slope of the assumed linear behavior, h pop is the depth at the onset of pop-in, and P o corresponds to the load at h pop. The parameter C p scales with the hardness, and hence the rate dependence of strength can be incorporated into this model by varying the parameter C p as a function of strain rate. Prior work [Reference Kimberley, Ramesh and Daphalapurkar21, Reference Holland and McMeeking22] on the macroscopic room temperature dynamic response of ceramic materials indicates the absence of significant rate dependence up to a critical strain rate, beyond which there is a power-law type of rate dependence with a universal exponent of 2/3 for a variety of ceramic materials including Al2O3. Based on the analysis presented for macroscopic high strain rate deformation of ceramics [Reference Kimberley, Ramesh and Daphalapurkar21, Reference Holland and McMeeking22], the rate dependence can be incorporated in the pop-in model by varying the parameter C p as follows.
 $${C_{\rm{p}}} = {C_{{\rm{po}}}}\left[ {1 + 0.1{{\left( {{{{{\dot{h}} / h}} \over {{{\dot{\varepsilon }}_{\rm{o}}}}}} \right)}^{{2 / 3}}}} \right]\quad .$$
Figure 2: Schematic of a load–depth response during a spherical indentation test with a pop-in event, showing the elastic response before pop-in and the linear elastic–plastic response at large depths away from the onset of pop-in.
In Eq. (2), C po is the slope of the linear fit shown in Eq. (1) at large depths (and also low strain rates),  ${\dot{\varepsilon }_{\rm{o}}}$ is the critical strain rate for rate effects to be significant, and ${{\dot{h}} / h}$ is a measure of indentation strain rate. Note that ${{\dot{h}} / h}$ may not accurately represent the strain rate for spherical indentation, wherein the strain rate is known to scale with the contact size. However, as the contact size is not known during the pop-in event, we resort to assuming ${{\dot{h}} / h}$ to be a reasonable approximation of strain rate as it can be experimentally measured. Using Eq. (2) in conjunction with Eq. (1), the rate dependent load–depth response during a pop-in event can be determined for any given pop-in load. In essence, this model simply assumes that the strength has rate dependence beyond a critical strain rate which results in a change in the slope of the load–depth curve.
In addition to the material response described above, the dynamic response of the instrument needs to be incorporated to simulate a pop-in event. In this regard, we use a 1 degree of freedom (1 DOF) dynamic model to represent the instrument, as it was previously found [Reference Sudharshan Phani and Oliver23] to accurately describe the instrument's dynamic response. The details of the model are discussed elsewhere [Reference Sudharshan Phani and Oliver23]. The model represents the actuator as a mass (m), spring (k), and dashpot (b), the sample as a spring and a dashpot and the load frame as a spring. In this study, we neglect the damping effects in the sample which is reasonable for sapphire. The resultant force balance equation then takes the following form.
 $$P = F - kh - b\dot{h} - m\ddot{h}\quad .$$
 In the above equation, P is the load on the sample, F is the force generated by the actuator, and h is the depth. In Eq. (3), the  $kh,\;b\dot{h}$, and $m\ddot{h}$ terms represent the force contributions of the instruments' spring, dashpot (damping), and the mass, respectively. It is important to recognize the distinction between load and force, especially under dynamic loading conditions. Force (F) is used to refer to the force that is generated by the actuator, whereas load (P) is the actual load that the sample experiences after accounting for the contribution of the instrument. Note that in the case of a quasistatic indentation test, the damping $\left( {b\dot{h}} \right)$ and inertial $\left( {m\ddot{h}} \right)$ terms are negligible and the load needs correction only for the contribution of the springs, and for a reasonable size contact, the load is very close to the force zeroed from the point of initial contact. Also, although Eq. (3) does not explicitly show the contribution of the load frame stiffness (k f), its effect is considered by adding an additional depth equal to P/k f.
The dynamic response during a pop-in event can be simulated by solving the differential equation shown in Eq. (3), in conjunction with Eqs. (1) and (2). The material-dependent inputs for the model are the Hertzian elastic response, the load at the onset of pop-in (P pop), the linear fit to the load–depth data at large depths from which C po and P o are determined, and the critical strain rate for considering the rate dependence, which is reported to be ∼103 s−1 for a number of materials [Reference Holland and McMeeking22, Reference Lankford24]. The instrument-dependent inputs are the mass (m), damping coefficient (b), spring stiffness (k) of the actuator, and the load frame stiffness (k f). The test input is the force (F) as a function of time, and the output of the simulation is the corresponding depth and load. The simulation results for load and depth during the pop-in event will be compared with the experimental observations to assess some of the assumptions made in this simple model.
High-speed experimental data during spherical indentation pop-in
In this section, experimental data collected during spherical indentation on c-axis–oriented single crystal sapphire are presented. The typical data acquisition rate is 100 kHz and the displacement time constant is 20 μs. The force was ramped exponentially with an exponent of 0.05 s−1. The tests were performed in an open loop mode resulting in a force-controlled test, thus avoiding any complexities associated with control loops for accurate determination of load. The load at the onset of pop-in, observed from multiple tests, showed minimal variation with a mean pop-in load of 10.45 ± 0.58 mN. The maximum shear stress at the onset of pop-in, determined by Hertzian analysis, is ∼G/7, where G is the shear modulus, indicating that the sample is pristine and the strain burst may have been caused by nucleation of defects.
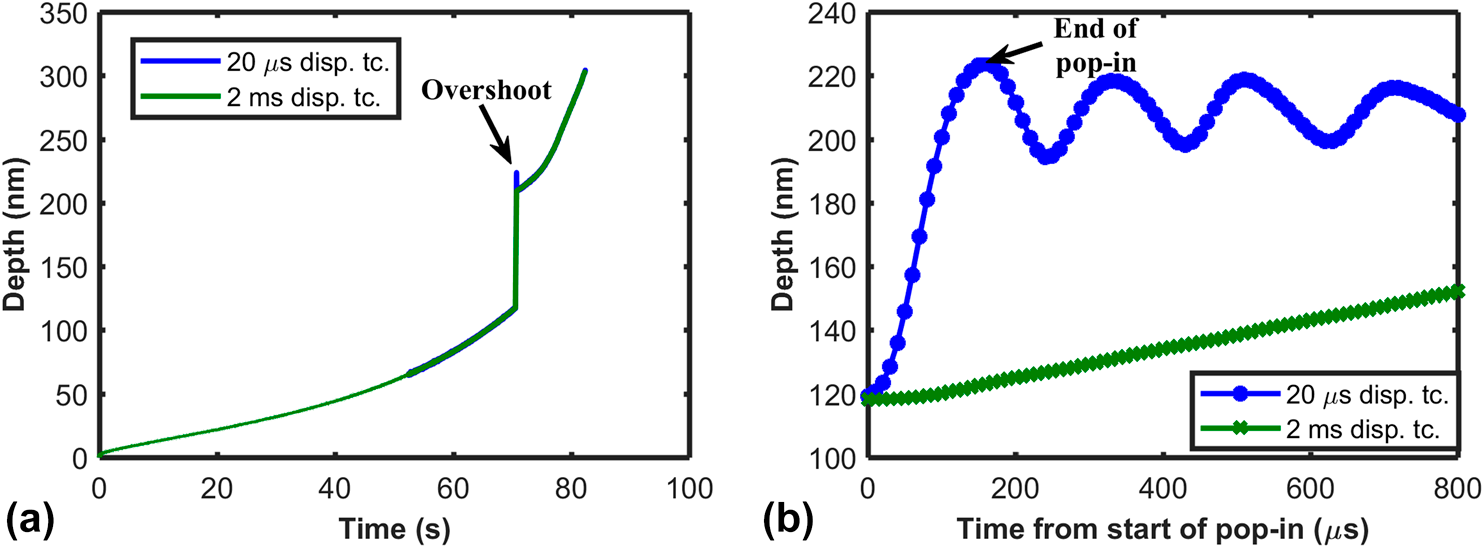
Figure 3(a) shows depth as a function of time during a single test, starting from the point of surface contact up to the end of loading. The measured response for a sensor with a displacement time constant of 2 ms is also shown for comparison, in contrast to a standard displacement time constant of 20 μs used for the present study. Careful observation of the plot shows that there is an overshoot in the depth due to the pop-in, followed by a region where the depth changes gradually before it takes off at larger depths. The zoomed view in the region of the displacement burst is shown in Fig. 3(b). The time scale is reset from the point of onset of pop-in and is shown in μs. It can be observed that the pop-in event takes 160 μs followed by a region where the contact oscillates which is a typical response of an underdamped dynamic system subjected to a sudden load change. Note that these oscillations are not large enough to lose contact which can occur under certain conditions especially during micro-pillar testing [Reference Johanns, Sedlmayr, Sudharshan Phani, Mönig, Kraft, George and Pharr25]. In contrast to the measured response at 20 μs, the 2ms response does not capture the actual depth response during the pop-in event that occurs within 160 μs. Unfortunately, a large body of literature on pop-in behavior is typically reported by testing on instruments that have displacement time constant of the order of milliseconds. However, there is no significant difference in the measured response between the two time constants in the regions away from the pop-in (after ∼20 ms) as evidenced from Fig. 3(a).

Figure 3: (a) Depth as a function of time during a spherical indentation test showing a sudden displacement burst and (b) zoomed view of depth–time response from the onset of the pop-in event for two different displacement time constants.
Figure 4 shows the velocity and the acceleration determined from the first and second derivatives of the depth–time response. The derivatives are calculated after applying relatively small time constant corrections to the depth signal based on the procedure laid out by a previous work of the authors [Reference Sudharshan Phani and Oliver23]. It can be observed from the plot that relatively high velocity of the order of mm/s is attained during a pop-in event. Given that the depths are less than a micron, the strain rate, which scales as the ratio of the velocity to the depth, can be in excess of 103 s−1. This indicates the definite possibility of rate-dependent material processes occurring during a pop-in. The acceleration shown in Fig. 4(b) is also high during the initial stages of the pop-in, as may be expected from the velocity plot, which indicates that the inertial effects can dominate the measured response initially.
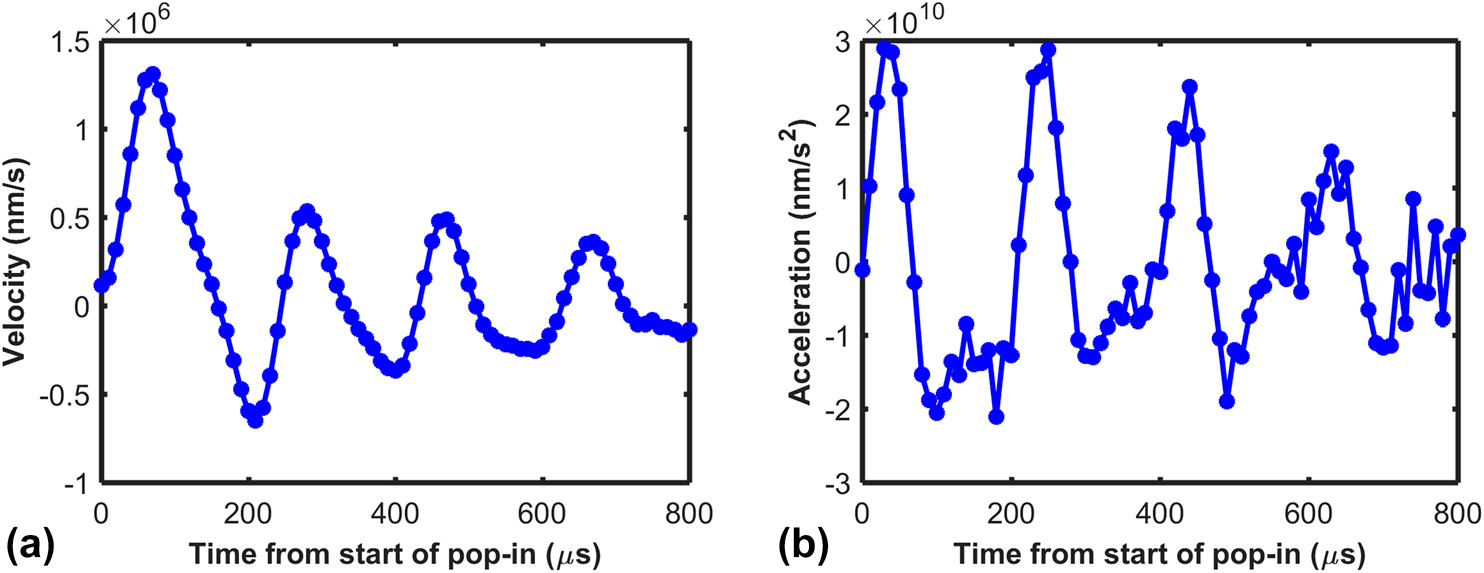
Figure 4: (a) Velocity and (b) acceleration from the onset of the pop-in event determined from the first and second derivatives of the depth–time response.
From the depth, velocity, and the acceleration data shown in Figs. 3 and 4, the load (P) after accounting for the dynamic contribution of the instrument can be determined using equation Eq. (3). Figure 5(a) shows the load as a function of time starting from the onset of pop-in. The plot clearly shows that there is significant dynamic overload due to the pop-in as the maximum load achieved is around 13 mN compared with an applied force of 10.45 mN, which is shown with the dashed line. This overload is caused due to the deceleration of the indenter toward the end of the pop-in event. The dynamic overload has implications for the observed length of pop-in and also the steeper region in the load–depth curve subsequent to the pop-in. This aspect will be discussed in detail in the later part of the manuscript. Figure 5(b) shows the force contribution fractions that are obtained from taking the ratio of each term in Eq. (3) to the applied force F. Hence, the sample contribution fraction is P/F, the instruments' inertial, damping, and spring contributions are,  ${{m\ddot{h}} / F}$, ${{b\dot{h}} / F}$, and kh/F, respectively. Three major regions are highlighted in the plot: an initial region up to 30 μs, wherein the experimental data may be prone to errors due to uncertainty in the detection of onset of pop-in and the difficulty in accurately determining the second derivative with just a few data points. The region beyond 160 μs represents the data beyond the pop-in wherein the load oscillates and the sample unloads from the point of maximum load. The intermediate region 30–160 μs is the region during the pop-in where the experimental data are reliable and will be the region of subsequent discussion. The plot also clearly shows that spring and damping contributions are not significant under the current test conditions. The instrument's contribution is dominated by the inertia and is found to be around 20% of the applied force for most part of the pop-in. Note that the inertial contribution switches from positive to negative, indicating that the system switches from acceleration to deceleration toward the end of pop-in. The sample's contribution fraction starts from 1 and goes up to 1.3, which shows the extent of dynamic overload. As may be expected, the inertial contribution is comparable to the sample contribution in the early stages of the pop-in, especially around 30–40 μs where a peak can be observed.

Figure 5: (a) Load and (b) force contributions normalized by the applied force for the various dynamic elements of the instrument as a function of the time from the onset of pop-in.
The load–depth response determined after accounting for the dynamic contribution of the instrument is shown in Fig. 6. The plot shows the response determined at a measurement time constant of 20 μs and also 2 ms. The response determined at 2 ms is similar to a typical pop-in curve reported in the literature. By contrast, the response determined at a 20 μs shows several interesting features. There is a steep load drop at the onset of pop-in followed by a ramp to well over the load at the onset of pop-in, wherein the load reaches a peak before it drops toward the end of pop-in. The data points collected during the pop-in event are highlighted by closed circles for clarity. The oscillations after the end of the pop-in shown in Fig. 3(b) result in unloading and reloading of the contact, which typically has a steeper slope on a load–depth plot, until the applied force reaches the maximum load experienced during pop-in. Thereafter, the contact predominantly loads plastically, which results in a reduction in slope to a lower value. These observations clearly indicate that the data collected at slower time constants, which thereby does not capture or consider the dynamic effects of the instrument, do not depict the true load–depth response during a pop-in. Contrary to the common observation in the literature, wherein the load remains constant during a pop-in event on force-controlled instruments, the load actually changes significantly during the event. There is an initial load drop followed by a load ramp to well above the load at onset of pop-in, which subsequently results in unload and reload of the contact till the applied force reaches the maximum load during pop-in and gives rise to a steeper slope after the pop-in. The implications of these new observations for measurement of pop-in length and other testing methods will be discussed in the section “Implications for measurement of pop-in length.”

Figure 6: Load–depth response determined after accounting for the dynamic contribution of the instrument at two different displacement time constants.
Comparison of experimental data with simulations
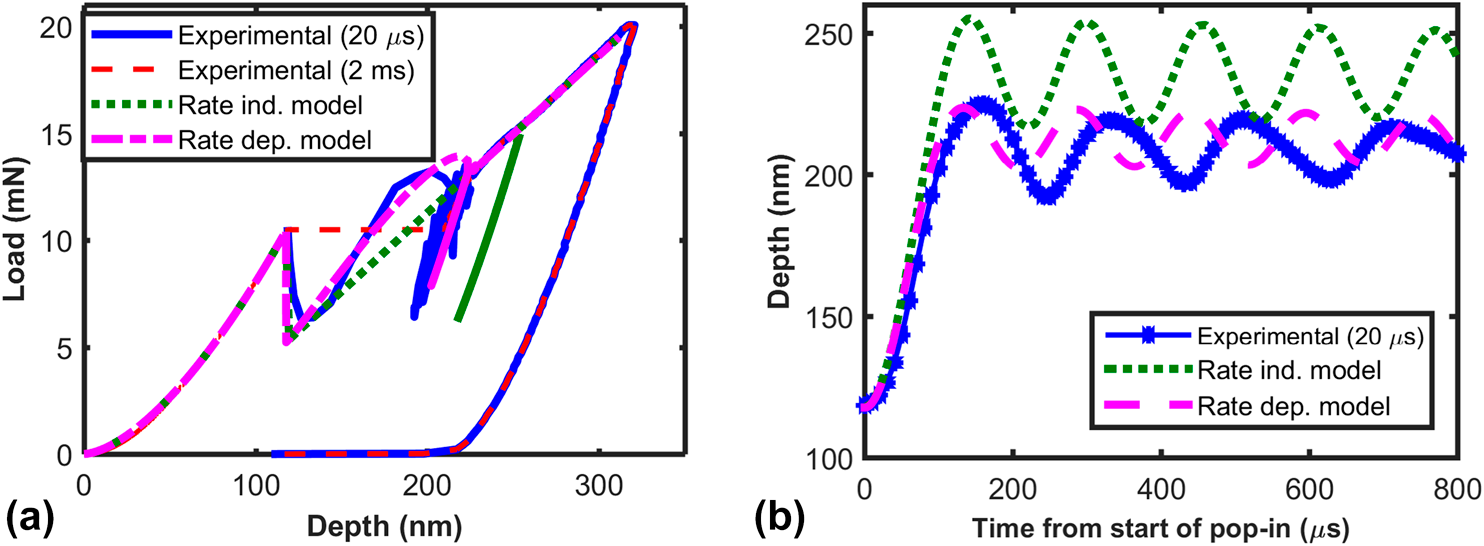
In this section, the experimental observations are compared with the simulated response determined by the simple model for pop-in. The inputs required for the simulation are discussed under the model section, and the corresponding values are provided in the methods section. Figure 7(a) shows the load–depth curve, whereas the corresponding depth–time response for a short duration from the onset of the pop-in is shown in Fig. 7(b). The simulation results for a rate-dependent model, wherein the parameter C p is varied as per Eq. (2) and the rate independent model, wherein, C p = C po, is shown for comparison with the experimental results. It can be observed from the load–depth and depth–time response that a simple model for pop-in that considers the rate dependence matches very closely with the experimental results. The key features of the experimental results during the pop-in event, such as, steep load drop after the onset of pop-in, dynamic overload, and the unload and reload after the pop-in are all captured by the rate dependent model. The maximum depth at the end of the pop-in estimated from the rate-dependent model also closely matches the experiment. By contrast, although the rate-independent model captures the load drop and dynamic overload, it overestimates the maximum load and maximum depth of pop-in and also does not capture the drop in the load before the end of pop-in. This is to be expected, as the rate dependence results in higher strength during the initial stages of the pop-in, and subsequently the strength drops as the indenter slows down toward the end of the pop-in. The variation in strength during the pop-in results in the bending over of the load–depth curve at the later stages of the pop-in. The good agreement between the rate-dependent model and the experimental results validates the assumption of strength drop during pop-in. It also demonstrates the importance of not only considering the dynamics of the instrument but also the rate effects in the material's response. This has important implications for interpreting the pop-in data, which is discussed in the next section.

Figure 7: Comparison of the (a) load–depth and (b) depth–time response determined from experiments and simulation of pop-in considering the dynamics of the instrument.
Implications for measurement of pop-in length and closed loop control
In the previous section, the load–depth response during the pop-in event has been presented, wherein an initial load drop followed by dynamic overloading was observed. The contributions of the various dynamic elements of the instrument were also presented, and the inertial effects were found to be the most important ones. Hence, in this section, a brief discussion of the inertial contribution on the length and velocity of the pop-in will be presented. Figure 8(a) shows the effect of mass of the actuator on the simulated depth–time response during a pop-in event. The corresponding load–depth response is shown in Fig. 8(b). The range of mass chosen for the simulations is 1.5–1500 mg, which covers the possible range for nanoindentation actuators. The instrument used for the current study has a mass of 150 mg. The initial rise in the depth with time [Fig. 8(a)] up to the point of maximum depth represents the pop-in event. The plot shows a significant dependence of the depth–time response on the mass of the actuator with a steeper rise at lower values of mass and a higher maximum depth at higher values of mass. This implies that the length and velocity of the pop-in are affected by the mass of the actuator. The length of the pop-in is usually determined from the difference between the maximum depth corresponding to the load at onset of pop-in and the depth at the onset of pop-in. The maximum depth at the load corresponding to the onset of pop-in, used for the calculation of the length of the pop-in, is highlighted by the closed circle for each case in Fig. 8(b). Figure 8(c) shows the strong dependence of the length of the pop-in on the mass of the actuator, which significantly limits its utility as a key metric to understand the material behavior during pop-in. The plot also shows that the dynamic overload (maximum load during pop-in/load at onset of pop-in) during the pop-in, after accounting for the dynamic contribution of the instrument, is also dependent on the mass of the actuator, with higher mass resulting in more dynamic overload. With decreasing mass, the extent of dynamic overload decreases and the end point of pop-in is close to the extrapolation of the large depth (low strain rate) load–depth response onto the load corresponding to the onset of the pop-in. This indicates that as the mass of the actuator approaches zero, there may be a natural limit for the length of the pop-in at a given load. Under such a condition, which may not be achievable in currently available nanoindenters, the dynamic overload is insignificant (=1) and the length of the pop-in can be taken as a purely material response. In addition to the mass of the actuator, the dynamic overload also depends on the strength change during a pop-in event. For example, if the strength drop during pop-in is not significant, the indenter may not accelerate much, thereby limiting the dynamic overload. Although the extent of strength drop is not known a priori, the presence of dynamic overload can be confirmed by observing the load–depth curve immediately after the pop-in. If the load–depth response collected with data acquisition rates of 100 Hz or higher shows a steeper slope immediately after the pop-in compared with that at larger depths, then dynamic overloading has occurred during pop-in and caution needs to be exercised in utilizing the pop-in length and velocity for any further analysis. Furthermore, even if the dynamic effects are not significant, the wide range of strain rates encountered during the pop-in presents a severe challenge in utilizing pop-in length for any further analysis, as it represents a convoluted response across a wide range of strain rates.

Figure 8: Simulated (a) Depth–time response and (b) load–depth response during pop-in at different mass of actuators and (c) pop-in length and dynamic overload as a function of mass of actuator.
In addition to the significant implications for the meaning of the length of pop-in, the current work provides insights on the instrumentation requirements for performing displacement-controlled tests in the presence of pop-in. The depth–time response during pop-in shown in Fig. 8(a) indicates that the pop-in event occurs in the μs time scale. To perform displacement-controlled experiments at this time scale, sensors with order of magnitude faster time constants and actuators that operate at closed loop control rates of 10's of MHz are required. This is well beyond the current state of the art in nanoindentation instrumentation. Hence, open loop experiments, wherein the instrument applies a predetermined force, may be better in cases where the material exhibits sudden strength changes such as in a pop-in during which controlled experiments are not possible with the currently available nanomechanical testing instrumentation. This is equally applicable to micro-pillar compression/tension experiments as well.
Summary and conclusions
Experimental data are measured during a spherical indentation test on sapphire that exhibits a pop-in, using force-controlled experiments, with 20 μs time constant displacement sensors operating at 100 kHz data acquisition rate. The corresponding load–depth response during the pop-in event that occurs within 160 μs, is also determined. A simple model that considers the dynamics of the instrument and the rate dependence of material behavior is presented to simulate the pop-in event. The following conclusions are drawn from the present work.
(1) Accurate characterization of instruments' dynamic and electronic response is critical to capturing the details of dynamic events like pop-ins.
(2) During the pop-in, the instruments' contribution to the overall measured response is dominated by its inertia.
(3) Measured load–depth response during the pop-in event for most indentation systems, using sensors with millisecond range measurement time constants, is not directly indicative of true material response.
(4) The actual load experienced by the sample during a pop-in event can be determined by considering the dynamic effects of the instrument, and it is found that a load drop occurs immediately after the onset of pop-in followed by a load ramp to a value well over the load at the onset of pop-in due to dynamic overload.
(5) The steep slope in the load–depth curve after the pop-in is an outcome of the dynamic overload, and the contact unloads and reloads till the applied force reaches the maximum load experienced during the pop-in. The appearance of the region with steeper slope after the pop-in is a clear sign of dynamic overload.
(6) A simple material constitutive model that considers the rate dependence of strength, in conjunction with 1 DOF dynamic model for the instrument, can explain the experimental observations.
(7) Caution has to be exercised in interpreting the length of the pop-in and pop-in velocity, as it may have considerable contribution from the dynamics of the instrument and also the material response over a wide range of strain rates.
(8) The fast time scale of the pop-in event presents a significant challenge for performing displacement-controlled tests, which invariably involves closed loop feedback control. Submicrosecond measurement time constant, accompanied by data acquisition and control loop rate in the MHz range and an instrument with very small mass, is minimally required to actually achieve displacement control during a pop-in event.
Methodology
Indentation tests were carried on an iNano® nanoindenter with an InForce50 actuator (Nanomechanics Inc., now KLA Corporation, Oak Ridge). Force was generated by electromagnetic actuation, wherein the force generated by the coil does not dependent on the displacement and hence best suited for studying dynamic events like indentation pop-in. The displacement was measured by a capacitance gauge. The time constant of the displacement signal was 20 μs, and the data acquisition rate was 100 kHz. A 99.995% single crystal Al2O3 sample, mechanically polished for optical flatness, oriented along the c-axis was used for the current study. Indentation pop-in studies were carried out using a spherical diamond tip with a tip radius of 385 nm. The tip radius was determined by assuming Hertzian elastic response prior to pop-in. The parameters C po and P o, for modeling the spherical indentation response at large depths (250 nm–320 nm), well away from the pop-in, was determined from a linear fit and were found to be 73,589 N/m and 5.22 mN, respectively. The load at the onset of pop-in used for simulation was 10.45 mN. The mass (m), damping coefficient (b), and spring constant (k) of the actuator used for the simulations is 150 mg, 0.12 Ns/m, and 159 N/m, respectively.
The elastic modulus and hardness were determined by continuous stiffness measurement (CSM) at 100 Hz and a 2-nm displacement oscillation using a Berkovich tip following the standard procedures. Load frame stiffness was determined by performing tests on a standard fused silica specimen using a Berkovich indenter and the same was applied to the spherical indentation tests. The load frame stiffness was 1.15 × 10⁶ N/m.


 Open access