


Introduction
Among the refractory metals, rhenium exhibits a unique combination of a high melting point, good ablation resistance, good high-temperature strength and creep resistance. Rhenium is known to be the only refractory element that does not display a measured ductile–brittle transition, such that it features relatively high ductility at low temperature [Reference Campbell, Rosenbaum and Gonser1, Reference Carlen and Bryskin2]. The combination of low-temperature ductility and high melting point makes Re-based materials attractive as structural materials for applications such as rocket nozzles, which involve high temperatures and fast thermal cycling. However, the high cost (which have reached just over 10,000 $/kg in the past 15 years) and limited worldwide reserves of Re place a limit on its use [Reference Fink, Miller and Konitzer3, Reference Wrona, Stasewski, Czepelak, Woch, Kaminska, Osadnik and Kolacz4]. This situation has motivated the search for viable and cost-effective replacement strategies for rhenium as a material for solid-propellant rocket nozzles.
In this article, we use an approach based on both electronic structure and computational thermodynamics that are aimed at focusing the search for such a substitute material. We first develop and motivate a simple design principle based on the candidate material’s average valence electron count per atom. We then intersect this criterion with the thermodynamic constraint that the candidate material should retain the most important determinant of rhenium’s desirable property, namely, its single-phase hcp crystal structure. As the determination of phase equilibria in an alloy system with a potentially large number of components and phases via purely experimental means is expensive and time consuming, we leverage a recently developed framework [Reference van de Walle, Sun, Hong and Kadkhodaei5] for high-throughput computational thermodynamics based on the integration of first-principles electronic structure calculations with the well-established CALculation of PHase Diagram (CALPHAD) framework. These predictions are then validated by comparison to earlier thermodynamic assessments and by synthesizing and characterizing alloy samples at selected compositions. The space of candidate alloys identified in this fashion happens to include multiple principal component (or “high entropy”) alloys.
Design principles
Within a “rigid band” picture, the properties of transition metals (and their alloys) are determined by their number of d valence electrons per atom [Reference Pettifor and Cottrell6]. This picture is best illustrated by observing that the same systematic sequence of crystal structure is seen across the 5d and 4d sequences: hcp, bcc, hcp, fcc (see Table I). From a physical point of view, this phenomenon can be understood by the fact that if the electronic density of states for a given crystal structure is independent of the number of valence electrons (i.e., “rigid”), then materials properties can only be a function of how many electrons are available to fill the possible electronic states up to the Fermi level. This picture provides us with one simple guiding principle to identify possible alternative hcp alloys: focus on alloys having roughly between 5 and 6 valence electrons per atom on average.
TABLE I: Selected properties of selected transition metals [Reference Pettifor7] (Prices are approximate and were collected from http://www.metalprices.com and http://www.metal-pages.com in June 2011).
This band filling picture turns out to also govern other more complex properties of relevance in to our design goal. It has been shown [Reference de Jong, Kacher, Sluiter, Qi, Olmsted, van de Walle, Morris, Minor and Asta8] that rhenium’s exceptional twinning behavior contributing to its desirable mechanical properties can also be traced back to its specific number of valence electrons. In essence, rhenium’s mechanical behavior is driven by twinning, and the local structure of the dominant twin grain boundary mimics the Frank–Kasper coordination polyhedra of the so-called tetrahedrally close packed (TCP) transition metal intermetallic compounds that also tend to be stabilized near half d-band filling [Reference Berne, Pasturel, Sluiter and Vinet9, Reference Sluiter10, Reference Sluiter11, Reference Seiser, Hammerschmidt, Kolmogorov, Drautz and Pettifor12, Reference Hammerschmidt, Drautz and Pettifor13].
Another constraint is to maintain rhenium’s high melting point. Once again, the number of d valence electrons per atom is a good predictor of melting point (see Table I): Along both the 4d and 5d series, the maximum melting point is reached for about 4 valence electrons per atom (just one less than for Re). The high melting point constraint also suggests avoiding 3d elements additions.
Intersecting these various constraints leads us to consider a simple alloy design approach: Form a substitutional alloy of 4d and 5d elements yielding a target of roughly 5 valence electrons per atom that minimizes cost. This constrained optimization problem can be visually represented by plotting each element’s price per mol as a function of the number of valence electrons (see Fig. 1). The cost of a suitable Re-equivalent binary alloy can be simply read of from the intersection between a segment joining the two elements and a vertical line centered at the desired number of electrons. A similar construction holds for multicomponent alloys and gives a range of theoretically attainable cost.

Figure 1: Cost per mol as a function of number of valence electrons per atom for selected 4d (black squares) and 5d (gray squares) transition metals. The cost of alloys having the desired number of electrons (gray rectangle) can be identified by the intersection of a line joining the elements of the alloy and the gray rectangle.
From this construction, we can immediately rule out some elements: It is clear that alloying Rh, Pt or Au with even the best-case scenario of W would not yield a lower cost than rhenium’s. One can also readily identify a priori cost-effective candidates: For instance, a Mo–Ru–W alloy would appear to provide an especially inexpensive option. Although the addition of Ag may appear desirable from a cost perspective, Ag has a very low melting point and is known to exhibit a low solid solubility in either Ru [Reference Karakaya, Thompson and Massalski14] or bcc elements such as Mo [Reference Baren and Massalski15], thus making its addition unlikely to be beneficial. The addition of Ta or Nb leads to an only slightly more expensive alloy and we thus consider this possibility as well. However, since the melting point of Nb is significantly lower than the one of Ta, we do not currently consider Nb in our search. This leaves us with the task of exploring the Mo–Ru–Ta–W quaternary system, with a special focus on the plane where the effective number of valence electron per atom matches that of Re, as defined by the linear equality:
 $$4{x_{{\rm{Mo}}}} + 6{x_{{\rm{Ru}}}} + 3{x_{{\rm{Ta}}}} + 4{x_{\rm{W}}} = 5\quad ,$$
where x A denotes the atomic fraction of element A, subject to the obvious constraint x Mo + x Ru + x Ta + x W = 1. We call this region the Re-equivalent plane. Although this simple design principle can quickly rule out clearly unfavorable choices and target desirable candidates, it remains essential to further assess the thermodynamic stability of the hcp phase near the Re-equivalent plane, as the rigid band picture is not a perfect predictor of phase stability.
Results and discussion
To assess the accuracy of our thermodynamic model, we first compare predicted binary sections with prior assessments available in the literature. Our primary focus is on single-phase hcp microstructures, and on phases that might limit the size of the hcp phase stability region. We do not report a detailed comparison with the Mo–Ta, Mo–W, and Ta–W binary sections since these phase diagrams simply exhibit perfect mutual solubility within a bcc solid solution [Reference Krishnan, Garg, Krishnamurthy and Massalski16, Reference Wang, Wang, Guo, Liu, Ohnuma, Kainuma and Ishida17, Reference Krishnan, Garg, Krishnamurthy and Massalski18] that is not of interest for our primary goal.
As shown in Fig. 2, in the Mo–Ru system, our thermodynamic model predicts the presence of the same phase relations as those reported in previous assessments [Reference Oh, Murakami and Harada19, Reference Okamoto and Massalski20]. In particular, the presence of the σ phase limits the solubility of Mo in Ru. In contrast, it should be noted that traditional ab initio high-throughput approaches are unable to predict the stability of the σ phase [Reference Levy, Jahnatek, Chepulskii, Hart and Curtarolo21], as this phase is largely stabilized by configurational entropy. Nevertheless, the temperature range where the σ phase is stable is not perfectly reproduced in the present model and the solubility of Mo in Ru is overpredicted at high temperature.
Figure 2: Mo–Ru phase diagram found in earlier assessments [Reference Okamoto and Massalski20] (a), compared with our prediction (b).
The Ru–Ta system exhibits a number of competing phases (labeled ht1 and ht2 in Fig. 3) near 50% composition that are difficult to accurately model due to their very similar free energies and the presence of mechanically unstable phases that are dynamically stabilized at high temperature due to anharmonic effects [Reference Mousa, Khalifeh and Hamad22], a phenomenon that is characteristic of shape memory alloys [Reference Kadkhodaei and van de Walle23]. Since these phases do not directly affect the boundary of the hcp region and all have very similar free energies, we chose to collectively model these phases as a single B2-ordered phase. The phase that does primarily limit the hcp region is a Ga3Pt5-ordered phase. While this phase’s specific crystal structure was not clearly identified in earlier experimental assessments [Reference Okamoto24], a prior first-principle high-throughput analysis of possible ordered phases in rhenium alloy systems [Reference Levy, Jahnatek, Chepulskii, Hart and Curtarolo21] suggests that this phase indeed exhibits the Ga3Pt5 structure. Our calculations corroborate this and further indicate that configurational and vibrational entropic effects are not detrimental to this phase’s stability at high temperature. Compared to the experimental assessment, our calculations appear to underpredict the solubility of Ta in hcp Ru and slightly overstabilize the Ga3Pt5 phase.
Figure 3: Ru–Ta phase diagram from an earlier assessment [Reference Okamoto24] (a), compared with our prediction (b).
As seen in Fig. 4, compared to an earlier assessment [Reference Okamoto and Massalski25], our model’s prediction of the Ru–W phase diagram understabilizes the σ phase: It is masked by two-phase equilibrium between the hcp and bcc phases at all temperatures. The hcp phase appears slightly over stabilized at high temperature, relative to the earlier assessment. This can be investigated further with a metastable phase equilibrium computed without the bcc phase. This shows that the σ phase appears in the correct composition range and that its free energy at lower temperatures should be reliable since it leads to nearly the same hcp solubility limit.
Figure 4: Ru–W phase diagram from an earlier assessment [Reference Okamoto and Massalski25] (a), compared with our prediction (b).
The Mo–Ru–Ta and Mo–Ru–W ternary sections of this system have been studied [Reference Kabanov, Subbotin and Loboda26, Reference Subbotin, Raevskaya, Loboda and Sokolovskaya27] at temperatures lower than those of interest in the present work (<1500 °C). These studies do not suggest the presence of additional phases that are not seen in the binary subsystems.
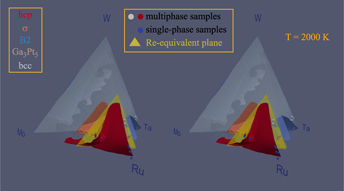
We now turn the prediction of the full quaternary phase diagram (Fig. 5) and its comparison with actual samples synthesized (Table II) with the goal of exploring the limit of the hcp region. The structure of all the phases present in each sample were identified via X-Ray Diffraction (XRD) (see Fig. 6). We generate an isothermal section of the phase diagram at T = 2000 K, as this is expected to approximate the sample synthesis and annealing temperature. All samples that were single-phase as synthesized (shown as blue points), are indeed in the predicted hcp stability region (whose boundary is shown by a red surface). Two experimental samples (labeled 1–1 and 1–2 in Table II and shown as white points on Figs. 5 and 7) clearly exhibit two phases, namely hcp and tetragonal. Our thermodynamic model also predicts a two-phase region at these compositions, but between an hcp phase and the orthorhombic Ga3Pt5 phase. These data points are, however, close to a tie-triangle joining the hcp, Ga3Pt5 and σ phases (see Fig. 7). The refined lattice parameters for the tetragonal phase (a = 9.6 Å and c = 5.0 Å) closely match those of the thermodynamic model for the σ phase appearing in that tie-triangle (a = 9.7 Å and c = 5.0 Å) and also match its P42/mnm spacegroup. The other experimental samples (labeled 3–4 and 3–5 in Table II and shown as red points on Figs. 5 and 8) showed two phases (hcp and tetragonal) as-synthesized but the tetragonal phase disappeared upon annealing at a slightly higher temperature (2125 K) than the isothermal the cross section shown (2000 K). These compositions fall into multiphase equilibria involving the σ phase and either 1 or 2 hcp phases but lie very close to a 2-phase equilibrium involving two hcp phases at different compositions, i.e., a miscibility gap in the hcp phase (see Fig. 8). Hence the thermodynamic model’s predictions are nearly consistent with the observed phases equilibria. These compositions are of particular interest, as they straddle the Re-equivalent plane, as seen in Fig. 5.
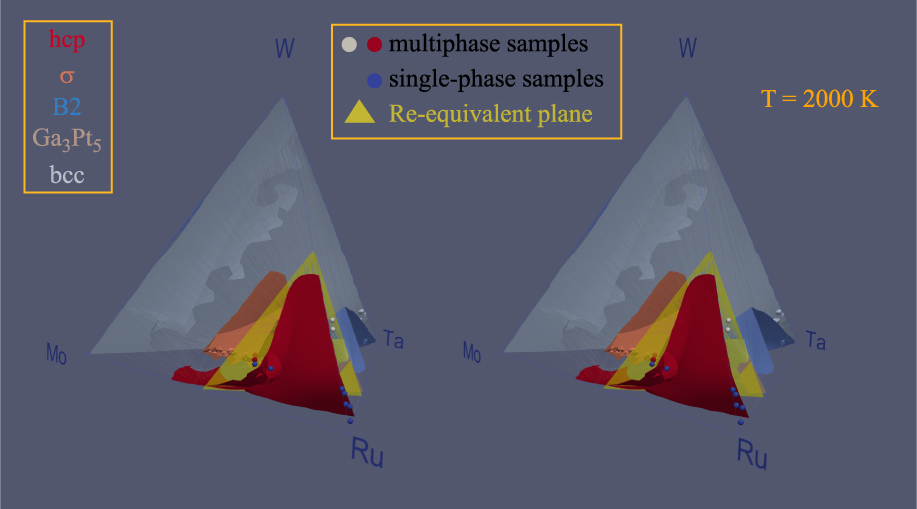
Figure 5: Calculated isothermal (T = 2000 K) section of the quaternary Mo–Ru–Ta–W phase diagram, shown in stereoscopic view. Experimental sample compositions are shown by small spheres while the Re-equivalent plane is shown in yellow.
TABLE II: Characteristics of synthesized alloy samples.
a Phase present in small amount; disappeared upon annealing at 2125 K.
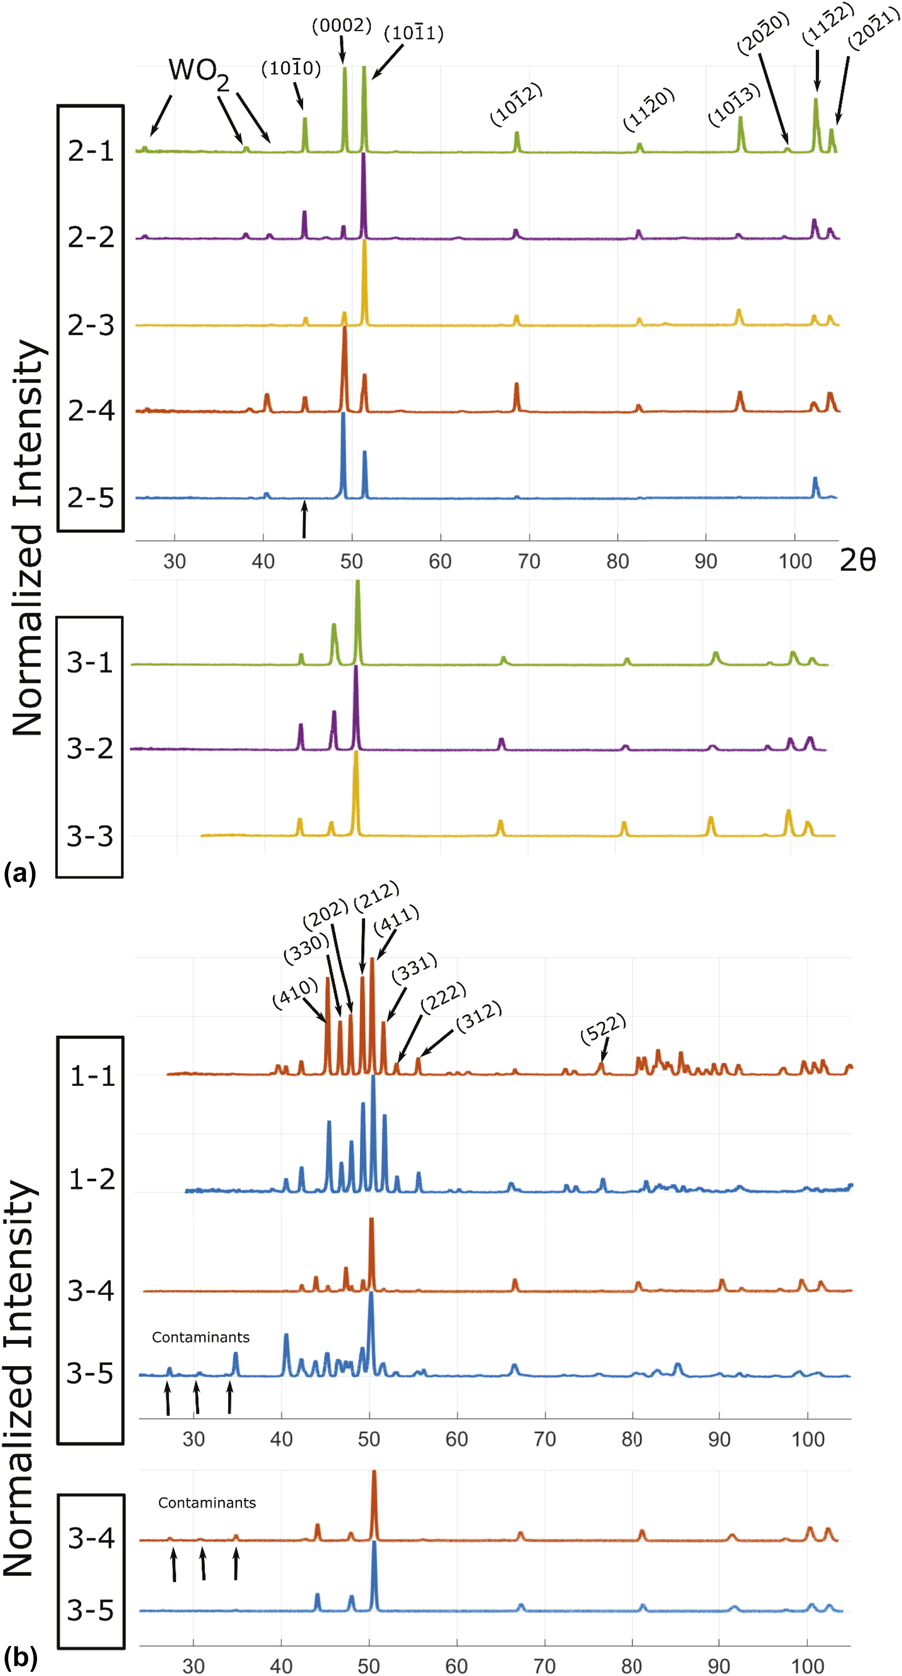
Figure 6: XRD spectra for (a) all samples containing single phase and (b) those exhibiting two phases as synthesized. The primary phase is always hcp while the secondary phase was identified as a tetragonal structure with space group P42/mnm. In (b), only the peaks for the tetragonal phase are indexed. It can be seen that the Series 1 alloys have much more secondary phase than the Series 3 alloys. Series 1 alloys have been annealed at 1850 °C while the Series 3 alloys in the top panel of (b) have not. After annealing at 1850° for 8 h, all secondary phase in alloys 3–4 and 3–5 have disappeared, leaving only the hcp phase (bottom panel of (b)).
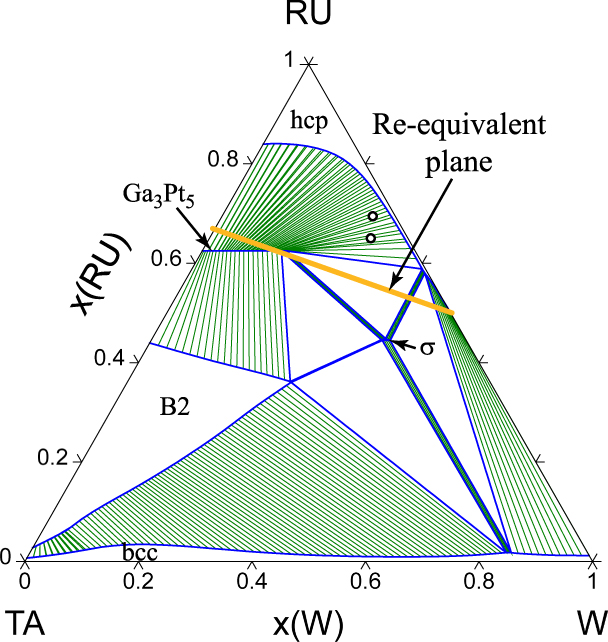
Figure 7: Calculated Ru–Ta–W isothermal section at 2000 K. The experimental sample compositions are indicated by circles.
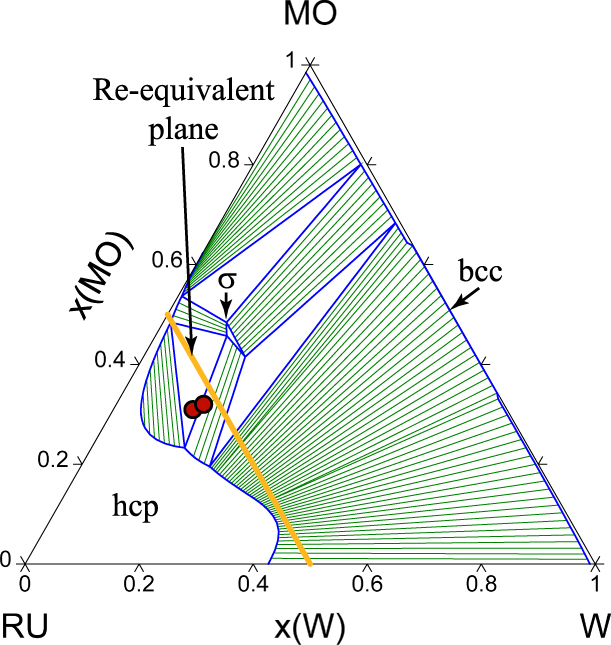
Figure 8: Calculated Mo–Ru–W isothermal section at 2000 K. The experimental sample compositions (projected onto the x Ta = 0 plane from their positions in a Gibbs tetrahedron) are indicated by circles. The x Ta = 0 plane is shown here (instead of the actual, small, Ta composition) to better visualize the tie lines.
From an alloy design perspective, the phase diagram (Fig. 5) reveals that the hcp stability field extends the closest to the Re-equivalent plane for Mo-rich compositions, although one should keep in mind that our model may over overpredict Mo solubility. The region near samples 3–4 and 3–5 is also very promising and the thermodynamic model predicts that there should be actually a fairly wide range of compositions that stabilize an hcp structure (or a perhaps mixture of two hcp phases at different compositions) near the Re-equivalent plane.
Conclusion
We have presented a theoretical basis for a simple design criterion for the identification of Re candidate substitutes: Based on a rigid-band picture, one should focus on alloys whose composition lies on a Re-equivalent plane, defined such that average number of valence electron per atom matches that of Re. Optimizing cost under this constraint over all alloys made of 4d and 5d elements lead us to consider the Mo–Ru–Ta–W quaternary system. A thermodynamic model based on the integration of electronic structure calculations with the Calphad framework then enabled us to identify alloy compositions near the Re-equivalent plane that maintain rhenium’s desirable hcp structure. The accuracy of this thermodynamic model was assessed with comparisons to known binary phase diagrams sections and further corroborated by experimental synthesis and structural characterization of samples selected from a promising composition region. This region includes multiple principal component alloys having an hcp structure at compositions near Mo0.3Ru0.512Ta0.064W0.125 and near Mo0.292Ru0.555Ta0.031W0.122, which straddle the Re-equivalent plane. More broadly, we hope that the approach described here in will suggests novel avenues for materials design and optimization.
Methods
Computational
The phase equilibria were computed using high-throughput Calphad tools based on electronic structure calculations [Reference van de Walle, Sun, Hong and Kadkhodaei5] that calculates the free energy of solid solutions (including ordered phases with sublattice disorder) using the Special Quasirandom Structure (SQS) formalism [Reference Zunger, Wei, Ferreira and Bernard28], implemented via an efficient stochastic algorithm [Reference van de Walle, Tiwary, de Jong, Olmsted, Asta, Dick, Shin, Wang, Chen and Liu29] in conjunction with a truncated cluster variation method-based approximation to model short-range order [Reference van de Walle, Sun, Hong and Kadkhodaei5]. This data is then fitted with a Calphad-type model based on the Compound Energy Formalism (CEF) [Reference Andersson, Guillermet, Hillert, Jansson and Sundman30, Reference Hillert31, Reference Kattner32]. The free energies of the stable end members of the solid solution phases are taken from the SGTE elemental database [Reference Dinsdale33] while those of the unstable end members are obtained with the inflection detection method [Reference van de Walle34]. The formation free energies of the ordered compounds and solid solutions are based solely on electronic structure calculations.
The electronic structure calculations were performed with VASP [Reference Kresse and Furthmüller35, Reference Kresse and Joubert36] using the projector-augmented wave (PAW) method [Reference Blöchl37]. For all calculations, the PBE functional [Reference Perdew, Burke and Ernzerhof38] was used, the planewave cutoff was set to 300 eV, the number of k-points per reciprocal atom [Reference van de Walle and Ceder39] was set to 8000 and Fermi level smearing was performed with the Methfessel–Paxton [Reference Methfessel and Paxton40] method with σ = 0.1 (for relaxation runs and phonon calculations). Energies were calculated with a static run on the relaxed geometries using the tetrahedron method with Blöch corrections [Reference Blöchl, Jepsen and Andersen41].
The computation of the quaternary thermodynamic model required 135 electronic structure total energy calculations. Of these, 32 involved mechanically and thermodynamically unstable structures. To assign them a plausible free energy (as required by the Calphad framework), we used the recently developed inflection detection approach, combined with the epicycle method [Reference van de Walle, Hong, Kadkhodaei and Sun42, Reference van de Walle, Kadkhodaei, Sun and Hong43], using the robustrelax_vasp command of Alloy Theoretic Automated Toolkit (ATAT) [Reference van de Walle44, Reference van de Walle, Asta and Ceder45] with its defaults settings. In addition, to ensure that free energy differences between different crystal structures are accurately reproduced, 36 lattice dynamics calculations were performed using the supercell method [Reference van de Walle and Ceder46] with the fitfc code [Reference van de Walle44] within the harmonic approximation. These calculations encompass all end members (in which all sublattices are fully occupied by one element) and some solid solution datapoints within the Ru-rich hcp phase.
The accuracy of the calculated free energy is in part a function of the density of the sampling of composition space with SQSs. This density for each phase is indicated below by the “level” of accuracy used (level 0 means only end members, level 1 also includes midpoints between endmember, level 2 also includes sublattice compositions in steps of 1/4, etc. See [Reference van de Walle, Sun, Hong and Kadkhodaei5] for further details). For each phase, the level was selected in proportion to the accuracy needed: hcp (level 2, with level 6 sampling of the Ru-rich region, including ternary compositions; level 2 for phonon, with a few level 6 datapoints), σ phase (level 1 for energies, level 0 for phonons), bcc (level 2, with some level 5 datapoints for energies, level 0 with some level 1 datapoints for phonons), Ga3Pt5 (level 1 for energies, level 0 for phonons), B2 (level 1 for energies, level 0 for phonons). Following earlier descriptions [Reference Andersson, Guillermet, Hillert, Jansson and Sundman30], the σ phase is modeled with 3 sublattices and with Wyckoff position a, j hosting the hcp element (Ru), site g hosting bcc elements (Mo, Ta, W) and the two i sites hosting any element. The two sublattices of the Ga3Pt5 phase are also selectively occupied based on the coordination of each site, with a, e, j sites hosting Ru and b, h sites hosting Mo, Ta, W.
The binary and ternary sections were plotted with the Pandat software [Reference Cao, Chen, Zhang, Wu, Yang, Chang, Schmid-Fetzer and Oates47] while the quaternary sections were generated with the ocplodpd [Reference van de Walle, Nataraj and Liu48] command of the ATAT [Reference van de Walle44, Reference van de Walle, Asta and Ceder45], which relies on OpenCalphad [Reference Sundman, Kattner, Palumbo and Fries49, Reference Sundman, Kattner, Sigli, Stratmann, Tellier, Palumbo and Fries50] as its thermodynamic equilibria calculation engine.
Experimental
The experimental alloy samples were cast using powder metallurgy from >99.9% pure 250-mesh powders. The constituent powders were mechanically mixed to the correct wt% of alloy composition and then ball milled for 30 min. The resulting milled powder was then pressed into pellets using 30,000 psi of force to be sintered at 1850 °C for 8 h. The pellets were then arc melted in vacuum, flipped, and re-melted. Slag from on the ingot surface was removed and the ingot was finally annealed at 1850 °C. The resulting ingots were roughly 0.5–1 cm3 in volume. As such, little solute gradients should be present due to the rapid heating and cooling rates inherent to the arc-melting process, unlike typical larger scale casting methods. The surfaces were oxide- and contaminant-free and exhibited a generally small grain size (∼100 µm for the single-phase alloys). This combination allowed for the ingots to be directly investigated in the XRD without further processing or polishing. Samples 1–1, 1–2, 3–4, and 3–5 were annealed at 1850 °C for 8 h (the other samples were already single phase as synthesized).
Determination of alloy structure was accomplished with the aid of a D8-Discover X-ray diffractometer (Bruker, Madison, WI) with a Co source operated at 40 mA 35 kV giving a Kα wavelength of 1.79 Å. The X-ray spectra were taken using a 300 s exposure time for each frame. The samples were translated over a large area during the spectra collection, to sample as many grains as possible during investigation. This XRD system uses an area detector that is able to collect 30° sections of the diffraction pattern per image, allowing for powder diffraction type measurements that would be much more difficult with more conventional detector systems. The frames from the area detector are stitched together and integrated with the accompanying Bruker™ software to provide a single 2θ versus intensity profile that is more typically used in XRD analysis. We used MDI-Jade software version 4.2.0 (MDI, Livermore, California) to index the XRD profiles, which uses constituent elements and their chemically close neighboring elements to match known crystal structure’s intensity versus 2θ plot found in commercial powder diffraction file (PDF) databases.
Acknowledgments
The authors acknowledge support from the Office of Naval Research through program no. N00014-16-1-3124. Work at the Molecular Foundry was supported by the Office of Science, Office of Basic Energy Sciences, of the U.S. Department of Energy under Contract No. DE-AC02-05CH11231. AvdW acknowledges support from Brown University through the use of the facilities at its Center for Computation and Visualization. This work uses the Extreme Science and Engineering Discovery Environment (XSEDE) resource Stampede 2 at the Texas Advanced Computing Center through allocation TG-DMR050013N, which is supported by National Science Foundation Grant Number ACI-1548562.


