


I. INTRODUCTION
Efficient conversion of water to hydrogen and oxygen with solar energy will become increasingly important in the future. Reference Walter, Warren, McKone, Boettcher, Mi, Santori and Lewis1 The sun is the earth’s only energy input and it supplies all of humanity’s annual energy in a matter of hours. Therefore, whether the sunlight is directly utilized through photoelectrochemical methods or through solar-driven electrochemical methods, identifying materials capable of efficiently catalyzing the oxygen evolution reaction (OER) is an important challenge for the development of solar fuel generators. Reference Eisenberg and Gray2,Reference Hunter, Gray and Mu3 This four-electron, four-proton reaction producing a diatomic gas is one of the most important on earth. Indeed, the electrons used to make fuels of all sorts should likely originate from the OER. Reference Artero and Fontecave4,Reference Rosser and Reisner5
The thermodynamic potential of the four electron, four proton overall water splitting reaction, 2 H2O (l) → 2H2 (g) + O2 (g), is E 0 = −1.23 V. At all pH values, larger overpotentials (potential above the thermodynamic potential required to overcome kinetic barriers) are required to drive this reaction one electron at a time than if moving four electrons and protons at the same time. The half reactions controlling each step are different depending on the solution pH. At pH = 14, the water oxidation half reaction (4 OH− → O2 (g) + 2 H2O (l) + 4 e−) has E 0 = −0.40 V, while at pH = 0, the water oxidation half reaction (2 H2O (l) → O2 (g) + 4 H+ + 4 e−) has E 0 = −1.23 V. Conversely, the water reduction half reaction has E 0 = 0.00 V at pH = 0 (4 H+ + 4 e− → 2 H2 (g)) and E 0 = −0.83 V at pH = 14 (4 H2O (l) + 4 e− → 2 H2 (g) + 4 OH−). In nature, water oxidation is affected by the calcium-manganese-oxo water oxidizing complex of photosystem II, Reference Umena, Kawakami, Shen and Kamiya6 which functions through the “Kok cycle,” in which one proton and one electron leave the reactive complex at a time. Reference Kok, Forbush and McGloin7
The seminal work by Fujushima and Honda in 1972 showed that TiO2 could function as a water oxidation catalyst, albeit poorly. Reference Fujishima and Honda8 Since then, many other water oxidation catalysts have been reported in the literature based on both homogeneous Reference Blakemore, Crabtree and Brudvig9,Reference Yagi and Kaneko10 and heterogeneous materials. Reference Hunter, Gray and Mu3 These heterogeneous materials include metals, Reference Hoare11 alloys, Reference Lian, Thorpe and Kirk12 and crystalline metal oxides. Reference Suntivich, May, Gasteiger, Goodenough and Shao-Horn13,Reference Bockris and Otagawa14 State-of-the-art materials based on either metal/metal oxides such as IrO2, Reference Driess, Menezes, Indra, Gutkin and Driess15–Reference Trasatti17 RuO2, Reference Trasatti17 or Pt, Reference McCrory, Jung, Peters and Jaramillo16 or nonprecious metal oxides such as Mn2O3, Reference Zahran, Mohamed, Ohta and Naruta18 Co3O4, Reference Blakemore, Gray, Winkler and Mu19 NiFeO x , Reference McCrory, Jung, Peters and Jaramillo16 and NiCo Reference Liang, Meng, Cabán-Acevedo, Li, Forticaux, Xiu, Wang and Jin20 normally reach 450 mV when operated at pH 14, with fewer reaching <350 mV when operated in the same conditions. Reference Driess, Menezes, Indra, Gutkin and Driess15 Many of these catalysts can be fabricated on glassy carbon substrates using electrochemical deposition at large negative potentials. Reference McCrory, Jung, Peters and Jaramillo16 Less frequently, high-performing state-of-the-art water oxidation catalysts purposefully based on nanoparticles have been reported. Particles based on materials such as CoMnP, Reference Li, Baydoun, Verani and Brock21 CoFeP, Reference Mendoza-Garcia, Zhu, Yu, Li, Zhou, Su, Kramer and Sun22 Mn5O8, Reference Jeong, Jin, Jerng, Seo, Kim, Nahm, Kim and Nam23 and CoO Reference Liao, Zhang, Su, Zhao, Wang, Li, Lu, Wei, Feng, Yu, Cai, Zhao, Ren, Fang, Robles-Hernandez, Baldelli and Bao24 have exhibited high performance.
Research on TiS2 began in earnest decades ago as a cathode material for lithium ion batteries thanks to rapid, reversible intercalation and good electrical conductivity. Reference Whittingham25–Reference Conroy and Park27 Studies on TiS2 and other 2D-layered materials (chalcogenides and others including graphene) have increased rapidly in recent years, with thousands of manuscripts now being published each year, thanks to some remarkable properties like high mobility [200,00 cm2/(V s)], high optical transparency (97.7%), and high thermal conductivity [53,000 W/(m K)]. Reference Choi, Choudhary, Han, Park, Akinwande and Lee28,Reference Bonaccorso, Sun, Hasan and Ferrari29 Furthermore, many research groups have and are actively studying intercalation of the s block and transition metals into 2D chalcogenide materials, with intercalation often drastically changing physical properties of the original material. Reference Jung, Zhou and Cha30 Even though much effort was put into understanding the ramifications of TiS2 intercalation, Reference Lindic, Pecquenard, Vinatier, Levasseur, Martinez, Gonbeau, Petit and Ouvrard31–Reference Wiegers33 studies using this material have somewhat lessened in recent years. Reference Tian, Tang, Leng, Chen, Tan, Peng, Ning, Fu, Su, Zheng and Loh34–Reference Toh, Sofer and Pumera37
Our approach to synthesizing new water oxidation catalysts stemmed directly from our previous work with transition metal sulfide materials for inclusion as hole transport materials (HTM) in perovskite solar cells. We recently synthesized amorphous TiS2 nanoparticles that were highly conductive at low film thicknesses and found they functioned well as HTM materials even though they were heavily oxidized. Reference Huckaba, Gharibzadeh, Ralaiarisoa, Roldan-Carmona, Mohammadian, Grancini, Lee, Amsalem, Plichta, Koch, Moshaii and Nazeeruddin38 The particles were amorphous and could be intercalated with organic or inorganic species. Because the particles themselves retained their overall structure upon oxidation, we hypothesized that intercalating catalytically active metal atoms between the TiS2 sheets would lead to stable water oxidation catalysts with improved reactivity over unmodified TiS2. Herein, we report for the first time the synthesis and characterization of amorphous, oxidized TiS2 materials intercalated with Cu2S or CoS, which resulted from the oxidation of intercalated amorphous TiS2. Using these materials, we have realized a substantial enhancement in water oxidation in 1 M NaOH electrolye solutions using Co intercalated TiS2, from 3.0 V overpotential at 10 mA/cm to 1.44 V overpotential.
II. EXPERIMENTAL SECTION
A. General considerations
All chemicals were purchased and used without further purification. TiCl4 was purchased from Sigma Aldrich (Quentin-Fallavier, France). Electrochemical measurements were measured with a Biologic S-200 cyclic voltammeter, and all measurements were performed in quiescent solutions. Cyclic voltammograms were measured with a standard three electrode configuration using a platinum foil counter electrode and a saturated Ag/AgCl reference electrode. The reference electrode was equipped with a porous Vycor tip and was measured to be 0.964 versus NHE in 1.0 M NaOH solution. UV-Vis spectra were measured with a Cary 5000 UV-Vis spectrometer (CARY, Le Locle, Switzerland). Powder X-Ray Diffraction (PXRD) data were measured with a Bruker Avance D8 (Bruker, Karlsruhe, Germany) irradiated at 1.54058 Å using a Cu source.
B. Synthesis of TiS2 materials
For each of the materials (TiS2 and intercalated versions), the following procedure was used, with either 1 equiv TiCl4 (as below) or 0.5 equiv TiCl4 and 0.5 equiv metal precursor (CuCl or CoCl2). A flame-dried flask was charged with a stirbar and oleylamine (50 mL) under N2. The solution was warmed to 140 °C with stirring and strong N2 sparging. After 30 min of sparging at 140 °C, TiCl4 (1 equiv, 0.5 mL, 4.5 mmol) was added via syringe, and sparging and stirring at 140 °C continued. The reaction generated HCl vigorously, and once the reaction was complete, a reddish solution was obtained. The solution at this stage can vary in color from orange to dark red depending on the concentration of TiCl4. After 5 min, if necessary, the second metal precursor was added (0.5 equiv, 2.25 mmol). The mixture was allowed to be stirred at 120 °C. After 30 min, the temperature was increased to 225 °C with stirring. During this time, sulfur (99%, flowers, Alfa Aesar, Haverhill, Massachusetts, 4 equiv, 0.72 g, 22.5 mmol) was suspended in Oleylamine (15 mL) and then was sonicated for 15 min and warmed to 120 °C with stirring until all sulfur had dissolved. Once the temperature of both reaction mixtures was reached, the sulfur mixture was quickly injected into the metal precursor solution. The reaction mixture temperature dropped to 190 °C, and the solution was allowed to be warmed to 225 °C with stirring. The solution immediately turned black. After 30 min, the reaction mixture was cooled to room temperature by submerging the flask in water. Once cooled, methanol (40 mL) was added, and the formed precipitate was isolated by centrifugation. The precipitate was then dissolved in toluene and precipitated with methanol, and this procedure was repeated more than twice to remove all the unreacted sulfur. The precipitate was then dissolved in 10 mL toluene and stored in the glovebox for further use.
C. Electrode preparation
Fluorine-doped tin oxide (FTO) coated glass-substrates (NSG10) were sequentially washed by Helmanex, water, and isopropanol in an ultrasonic bath for 40 min. A solution of TiS2 materials was deposited by spincoating at 2000 rpm for 30 s in a glovebox, then a 20 μL aliquot of the same solution was dropcasted and the films were annealed for 5 min at 180 °C. The active area of the electrode was masked to 1 mA/cm2 before film deposition.
D. UPS and XPS analysis
Ultraviolet photoelectron spectroscopy (UPS) measurements were performed in an ultra-high vacuum analysis chamber (base pressure <10−9 mbar) using a He-discharge UV source (Omicron, Taunusstein, Germany) with an excitation energy of 21.2 eV. The UPS spectra were recorded using a Phoibos 150 (Specs, Berlin, Germany) hemispherical energy analyzer. For the work function determination, the secondary electron cutoff (SECO) was recorded by applying a −10 V sample bias to clear the analyzer work function. The reported valence band spectra were background subtracted. The X-ray photoemission spectroscopy (XPS) measurements were performed with a JPS-9030 hemispherical photoelectron spectrometer (Jeol, Freising, Germany) instrument using a monochromatic Al Kα X-ray source. The overall resolution was 1.25 and 0.68 eV for CoTiS2 and CuTiS2, respectively (as determined from the full-width half-maximum of the Ag 3d 5/2 core level at a pass energy of 30 and 10 eV, respectively). The binding energies for all the photoemission spectra are referenced to the Fermi level. The base pressure in the analysis chamber for the XPS analysis was 2 × 10⁻¹⁰ mbar. A mixed Gaussian/Lorentzian peak shape and a Shirley-type background were used for the XPS peak fitting with the XPS Peak 4.1 software (Raymond Kwok).
III. RESULTS AND DISCUSSION
A. Materials synthesis and characterization
The TiS2 materials were synthesized in a simple two step hydrothermal method similar to our previous work. Reference Huckaba, Gharibzadeh, Ralaiarisoa, Roldan-Carmona, Mohammadian, Grancini, Lee, Amsalem, Plichta, Koch, Moshaii and Nazeeruddin38 Briefly, after solvating the metal precursor (either TiCl4 or TiCl4 and CuCl or CoCl2 in equimolar quantities) in dried, degassed oleylamine, the temperature was elevated and sulfur was added. After 30 min of particle growth, the solution was cooled and the dark precipitate was collected by centrifugation. While much effort was undertaken to ensure that TiS2 did not oxidize during particle synthesis, there were several manipulations/steps after the synthesis where particle oxidation could occur, such as precipitation by addition of MeOH, isolation of particles in ambient atmosphere, and annealing in a glovebox with some water (<1 ppm) and oxygen (<30 ppm) present. The materials made in this manner were: TiS2, Co0.5Ti0.5S2 (hereafter called CoTiS2), and Cu0.5Ti0.5S2 (hereafter called CuTiS2). Reference Park, Choi, Kim, Oh, Ahn and Son39,Reference Kirmani, Carey, Abdelsamie, Yan, Cha, Rollny, Cui, Sargent and Amassian40 Once synthesized, the materials were stored in a glovebox to minimize further particle oxidation. Particle suspensions were spin coated onto substrates before annealing at 180 °C in the glovebox, hereafter termed “as-prepared” films, or annealed at 180 °C in the glovebox followed by annealing at 250 °C in ambient air, hereafter termed “oxidized” (Fig. 1). Nevertheless, because we were interested in obtaining the overall structure of the intercalated TiS2 particles, that is thin sheets with variable interlayer distances and thicknesses, and we had previously observed that this morphology does not change with oxidation, we were not concerned about excluding oxygen during every manipulation.
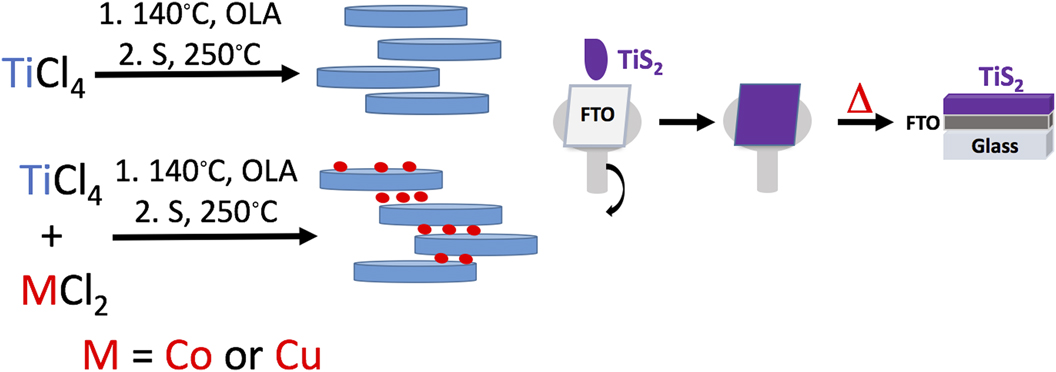
FIG. 1. Left: The synthetic scheme for TiS2 materials. Right: The film deposition process.
Once synthesized, each of the materials was studied by PXRD to understand the structural ramifications of Cu or Co inclusion. Each of the materials was deposited on a glass slide and found to be amorphous, with no significant crystalline phases apparent (Fig. 2), as has been observed by us and others. Reference Huckaba, Gharibzadeh, Ralaiarisoa, Roldan-Carmona, Mohammadian, Grancini, Lee, Amsalem, Plichta, Koch, Moshaii and Nazeeruddin38,Reference Let, Mainwaring, Rix and Murugaraj41,Reference Cui, Sakhdari, Chamlagain, Chuang, Liu, Cheng, Zhou and Chen42 The diffraction signal between 7 and 10° in the as-prepared TiS2 was assigned as an interlayer gap c axis peak (001) due to the intercalated organic oleylamine ligand. Reference Jeong, Yoo, Ahn, Miró, Heine and Cheon43 Broad signals were also observed near 30° and 45°, which are present in a variety of amorphous TiS2 or TiO2 materials reported in the literature. Reference Chen, Rahme, Holmes, Morris and Slater44,Reference Morasse, Li, Baum and Goldberger45 In the bulk powder samples of the as-prepared and oxidized TiS2, a signal near 55°, to the (110) peak, was evident; Reference Park, Choi, Kim, Oh, Ahn and Son39 however, films deposited from well-dispersed solutions did not have this same peak. This indicated that the majority of particles in the film were not face-on aggregates. These two intense, clear diffraction signals in addition to the broad nature of the other peaks indicate that each of the nanomaterials was morphologically characterized as very small (<50 nm) sized thin sheets with variable interlayer distances, which has been observed by others in similar systems. Reference Jeong, Yoo, Ahn, Miró, Heine and Cheon43,Reference Muller, Cook, Kim, Tolbert and Dunn46 For the CuTiS2 material, the same amorphous signals near 30° and 45 °C were observed, but two additional peaks were also present, near 50° and 30° that was assigned to Cu2S. Reference Mousavi-Kamazani, Zarghami and Salavati-Niasari47 A similar observation was made for the CoTiS2 material, with signals corresponding to CoS observed near 30°, 48°, and 58°. Reference Ramasamy, Malik, Raftery, Tuna and O’Brien48 Films of each material were then measured after annealing at 250 °C in ambient conditions to understand how oxidation affected the material. In each material, only the broad signals near 30° and 45° remained.
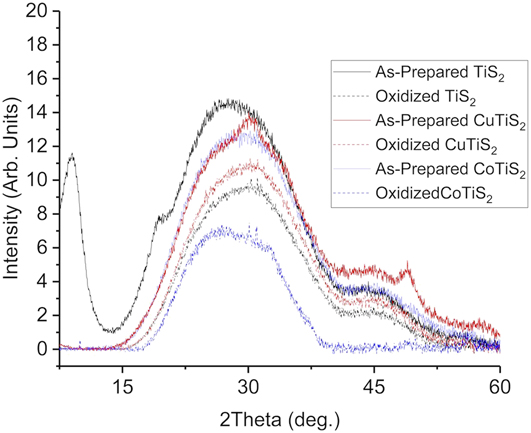
FIG. 2. PXRD data of TiS2, CuTiS2, and CoTiS2 thin films deposited on glass. “As-prepared” indicates annealing in an N2-filled glovebox at 180 °C, and “oxidized” indicates annealing in an N2-filled glovebox at 180 °C followed by annealing at 250 °C in ambient conditions.
Scanning electron microscopy (SEM) investigations were undertaken next to better understand the material film morphology. Previous investigations on TiS2 nanomaterials by us revealed that powder samples and suspensions stored in air display a wide particle size distribution and poor solubility in organic solvents. Reference Huckaba, Gharibzadeh, Ralaiarisoa, Roldan-Carmona, Mohammadian, Grancini, Lee, Amsalem, Plichta, Koch, Moshaii and Nazeeruddin38 This wide particle size distribution (<10 nm to <200 nm) led to large differences in film quality and morphology depending on spin-coating speed. Conversely, the as-prepared TiS2 materials in this work stored in the glovebox are highly soluble in organic solvents and easily processed by normal deposition methods to give smooth, uniform films, and the particle size was determined by the spin-coating deposition of low-concentration suspensions and SEM analysis (Fig. 3). Very small (∼10 nm) and somewhat larger (10–50 nm) particles were present in the CoTiS2 and CuTiS2 material (Fig. 3), while the TiS2 particles exhibit narrow size distribution (Fig. 3). Spin coating at 2000 rpm for 30 s yielded a 200 nm thick layer of CoTiS2 (See Supplementary Material). Dropcasting the nanoparticular suspension onto a previously spin-coated film confirmed all suspended particles to be <50 nm.

FIG. 3. Top-view SEM images of TiS2 materials. (a) Top-view image of spin-coated low-concentration CoTiS2 after annealing in an N2-filled glovebox at 180 °C. (b) Top-view image of spin-coated low-concentration TiS2 after annealing in an N2-filled glovebox at 180 °C. (c) Top-view image of spin-coated low-concentration CuTiS2 after annealing in an N2-filled glovebox at 180 °C.
Next, optoelectronic properties of the thin films were investigated to understand how the incorporation of Cu or Co influenced the material band gap (Fig. 4). In the unmodified TiS2 material, two direct transitions at 580 and 363 nm and an indirect absorption onset at 850 nm were observed. The peak at 580 nm was not apparent in CoTiS2 and diminished in CuTiS2, which indicated the absence of TiS2 in CoTiS2 and a small quantity in CuTiS2. In CuTiS2, a transition at 350 nm with shoulders at 468, 507, and 582 nm, and an absorption onset of 660 nm were observed. For CoTiS2, two shoulders at 485 and 533 nm are evident, with an absorption onset of 870 nm. The single absorption band present with TiS2 indicated one major particle size present, while the multiple transitions indicated multiple size regimes, as has been reported before and was observed in SEM measurements. Reference Huckaba, Gharibzadeh, Ralaiarisoa, Roldan-Carmona, Mohammadian, Grancini, Lee, Amsalem, Plichta, Koch, Moshaii and Nazeeruddin38,Reference Let, Mainwaing, Rix and Murugaraj49

FIG. 4. Normalized UV-Vis absorption spectra of TiS2, CuTiS2, and CoTiS2 thin films deposited on glass.
B. Photoelectron spectroscopy
The SECO and valence band spectra recorded for CuTiS2 and CoTiS2 are shown in Fig. 5. The SECO of CuTiS2 yields a work function of 4.10 eV [Fig. 5(a)], which is close to that of TiS2, as previously measured (Supplementary Material, Fig. S2). Reference Huckaba, Gharibzadeh, Ralaiarisoa, Roldan-Carmona, Mohammadian, Grancini, Lee, Amsalem, Plichta, Koch, Moshaii and Nazeeruddin38 In comparison, the work function of CoTiS2 is 0.4 eV lower than that of CuTiS2. This might be due to the complete oxidation of Ti (into TiO2) for CoTiS2, as opposed to the only partially oxidized Ti in CuTiS2. This interpretation is further supported by the XPS data presented in the following (vide infra). Most interestingly, in contrast to the TiS2 sample (Supplementary Material, Fig. S2), the valence band spectra for both CuTiS2 and CoTiS2 show a detectable intensity up to the Fermi level (0–2 eV), which indicates the presence of a finite density of states in this binding energy region [Fig. 5(b)]. The presence of such filled states, in contrast to the not-alloyed TiS2 sample, likely suggests an electron transfer between Cu- and Co-related compounds and TiS2. Furthermore, since the valence band spectra [Fig. 5(b), inset] of both samples show similar features to those of TiS2 (Supplementary Material, Fig. S2), thus indicating that the TiS2 valence band features are still the dominant ones, our results might indicate a possible intercalation of Cu and Co or of Cu- and Co-related compounds within the TiS2 and oxidized TiS2 material, respectively.
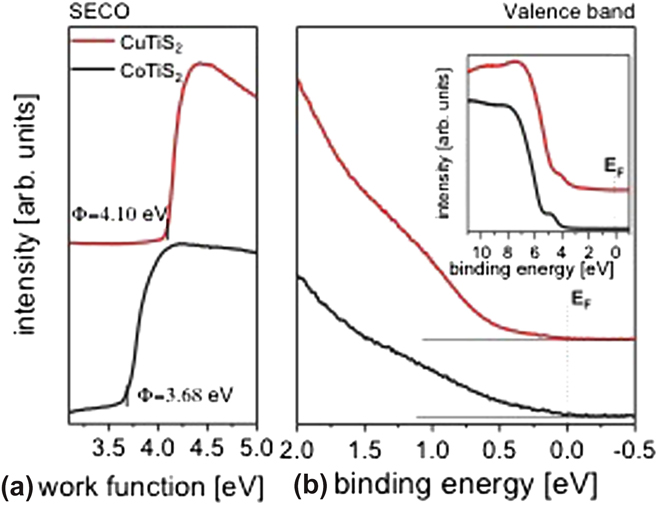
FIG. 5. (a) SECO and (b) the valence band spectra of CuTiS2 (red) and CoTiS2 (black) at low binding energies close to the Fermi level. The inset in (b) shows the large-range UPS spectra of both samples.
XPS measurements were done to get information about the possible composition of the samples (Fig. 6). The XPS core level spectra of Ti 2p, S 2p, Cu 2p 3/2, and Co 2p 3/2 for CuTiS2 and CoTiS2 are shown in Fig. 6. The binding energy values were all adjusted to the adventitious C 1s carbon binding energy that was here referenced to 285 eV (Supplementary Material, Fig. S3). For the Ti 2p and S 2p doublet peaks, the fitted peaks for each doublet are in the same color.
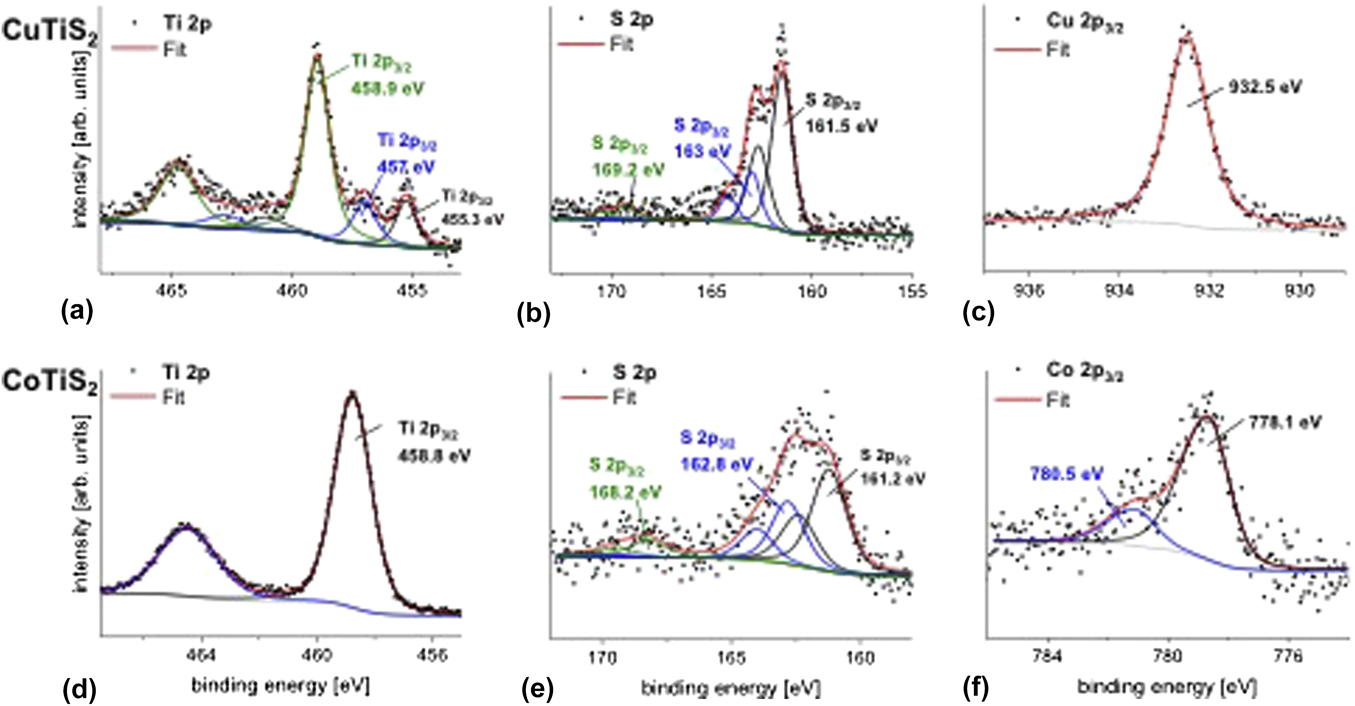
FIG. 6. XPS core level spectra of Ti 2p, S 2p, and Cu 2p 3/2 in CuTiS2 (a, b, and c, respectively) and Ti 2p, S 2p, and Co 2p 3/2 in CoTiS2 (d, e, and f, respectively). Data interpretation is in the text.
In Fig. 6(a), Ti 2p in CuTiS2 exhibits three contributions with the highest contribution at 459 eV and 464.7 eV for Ti 2p 3/2 and Ti 2p 1/2, respectively. This could be assigned to Ti 2p as in TiO2, Reference Moulder, Stickle, Sobol and Bomben50 thus implying that Ti is partially oxidized within the sample. Furthermore, the Ti 2p 3/2 at 457.1 eV and S 2p 3/2 at 161.5 eV [Fig. 6(b)] are at binding energy positions which are similar to those in TiS2 (457 eV for Ti 2p 3/2 and 161.3 eV for S 2p 3/2) in our previous work, Reference Huckaba, Gharibzadeh, Ralaiarisoa, Roldan-Carmona, Mohammadian, Grancini, Lee, Amsalem, Plichta, Koch, Moshaii and Nazeeruddin38 it is therefore possible that TiS2 is still existing in CuTiS2. The Ti 2p 3/2 peak contribution at 455.3 eV corresponds to a lower oxidation state of Ti than in TiS2 or TiO2 that might represent TiO. Reference Carley, Chalker, Riviere and Roberts51 The presence of Cu2S is not excluded either as the S 2p and Cu 2p binding energies in Cu2S would also be expected near the positions of the main peaks at 161.5 and 932.5 eV for S 2p 3/2 and Cu 2p 1/2, respectively. Reference Xu, Zhu, Liang, Li, Cui, Yang and Inoue52
In contrast to the CuTiS2 sample, the titanium in CoTiS2 exhibits only one Ti 2p peak at 458.8 and 464.5 eV for Ti 2p 3/2 and Ti 2p 1/2, respectively [Fig. 6(d)]. The high binding energy of Ti 2p indicates the presence of Ti as in TiO2, thus showing that the TiS2 in CoTiS2 is fully oxidized into TiO2. The sulfur main peak at 161.2 eV for S 2p 3/2 and the cobalt Co 2p 3/2 at 778.1 eV might be compared to S 2p 3/2 and Co 2p 3/2 as in CoS. Reference Gopalakrishnan, Murugesan, Hegde and Rao53,Reference Battistoni, Gastaldi, Mattogno, Simeone and Viticoli54 One peak at 780.4 eV is also observed for Co 2p 3/2, which might represent a higher oxidation state of cobalt. However, this might correspond to a satellite line that has been observed before in CoS. Reference Battistoni, Gastaldi, Mattogno, Simeone and Viticoli54 A sulfur S 2p 3/2 peak is also detected at 163 and 162.8 eV for CuTiS2 and CoTiS2, respectively. These two peaks correspond to the previously reported undefined species Reference Gonbeau, Guimon, Pfister-Guillouzo, Levasseur, Meunier and Dormoy55 and that was also observed in TiS2 and has been observed in other CoS x materials. Reference Huckaba, Gharibzadeh, Ralaiarisoa, Roldan-Carmona, Mohammadian, Grancini, Lee, Amsalem, Plichta, Koch, Moshaii and Nazeeruddin38,Reference Zhao, Jiang, Xue, Yan and Mu56 Due to the short inelastic mean free path of electrons in solids, the photoelectrons detected by XPS are those located within a few nanometers beneath the surface. The XPS data have been recorded at a near normal emission (at 10° angle with respect to the surface normal) and yield a composition information depth of approximately 5 nm.
C. Electrochemical measurements and electrocatalysis
To evaluate the materials’ activity in water oxidation electrocatalysis, a standard three electrode cyclic voltammetry setup was used, with a platinum foil counter electrode, a saturated Ag/AgCl reference electrode equipped with a porous vycor tip, and 1 M NaOH electrolyte. Working electrodes were annealed at 180 °C for five minutes in a glovebox to increase interparticle connectivity and substrate/film connectivity without oxygen, as TiS2 materials are easily oxidized in ambient conditions and are partially oxidized by the trace of oxygen present in the glovebox during annealing. Reference Huckaba, Gharibzadeh, Ralaiarisoa, Roldan-Carmona, Mohammadian, Grancini, Lee, Amsalem, Plichta, Koch, Moshaii and Nazeeruddin38 This annealing step was important, as films deposited without annealing were mechanically unstable during measurement. An oxidative sweep of the purple TiS2 film yielded an onset of current at ∼1.53 V versus the normal hydrogen electrode (NHE) at 1 mA/cm. The passed current increased quickly with the increasing potential; however, no bubble formation was evident, and the observed current was unstable and noisy (See Supplementary Material). The film visibly changed from purple to pale yellow, which signaled the oxidation of TiS2. After this initial scan, the previously observed peak was not observed again and the onset of current underwent an anodic shift to >3.1 V versus NHE at 1 mA/cm (Fig. 7). Scans of the oxidized TiS2 films are hereafter termed “oxidized” for clarity and consistency with the other materials studied here.

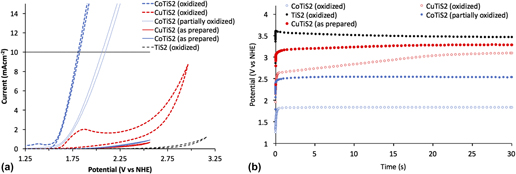
FIG. 7. (a) Cyclic voltammetric measurements and (b) chronoamperometric measurements of the as-prepared and oxidized samples of TiS2, CuTiS2, and CoTiS2 in 1 M NaOH at 100 mV/s with the Pt foil counter electrode and the saturated Ag/AgCl reference electrode.
Obtaining the same cyclic voltammetry measurements with the intercalated TiS2 materials yielded entirely different results. First scans of the glovebox annealed thin films yielded no discernible peaks until the appearance of a high potential activity onset (>2.6 V versus NHE at 1 mA/cm for CoTiS2 and >2.75 V versus NHE at 1 mA/cm for CuTiS2). Contrary to the nonmodified TiS2 material, successive cycling of CV measurements produced more pronounced cathodic shifts of the onset of current for CoTiS2, which shifted to 1.67 V versus NHE at 1 mA/cm after 50 cycles of cyclic voltammetry (data from similar films hereafter termed “partially oxidized”), see Supplementary Material. Two quasi-reversible waves were observed for CoTiS2 at 1.12 and 1.27 V versus NHE and one reversible wave at 1.38 V versus NHE. The first quasi-reversible wave was assigned to the Co(II)/Co(III) redox couple, while the reversible wave was assigned to the Co(III)/Co(IV) redox couple. Reference Smith, Prévot, Fagan, Trudel, Berlinguette, Pre, Fagan and Trudel57 These two oxidations likely represented the requisite complete oxidization of the intercalated CoS, and also indicated that the intercalated Co was in the +2 oxidation state. Observation of these phenomena also made clear that while the as-prepared or un-oxidized CoTiS2 material did not exhibit high activity for water oxidation, the successively oxidized material led to a much higher activity likely through the formation of catalytically active CoO x species [Fig. 7(a)]. Tangentially, observation of these oxidation waves also indicated that our reference electrode was indeed referenced correctly to be approximately 0.964 V versus NHE.
After this observation, films of each material were annealed in ambient air at 250 °C after the first annealing to maximize film oxidation. Whereas the as-prepared TiS2 film maintained a dark color after annealing in the glovebox, samples annealed in ambient conditions lost their color. Intercalated materials retained their color after this annealing step, so to increase oxidation even further, an aliquot of the nanomaterial suspension was stored outside the glovebox for one week and then deposited on clean FTO substrates followed by annealing in ambient conditions at 250 °C. These films were observed to have largely lost all color, which indicated a widening of the optical band gap commensurate with the oxidative decomposition of TiS2 to TiO2. Oxidative sweeps of the CuTiS2 films revealed an irreversible wave at 1.2 V versus NHE before onset of the activity, while the previously observed oxidative peaks for CoTiS2 were enhanced. Based on the PES results, which indicated the presence of Cu2S and TiS2, this oxidative peak might represent the oxidation of the CuTiS2 material to CuO x and TiO2 since it is similar to the onset of material oxidation in the as-prepared TiS2 (Supplementary Material, Fig. S5). Bubble formation was observed for both films upon reaching the catalytic current, with increasing the rate of bubble formation and release with increasing potential.
Chronoamperometric measurements of each of the as-prepared films at 10 mA/cm over 30 s were then undertaken to better understand how sustained current affected the observed potential. The highest potential was observed for TiS2 (3.47 V versus NHE, 3.07 V overpotential), followed by CuTiS2 (3.29 V versus NHE, 2.89 V overpotential), and the highest performing was CoTiS2 (2.54 V versus NHE, 2.14 V overpotential), with an observed potential almost 1 V lower than the unmodified TiS2 [Figs. 7(b) and S6]. While the observed potential was observed to be static for the as-prepared samples for over 30 s, the observed potential dropped substantially to 2.11 V versus NHE (overpotential = 1.71 V) over 30 min (Supplementary Material, Fig. S7). Using the fully oxidized CuTiS2 initially resulted in a lower observed potential (2.65 V versus NHE, 2.25 V overpotential) that quickly increased to near levels of the as-prepared film (3.1 V versus NHE, 2.70 V overpotential). Conversely, the oxidized CoTiS2 film exhibited a highly stable potential of 1.84 V versus NHE (1.44 V overpotential) at 10 mA/cm, a drastic improvement of over 1.7 V from the unmodified TiS2. This potential was stable for experiments with a long time period, and no change in the observed potential was observed after a continuous current measurement for 30 min, which indicated that the oxidized TiS2 material was stable over this timeframe. Using this chronoamperometric data, a Tafel plot was constructed to estimate the Tafel slope of the catalysis, which indicates the potential difference between a decade of current (Supplementary Material, Fig. S9). For CoTiS2, the Tafel slope was found to be 281 mV/decade.
Electrical Impedance Spectroscopy measurements were then undertaken to better understand the resistances present in each of the films. We measured the frequency-dependent complex impedance in a static solution under O2 using the constructed working electrodes. Reference McCrory, Jung, Peters and Jaramillo16 Measuring between 100 Hz and 100 KHz in a nonFaradaic region allowed us to extract the real and imaginary components of the complex impedance and plot them for each of the films (Fig. 8). The data was then analyzed by standard BioLogic software using a standard Randles circuit to extract the series resistance (R s), the charge-transfer resistance (R ct), and the double layer capacitance (C dl) values. Broadly, the oxidized TiS2 and both CuTiS2 materials exhibit similar spectra, with large initial slopes of the respective semicircles. The spectra for the CoTiS2 materials, however, appear markedly different due to the presence of a 45° Warburg-type impedance signal for both.
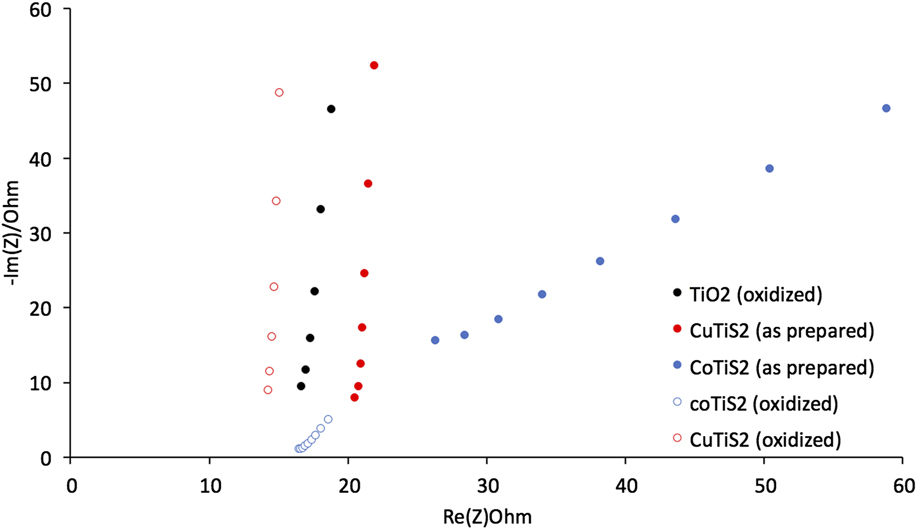
FIG. 8. The Nyquist plot of each of the materials described in 1 M NaOH.
Comparing the samples of each film in Fig. 8 indicates that as-prepared films intercalated with Cu or Co exhibit R s higher than oxidized TiS2 (R s = 15.5 Ω for oxidized TiS2, 19.4 Ω for the as-prepared CuTiS2, and 17.7 Ω for the as-prepared CoTiS2); however, upon oxidation, R s is lower or similar for all three oxidized films (R s = 13.4 Ω for oxidized CuTiS2 and 14.8 Ω for oxidized CoTiS2). Each of the intercalated materials exhibited higher R ct values than the oxidized TiS2, (R ct = 47.0 μΩ for oxidized TiS2, 58.2 μΩ for the as-prepared CuTiS2, 23.6 μΩ for oxidized CuTiS2, 177. Ω for the as-prepared CoTiS2, and 30.3 μΩ for oxidized CoTiS2), with the as-prepared CoTiS2 exhibiting a much higher R ct than the other materials. The C dl values for the TiS2 materials were found to also vary depending on intercalation and degree of oxidation. The as-prepared CuTiS2 exhibited higher C dl than the oxidized material, while the trend was opposite for CoTiS2 (C dl = 2.17 μF for oxidized TiS2, 2.89 μF for the as-prepared CuTiS2, 23.6 μF for oxidized CuTiS2, 0.004 μF for the as-prepared CoTiS2, and 0.040 μF for oxidized CoTiS2).
IV. CONCLUSIONS
Discovering efficient catalysts for the water oxidation half reaction is important, as this half reaction should theoretically supply the electrons for fuel forming reduction half reactions, such as those forming hydrogen (from water) and methanol (from CO2). We have synthesized, characterized, and applied intercalated TiS2 materials as water oxidation catalysts in 1 M NaOH electrolyte. Through intercalating precatalyst CoS between the sheets of TiS2, the water oxidation overpotential was reduced by over 1.7 V at 10 mA/cm2 compared to the unmodified TiS2 material. CV studies indicated that the Co(II) species undergoes two successive oxidations before the catalytic signal is observed, implicating a catalytically active Co(IV) oxide active site. These cyclic voltammetry and chronoamperometric data match up well with other reported water oxidation catalysts, according to a recent report on catalyst benchmarking. Reference McCrory, Jung, Peters and Jaramillo16 At a current density of 10 mA/cm, the overpotential value of 1.44 V is much higher than the vast majority of state-of-the-art water oxidation catalysts. Nevertheless, the improvement of activity from unmodified TiO2 is remarkable and indicates that intercalation/inclusion of catalyst materials into larger structures should serve as a way to boost performance. Future studies will focus on providing a better understanding of intercalating amorphous materials, in addition to optimizing the performance of intercalated materials, especially in regard to long-term stability.
Supplementary Material
To view supplementary material for this article, please visit https://doi.org/10.1557/jmr.2017.431.
ACKNOWLEDGMENTS
The authors acknowledge SNSF NRP 70 project; No. 407040 154056, European Commission H2020-ICT-2014-1, SOLEDLIGHT project, grant agreement No. 643791 and the Swiss State Secretariat for Education, Research, and Innovation (SERI), and CTI 15864.2 PFNM-NM, the HZB-HU Graduate School “hybrid4energy,” and Solaronix, Aubonne, Switzerland. A.H. acknowledges support from the special funding for energy research, managed by Prof. Andreas ZÜTTEL, Funds No. 563074.


