


I. INTRODUCTION
Understanding the mechanical properties of metallic lithium may elucidate why it is difficult to form and maintain good, low resistance interfaces that are stable for extended cycling of lithium in rechargeable batteries. Of particular interest is understanding how coupling between the electrochemical and mechanical behavior of Li and defects at the anode/solid electrolyte (SE) interface enable the formation and growth of lithium dendrites originating at the interface and growing across the SE separator. Among the critical gaps in knowledge is a comprehensive understanding of how the plastic properties of Li change with key variables such as, but not limited to, length scale, strain rate, temperature, crystallographic orientation, and electrochemical cycling. Knowing how these factors limit the performance of next generation energy storage devices will directly enable the development of robust methods to create stable interfaces that promote safe, long-term, high-rate cycling performance by mitigating the anode’s gradual loss of Li over the cycle life of the battery and by eliminating or greatly reducing the risk of metallic short-circuiting.
Recent research activity underscores the need for new knowledge to fill critical gaps in understanding the Li/SE interface.Reference Cheng, Sharafi and Sakamoto1,Reference Xu, Ahmad, Aryanfar, Viswanathan and Greer2 Experimental evidence provided by Cheng et al.Reference Cheng, Sharafi and Sakamoto1 clearly shows that upon cycling, metallic Li can short circuit an aluminum-doped polycrystalline ceramic electrolyte known as LLZO by selectively infiltrating its grain boundaries. This phenomenon occurs despite the shear modulus of LLZO being more than 10 times larger than that of Li.Reference Cheng, Sharafi and Sakamoto1,Reference Yu, Schmidt, Garcia-Mendez, Herbert, Dudney, Wolfenstine and Siegel3 As pointed out by Cheng and Yu et al.,Reference Cheng, Sharafi and Sakamoto1,Reference Yu, Schmidt, Garcia-Mendez, Herbert, Dudney, Wolfenstine and Siegel3 this observation and others similar to it clearly show that controlling the mismatch in elastic properties of the Li and a polycrystalline SE is a necessary, but not sufficient condition to prevent the formation and growth of metallic Li. The additional complexity likely arises from the poorly understood coupling between the electrochemical and mechanical properties of Li and defects at the Li/SE interface.
In addition to grain boundaries, any deviation from a perfectly flat and coherent interface, whether the defect be a pore, crack, surface roughness, or mere undulations in the surface of the SE, results in a gradient in the chemical potential that becomes the driving force for Li ions to preferentially diffuse into the defect and form metallic Li. Among the deformation mechanisms capable of alleviating the increasing pressure within defects at the Li/SE interface are elastic and plastic deformation of the Li and SE or fracture of the SE. Understanding how the pressure is controlled by these deformation mechanisms first requires developing new knowledge about the mechanical properties of Li at the length scale of the defects and, in particular, how the properties change with strain rate (analogous to current density) and the local defect structure of Li.
With that goal in mind, nanoindentation experiments have been performed at 31 °C (homologous temperature, T H, of 0.67) in high-purity 5 and 18 μm thick vapor deposited polycrystalline lithium films to ascertain how the mean pressure Li can support (hardness) changes as a function of length scale and strain rate. The length scale and strain rate dependent hardness are rationalized using slightly modified forms of the Nabarro–Herring and Harper–Dorn creep mechanisms. In a manner that depends on the indentation strain rate, the mean pressure Li can support at a contact depth of 40 nm is found to range from ∼46 to 350 times higher than the yield strength of bulk polycrystalline Li.Reference Xu, Ahmad, Aryanfar, Viswanathan and Greer2,Reference Schultz4 At a depth of 1 μm, the mean pressure is found to be independent of the strain rate and 24 times higher than the yield strength.
II. EXPERIMENTAL METHODS
Details of the Li film deposition and the nanoindentation system have been previously reported.Reference Herbert, Hackney, Dudney and Phani5 To avoid unnecessary duplication, only the unique aspects of determining the hardness as a continuous function of indentation depth are addressed here.
A. Determination of the hardness (the mean pressure Li can support)
In nanoindentation, hardness, H, is defined as the applied load, P, divided by the projected contact area, A, under load,Reference Oliver and Pharr6,Reference Oliver and Pharr7
 $$H = {P \over A}\quad .$$
Specified in this way, H physically represents the mean pressure the surface is capable of supporting at the level of strain imposed by the geometry of the indenter tip and the strain rate imposed by the loading algorithm. As previously reported,Reference Herbert, Hackney, Dudney and Phani5 A in this particular case is given by a 6-term polynomial function written in terms of the contact depth, h c. Justified by the extremely high elastic modulus to yield strength ratio of Li, E/σy = ∼16,000, here we adopt a simplified version of the polynomial function by taking h c to be the indentation depth, h, i.e., h c = h. Other researchers have adopted precisely the same definition for h c when working with similar ratios of E/σy such as indium.Reference Lucas8 The significant advantage of this definition is that it does not require the use of the Oliver–Pharr model to determine h c and, thus, it eliminates the need to determine the elastic contact stiffness, S, through the slope of the unloading curve or through the use of dynamic measurement techniques, both of which can be difficult to accurately implement when E/σy is large.Reference Herbert, Hackney, Dudney and Phani5 Physically, this definition ignores the elastic deflection of the contact perimeter and assumes A is in the original plane of the surface. Among the previously reported results, optical microscopy of the residual hardness impressions shows no discernible evidence of pile-up or any characteristic features of sink-in, thereby indicating that the simplified definition of h c is a valid approximation at deep depths.Reference Herbert, Hackney, Dudney and Phani5
B. Experimental methods used to measure the hardness
Loading was controlled using two methods. In the first loading method, the loading was controlled such that the ratio  $\dot{P}{\rm{/}}P$ was held constant at targeted values of 0.05, 0.5, and 1.0 s−1. Under conditions previously identified, this loading algorithm results in a constant indentation strain rate, defined as $\dot{h}{\rm{/}}h$.Reference Herbert, Hackney, Dudney and Phani5–Reference Lucas8 In the second loading method, the loading rate was held constant at 12.5 μN/s. Both loading algorithms terminate with a 60 s hold at P max. As previously reported,Reference Herbert, Hackney, Dudney and Phani5 no attempt was made to correct the measured displacement for thermal drift, as the high T H of 0.67 makes it extremely difficult to accurately distinguish between drift and creep. We note, however, the effect of thermal drift was minimized by performing experiments only after the stability of the glove box reached ±0.5 °C for a period of at least 6 h prior to testing.Reference Herbert, Hackney, Dudney and Phani5 In addition, the experiments were intentionally limited to time scales that are minimally affected by the drift rates typically observed in fused silica under similar testing conditions (drift rates ≤ ±0.05 nm/s). The measured displacement data were corrected for the load frame stiffness of 9.6 × 10⁵ N/m.
Capitalizing on the controller’s 20 μs time constant on the displacement signal and the system’s closed loop CPU control rate of 1 kHz (1 ms), the point of contact was initially identified using a 100 nm/s approach rate and a change in dP/dh of 50 N/m. Post-test, a more accurate estimate of the point of contact was identified by visual inspection of dP/dh and dh/dt. It is estimated that the resulting zero point in P and h accurately reflects the point of contact to within 10 nm or better.
As described above, the analysis method adopted in this work does not require knowledge of S to determine A; thus, the previously reported dynamic technique is not needed to determine H as a continuous function of depth.Reference Herbert, Hackney, Dudney and Phani5 However, some of the results presented here were obtained while the lock-in amplifier (PLA) was operating at a fixed frequency of 100 Hz and a root-mean-square amplitude of 1 nm. As will be shown, under these operating conditions and at h ≥ ∼60 nm, H is found to be insensitive to the operation of the PLA.
III. RESULTS AND DISCUSSION
Indirect verification of the measurement system’s load and displacement calibrations, the frame stiffness, and the indenter tip’s area function were routinely examined using a standard reference block of fused silica. The results and discussion have been previously reported.Reference Herbert, Hackney, Dudney and Phani5
A. Load versus displacement curves
The nanoindentation experiments performed here are fundamentally load-controlled and the displacement is directly measured. Once the data are accurately corrected for the point of contact, thermal instabilities and the compliance of the measurement system, plots of P versus h can be particularly instructive, as they require no modeling of the data and, therefore, provide unique insight that is unencumbered by restrictive modeling assumptions. To that end, we note the previously described point of contact is estimated to be accurate within 10 nm or better. Although no attempt was made to correct the displacement data for thermal drift, we note the experiments were performed under conditions that maximized the thermal stability of the environment and, thus, minimized the contribution of thermal drift. As previously reported,Reference Herbert, Hackney, Dudney and Phani5 the maximum elastic contact stiffness observed in the Li films is less than 80,000 N/m, which is well below the load frame extrapolation limit of 1.679 × 10⁵ N/m (peak S experimentally observed in fused silica) and less than 8% of the load frame stiffness. Therefore, assuming the test specimen is rigidly mounted, any reasonable uncertainty or error in the magnitude of the frame stiffness is very unlikely to make a significant contribution to the measured displacement. As such, plots of P versus h presented here are taken to be an accurate representation of the test specimen’s response to the applied load.
The distinctive P–h behavior of high-purity vapor deposited Li at a T H of 0.67 is shown in Figs. 1–4. Figure 1 displays 94 of 100 curves measured under a targeted  $\dot{P}{\rm{/}}P$ of 0.05 s−1 to a prescribed depth limit of 1.5 μm followed by a 60 s hold and 2 s unloading. The PLA was operational during both the loading and the 60 s hold at P max. The experiments were performed in a 10 × 10 array with 52 μm spacing in the x and y directions. From the point of contact to the maximum indentation depth of ∼1.5 μm, the deformation is found to be characterized by inhomogeneous flow and, as shown in Fig. 2, an abrupt transition at h = ∼350 nm from relatively smooth P–h behavior to discernibly serrated or stochastic flow. At the high T H, the lack of reproducibility at h ≤ ∼350 nm (inhomogeneity) is thought to be a hallmark of localized plasticity accommodated by diffusional creep mechanisms that reflect the local internal defect structure of the volume being sampled by the indenter.Reference Hirth and Lothe9 Over strain rates that span a factor of 7 (quantified below), the P–h behavior before the transition to serrated flow and the depth at which the transition occurs are found to be strongly dependent on strain rate. Although the extent of inhomogeneity is observed to vary from one film to the next, possibly due to differences in the deposition variables or the elapsed time between film deposition and testing (continuous annealing at room temperature), the P–h curves presented here are generally consistent among all the films examined.
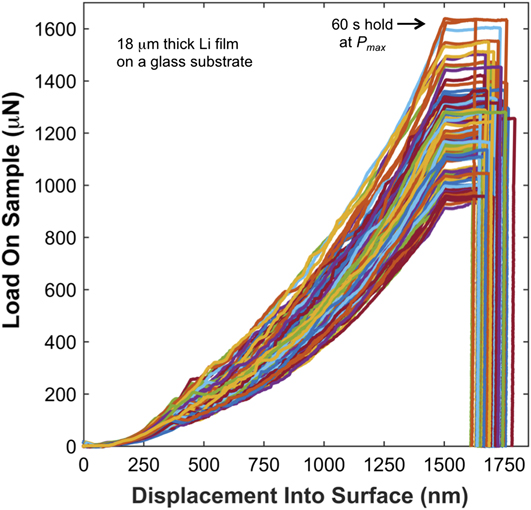
FIG. 1. Load–displacement curves in high-purity vapor deposited polycrystalline Li at 31 °C (T H = 0.67).
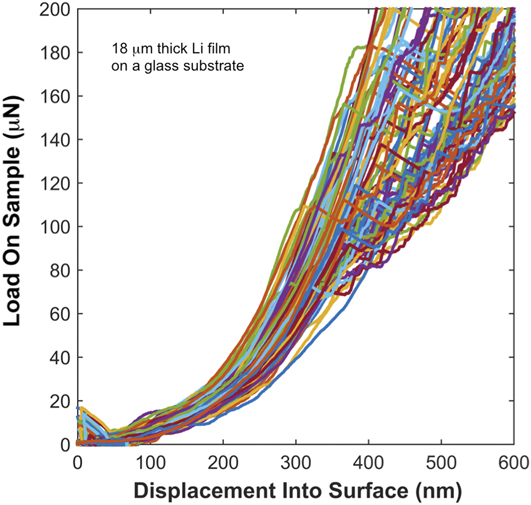
FIG. 2. Intermittent contact near the free surface (due to operation of the PLA) and the distinctive transition from relatively smooth to serrated flow.
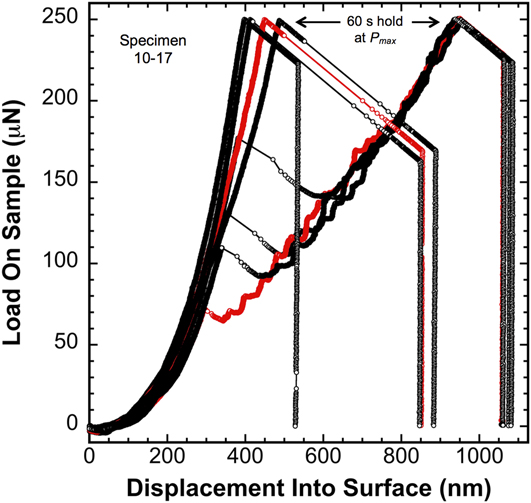
FIG. 3. High-purity vapor deposited 18 μm thick Li film on a glass substrate. Load–displacement curves at T H = 0.67 and a targeted  $\dot{P}{\rm{/}}P$ of 0.05 s−1.
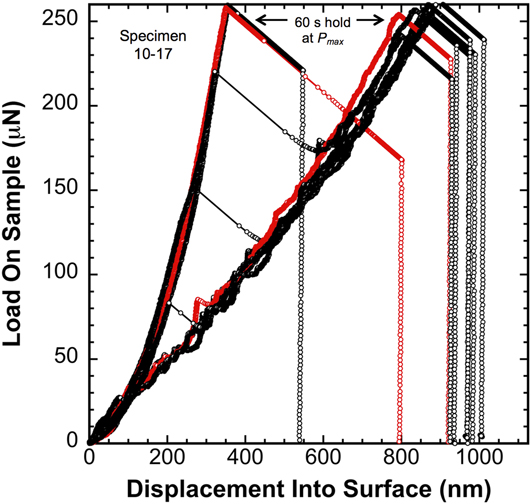
FIG. 4. Load–displacement curves obtained at an indentation strain rate 7 times higher ( $\dot{P}$ of 12.5 μN/s) than that achieved under a targeted $\dot{P}{\rm{/}}P$ of 0.05 s−1.
Figure 3 shows a subset of P–h data from an 18 μm thick Li film designated 10–17. The data were acquired at a target  $\dot{P}{\rm{/}}P$ of 0.05 s−1. The loading was terminated at a prescribed load limit of 250 μN, the maximum load was held constant for 60 s and the unloading was performed in 2 s. The PLA was not operational during any segment of the P–t history. Indent spacing in the 10 × 10 array was 35 μm in the x and y directions. The selected P–h data represent the upper and lower limits of all 100 measurements. A number of features in the P–h data provide unique insight into the mechanical behavior of the vapor deposited Li films at a T H of 0.67. Among the notable features in Fig. 3 are the following:
(i) On average, at h < ∼60 nm, the calculated load on the sample is negative. Examined under precisely the same experimental conditions, this behavior is not observed in the fused silica reference block. This clearly suggests that the negative load is not an experimental artifact caused by thermal drift. Enabled by the high T H and small strain rate, one potential rationalization of this observation is that creep dominates the deformation. The unavoidable outcome is ambiguity in the applied load, as the support springs inherently absorb the force required to deflect the springs through the measured displacement. Physically, the negative load implies that the high T H enables Li to alleviate the resulting pressure by either mobilizing dislocations and/or diffusing Li ions away from the compressive stress field under the indenter at a rate that is faster than the applied load accumulates. This conjecture is further supported by the observation that at higher strain rates, the shorter time scales inhibit creep and this phenomenon uniquely observed in Li diminishes and then completely disappears (see Figs. 4 and 7). Regardless of the mechanism, the negative load immediately following the point of contact indicates that the Li film deforms plastically immediately following contact with the indenter tip. It further indicates the film surface is predominantly free of contamination, as any substantial oxide or contamination layer would provide mechanical support for the indenter and naturally inhibit surface diffusion, both of which would serve to eliminate or greatly reduce the effect of creep;
(ii) Poor repeatability in the P–h curves from one test site to the next and poor repeatability in the P–h coordinate for the onset of serrated or stochastic flow, both of which indicate significant point-to-point variation in the film’s internal defect structure over the length scale of the indentation experiment;
(iii) Most of the P–h curves exhibit a sudden burst in displacement (strain burst or pop-in) followed by a load drop and subsequent transition to a loading curve characterized by significantly less slope and serrated flow. As reported by Feng and Ngan,Reference Feng and Ngan10 this type of behavior has also been observed at high homologous temperatures in indium. Numerous other experimental observations of pop-in events have been reported in the literature as well, but they are generally attributed to the transition from elastic deformation to the onset of dislocation-mediated plasticity.Reference Morris, Bei, Pharr and George11 In the case of Li at T H = 0.67 (and presumably indium), however, the deformation prior to the pop-in event is unique in that the deformation is not elastic, but elastic–plastic. In addition to the previously described creep at the point of contact, direct evidence of this claim (in relation to Li) is provided by noting that prior to the strain burst(s), the applied load at a given indentation depth is significantly lower than the load predicted by Sneddon’s elastic contact solution, albeit for a cone.Reference Sneddon12 For example, taking E = 3 GPa, Poisson’s ratio = 0.362 and the equivalent cone angle = 70.32°, the load predicted by Sneddon’s elastic contact solution [Eq. (8) below] at indentation depths of 100 and 350 nm is 61.5 and 753 μN, respectively. Even at the highest strain rate, these predictions (which are based on the bottom end of the range in E for Li) overestimate the experimentally measured load by approximately 105% and 194%, respectively. This clearly indicates the deformation prior to the burst is not elastic, but elastic–plastic. Thus, the pop-in events reported here are unique in that they represent a transition in the mechanism by which plastic deformation occurs in Li rather than the frequently observed transition from elastic to elastic–plastic deformation. As the data show, the P–h coordinate of the strain burst and subsequent transition varies from one test site to the next. Of particular interest, we note that several curves reach the 250 μN load limit without experiencing a discernible strain burst until several seconds into the 60 s hold at P max, where the applied load and, therefore, the mean pressure decrease with both time and depth. At least one test site, the data show no discernible strain burst at all. Collectively, these observations lead us to hypothesize that the strain burst signifies an abrupt transition from diffusion to dislocation-mediated flow that is triggered by the combination of a critical threshold in stress and a sufficient length scale, as the dislocation mechanism clearly appears to require not only the necessary driving force, but sufficient room to physically operate. Examination of this hypothesis is not discussed elsewhere, but is fully addressed in a subsequent publicationReference Herbert, Hackney, Dudney, Thole and Phani13;
(iv) On average, at depths ranging from ∼60 to ∼350 nm, the individual P–h curves are predominantly smooth despite the point-to-point variation in the defect structure. Considering the high T H of 0.67 and small strain rate (quantified below), we hypothesize that the plastic deformation in this displacement range is predominantly accommodated by diffusional creep mechanisms rather than dislocation-mediated flow;
(v) During the 60 s hold at P max, the drop in P reflects the force absorbed by the indenter column’s support springs as they are displaced either by creep or a combination of creep and a sudden burst in displacement. The magnitude of the load drop is the product of the indenter column’s support spring stiffness and the change in displacement, i.e., ΔP = ∼200 N/m × 120 nm = 24 μN. Here, the drop occurs because the current to the actuator’s electromagnetic coil was held constant rather than utilizing a feedback loop to change the current with time to maintain a constant load on the sample;
(vi) Although not explicitly shown, immediately following each strain burst, the test specimen experiences a dynamic overload, i.e., a kinetic effect whose magnitude is controlled by the damping and mass of the instrument’s actuator in response to the sudden change in velocity and acceleration of the indenter tip. The decrease in load immediately following each strain burst is, therefore, the result of force being absorbed by the support springs due to the strain burst and creep that has been enhanced by the overload. As the creep rate diminishes with time and depth, the velocity transitions to being controlled by the applied load and, thus, the load reverts back to increasing with depth. Estimating the magnitude of the overload is beyond the scope of this work. We note, however, accurate estimates could be made in the future through the measurement system’s 100 kHz data acquisition rate coupled with the 20 μs measurement time constant on the displacement signal and accurate estimates of the actuator’s moving mass and its damping coefficient.
When examined at strain rates 7 times larger (quantified below), Fig. 4 shows that the same film (10–17) behaves in a very similar, yet distinctly different way. Under a constant  $\dot{P}$ = 12.5 μN/s rather than $\dot{P}{\rm{/}}P$ = 0.05 s−1, the P–h curves are very similar, but the higher strain rate requires more load to reach the same displacement and, on average, it forces the transition to serrated flow to occur at a smaller depth. In contrast to the slower strain rate P–h curves, the load on the sample is always positive immediately following the point of contact. These observations of the strain rate dependent P–h behavior clearly indicate that time-dependent processes (likely diffusive) are associated with the indentation behavior of Li.
B. Indentation strain rate,  $\dot{h}{\rm{/}}h$

Figure 5 shows  $\dot{h}{\rm{/}}h$ versus h for all three $\dot{P}{\rm{/}}P$ loading conditions and the constant $\dot{P}$. These data are representative results from each loading condition and they clearly show none of the $\dot{P}{\rm{/}}P$ algorithms resulted in a constant $\dot{h}{\rm{/}}h$ (the constant $\dot{P}$ experiment was never intended to achieve that goal). The significant displacement gap in each data set corresponds to the previously described strain bursts shown in Fig. 2 and explicitly illustrated in Figs. 3 and 4. At the $\dot{P}{\rm{/}}P$ targets of 1.0 and 0.5 s−1, the inflection points at h = ∼70 and 90 nm, respectively, correspond to the point at which the $\dot{P}{\rm{/}}P$ algorithm begins to control $\dot{P}$ to achieve the prescribed $\dot{P}{\rm{/}}P$ target. At $\dot{P}{\rm{/}}P$ = 0.05 s−1, the control transition doesn’t occur until just before the strain burst.
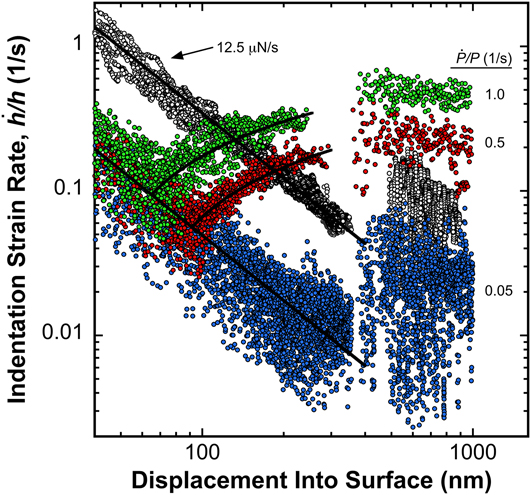
FIG. 5. Indentation strain rate for each of the 4 loading conditions. Curve fits to the pre-burst data are represented by the solid black lines.
For the constant  $\dot{P}$ experiment, the strain rate closely follows the plotted power law relation, $\dot{h}{\rm{/}}h = 345.12{h^{ - 1.5}}$ (h is in units of nm), until the strain bursts occur at ∼300 nm. At the target $\dot{P}{\rm{/}}P$ of 0.05, prior to the $\dot{P}{\rm{/}}P$ algorithm controlling $\dot{P}$, the strain rate closely follows the plotted relation $\dot{h}{\rm{/}}h = \left( {345.12{\rm{/}}7} \right){h^{ - 1.5}}$ (h is in units of nm), indicating no change in the depth dependence, but a decrease in the strain rate by a factor of 7. At the $\dot{P}{\rm{/}}P$ targets of 0.5 and 1.0 s−1, the depth dependence before the control transition is clearly very similar, but the magnitudes are successively slightly higher. After the control transition, the strain rates are best described by a logarithmic function of the form:
 $${{\dot{h}} \over h} = {C_0} + {C_1}\log h\left( t \right)\quad ,$$
where C 0 (s−1) and C 1 (s−1/m) are constants that are empirically determined from curve fitting procedures. At the targeted  $\dot{P}{\rm{/}}P$ values of 0.5 and 1.0 s−1, C 0 and C 1 are found to be 1.914 and 0.264, and 3.149 and 0.425, respectively (h is in units of meters). Both logarithmic functions are plotted with their respective strain rate data.
C. Hardness (mean pressure Li can support) as a function of length scale and strain rate
The hardness was calculated using Eq. (1) and, as per the written description in Sec. II.A, h c was taken to be h. Over the depth range of 40 nm to 1 μm, Fig. 6 shows the average H as a continuous function of h and strain rate for two Li films, 10–17 and 2–15. The films are 18 and 5 μm thick, respectively. Specimen 10–17 was examined without operation of the PLA at a targeted  $\dot{P}{\rm{/}}P$ of 0.05 s−1 and a constant $\dot{P}$ of 12.5 μN/s. Specimen 2–15 was examined with the operation of the PLA (configured as described above) at targeted $\dot{P}{\rm{/}}P$ values of 0.05, 0.5, and 1.0 s−1. The indentation experiments were performed in 10 × 10 or 8 × 8 arrays with x and y spacing of 35 times the prescribed depth limit. For the sake of clarity, the averaged data in Fig. 6 are plotted without scatter bars.
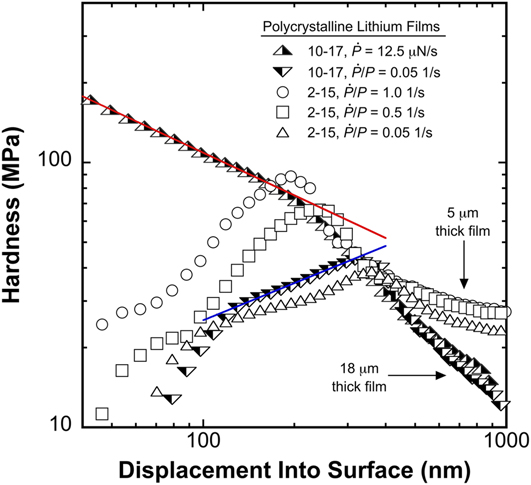
FIG. 6. Hardness as a function of depth and a 7× variation in the indentation strain rate. The solid red and blue curve fits show the mean indentation pressure (pre-strain burst) at the highest (red) and lowest (blue) strain rates is directly proportional to h −0.535 and h 0.466, respectively.
Despite the test specimen’s poor homogeneity in the defect structure over the length scale of the indentation experiment, 8 × 8 arrays were found to be sufficiently large to yield excellent reproducibility in the averaged results. Figure 7 shows the average H from 3 randomly placed 8 × 8 arrays ( $\dot{P}{\rm{/}}P$ = 0.05 s−1) on the surface of specimen 2–15 and, as the data show, despite the large scatter, the repeatability in the average H from one array to the next is quite good. Due to the aforementioned effect of creep at the point of contact, H goes to zero at depths on average ranging from ∼45 to 60 nm rather than the nominally expected depth of 0 nm.

FIG. 7. Repeatability of the average H as a function of depth and position across the surface of specimen 2–15.
The peak inflection points exhibited by the  $\dot{P}{\rm{/}}P$ experiments shown in Figs. 6 and 7 correspond to the average depth of the strain bursts and the hypothesized transition from diffusion to dislocation-mediated flow. Under the constant $\dot{P}$ of 12.5 μN/s, Fig. 6 shows that the average depth of the strain bursts and the hypothesized transition to dislocation-mediated flow occur at the inflection point near 200 nm. Under the targeted $\dot{P}{\rm{/}}P$ values of 0.5 and 1.0 s−1, the inflection points near 70 and 90 nm correspond to the increase in the strain rate that is concurrent with the transition to $\dot{P}$ being controlled by the $\dot{P}{\rm{/}}P$ algorithm.
The H results presented in Fig. 6 clearly show the mean pressure Li can support strongly depends on the length scale and strain rate. Pre-burst (prior to the strain bursts represented on average by the inflection points), H is found to be strain rate dependent. Post-burst, H is observed to be strain rate independent. The solid red and blue lines represent curve fits applied to the mean indentation pressure, H, prior to the strain bursts. At the highest and lowest indentation strain rates, the pre-burst H is found to be dependent on h according to 1280.7h −0.535 and 2.6241h 0.466, respectively (h is in units of nm). At the smallest length scale (h = ∼40 nm), the mean pressure ranges from ∼23 to 175 MPa, which represents a 661% increase in the mean pressure Li can support as the indentation strain rate increases from 0.195 to 1.364 s−1 (a factor of 7). At the largest length scale (h = 1 μm) in the 18 μm thick film, the mean pressure is found to be ∼12 MPa and independent of the strain rate (the difference in H between the 5 and 18 μm thick films at h = 1 μm is due to the influence of the glass substrate).
The unexpectedly high stresses observed here suggest significant difficulties in establishing mobile glide dislocation plasticity at depths less than the sudden transition from smooth to serrated flow. In addition to a low initial dislocation density, we note continuous annealing at the high T H may further reduce the dislocation density near the free surface. As such, we search for diffusional creep mechanisms that are compliant with the experimentally observed depth and strain rate dependent stress.
D. Rationalization of the length scale and strain rate dependent pressure Li can support prior to the strain burst and the onset serrated flow
The unique length scale and strain rate dependent H of Li shown here has not been reported elsewhere. Among the potential rationalizations, we conjecture that the strain rate and depth-dependent H prior to the abrupt transition from smooth to serrated flow is predominantly controlled by diffusion-mediated flow enabled by the high T H of 0.67 and a low dislocation density. Here we note that many of the published analyses of indentation creep have focused on extracting the uniaxial creep material parameters α and n based on the constitutive relation
 $$\dot{\varepsilon } = \alpha {\sigma ^n}\quad ,$$
where  $\dot{\varepsilon }$ is the steady-state creep rate and σ is the uniaxial creep stress.Reference Mulhearn and Tabor14–Reference Su, Herbert, Sohn, LaManna, Oliver and Pharr17 In this simplified form, Eq. (3) is only applicable to steady-state behavior and, therefore, it has limited ability to identify the rate-controlling creep mechanism when the microstructure and length scale are such that steady-state conditions cannot be achieved. In other words, when α in Eq. (3) is not a constant. To be clear, here we are not referring to the absence of steady-state conditions due to power-law breakdown or the adverse affect of the elastic transient described by Bower et al.Reference Bower, Fleck, Needleman and Ogbonna16 and further addressed by Su et al.,Reference Su, Herbert, Sohn, LaManna, Oliver and Pharr17 but rather creep processes that are directly affected by the indentation length scale.Reference Weihs and Pethica18–Reference Li and Ngan21 These mechanisms have not generally been incorporated into continuum or finite element analysis of indentation creep. However, Li and WarrenReference Li and Warren19 and Li and NganReference Li and Ngan21 have specifically considered diffusion creep length scales as correlated with indentation depth, while Nix and GaoReference Nix and Gao22 have elucidated the relationship between indentation length scale and dislocation substructure. The experimental results here, obtained specifically at small length scales, are rationalized using these length scale concepts and a more general form of Eq. (3), expressed as
 $$\dot{\varepsilon } = {{ADG{\bf{b}}} \over {{k_{\rm{B}}}T}}{\left( {{{\bf{b}} \over d}} \right)^p}{\left( {{\sigma \over G}} \right)^n}\quad ,$$
where A is a dimensionless constant, D is the diffusion coefficient, G is the shear modulus, b is the Burgers vector of the material, k B is Boltzmann’s constant, T is the temperature, p and n are constants defined as the inverse grain size exponent and the stress exponent, respectively, and d is a length scale parameter for diffusion processes. In bulk experiments, d is considered to depend on the microstructure, e.g., grain size, dislocation spacing, or cell wall spacing,Reference Hirth and Lothe9,Reference Langdon23 although it is again noted for nanoindentation, the length scale for diffusion or defect spacing has been treated as a function of indentation depth.Reference Weihs and Pethica18–Reference Nix and Gao22
Here we propose creep mechanisms similar to that of Nabarro–HerringReference Nabarro24,Reference Herring25 and Harper–DornReference Harper and Dorn26 can be used to rationalize the experimentally observed depth and strain rate dependent stress. At the slowest strain rates, we submit the mean indentation pressure or H is controlled by Nabarro–Herring or volume diffusion to the free surface, where the diffusion length scales directly with the dimensions of the contact rather than a fixed grain size. In this manner, the diffusion length increases with depth and, therefore, the pressure is expected to build until the transition to dislocation-mediated flow is made. At higher strain rates, when diffusion to the free surface cannot effectively alleviate the pressure, we submit the stress is controlled by a Harper–Dorn type mechanism, where a low dislocation density provides a diffusion length corresponding to the dislocation spacing rather than the dimensions of the contact. In this manner, the diffusion length and, thus, the pressure, are expected to vary inversely with depth.
The proposed rationalization is only one potential explanation and a speculative one at that, as there is no microstructural evidence to support its claims. We note, however, that direct microstructural evidence of the before and after defect structure in Li using TEM is currently untenable. Rapidly developing EBSD techniques may be able to help bridge the gap in future; if not directly, then perhaps indirectly. Until then, making progress toward understanding the complex coupling between the mechanical behavior of Li and device performance requires the immediate burden to shift toward developing and utilizing robust rationalizations such as the ones proposed here and subsequently in Ref. Reference Herbert, Hackney, Dudney, Thole and Phani13. As such, our purpose is to relate the measured quantity of mean indentation pressure to the observed depth and strain rate dependence in the most transparent manner possible. In the sections that follow, the proposed rationalization provides a unique framework describing the mechanisms that possibly control stress at the Li/SE interface and how those mechanisms depend directly on the length scale of the defect and the imposed strain rate (current density). By logically demonstrating their plausibility, the rationalizations take on a pivotal role by directly enabling future researchers to develop testable hypotheses that may one day lead to the development of a stable interface. Currently, the scientific literature provides little to no technical direction on this front. While others have certainly observed the remarkable length scale dependent strength of Li,Reference Xu, Ahmad, Aryanfar, Viswanathan and Greer2 no one has offered a detailed mechanistic rationalization beyond dislocation nucleation governed plasticity. Here, we provide for the first time a simple rationalization with a strong physical basis that yields the correct functional form of the observed length scale and strain rate dependent stress. Furthermore, assigning reasonable estimates to the necessary variables, the rationalizations reproduce the experimental observations remarkably well.
The first experimental observations of dislocation-free creep in indentation experiments are attributed to Weihs and Pethica,Reference Weihs and Pethica18 Asif and Pethica,Reference Asif and Pethica20 and Feng and Ngan.Reference Feng and Ngan10 Among the notable outcomes, Asif and PethicaReference Asif and Pethica20 describe how time-dependent deformation observed before the onset of dislocation motion in tungsten (Weihs et al.Reference Weihs and Pethica18) and gallium arsenide, both at room temperature, can be attributed to adsorbed surface films and the capillary condensation of water vapor. Capitalizing on the low homologous temperature of indium at room temperature, Feng and NganReference Feng and Ngan10 show the stress exponent during creep in indium prior to the onset of dislocation motion is ∼1.5. After the onset of dislocation motion, the stress exponent increases to ∼6. As pointed out by Feng and Ngan,Reference Feng and Ngan10 these stress exponents suggest diffusional creep before the onset of dislocation motion and dislocation creep after. A stress exponent near 1 is also reported in low load (1 mN) indentation experiments performed in aluminum by Li and Ngan.Reference Li and Ngan21 However, in contrast to the results obtained in indium (and the results obtained here in Li), they propose that the diffusive flow in aluminum is accommodated by the densely dislocated structure in the plastic zone beneath the indenter tip.
Based on volume and interface diffusion driven by the gradient in chemical potential due to the elastic stress field under the indenter, Li and WarrenReference Li and Warren19 attempt to rationalize the experimental observations reported in W at room temperature by Weihs and Pethica.Reference Weihs and Pethica18 Four years later, however, Asif and PethicaReference Asif and Pethica20 explain how the time dependence observed in W (by WeihsReference Weihs and Pethica18) is not due to atomic diffusion, but rather the aforementioned layer of adsorbed water vapor. Curiously, the chemical potential in the model proposed by Li and WarrenReference Li and Warren19 appears to be based on point loading at the free surface, which dramatically overestimates the gradient in the chemical potential and, thus, the driving force for diffusion.
To ascertain the relative significance of diffusion at the interface between the indenter tip and test specimen, we utilize the effective diffusion coefficient given by Tilley,Reference Tilley27
 $${D_{{\rm{effective}}}} = \left( {1 - f} \right){D_{{\rm{vol}}{\rm{.}}}} + f\left( {{D_{{\rm{boundary}}}}} \right)\quad ,$$
where f is the volume fraction of the interface where interface diffusion is occurring, D vol. = 6.081 × 10⁻¹⁵ m2/s, and D boundary ≅ 1.0 × 10⁻¹² m2/s (assumes the activation energy for boundary diffusion is approximately 2/3 the activation energy required for volume diffusion). Taking the diffusional interface to be 0.5 nm thick and assuming a conical indenter tip geometry (half-included angle, ψ = 70.32°), the interface volume, which is the product of the interface thickness and the interface surface area under pressure (A = 26.1h 2), V interface = 13.04h 2 (the constant has units of length). Using Saint–Venant’s principle to make a very conservative estimate, the volume diffusion is taken to occur over a stressed hemisphere that is 2 times the contact radius and, thus, the diffusion volume, V = (1/2)(4/3)π(2h tan ψ)3 − (1/3)π(h tan ψ)2h = 358h 3. At an indentation depth of 150 nm (approximately the middle of the range of interest), the volume fraction of the interface is 2.4 × 10⁻⁴ and, thus, the boundary or interface diffusion term in Eq. (5) is found to contribute only 4% to the effective diffusion coefficient. On this basis, its contribution is ignored in the analysis presented below.
Support for the proposed rationalization of the length scale and strain rate dependent pressure shown in Fig. 6 is provided by means of a scalar analytical model based on the deformation of a linear elastic spring and a time-dependent damper connected in series, a one-dimensional Maxwell solid. Justification for this scalar approach is provided in Appendixes A and B, both of which are available in the online publication only. As per the one-dimensional Maxwell model, Hooke’s law governs the spring and the damper represents a Newtonian fluid, thus, n in Eqs. (3) and (4) is inherently taken to be 1. Under a fixed total strain, εo, the relative amount of strain accommodated by the spring and damper elements is allowed to change with time, but their sum always equates to εo, giving the relation
 $${\varepsilon _{\rm{o}}} = {\varepsilon _{{\rm{elastic}}}}\left( t \right) + {\varepsilon _{{\rm{plastic}}}}\left( t \right)\quad ,$$
where εelastic(t) and εplastic(t) are the time-dependent elastic strain in the spring and time-dependent plastic strain accommodated by the damper, respectively. At any given point, the decrease in stress with time is then given by
 $$\sigma \left( t \right) = E{\varepsilon _{{\rm{elastic}}}}\left( t \right) = E\left( {{\varepsilon _{\rm{o}}} - {\varepsilon _{{\rm{plastic}}}}\left( t \right)} \right)\quad ,$$
where E is mathematically the elastic modulus of the spring.
The model’s connection to the indentation experiment is through εo, which physically represents the characteristic strain imposed by the Berkovich indenter tip. Owing to geometric self-similarity, the characteristic strain imposed by the Berkovich indenter tip is constant, but its value depends on the stress field under the indenter. As evidenced by the depth-dependent H shown in Fig. 6, the state of stress is continuously evolving and, thus, the characteristic strain must change with depth as well. Assuming the deformation prior to a strain burst is controlled by diffusional creep mechanisms, there is no plastic zone under the indenter and the mass transport is uniquely accommodated by the diffusional flow of Li ions escaping the compressive elastic stress field radiating outward from the point of contact. As such, the depth dependence of the characteristic strain is not immediately clear. To a first order approximation, here we take the characteristic strain to be the average of the two limiting cases, purely elastic and fully developed plasticity. Recognizing the constant value is not strictly accurate, here we take it to be a reasonable approximation.
In the elastic limit, the characteristic strain is deduced from Sneddon’s P–h relationship for a rigid cone,Reference Sneddon12 given as
 $$P = {{2E\tan \left( \psi \right){h^2}} \over {\pi \left( {1 - {\nu ^2}} \right)}}\quad ,$$
where β is the half-included cone angle and ν is Poisson’s ratio. The half-included cone angle relating the cone and Berkovich indenter tip is 70.32°, as this angle yields the same depth-to-area ratio as the Berkovich indenter tip. Taking ψ = 70.32°, ν = 0.362 for Li, and normalizing Eq. (8) by the contact area, A = π(2/π tan ψh)2, the characteristic strain is found to be 0.19. In the fully developed or unconstrained plastic limit, TaborReference Tabor30 proposed the characteristic strain for a conical indenter to be 0.2 cot ψ, which gives a characteristic strain of 0.072 for the Berkovich indenter tip.Reference Bower, Fleck, Needleman and Ogbonna16 Averaging these values from the two limiting cases results in a characteristic strain of 0.13. We further note that due to rounding at the indenter tip’s apex, the assumption of a constant characteristic strain is not valid at depths that are small relative to the dimensions of the tip defect. Experiments performed in sapphire with the Berkovich indenter tip used throughout this investigation indicate that the dimension of the tip defect here is ≤50 nm.
Writing the time-dependent plastic strain in Eq. (7) in terms of the time-dependent indentation depth, h(t), yields
 $$\sigma \left( t \right) = E\left[ {{\varepsilon _{\rm{o}}} - {1 \over {h\left( t \right)}}\int_0^t {h\left( \tau \right)\left( {{{{\rm{d}}{\varepsilon _{{\rm{plastic}}}}} \over {{\rm{d}}\tau }}} \right){\rm{d}}\tau } } \right]\quad ,$$
where the integral term is the plastic displacement and h(t) is the normalizing length needed to define the strain. In the limiting cases of a rigid spring or rigid damper, we note Eq. (9) returns the correct result. Differentiating Eq. (9) with respect to time to eliminate the integral term gives
 $$h\left( t \right){{{\rm{d}}\sigma \left( t \right)} \over {{\rm{d}}t}} + \sigma \left( t \right){{{\rm{d}}h\left( t \right)} \over {{\rm{d}}t}} = E\left( {{\varepsilon _{\rm{o}}}{{{\rm{d}}h\left( t \right)} \over {{\rm{d}}t}} - h{{{\rm{d}}{\varepsilon _{{\rm{plastic}}}}} \over {{\rm{d}}t}}} \right)\quad .$$
Dividing Eq. (10) by h and E enables the relation to be expressed such that
 $${1 \over E}{{{\rm{d}}\sigma \left( t \right)} \over {{\rm{d}}t}} = \left( {{\varepsilon _{\rm{o}}}{1 \over {h\left( t \right)}}{{{\rm{d}}h\left( t \right)} \over {{\rm{d}}t}} - {{{\rm{d}}{\varepsilon _{{\rm{plastic}}}}} \over {{\rm{d}}t}}} \right) - {{\sigma \left( t \right)} \over E}{{{\rm{d}}h\left( t \right)} \over {{\rm{d}}t}}{1 \over {h\left( t \right)}}\quad ,$$
where we note the elastic strain rate on the left-hand side is exceedingly small, as the deformation is dominated by plasticity. Setting the left side equal to zero and solving for the stress gives the following analytical approximation as a function of strain rate and indentation depth:
 $$\sigma \left( t \right) = {{E\left( {{\varepsilon _{\rm{o}}}{1 \over {h\left( t \right)}}{{{\rm{d}}h\left( t \right)} \over {{\rm{d}}t}} - {{{\rm{d}}{\varepsilon _{{\rm{plastic}}}}} \over {{\rm{d}}t}}} \right)} \over {{{{\rm{d}}h\left( t \right)} \over {{\rm{d}}t}}{1 \over {h\left( t \right)}}}}\quad .$$
Equation (12) provides the means to identify diffusional creep mechanisms capable of rationalizing the experimentally observed strain rate and depth dependent H. The first mechanism considered here is volume diffusion to the free surface, or Nabarro–Herring creep, where the diffusion length scales directly with the dimensions of the contact rather than a fixed grain size. The second mechanism we consider is dislocation glide and climb, or Harper–Dorn creep, where a low dislocation density provides a diffusion length corresponding to the dislocation spacing rather than the dimensions of the contact.
The Nabarro–Herring strain rate is given by Eq. (4) but adapted to the indenter geometry to accommodate volume diffusion to the free surface rather than to a grain boundary. In a manner consistent with the stress-directed diffusion of vacancies, p and n are taken to be 2 and 1, respectively, resulting in
 $${{{\rm{d}}{\varepsilon _{{\rm{Nabarro}} - {\rm{Herring}}}}\left( t \right)} \over {{\rm{d}}t}} = {1 \over {{C_{{\rm{dl}}}}}}{{D\Omega } \over {{k_{\rm{B}}}T}}{{\sigma \left( t \right)} \over {h{{\left( t \right)}^2}}}\quad ,$$
where Ω is the atomic volume of Li and C dl is a dimensionless scaling factor that modifies the indention depth such that the product C dlh(t) gives the average distance Li ions diffuse to the free surface to escape the compressive component of the stress field radiating outward from the point of contact.Reference Langdon23 A very similar relation has been derived by Ngan et al. [Eq. (7)].Reference Li and Ngan21 Rather than volume diffusion, however, the shape change is said to be accommodated by atoms diffusing along the dense network of dislocations from within the plastic zone beneath the indenter tip. Despite the fundamental difference in diffusion mechanisms, the numerical difference between the two derivations is only a factor of 4.7 (based on the respective inputs reported here and in Ref. Reference Li and Ngan21).
Substituting Eq. (13) for the plastic strain rate term in Eq. (12) and solving for the volume diffusion controlled stress gives
 $$\sigma {\left( t \right)_{{\rm{Nabarro}} - {\rm{Herring}}}} = {{E{\varepsilon _{\rm{o}}}{{\dot{h}} / h}} \over {{{\dot{h}} / h} + {{\left( {E\beta } \right)} / {\left( {{C_{{\rm{dl}}}}h{{\left( t \right)}^2}} \right)}}}}\quad ,$$
where β = (DΩ)/(k BT). Finally, replacing  $\dot{h}{\rm{/}}h$ with the curve fit relation (9.5092 × 10⁻¹²/7)h −1.5 (h is in units of meters rather than nm) yields the following approximation of the depth dependent stress under the targeted $\dot{P}{\rm{/}}P$ of 0.05 s−1:
 $$\sigma {\left( t \right)_{{\rm{Nabarro}} - {\rm{Herring}}}} = {{1.358 \times {{10}^{ - 12}}\left( {{{\rm{m}}^{1.5}}{\rm{/s}}} \right)E{\varepsilon _{\rm{o}}}{C_{{\rm{dl}}}}\sqrt {h\left( t \right)} } \over {E\left( {{{D\Omega } \over {{k_{\rm{B}}}T}}} \right) + 1.358 \times {{10}^{ - 12}}\left( {{{\rm{m}}^{1.5}}{\rm{/s}}} \right){C_{{\rm{dl}}}}\sqrt {h\left( t \right)} }}\quad .$$
 We note the magnitude of the second term in the denominator is comparatively small and, therefore, the stress may be considered to be proportional to  $\sqrt {h\left( t \right)}$, which is clearly consistent with the experimentally observed depth dependent trend in H discussed in Sec. III.C.
When the strain rate is too high to accommodate the plastic flow by volume diffusion to the free surface, the Nabarro–Herring model may be supplanted by dislocation climb processes, of which Harper–Dorn is an example. A dislocation climb process involving a pre-existing statistically stored dislocation density within the stressed volume under the indenter is considered. These randomly occurring pre-existing statistically stored dislocations may have limited utility in promoting stress relief by glide unless they are precisely oriented on the correct slip plane. However, stress relief by climb or combined glide and climb will have fewer geometrical restrictions. The climb operation of a Bardeen–Herring or spiral dislocation source will produce dislocation length within the stressed volume under the indenter that depends on the loop radius (∝h) multiplied by the number of loops (also ∝h), thus giving a dislocation density ∝h 2/h 3, suggesting a 1/h dependence on dislocation density created by operation of climb processes on random, pre-existing statistically stored dislocations.Reference Hirth and Lothe9 This is similar to arguments concerning the 1/h dependence of the dislocation density of geometrically necessary dislocation density required for the accommodation of the indentation shape change via dislocation glide.Reference Nix and Gao22
For a dislocation velocity V = DΩσ(t)/(bk BT), the Orowan equationReference Hirth and Lothe9 gives
 $${{{\rm{d}}{\varepsilon _{{\rm{Harper}} - {\rm{Dorn}}}}\left( t \right)} \over {{\rm{d}}t}} = \lambda {{D\Omega } \over {{k_{\rm{B}}}T}}{{\sigma \left( t \right)} \over {h\left( t \right)}}\quad ,$$
where λ (m−1) is correlated to the inverse of the dislocation loop spacing multiplied by a dimensionless geometric scaling term that relates the ratio of the dislocation loop circumference with the stressed volume under the indenter to the ratio h/h 3. Substituting Eq. (16) for the plastic strain rate term in Eq. (12) and solving for the stress controlled by dislocation climb and glide gives
 $$\sigma {\left( t \right)_{{\rm{Harper}} - {\rm{Dorn}}}} = {{E{\varepsilon _{\rm{o}}}{{\dot{h}} / h}} \over {{{\dot{h}} / h} + {{\left( {E\beta A} \right)} / {h\left( t \right)}}}}\quad .$$
 Replacing  $\dot{h}{\rm{/}}h$ with the curve fit relation (9.509 × 10⁻¹²)h −1.5 (h is in units of meters rather than nm) yields the following approximation of the depth-dependent stress under a constant $\dot{P}$ of 12.5 μN/s:
 $$\sigma {\left( t \right)_{{\rm{Harper}} - {\rm{Dorn}}}} = {{9.509 \times {{10}^{ - 12}}\left( {{{{{\rm{m}}^{1.5}}} / {\rm{s}}}} \right)E{\varepsilon _{\rm{o}}}} \over {E\left( {{{D\Omega } \over {{k_{\rm{B}}}T}}} \right)\lambda \sqrt {h\left( t \right)} + 9.509 \times {{10}^{ - 12}}\left( {{{{{\rm{m}}^{1.5}}} / {\rm{s}}}} \right)}}\quad ,$$
Here, the stress is found to be proportional to  ${1 / {\sqrt {h\left( t \right)} }}$, which is also clearly consistent with the experimentally observed trend in H as discussed in Sec. III.C.
In addition to correctly identifying the trends in H with depth and strain rate, Eqs. (15) and (18) can also provide estimates of the stress magnitude that compare favorably with the experimental data shown in Fig. 6. Table I summarizes the input values used here. As previously described, εo is taken to be 0.13 and is rationalized by averaging the values determined from the limiting cases of elastic and fully developed plastic stress fields. The self-diffusion coefficient of Li at 31 °C is taken to be 6.081 × 10⁻¹⁵ m2/s, which is well within the experimentally determined range reported by Lodding et al.,Reference Lodding, Mundy and Ott31 spanning from 3.5 × 10⁻¹⁵ to 2.94 × 10⁻¹⁴ m2/s. To reproduce the experimental data shown in Fig. 6, the values of C dl [Eq. (15)] and λ [Eq. (18)] are then fixed at 13.2 and 9.697 × 10⁵ m−1, respectively. Although the values for C dl and λ have not been experimentally confirmed or independently verified, we submit that they are well within the range of reasonable possibilities.
TABLE I. Values of the parameters used to calculate the stress in accordance with Eqs. (15) and (18).

To a first order estimate, the feasibility of the required C dl of 13.2 can be assessed by utilizing a slightly modified form of the Zener approximationReference Porter, Easterling and Sherif32 to show that nearly 60% of the indenter tip velocity can be accommodated by atomic diffusion through random walk alone. Neglecting the concentration gradient, the indenter and atomic velocity can be equated accordingly,
 $${{{\rm{d}}h(t)} \over {{\rm{d}}t}} = {D \over {{C_{{\rm{dl}}}}h\left( t \right)}}\quad .$$
We note the right-hand side of Eq. (19) is inherently underestimated because it neglects the fundamental driving force, the gradient in chemical potential caused by the elastic strain field under the indenter. Nonetheless, dividing both sides of Eq. (19) by dh(t)/dt yields
 $$1 = {D \over {\dot{h}{C_{{\rm{dl}}}}h\left( t \right)}}\quad ,$$
which, when met, indicates that the diffusion length due to mere random walk is capable of supporting the observed velocity of the indenter tip. Taking the strain rate to be (9.5092 × 10⁻¹²/7)h −1.5, where h is in meters, C dl = 13.2, D = 6.081 × 10⁻¹⁵ m2/s, and h = 350 nm, and the left-hand side of Eq. (20) is found to be 0.57. While this clearly indicates that the additional driving force is needed to support the required diffusion length (13.2 × h = 4620 nm or 4.7 times the contact radius), the discrepancy can be reasonably justified by the missing contribution from the elastic stress field. For comparative purposes, evaluation of Eq. (20) at the higher strain rate yields a mere 0.082. Rather than burdening the elastic stress field with this discrepancy, we submit this difference reflects the fundamental change in the diffusion mechanism from Nabarro–Herring to Harper–Dorn. Alternatively, Eq. (9) can be modified to reflect the analysis proposed by Bower et al. by multiplying the 1/h(t) term leading the integral by a factor of 1/tan ψ (ψ = 70.32°). This scaling change transforms h(t) into a c(t) (the true contact radius defined by Bower) and, thus, C dl becomes 13.2/2.8 = 4.7. Adopting Bower’s scaling in this manner reduces the diffusion length required to escape the elastic stress field from 4.7 to 1.7 times the contact radius. To be clear, directly relating h(t) to a c(t) through tan ψ assumes that there is no pile-up or sink-in. In other words, here we take Bower’s pile-up sink-in parameter, c, to be 1 rather than 0.65.
Justification of λ = 9.697 × 10⁵ m−1 is as follows. For a dimensionless scaling factor less than 1, the loop spacing is greater than the indentation depth. This suggests the occurrence of only a partial dislocation loop (climb bow out) or single loop within the stressed indentation volume. In terms of dislocation density, the dislocation line length located within the stressed volume under the indenter is predicted to be in the order of 1012 to 1013 m−2. However, it should be noted this is not the uniform dislocation density of the deposited film, but rather the presence of a single dislocation loop length normalized by the stressed volume under the indenter.
Using the input parameters provided in Table I and the respective strain rates presented in Sec. III.B, Fig. 8 shows the direct comparison between the measured H and the stresses predicted by Eqs. (15) and (18). As the data show, prior to making the transition to dislocation-mediated flow, the Nabarro–Herring and Harper–Dorn creep mechanisms can effectively rationalize the length scale and strain rate dependent mean pressure the Li surface is capable of supporting. At the targeted  $\dot{P}{\rm{/}}P$ of 0.05 and 0.5 s−1, deviation from rationalization at small depths is due to the previously described ambiguity in the applied load due to creep.

FIG. 8. Direct comparisons between the experimentally measured mean indentation pressure and the stresses predicted by the slightly modified Nabarro–Herring and Harper–Dorn creep relations.
After the hypothesized transition to dislocation-mediated flow, Figs. 3 and 4 show that the P–h curves are comprised of numerous stair-step discontinuities that diminish in size and number with increasing depth. This type of behavior is not unique to Li. As far back as 1997, Corcoran et al.Reference Corcoran, Colton, Lilleodden and Gerberich33 related this type of activity observed in single crystal Au to time-dependent dislocation source activity under the indenter, although no explicit quantitative rationalization of the multiple stair-step behavior was elucidated. Here we simply point out that in this region of serrated flow, the mean pressure Li can support has two significant constraints: first, the pressure is independent of the strain rate and second, it is inversely proportional to the depth, which we note is consistent with the well documented indentation size effect.Reference Pharr, Herbert and Gao34
E. Significance of these results in relation to the development of next generation energy storage devices
Collectively, these observations demonstrate that the Li/SE interface cannot be accurately modeled based on the yield strength of bulk polycrystalline Li. Moreover, this work demonstrates the pressure Li can support at the length scale of defects at the interface will depend significantly on the dimensions of the defect, the local dislocation density of the Li, the temperature, and the strain rate, which presumably scales directly with the current density. To fully enable the development of safe and efficient cycling of lithium over many cycles, more information is needed to better understand how defects formed in the Li during electrochemical cycling migrate, agglomerate, or anneal with further cycling, time, and temperature. Ultimately, we need to understand how these changes affect the ability of Li to alleviate stress. This knowledge will also serve as a cornerstone in understanding the failure mechanism(s) of SEs.
IV. CONCLUSIONS
(1) Over the depth range of 40 nm to 1 μm, the hardness of 5 and 18 μm thick high-purity vapor deposited lithium films measured at 31 °C (T H = 0.67) is found to depend strongly on the length scale and strain rate. At 40 nm of depth, the mean pressure the lithium film can support ranges from ∼23 to 175 MPa as the indentation strain rate increases from 0.195 to 1.364 s−1. These pressures are ∼46–350 times larger than the yield strength of bulk polycrystalline Li (taken to be 0.5 MPa near room temperature). At a depth of 1 μm, the mean pressure lithium can support is found to be ∼12 MPa and independent of the strain rate. These results clearly indicate that the interface between lithium and a SE cannot be accurately modeled based on the plastic properties of bulk polycrystalline lithium.
(2) Load–displacement curves show the deformation is characterized by smooth, but inhomogeneous flow followed by an abrupt transition to serrated flow. Prior to the transition, the length scale and strain rate dependent hardness can be rationalized using Nabarro–Herring and Harper–Dorn creep mechanisms slightly modified to accommodate the indentation geometry. After the transition, the hardness is independent of the strain rate and decreases inversely with depth in a manner consistent with the indentation size effect and dislocation plasticity.
(3) The transition from diffusion to dislocation-mediated flow depends on the strain rate. Load–displacement curves suggest that the transition requires the combination of a critical threshold in stress and a sufficient length scale. Detailed analysis of this transition is presented in a subsequent publication.Reference Herbert, Hackney, Dudney, Thole and Phani13
Supplementary Material
To view supplementary material for this article, please visit https://doi.org/10.1557/jmr.2018.84.
Appendices A and B are available online. Lee and RadokReference Lee and Radok28 and TingReference Ting29 have considered indentation creep kinetics for a variety indentation geometries and loading histories. Although both studies acknowledge the 3-dimensional nature of the indentation strain field, the analysis is reduced to the consideration of the time (and radial position, r) dependence of the indentation pressure, p(r, t) [Lee and RadokReference Lee and Radok28 Eq. (29), TingReference Ting29 Eqs. (36a) and (37b)] presumably as an acknowledgment that the average indentation pressure (a scalar quantity) is the experimentally measured parameter. Both Lee and RadokReference Lee and Radok28 [Eq. (36)] and TingReference Ting29 [Eq. (54)] use the relaxation modulus for a one-dimensional (scalar) Maxwell solid to demonstrate their analysis for creep behavior of the indentation contact pressure, p(r, t), developed using the assumption of linear viscoelasticity. However, it is shown in Appendix A that the apparent depth dependence of the indentation viscosity observed here violates the requirements of linearity. For this reason, we utilize an approach that does not rely on the Boltzmann integral and Laplace inversion. Instead, a one-dimensional Maxwell model is developed without recourse to linear superposition and Laplace inversion which links the experimentally observed indentation strain rate with diffusional creep models to successfully predict the experimentally observed hardness. In Appendix B, a complimentary approach coupling the experimentally observed loading rate (a scalar quantity) with the creep mechanism is also developed. This complimentary model also correctly predicts both the observed indentation strain rate and hardness.
ACKNOWLEDGMENTS
This research was sponsored jointly by the U.S. Department of Energy, Office of Energy Efficiency and Renewable Energy’s Advanced Battery Materials Research program (managed by Tien Duong) and by TARDEC, the U.S. Army Tank Automotive Research Development and Engineering Center. E.G.H. is grateful for start-up funding from the Department of Materials Science and Engineering at Michigan Technological University. V.T.’s contributions were financially supported through the MSE Department’s McArthur Internship program. The authors are also grateful for the guidance and input provided by Professor George M. Pharr during the writing of this manuscript.


