


I. INTRODUCTION
Grain boundary engineering of a nanocrystalline metal has been an attractive goal for many years.Reference Watanabe and Tsurekawa1,Reference Watanabe2 The motivation is provided by the extremely high density of grain boundaries, which makes their character especially important.Reference Gleiter3 The most successful attempts to control nanocrystalline grain boundary character have relied on creating a high density of growth twins in low stacking fault energy metals produced by sputteringReference Zhang, Anderoglu, Hoagland and Misra4 or electrodeposition.Reference Lu, Shen, Chen, Qian and Lu5 This parallels conventional grain boundary engineering (i.e., grain boundary manipulation in coarse-grained materials), where improvements in properties have also come from an increase in the twin fraction.Reference Lin, Palumbo, Erb and Aust6,Reference Randle7 Other nanocrystalline grain boundary engineering techniques have used either in situ deposition treatments or post-deposition annealing to increase the Σ3 fraction.Reference Kobayashi, Tsurekawa and Watanabe8,Reference Ma, La Mattina, Shorubalko, Spolenak and Seita9 Improvements in ductility,Reference Lu, Shen, Chen, Qian and Lu5 fatigue life,Reference Shute, Myers, Xie, Li, Barbee, Hodge and Weertman10 corrosion resistance,Reference Zhao, Cheng, Kassner and Hodge11 and conductivityReference Lu, Shen, Chen, Qian and Lu5 have been reported. While these materials have the high twin fractions typical of conventional grain boundary engineered metals, they also have columnar grain structures that pose new challenges. LaGrange et al.Reference LaGrange, Reed, Wall, Mason, Barbee and Kumar12 showed that such a grain boundary network topology leaves these materials vulnerable to thermal coarsening, despite the supposed stabilizing effect of the twins. Recently, a warm cyclic deformation process has been used to increase the length fraction of twins in nanocrystalline Ni by 48%.Reference Bober, Kumar and Rupert13 This type of thermomechanical approach is appealing because it does not rely on the deposition of lamellar nanotwins and could theoretically be applied to bulk nanocrystalline materials, similar to the practice of conventional grain boundary engineering.
In addition to any potential practical importance, this type of deformation-based technique presents a case where the unusual deformation mechanisms of nanocrystalline metals are important. It is likely that the plastic deformation of a nanocrystalline metal will directly alter the grain boundary character distribution, which is in sharp contrast to conventional grain boundary engineering. In the latter, the applied strain serves primarily to accumulate strain energy that is useful for driving subsequent recrystallization that reconfigures the boundary network. By itself, the deformation applied in conventional treatments has little effect on boundary network statistics, though dislocation storage can introduce local changes along a given boundary.Reference Kumar, Schwartz and King14 However, in a nanocrystalline metal, it has been hypothesized that even modest plastic deformation can alter boundary character rather dramatically. For example, Panzarino et al. showed that even small cyclic strains can cause nanocrystalline grains to rotate relative to their neighbors and create new twin boundaries.Reference Panzarino, Ramos and Rupert15 Other proposed nanocrystalline deformation mechanisms could be associated with even more dramatic changes to the boundary network. For example, Froseth et al. reported on a profusion of stacking faults created via grain boundary nucleated dislocations that subsequently thicken into twins.Reference Frøseth, Derlet and Swygenhoven16 Alternatively, deformation induced de-twinning could dramatically reconfigure microstructure. Some nanocrystalline deformation phenomena, like stress-induced grain boundary migration,Reference An, Lin, Wu and Zhang17 would lead to subtle changes in the boundary network that could nonetheless accumulate during cyclic loading.Reference Padilla and Boyce18
To the extent that a nanocrystalline grain boundary network is influenced by plasticity, studying its evolution provides a means to probe those deformation mechanisms. The two-part goal of this work is to describe nanocrystalline grain boundary engineering in a way that both (i) guides processing and (ii) provides insight about the relevant deformation physics. From a processing perspective, there are currently many open questions. For example, while increasing the number of stress cycles has been shown to increase the extent of microstructural changes, the effect of stress/strain amplitude is unclear.Reference Bober, Kumar and Rupert13,Reference Padilla and Boyce18 From a mechanistic perspective, there is a great deal to be learned from the analysis of the grain boundary network connectivity, which has so far only been described in nanocrystalline metals via triple junction statistics (see, e.g., Ref. Reference Bober, Kumar and Rupert13). Bober et al. recently used analysis of the grain boundary network to reveal how the formation and growth of individual twin related domains (TRDs) proceeds via recrystallization and is responsible for the high twin fractions observed in conventional grain boundary engineered Ni.Reference Bober, Lind, Mulay, Rupert and Kumar19
In this paper, we report on the evolution of the grain boundary network in nanocrystalline Cu under warm cyclic strains. The range of strains and cycling temperatures expands on those used in our previous work on nanocrystalline Ni,Reference Bober, Kumar and Rupert13 which allows the individual and combined effects of temperature and deformation to be more clearly distinguished. In addition, the procurement of larger orientation maps than were achieved in our previous work allows new types of information to be gathered about the topology of the grain boundary network. Larger maps provide the ability to reconstruct TRDs and so measure their size and the frequency of each twinning variant. Together, these observations are used to identify the deformation mechanism most likely responsible for the alteration of the nanocrystalline grain boundary network.
II. MATERIALS AND METHODS
Nanocrystalline Cu films were sputter deposited with a mean grain size of 15 ± 8 nm, as measured via transmission electron microscopy (TEM). This grain size is within the nanocrystalline regime but still large enough for successful orientation mapping.Reference Trimby20 Warm cyclic strains were applied to the nanocrystalline films because elevated temperature and cyclic strain can combine to cause grain boundary network evolution. For elevated temperature tests, the samples were warmed with hot air to either 60 or 100 °C. These temperatures were selected because they produced little or no grain growth in the absence of strain, yet were sufficient to facilitate grain boundary evolution when applied in combination with a cyclic stress.Reference Bober, Kumar and Rupert13 The applied strain rates were chosen so that the material was always held at temperature for 70 min. Polymer substrates, namely 22 µm thick cellulose acetate, were used to reduce strain localization in the Cu films during loading, with the goal being to enable larger strains than would be possible for unsupported metal films.
We hypothesize here that the application of larger strains is desirable because it will increase the extent of grain boundary mediated deformation and the accompanying boundary network evolution. The metal-on-polymer concept is adapted from the flexible electronics community, where this type of composite has been shown to allow much larger strains to be applied to metal films than would be possible if they were free standing.Reference Lu, Wang, Suo and Vlassak21 The film/substrate composite can be modeled as a Voigt iso-strain composite.Reference Li, Huang, Xi, Lacour, Wagner and Suo22 Identical average strains in the Cu and cellulose acetate were verified by using a scanning electron microscope (Phenom Pro-X, ThermoFisher Scientific, Eindhoven, Netherlands) to check for cracks or delamination, which were not detected in any of the experiments presented here. Strong adhesion is required and was achieved by preparing the cellulose acetate with a dehydration bake and a titanium layer with ∼1 nm thickness. To produce the nanocrystalline Cu layer, a 5 cm diameter planar direct current magnetron system (LAB Line, Kurt J. Lesker, Jefferson Hills, Pennsylvania) was operated at an argon pressure of 4 millitorr and a power of 40 W, yielding a deposition rate of 0.057 nm/s. The predeposition chamber pressure was approximately 10−6 torr and the final thickness of the Cu layer was 103 ± 9 nm.
A standard load frame (Instron 5848, Norwood, Massachusetts) was used for mechanical testing. The specimens were approximately 3 mm wide, with a gauge length of 27 mm. Our goal for the loading treatment was to impart the highest amount of plastic strain possible. To this end, the specimens were loaded with a profile that consisted of a superimposed ramp and triangle wave, as shown in Figs. 1(a) and 1(b). The peak strain, measured by crosshead displacement, slowly rises from 2 to 5%, with a constant 2% strain amplitude. The cellulose acetate remains elastic to strains of >2%, far more than a Cu film can sustain before plastically deforming. This means that during loading, the metal film is deformed past its elastic limit in tension and then plastically until a total 2% strain is reached. Upon unloading, the Cu film will experience an elastic unload, followed by plastic compression until the cellulose acetate is relaxed. Although the cellulose acetate is relatively compliant, it can compress the metal film due to its much greater thickness if the interface remains strong and local anelastic polymer relaxation is limited. This approximates a fully reversing load on the Cu, which is an unusual feature in a tension–tension test geometry. Figure 1(a) shows how the unloading step only released 98.5% of the tensile strain from the prior loading, leading to a slow increase in the peak displacement that helps compensate for creep in the cellulose acetate over time at the elevated temperatures. By contrast, a simple triangular displacement profile would have led to ever diminishing elastic strains. The advantage of the applied loading profile is that it maintains a high elastic strain amplitude in the cellulose acetate, which therefore keeps its ability to apply a compressive load to the metal film. Figures 1(c) and 1(d) show stress and strain data from the composite films for room temperature (20 °C) and 100 °C, respectively. The stress is given as a fraction of the peak stress because the actual load partitioning between the metal and polymer is not known. Attempts to deconvolve the stresses in each component with a simple composite model failed because the properties of the cellulose acetate vary under the influence of cyclic loading and temperature, and these variations in the substrate properties masked the relatively small effect of the Cu layer, which is ∼220 times thinner than the cellulose acetate. Since solving this problem would require a complete description of the temperature-dependent mechanical behavior of the polymer substrate, which is beyond the scope of this work, we leave our data in terms of the fraction of peak stress. The tests were all displacement-controlled, with one set of experiments using a 2% tensile strain, followed by a 1.97% unloading strain, repeated 100 times, at a strain rate of 10−3 s−1. This will be referred to as the “2% strain cycling” condition. A second type of loading profile was also used, but with a 1% tensile strain and 0.985% unload, at a strain rate of 5 × 10⁻⁴ s−1. This will be called the “1% strain cycling” condition in the text that follows.
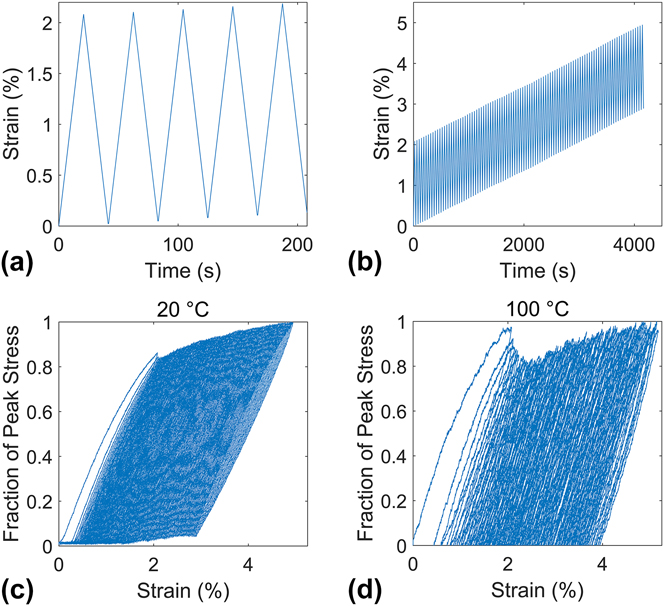
FIG. 1. The 2% strain cycling applied to the cellulose acetate/copper composite, with the first 5 strain cycles shown in (a) and 100 strain cycles shown in (b). The mechanical response is shown for (c) 20 °C and (d) 100 °C testing temperatures.
Crystal orientation maps were collected with transmission Kikuchi diffraction (TKD), which provides the nanometer resolution necessary for such small grains.Reference Trimby20,Reference Keller and Geiss23 This technique is well suited to samples whose thickness exceeds the grain size because the diffraction signal originates from only the bottom several nm of the material.Reference Trimby20,Reference Keller and Geiss23 Improved microscope stability allowed the maps in this work to be much larger (∼106 nm2) than our previous study (∼104 nm2 Ref. Reference Bober, Kumar and Rupert13). The samples were prepared for TKD by dissolving the cellulose acetate with acetone, rinsing in methanol and then isopropyl alcohol, and affixing to TEM grids with adhesive. The free-standing foils were further thinned by ion milling at 2 KeV and 1 mA (Gatan model 691, Pleasanton, California). These relatively low power parameters were selected to avoid damaging or heating the samples. Once loaded into the scanning electron microscope (SEM; FEI SCIOS, FEI, Hillsboro, Oregon), an in-chamber plasma cleaner was used for 90 s to reduce organic contamination prior to scanning.
All orientation maps were collected with a 2 nm step size and post-processed with a standard dilation clean-up using Orientation Imaging Microscopy software package (EDAX, Mahwah, New Jersey). Where error bars are given, they represent the 95% confidence interval based on the population of reconstructed boundaries. These error bars do not capture the uncertainty due to the necessity of reconstructing a grain boundary network from imperfect orientation data, where there are inevitably some pixels that cannot be reliably indexed. These missing pixels are prevalent at grain boundaries in any orientation mapping technique and are especially so when the interaction volume is large relative to the grain size. The total uncertainty for any given measure would therefore be larger than the error bar by an unknown factor, based on the extent of dilation required to reconstruct the boundary network.
TEM was also used to collect images of the microstructure and perform compositional mapping. Bright field imaging was performed on an FEI CM300 (FEI, Hillsboro, Oregon) and a Titan 80-300 (FEI, Hillsboro, Oregon). Electron energy loss spectrometry was performed on a JEOL JEM 2200FS (JEOL, Tokyo, Japan) operated at 200 kV accelerating voltage and equipped with a Schottky field-emission gun and an in-column omega filter.
III. RESULTS AND DISCUSSION
A. Grain coarsening with thermomechanical treatment
Bright field diffraction contrast TEM images, such as those presented in Fig. 2, show that the initial, as-deposited microstructure had a nanocrystalline grain size of 15 nm. High angle annular dark field imaging revealed that the grains were interspersed with even smaller particles of ∼2 nm diameter, primarily located at triple junctions [Fig. 3(a)]. Energy dispersive spectroscopy showed that these particles had high O content [Fig. 3(b)] and were likely a form of copper oxide but also contained traces of Ar trapped during the sputtering process. Such oxide dispersion has been shown to help stabilize grain size via boundary pinning (see, e.g., Ref. Reference Koch, Scattergood, Saber and Kotan24). Since the oxides were formed during deposition, as evidenced by their Ar content, it is reasonable to assume that they contributed to the development of such a fine grain size in otherwise pure Cu films.
FIG. 2. Bright field TEM images of each Cu sample, with each image’s location denoting the thermomechanical process applied. The testing temperature is labeled on the vertical axis and magnitude of cyclic strain on the horizontal axis.
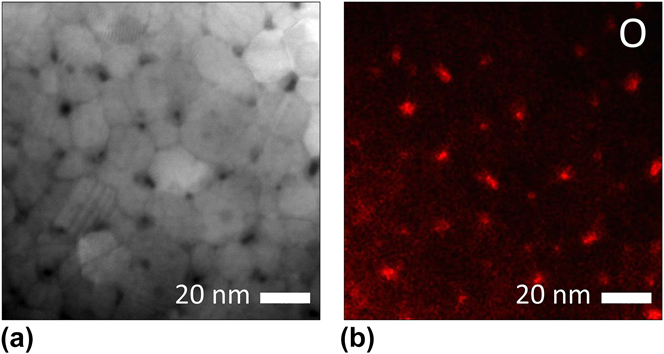
FIG. 3. (a) High-angle annular dark field image of the as-deposited material, showing particles at the grain boundaries. (b) Energy dispersive spectroscopy map of O concentration, which shows that these particles are likely copper oxides.
The effect of thermomechanical processing on the grain size and morphology was assessed with TEM. Bright field images of each processed material are shown in Fig. 2, arranged according to the applied cyclic strain and temperature, but all at the same magnification. For example, the three images in the top row of Fig. 2 show materials that were all heated to 100 °C for 70 min. The difference between these materials is the extent of cyclic strain that they were subjected to while hot. The leftmost material was not strained, while the rightmost material underwent 100 strain cycles with a cyclic strain of 2%. The middle image corresponds to an intermediate level of strain, with a cyclic strain of 1%. From these three data points, it is clear that the application of larger plastic strains led to greater amounts of grain growth. The same trend can be seen in the middle and bottom rows of Fig. 2, which are for materials strained at 60 °C and 20 °C, respectively.
Regarding the role of temperature, the images in the left-hand column of Fig. 2 show that heating the materials to 100 °C was sufficient to cause only minor grain growth in the absence of stress. Likewise, the right-hand column shows that the grain growth which occurred under the influence of cyclic stress was greater at higher temperatures. This raises the question of whether stress and temperature are independent drivers of grain growth, or if there is a synergistic relationship. In the case of independent phenomena, the principle of superposition would apply and the grain growth due to cyclic strain at elevated temperature would be equal to the sum of the grain growth under strain-free annealing and that caused by room temperature straining. Determining if this is the case will help to understand the mechanism behind the evolution of the grain boundary network in nanocrystalline metals during cyclic straining.
Orientation maps provide a convenient means of quantitatively analyzing grain size, while also providing a basis for the measurement of more sophisticated microstructural metrics. Figure 4 shows example orientation maps for the as-deposited material and the materials that were cyclically strained with the 2% condition at several temperatures. In the left column of Fig. 4, each pixel color represents a measured orientation and no post-processing has yet been performed on these maps. The black areas are those locations where no orientation could be determined. Even in these unprocessed maps, many of the same trends from the TEM analysis are also apparent. The first step in quantitatively analyzing these maps was to assign orientations to the black pixels. This was done with a dilation process commonly used in the EBSD literature.Reference Humphreys25 When this was complete, any grain composed of fewer than 4 pixels was eliminated and the dilation repeated. This threshold was a compromise balancing the elimination of mis-indexed points against the retention of small grains. The grain reconstruction used a 2° threshold to separate grains. Grain size was found by first computing the mean grain area, which was then converted to an equivalent circle diameter. These grain size measurements, presented in Fig. 5(a), quantify the trends that were qualitatively shown in the TEM images. This plot also shows that the effects of temperature and strain cycling are synergistic, not independent. The total increase in grain size under the simultaneous action of cyclic strain (2%) and elevated temperature (100 °C) is 83% more than the sum of the two individual processes. The synergy of strain and temperature can also be observed by noticing that the slope of the 2% strain cycling data is much steeper than the uncycled data. The same synergistic effect is observed for the case of cyclic strain at 60 °C. This observation allows classic capillary-driven grain growth to be discounted as the dominant mechanism behind the evolution of our films because stress does not enhance the rate of this form of grain growth.Reference Hillert26 Even though grain boundary curvature is responsible for the thermal instability of nanocrystalline metals and it is evident in the strain-free evolution here, the observed synergistic effect of temperature and strain requires an alternate explanation. Pole figures are not shown because no obvious texture modification accompanied these other changes.
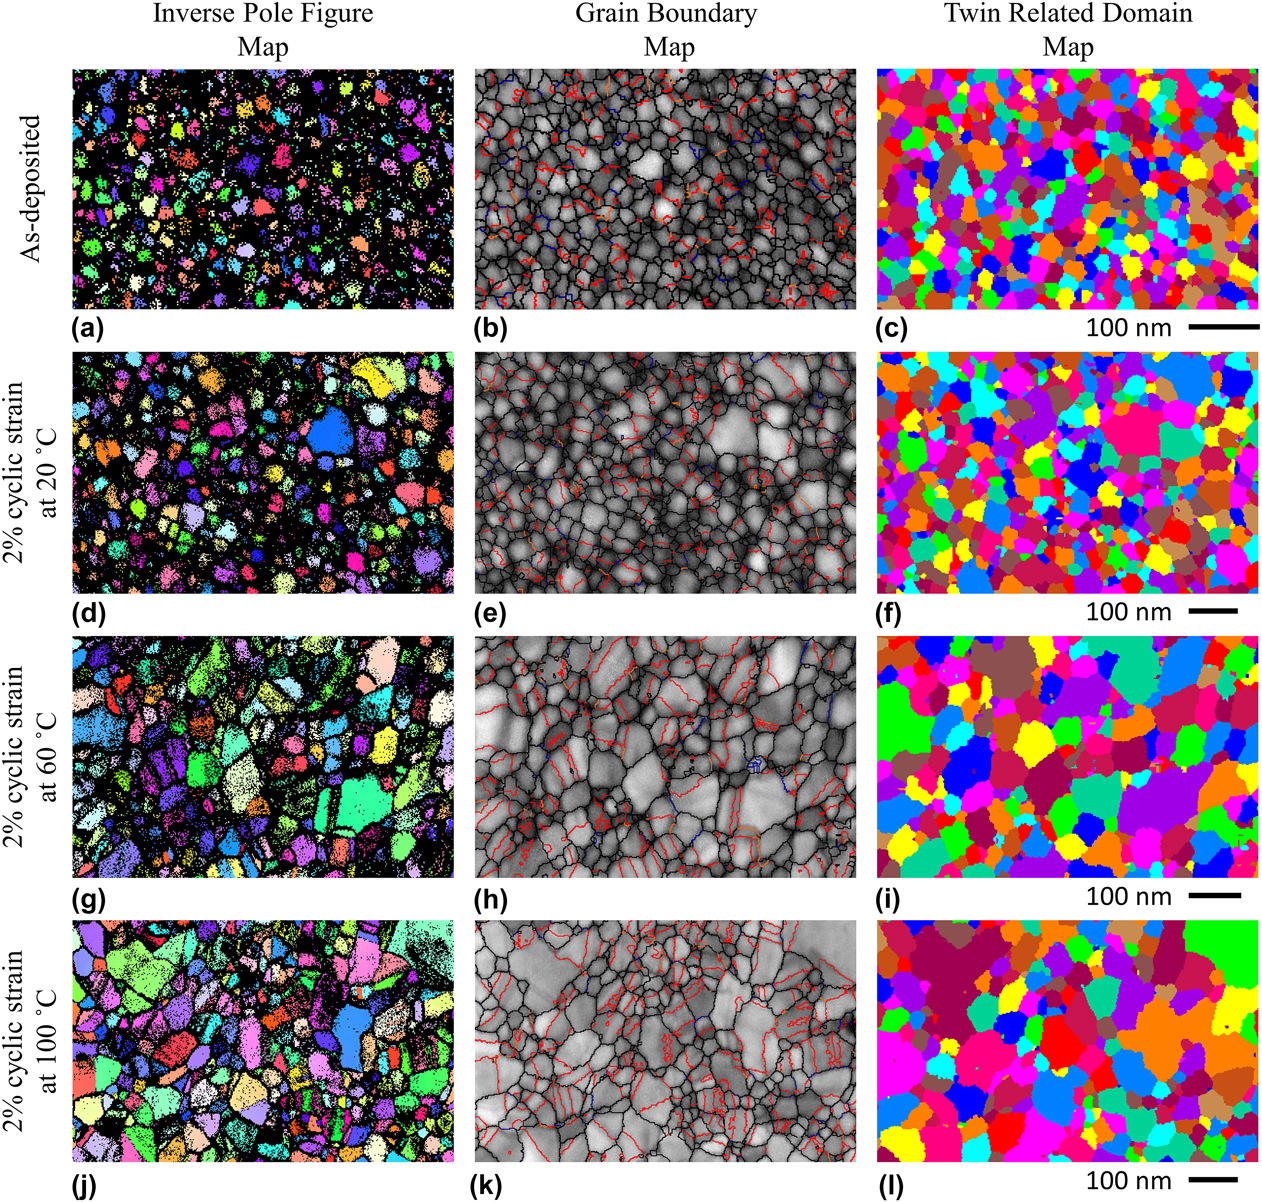
FIG. 4. The unprocessed inverse pole figure maps, grain boundary maps, and TRD maps for each specimen, shown in the left, center, and right columns, respectively. The as-deposited material is shown in parts (a–c), 2% cyclic strain applied at 20 °C in (d–f), 2% cyclic strain applied at 60 °C in (g–i), and 2% cyclic strain applied at 100 °C in (j–l).
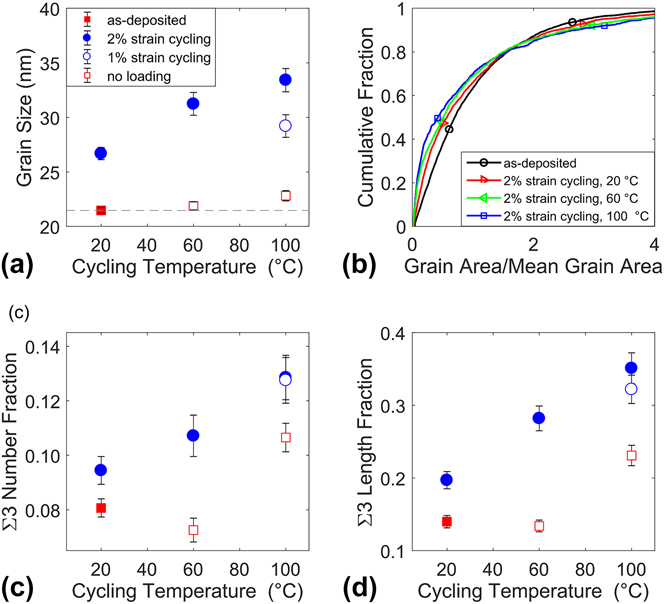
FIG. 5. (a) The effect of cyclic strain and temperature on average grain size. (b) The normalized cumulative distribution functions for grain size of the as-deposited material and those exposed to 2% cyclic strain at several temperatures. (c) The Σ3 number fraction and (d) Σ3 length fraction of each material. Each metric increased noticeably with thermomechanical cycling. Parts (a), (c), and (d) share a common legend.
Another effect of warm cyclic strain was to moderately change the grain size distribution, as shown in Fig. 5(b). In this cumulative distribution plot, the vertical axis displays the fraction of grains smaller than the size listed on the horizontal axis, with the grain size normalized as grain area divided by mean grain area. A perfectly monodisperse grain size, shown by a delta function on a histogram, would appear in this plot as a unit step function centered at 1. Figure 5(b) shows that strain cycling led to a reduced slope around the normalized mean (value of 1), corresponding to a broadened distribution. This can also be observed qualitatively in Figs. 2 and 4.
B. Evolution of grain boundary character
The same set of orientation maps used to calculate grain size can also be used to analyze the types of grain boundaries that make up the grain boundary network. Using the measured grain orientations, each boundary was classified according to the coincident site lattice (CSL) criterion.Reference Grimmer, Bollmann and Warrington27 The middle column of Fig. 4 shows the reconstructed grain boundaries overlaid on the Kikuchi pattern quality. Σ3 boundaries are shown in red, Σ9 boundaries are shown in orange, Σ5, Σ7, and Σ11 boundaries are shown in blue, and all others are shown in black. The relative length and number fraction of various CSL types was then computed to quantify the grain boundary character distribution. The most obvious change was an increase in the fraction of twin boundaries, as presented in Figs. 5(c) and 5(d). This finding is similar in concept to our previous observations in nanocrystalline Ni,Reference Bober, Kumar and Rupert13 although of a very different magnitude. In the present case, the change is roughly 300% of what was reported for Ni. This is most likely due to the larger strains applied here to the Cu, which are ∼5 times larger than what could be applied to the Ni. Of course, the effects of stacking fault energy and homologous temperature cannot be discounted, both of which act alongside the greater strain to favor more evolution in these Cu films. None of the non-Σ3n, low Σ boundaries underwent significant changes. As Figs. 5(c) and 5(d) show, the number and length fraction of twin boundaries both increased with strain cycling. The trends observed for Σ3 fraction are very similar to those seen for grain size. In both cases, the changes were correlated with cyclic strain and temperature. Like grain size, the increase in Σ3 fraction is also found to be caused by a synergistic combination of elevated temperature and strain, with the combined effect being from 20% or 40% larger than the summed individual effects, as measured by number or length fraction, respectively. An unexpected feature of Figs. 5(c) and 5(d) is the small apparent drop in the Σ3 fraction caused by annealing at 60 °C in the absence of strain. We are unable to provide an explanation for this observation.
This observed temperature dependence helps narrow the list of possible evolution mechanisms because it argues against deformation twinning. While a novel form of deformation twinning has been proposed for nanocrystalline metals,Reference Zhu, Liao and Wu28 it shares the same temperature dependence as conventional deformation twinning (i.e., it becomes easier at lower temperatures). The apparent inactivity of this mechanism is also supported by the observation that twin fraction and grain size increase in concert. Were deformation twinning prevalent, then the grain size would be expected to drop as existing grains became subdivided.
The Σ3 number and length fraction metrics reported in Fig. 5 convey subtly different information. An increase in number fraction indicates that either more twins were added to the microstructure or that other boundaries were preferentially removed during the grain growth. In addition to these possibilities, the length fraction is also sensitive to the relative length of Σ3s compared to other boundaries. These metrics can be combined to give a measure of the average twin length by simply dividing the length fraction by the number fraction, with the resulting data presented in Fig. 6(a). The average twin length is found to be 70–170% larger than the average length of other boundaries. This metric increases with thermomechanical treatment, presumably because twins have lower energy than other boundary types.Reference Schuh, Kumar and King29
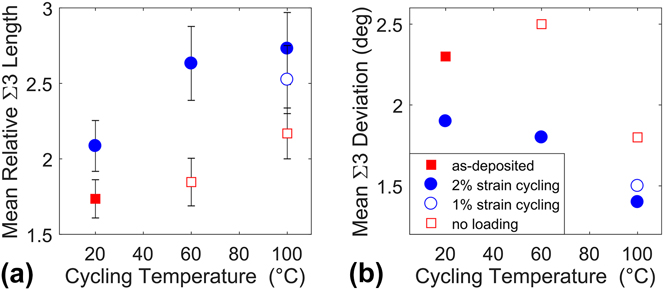
FIG. 6. (a) The mean length of Σ3 boundaries, nondimensionalized relative to the mean length of all other boundaries in each material, and thus a unit-less quantity. In every case, Σ3 boundaries were longer than average, with the amount increasing with thermomechanical cycling. (b) The mean deviation of the Σ3 boundaries from perfect CSL misorientation, which decreased with thermomechanical cycling.
Cyclic strain also caused changes in the Σ3 boundaries’ deviation from the ideal CSL misorientation. This misorientation is the same one which is compared against the Brandon criterion to determine CSL categorization.Reference Brandon30 Even within the population of interfaces that are counted as Σ3 boundaries, there exists a distribution of deviations from the perfect twin. Figure 6(b) shows that the 2% cycling treatment at 100 °C caused the length-weighted mean deviation from a perfect twin misorientation to drop to 1.4°, down from 2.3° in the as-deposited material. A similar change was observed in the number-weighted mean CSL deviation, but these data are not presented here for brevity. The decrease in deviation from perfect misorientation could be caused by the lengthening or creation of coherent twins, or alternately by the shortening/destruction of incoherent segments. In addition, this result could occur through a change in the misorientation of existing Σ3 boundaries. The distribution of deviations from the ideal CSL was also examined, but no clear trends were observed beyond the shifting mean. It is important to note that the CSL framework only deals with the misorientation of the boundary, while grain boundary normal does not factor into the description of the grain boundary character. This is especially important to note for twin boundaries, as coherent and incoherent twins have very different energies and behaviors (see, e.g., the work of LaGrange et al.Reference LaGrange, Reed, Wall, Mason, Barbee and Kumar12). However, reliable grain boundary normal information is not available here due to the fact that TKD gives a two-dimensional view of the three-dimensional grain structure, and even the trace is difficult to determine accurately at these nanometric length scales.
C. Evolution of grain boundary network topology
While the aggregate statistics presented above are evidence of significant changes in the grain boundary network by themselves, the longer-range characteristics of the network can also help explain the physical processes at work. To provide metrics for tracking such features, the concept of TRDs can be useful.Reference Lind, Li and Kumar31,Reference Reed, Kumar, Minich and Rudd32 TRDs are collections of grains mutually connected by twin boundaries.Reference Reed and Kumar33 Most simply, TRDs can be quantified by their size, as measured by the number of twinned grains they contain. These clusters are shown in the right-most column of Fig. 4, with each TRD assigned a distinguishing color. Figure 7 plots the root-mean-squared (RMS) TRD size, which weighs each TRD by its number of members. The size of these domains increased in concert with the twin fraction, as temperature and cyclic strain were increased. Detailed analysis of TRDs in conventional grain boundary engineered metals showed a similar connection between TRD size and twin fraction.Reference Bober, Lind, Mulay, Rupert and Kumar19 The increase in RMS TRD size can be further broken down by looking at the distribution of TRD sizes, as shown in Fig. 8. The fraction of 1-member TRDs, or grains without twin boundaries, decreases rapidly with strain cycling, which can either result from twin nucleation or the removal of untwinned grains. The fraction of TRDs with sizes 2 and 3, the next most populous types, is shown in Figs. 8(b) and 8(c), respectively. Perhaps most surprising is that the fraction of grains in 3-member TRDs experienced a much faster increase than those in 2-member TRDS, where any change is small and roughly of the same scale as the error bars on the data. This could occur if 1-member TRDs were bisected by new twins (each bounded by two twin boundaries) and jumped directly to being 3-member TRDs.
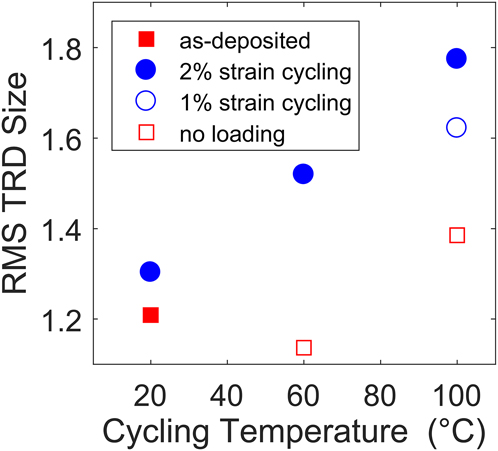
FIG. 7. The RMS TRD size for each material. The increase in this parameter with cycling indicates that more grains became part of larger TRDs. Error bars are smaller than symbols and thus not able to be seen.
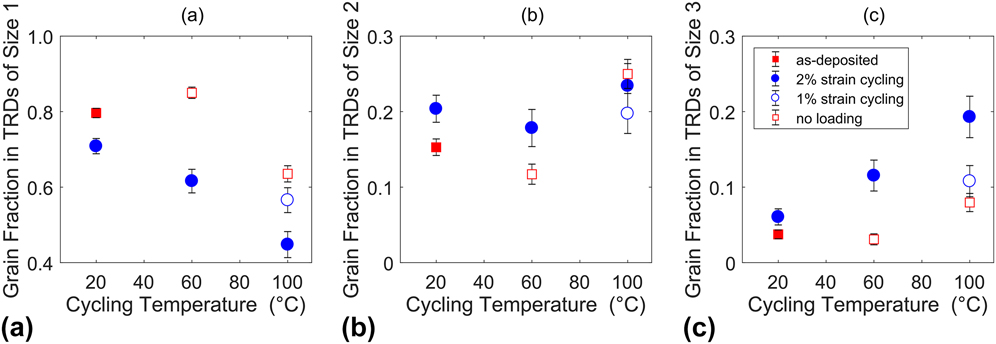
FIG. 8. The number fraction of grains in TRDs of (a) size 1, (b) size 2, and (c) size 3.
This observation also provides a point of comparison for the expected behavior of rotation-induced twinning, which is another of the hypothesized deformation mechanisms in the literature.Reference Panzarino, Pan and Rupert34 In this theory, neighboring nanocrystalline grains can rotate into low energy, low Σ configurations. It has been proposed that these rotations could cause low angle boundaries to disappear, facilitating grain growth by coalescenceReference Panzarino, Ramos and Rupert15,Reference Moldovan, Wolf, Phillpot and Haslam35 and also that twins may form when boundaries may rotate into a Σ3 relationship.Reference Panzarino, Pan and Rupert34 Panzarino et al.Reference Panzarino, Pan and Rupert34 observed this effect in molecular dynamics simulations that were conceptually similar to our experiments, though with a smaller grain size of ∼5 nm. There is a specific probability that two neighboring grains would have the appropriate orientations to rotate into a twin relation, though the odds cannot be calculated because the relevant misorientation space has not been fully described.Reference Panzarino, Pan and Rupert34 Assuming independent initial orientations, there is an exponentially smaller chance that a third grain could also rotate to join such a TRD. This is contradictory to our observations on TRD size and indicates that rotation-induced twinning was not the operative mechanism here. Of course, this statistical argument does not hold if another initial orientation correlation or long-range phenomenon dominates the process.
The internal structure of TRDs can also be assessed for changes by observing the frequency of certain orientation correlations between second nearest neighbors within a TRD, termed the probability of repeated twinning.Reference Bober, Lind, Mulay, Rupert and Kumar19,Reference Lin36 To understand this metric, consider three grains connected by two twin boundaries. If the two twin boundaries are repeats of the same twin variant, then two of the three orientations will have a Σ1 relationship. If the twinning variants are not repeats, then a Σ9 relationship must exist. A graph representation for this is shown in Fig. 9(a), with grains represented by the nodes (circles) and twin boundaries by the edges (straight lines). In Fig. 9(a), twin variants are distinguished by letters and each unique orientation assigned a number. This is a simple case of the more general theory of Σ3n related domains described by Reed and Kumar.Reference Reed and Kumar33 The probability of repeated twinning is found by considering the second nearest neighbors within every TRD and dividing the number of Σ1 relationships by the sum of the Σ1 and Σ9 relationships. For illustration, a 4-member TRD schematic with a probability of repeated twinning of 0.33 is shown in Fig. 9(b). As a real-world example, nanotwinned Cu films such as those studied by Lu et al.Reference Lu, Chen, Huang and Lu37 would have a probability of repeated twinning approaching 1 because nearly every second-neighbor within a columnar TRD has the same orientation. The probability of repeated twinning for all samples is plotted in Fig. 9(c), with only 3-member TRDs counted. One observation from this figure is that the probability of repeated twinning appears to drop with mechanical cycling, serving as additional evidence that deformation twinning is not the primary driver behind the increase in Σ3 fraction. These data support the prior observations of (i) a strong temperature dependence and (ii) slight grain coarsening which also rules out deformation twinning. Unlike most of the other trends observed, there is no clear temperature dependence in Fig. 9. Interestingly, all of the probabilities of repeated twinning (0.64–0.93) were much higher than those seen in the 3-member TRDs of conventional, coarse-grained Cu which form during recrystallization 0.3.Reference Bober, Lind, Mulay, Rupert and Kumar19

FIG. 9. (a) Schematic of repeated versus nonrepeated twinning. (b) Schematic of a 4-member TRD with a probability of repeated twinning of 0.33. In both (a) and (b), unique orientations are numbered and twin variants assigned letters ‘A’ or ‘B.’ (c) The probability of repeated twinning for 3-member TRDs.
D. Discussion of shear-coupled grain boundary motion as a possible mechanism
Shear-coupled grain boundary motion is a remaining possible mechanism to explain the observed grain size and grain boundary character evolution. In this phenomenon, shear stress causes a combination of normal and perpendicular motion of a grain boundary.Reference Gianola, Van Petegem, Legros, Brandstetter, Van Swygenhoven and Hemker38–Reference Winning, Gottstein and Shvindlerman40 Such a mechanism has been observed to occur in stressed bicrystals at high temperaturesReference Winning, Gottstein and Shvindlerman40,Reference Gorkaya, Molodov and Gottstein41 and has also been implicated in several prior studies of deformation-related nanocrystalline grain growth.Reference Padilla and Boyce18,Reference Zhang, Weertman and Eastman42–Reference Legros, Gianola and Hemker44 Legros et al.Reference Legros, Gianola and Hemker44 documented this mechanism in nanocrystalline Al, using an in situ TEM experiment to observe rapid grain boundary motion near an opening crack tip.Reference Legros, Gianola and Hemker44 Rupert et al.Reference Rupert, Gianola, Gan and Hemker43 geometrically separated the areas of maximum stress and strain, finding that the maximum amount of grain growth occurred at the location of maximum stress, an observation that is consistent with a shear coupling mechanism. Interestingly, stress-driven grain boundary motion can reverse direction under continuous loading because of fluctuating grain boundary structure and bifurcated shear coupling factors.Reference Legros, Gianola and Hemker44,Reference Thomas, Chen, Han, Purohit and Srolovitz45 A related phenomenon appears to be at work during the fatigue loading of nanocrystalline specimens, where marked increases in grain size has been observed.Reference Padilla and Boyce18 At the extreme, this coarsening can lead to very large grains and initiate failure.Reference Furnish, Mehta, Van Campen, Bufford, Hattar and Boyce46 Inhomogeneous dislocation storage may also become important once the grains become large enough.Reference Gianola, Van Petegem, Legros, Brandstetter, Van Swygenhoven and Hemker38
The observed grain growth in this study depended on the accumulated strain. In a material with weak strain hardening like nanocrystalline Cu, high accumulated strain does not always translate directly into high stress. However, this observation can be reconciled by considering how the total plastic strain influences the chance of any individual grain boundary experiencing a high stress. At high macroscopic stress but at low strain, some grains will remain at low stress because of polycrystalline inhomogeneity. As strain increases, plastic deformation will cause different grains to become highly stressed. The extremely small grain size means that the motion of even a single dislocation through the crystal can cause large local strains and changes in stress.Reference Bitzek, Derlet, Anderson and Van Swygenhoven47 Consequently, large global strains on the sample increase the chance that any given grain boundary will, at least temporarily, experience a stress sufficient to drive significant boundary migration. A similar argument applies to cycle count because accumulated plastic strain will cause a different stress distribution during each loading and unloading sequence. This is an important point because cycle count has been observed to correlate with nanocrystalline grain growth.Reference Bober, Kumar and Rupert13,Reference Padilla and Boyce18 Interestingly, mechanically induced grain growth can also reduce the flow stress, which in turn would reduce the driver for further grain growth. Such a mechanism may be responsible for a microstructural rate of change that diminishes with increasing accumulated strain. Such a trend is supported by Figs. 5 and 6, which show the 1% cyclic strain case caused much more than half as much microstructural evolution as the 2% cyclic strain case, despite nominally accumulating half the plastic strain.
Temperature dependence is another point to be considered in evaluating the potential role of shear-coupled motion. Winning et al.Reference Winning, Gottstein and Shvindlerman40 showed that the velocity of grain boundaries propelled by a shear stress can be increased by several orders of magnitude in the presence of a modest increase in temperature because shear-coupled grain boundary motion requires dislocation climb and vacancy diffusion.Reference Winning, Gottstein and Shvindlerman40 While the exact change in grain boundary mobility is dependent on local atomic structure and therefore grain boundary character, an Arrhenius-type relation generally applies.Reference Gorkaya, Molodov and Gottstein41 For example, the measured activation enthalpies in Al bicrystals are all on the order of 1 eV,Reference Gorkaya, Molodov and Gottstein41 denoting a strong temperature dependence. This indicates that shear-coupled grain boundary motion should generally lead to a positive correlation between temperature and grain growth. An exception has been observed in the case of very pure nanocrystalline Cu, where indentation-induced grain growth was greater at cryogenic temperature than at ambient.Reference Zhang, Weertman and Eastman42 However, the materials in the present study are relatively impure, containing nanoscale second phase pinning particles which will increase the role of thermal activation.Reference Lücke and Stüwe48,Reference Gore, Grujicic, Olson and Cohen49 Unpinning from these particles may also explain the broadening of the grain size distribution, with grains whose boundaries become unpinned being more susceptible to further growth.
Shear-coupled grain boundary motion also provides an explanation for the increase in twinning under warm cyclic strain conditions. The propensity of a moving boundary to produce twinning has been well established, with the mechanism thought to be either growth accidentsReference Carpenter and Tamura50,Reference Gleiter51 or stacking fault packets.Reference Dash and Brown52 While these classic results are based on boundaries driven by plastic strain energy or capillary forces, we expect that similar phenomena can occur for stress-driven boundary motion in nanocrystalline metals. An et al.Reference An, Lin, Wu and Zhang17 presented evidence for the formation of twins along stress-driven boundaries, describing it as “mechanically driven annealing twinning.” We suggest the more descriptive phrase ‘shear-coupled boundary migration twinning.’ Although less established in the literature than the capillary driven analog, such a mechanism is consistent with the twinning behavior we have observed. An increase in either temperature or strain would cause an increase in shear-coupled boundary motion, with a combined synergistic effect. Such increased boundary motion provides greater opportunity for twinning and agrees with all of the evolution trends observed in this study. On the other hand, many other potential mechanisms fail. Assuming the temperature dependence of the twinning probability per boundary migration distance is similar to the case of capillary driven boundaries, any effect over the temperature range studied would be negligible for this mechanism.Reference Pande, Imam and Rath53 The stacking fault packet model would explain the tendency for 3-member TRDs to be formed, as the new twins would bisect existing grains. However, this would be at odds with the tendency for the probability of repeated twinning to drop as the number of twins increased. The growth accident model more readily explains the observed drop in the probability of repeated twinning because the twin variants would be selected by the local boundary curvature, which is relatively unconstrained. From the perspective of growth accident formed twins, the high fraction of 3-member TRDs implies that a boundary is likely to undergo multiple twinning once unpinned. However, given that there are large error bars on Fig. 9, this inference should be regarded as preliminary.
In addition to the nucleation of twins along migrating boundaries, shear-coupled motion could also act to increase the twin content by lengthening pre-existing twins. These twins could be dragged by connecting boundaries that are themselves driven by the shear stress. The new area created along the twin boundary requires less energy than had it been a random high angle boundary, so extending the twin is the more energetically favorable event. A related mechanism through which shear-coupled motion may act to increase the twin fraction is the preferential removal of less stable boundaries.Reference Frøseth, Van Swygenhoven and Derlet54 A more mobile grain boundary (as compared to the stable twin) may be swept across a grain and into another boundary, removing itself from the microstructure. A similar type of preferential survival is thought to increase twin fraction during conventional grain growth.Reference Form, Gindraux and Mlyncar55,Reference Gindraux and Form56 Both mechanisms would be expected to show a synergistic effect with temperature. Taking these observations together, shear-coupled boundary migration twinning does not suffer the inconsistencies that were noted for the other hypotheses available in the literature. Therefore, we consider it the most probable explanation for the grain size and grain boundary network evolution observed here.
IV. CONCLUSIONS
The magnitude of grain growth in cyclically strained nanocrystalline Cu was shown to depend strongly on cyclic strain amplitude and temperature, with a synergistic effect when applied together. A similar increasing trend was observed for the number and length fractions of Σ3 boundaries, which was accompanied by an increase in the relative length of Σ3s and a decrease in their deviation from the perfect CSL configuration. The TRDs that formed favored 3-member configurations over 2-member ones, as evidenced by the large change in the former and the negligible change in the latter, with a probability of repeated twinning that was high in all samples (>64%) but decreased with thermomechanical treatment. The observation that higher strains cause more evolution of the grain boundary network complements prior work showing that the number of stress cycles increases the extent of grain growth and twinning. Of the various possible mechanisms available in the existing literature, mechanically driven grain boundary motion with coupled shear and normal movement provides the most complete explanation for the observations presented here. The results shown here are relevant to nanocrystalline metal processing, understanding possible changes during the service life of advanced nanostructured materials, and improving future means for nanocrystalline grain boundary engineering.
ACKNOWLEDGMENTS
This work was supported by the National Science Foundation through a CAREER Award No. DMR-1255305. The research was partly performed under the auspices of the U.S. Department of Energy by Lawrence Livermore National Laboratory under Contract DE-AC52-07NA27344. D.B.B. and M.K. were supported by the U.S. Department of Energy (DOE), Office of Basic Energy Sciences, Division of Materials Science and Engineering under FWP# SCW0939. D.B.B. also acknowledges support of the Livermore Graduate Scholar Program at Lawrence Livermore National Laboratory.


 Open access