


Vitamin D is essential throughout human life and its role in health and disease, especially in Ca homeostasis and bone health, has been well documented(Reference Bouillon and Suda1–Reference Bouillon4). Vitamin D also plays a role in protection from non-skeletal diseases including type 1 diabetes, multiple sclerosis, rheumatoid arthritis, immune dysfunction, inflammation, cancers, hypertension and CVD(Reference Rosen, Adams and Bikle5,Reference Zittermann, Pilz and Hoffmann6) . In pregnancy, the vitamin D pool of the fetus is entirely dependent on that of the mother. Vitamin D readily crosses the human placenta and to ensure mineralisation of the fetal skeleton, maternal concentrations of vitamin D double or triple early in pregnancy(Reference Dror and Allen7). Primary physicians are not recommended to perform population-based screening for vitamin D deficiency, but to requests tests for patients with risk such as in case of osteoporosis, chronic kidney disease, malabsorption, hyperparathyroidism, some infections and obesity(8).
The main source of vitamin D in humans is skin synthesis of vitamin D3 from 7-dehydrocholesterol using UVB irradiation (wavelength 290–320 nm). The nutritional source of vitamin D is predominantly oily fish; however, this is normally low in comparison with UVB-driven synthesis in skin. The active constituents of vitamin D, 1,25-dihydroxyvitamin D2 and 1,25-dihydroxyvitamin D3, are synthesised from vitamins D2 and D3, respectively. The intermediate compound, 25-hydroxyvitamin D (25(OH)D), is measured in humans to assess overall vitamin D status (for reviews, see Bouillon(Reference Bouillon4) and Göring(Reference Göring9)).
Determinants of vitamin D status in individuals include sun exposure, dietary intake, genetic factors, skin pigmentation, lifestyle, health status, and sociodemographic and anthropometric factors(Reference Liu, Baylin and Levy10–Reference Touvier, Deschasaux and Montourcy13). Many of these reported associations are based on observational studies and are prone to confounding, reverse causation and various biases that generate associations despite statistical adjustments. Recently, the more robust technique of Mendelian randomisation(Reference Davey Smith and Hemani14,Reference Gupta, Walia and Sachdeva15) has been employed using the genetic marker rs4988235 as an instrument for dairy product consumption, to show that Caucasians of European descent that consume more dairy products have higher levels of serum 25(OH)D(Reference Alharbi and El-Sohemy16). In modern times, many dairy products are fortified with vitamin D, which may explain the higher amount of vitamin D in the serum of study subjects genetically predicted to consume more dairy products. Milk is also a rich but non-exclusive source of other micronutrients including vitamin B12 (vitB12)(Reference Van Rossum, Fransen and Verkaik-Kloosterman17).
In Eurasia, the dominant genetic cause of lactase persistence (LP) is the result of a C → T transition 13 910 bases upstream of the lactase gene (LCT), resulting in lifetime expression of lactase phlorizin hydrolase. The enzyme cleaves the milk sugar lactose into glucose and galactose and consequently prevents lactose build up in the gut that would otherwise cause malabsorption. This mutation has been strongly selected for in humans living in the Caucasus at the time of dairy animal domestication and rapidly spread to regions of higher latitude, which have limited UVB exposure, most likely at the time when pastoralism and animal husbandry became more widely practised(Reference Itan, Powell and Beaumont18). The ability to digest lactose allows unfermented milk to be consumed to obtain proteins, fat, minerals and vitamins, without suffering symptoms of malabsorption such as diarrhoea. Milk from bovine animals farmed in industrial countries contains little natural vitamin D(Reference Schmid and Walther19), although natural vitamin D levels in animal milk are likely to have been higher at the time when all animals were kept outdoors throughout the year.
Sorthe & Moghaddam(Reference Sorthe and Moghaddam20) recently reported that the paradoxical correlation between latitude, which is inversely correlated with UVB exposure, and mean serum vitamin D concentration in European populations may be related to the LP phenotype frequency(Reference Sorthe and Moghaddam20). The primary objective of the present study was to determine whether in a single population, a difference in vitamin D status could be observed based on genetic LP status and, if so, to determine its significance in relation to extent of UVB exposure by determining whether any differences in individuals with and without the genetic LP variant would diminish in summer months. To look at vitamin D status in one population and to stratify through a genetic marker would control for other potential confounders such as oily fish consumption, access to healthcare, time spent outdoors, sunscreen use, clothing worn outdoors, body composition and socio-economic status. To determine if differences observed due to LP status were wholly contributed to milk consumption, analysis of another major micronutrient in milk was performed, namely vitB12, which is often measured in human serum in health assessments.
Methods
Fürst Medisinsk Laboratorium (www.furst.no) is an accredited medical diagnostic laboratory that provides diagnostic services to primary care physicians in Norway. I retrieved data from the laboratory's database on the three diagnostic test results that have been used in the present analysis, namely serum 25(OH)D concentration, serum vitB12 concentration and the Eurasian LP variant rs4988235 (T), using Microsoft SQL management studio 2012 (Microsoft Cooperation). In the first step, serum 25(OH)D test results (n 3 136 065) and serum vitB12 test results (n 4 053 944) for all individuals that have been tested between 1 January 2011 and 31 December 2017 were in turn retrieved, along with test date, sex, age at time of micronutrient test and citizens' unique identification number (FNR) into a temporary instantiated SQL table. Additional clinical or lifestyle information was not available from this diagnostic database. In the second step, using FNR and sample date, first micronutrient test results of individuals were kept and subsequent test results from individuals, if any, were discarded. At this point, data from individuals under the age of 10 years were excluded as well as all results from individuals with >150 nm-25(OH)D or 600 pm-vitB12, to minimise the effect of vitamin supplements. Consequently, individuals are only present once in the vitamin D group (n 1 158 134) and only once in the vitB12 group (n 1 344 458). In the third step, FNR was used to extract and link genetic LP variant result from the same diagnostic database, using rs 4988235 SNP test results, independent of time of SNP testing (n 112 594 and n 120 292 for 25(OH)D study and vitB12 study, respectively). In 90 % of cases, rs4988235 SNP for LP would have been tested only once for the study subjects. Results for all individuals with a micronutrient test result but without a genetic LP test result were discarded. SQL instantiation in tempdb enabled the use of FNR to link patient results without retrieving any personal identifiers in the final output. Micronutrient test dates were converted to week number and average number of daylight hours on every study subject's micronutrient test week was used as a proxy for UVB exposure at time of micronutrient testing using 2015 daylight hours from the city of Molde at location 62·7372°N, 7·1607°E using the website www.timanddate.com. The project was approved by the Regional Committees for Medical and Health Research Ethics(21), application number 2017/1848.
Statistical analyses including calculations of mean, standard error, median, variance, effect size, comparison of means and variances, univariate and multiple regression analysis, as well as plotting charts were performed using The R Project for Statistical Computing version 3.4.1 (2017-06-30) and RStudio version 1.1.383. Two-sample Student's t test was used to compare means, and the F test was used to compare variances. Regression of outcome (serum micronutrient concentration) on exposure (genetic LP status) was performed by conversion of the presence of the LP rs4988235 T-allele into a discrete value and by conditioning on the discrete variable, sex, and on continuous variables, age, daylight hours and a potential interaction rs4988235 T-allele × sex. For regression analyses, daylight hours were shifted by 4 weeks to account for the lag between the daylight hours period and vitamin D and B12 concentration periods (Figs 1 and 3). For graphical representations of data, patients were stratified according to rs4988235 (T) allele copy number whenever copy number was informative, such as analysis of T-allele dose–response (Figs 1(a), (c) and 3(c)). Otherwise, as in comparing means and P values, patients were stratified according to genetic LP status (CT/TT v. CC). For clarity in graphical plots, study patients were grouped according to week number of micronutrient test starting at 1 January. Because of large sample size and consequent small P values, Cohen's d coefficient was used to verify the effect size of the independent variables. Effect sizes were described as negligible (d < 0·2), small (d = 0·2–0·5), medium (d = 0·5–0·8) and large (d > 0·8) to describe <58, 58–69, 69–79 and >79 percentiles, respectively, of mean outcome in the control group (e.g. individuals without genetic LP variant) who would be above (or in case of vitB12, below) the mean of the outcome in the experimental group (individuals with genetic LP variant).

Fig. 1. Serum 25-hydroxyvitamin D (25(OH)D) concentration in individuals with genetic lactase persistence (LP) (rs4988235) test results. (a) Serum 25(OH)D concentration stratified by week of micronutrient measurement and LP rs4988235 T-allele copy number. Values are means, with standard errors represented by vertical bars. -●-, CC; -▲-, CT; -![]() -, TT. (b) Volcano plot showing –log10(P) v. log2(fold-change) in 25(OH)D) concentration in CC v. CT/TT individuals in all 52 weeks. ●, Winter; ▲, spring; ○, summer; Δ, autumn. (c) Number of individuals analysed (bar chart) stratified by week number and rs4988235 T-allele copy number. ■, CC;
-, TT. (b) Volcano plot showing –log10(P) v. log2(fold-change) in 25(OH)D) concentration in CC v. CT/TT individuals in all 52 weeks. ●, Winter; ▲, spring; ○, summer; Δ, autumn. (c) Number of individuals analysed (bar chart) stratified by week number and rs4988235 T-allele copy number. ■, CC; ![]() , CT;
, CT; ![]() , TT; line shows percentage of study subjects with at least one rs4988235 T-allele. (d) Mean daylight hours throughout the year as a proxy for UVB exposure. The year is shown starting with the week of the vernal equinox and seasons are marked with vertical dotted lines.
, TT; line shows percentage of study subjects with at least one rs4988235 T-allele. (d) Mean daylight hours throughout the year as a proxy for UVB exposure. The year is shown starting with the week of the vernal equinox and seasons are marked with vertical dotted lines.
Results
Patient test result retrieval from January 2011 to December 2017 led to the inclusion of 112 594 individuals for serum 25(OH)D analysis and 120 292 for serum vitB12 analysis. Median ages of men and women, and of different genotype groups, were the same (Table 1), although more women (66–67 %) than men were present in the study population (Table 1). Variances for each micronutrient concentration stratified according to sex and genotype are shown in Table 1. The median ages of study subjects were 32·4 (25th, 75th percentiles 21·8, 46·6) and 32·2 (25th, 75th percentiles 21·7, 46·4) years in the 25(OH)D and vitB12 study subjects, respectively. The variance between the compared groups was statistically different (P < 0·05); however, the values were not logarithmically transformed as the ratio of variances was never greater than 1·1 and logarithmic transformation did not alter statistical differences and effect size (data not shown). Median micronutrient concentrations for serum 25(OH)D and serum vitB12 were 63 (25th, 75th percentiles 44, 82) nm and 302 (25th, 75th percentiles 244, 376) pm, respectively.
Table 1. Summary of study subjects' micronutrient measurements (25-hydroxyvitamin D, nm; vitamin B12, pm), demographics and genotypes

Mean serum 25(OH)D was consistently higher in individuals with a genetic LP variant (CT or TT), whilst mean serum vitB12 was generally lower in individuals with a genetic LP variant, as described in detail below. Mean serum 25(OH)D was higher in women than in men (66·6 v. 59·3 nm; P < 2·2 × 10−16), although the effect size was small (d = 0·27; 95% CI 0·26, 0·28).
Since UVB exposure is one of the main determinants of vitamin D concentration in humans, I analysed mean serum 25(OH)D concentration according to week in the year when the micronutrient test was performed (Fig. 1). Number of hours of daylight per d was used as an indirect relative measure of UVB exposure (Figs 1(d) and 3(d)). Mean serum 25(OH)D peaked in summer (week 32), 4–6 weeks after the week with the longest daylight hours (Fig. 1(a)). Persons with one or two copies of the LP rs4988235 (T) allele had markedly higher concentration of serum 25(OH)D than those without (P < 10−12 for all data points). Interestingly, this difference did not decrease in summer and in fact seemed more pronounced in summer and autumn (Fig. 1(b)). Stratification of individuals according to LP rs4988235 (T) allele copy number showed a non-linear dose–response of the rs4988235 (T) allele (P < 2 × 10⁻¹⁶; Fig. 1(a)). Throughout the year, the percentage of rs4988235 (T) allele in the study subjects did not vary noticeably and approximated to 79 %, despite fewer people seeking health care in Easter week, summer months and Christmas/Gregorian new year periods (Figs 1(c) and 3(c)). Women had higher mean serum 25(OH)D concentration than men (Fig. 2) and stratification according to genetic LP status showed that the effect size of sex on serum 25(OH)D in individuals with a genetic LP variant (d = 0·3; 95% CI 0·29, 0·32) was greater than that in genetically determined lactase non-persistent individuals, which was negligible (d = 0·11; 95% CI 0·08, 0·013; Fig. 2(a)).

Fig. 2. Serum 25-hydroxyvitamin D (25(OH)D) concentration stratified by genetic lactase persistence (LP) status, sex and time of year. (a) Serum 25(OH)D concentration in women (▲, Δ) and men ( ■, □) with genetic LP (CT/TT, Δ, ■) and lactase non-persistence (CC, ▲, □) variants. Values are means, with standard errors represented by vertical bars. The year is shown starting with the week of the vernal equinox. (b) Volcano plot showing –log10(P) v. log2(fold change) in 25(OH)D) concentration due to sex in the LP sub-population. ●, Winter; ▲, spring; ○, summer; Δ, autumn.

Fig. 3. Serum vitamin B12 (vitB12) concentration in individuals with genetic lactase persistence (LP) (rs4988235) test results. (a) Serum vitB12 concentration stratified by week of micronutrient measurement and LP rs4988235 T-allele. Values are means, with standard errors represented by vertical bars. -●-, CC; -![]() -, CT/TT. (b) Volcano plot showing –log10(P) v. log2(fold change) in vitB12 concentration in CC v. CT/TT individuals in all 52 weeks. ●, Winter; ▲, spring; ○, summer; Δ, autumn. (c) Number of individuals analysed (bar chart) stratified by week number and rs4988235. ■, CC;
-, CT/TT. (b) Volcano plot showing –log10(P) v. log2(fold change) in vitB12 concentration in CC v. CT/TT individuals in all 52 weeks. ●, Winter; ▲, spring; ○, summer; Δ, autumn. (c) Number of individuals analysed (bar chart) stratified by week number and rs4988235. ■, CC; ![]() , CT;
, CT; ![]() , TT; line shows percentage of study subjects with at least one rs4988235 T-allele. (d) Mean daylight hours throughout the year as a proxy for UVB exposure. The year is shown starting with the week of the vernal equinox and seasons are marked with vertical dotted lines.
, TT; line shows percentage of study subjects with at least one rs4988235 T-allele. (d) Mean daylight hours throughout the year as a proxy for UVB exposure. The year is shown starting with the week of the vernal equinox and seasons are marked with vertical dotted lines.
It has been shown that rs4988235 (T) predicts dairy product consumption(Reference Alharbi and El-Sohemy16,Reference Bergholdt, Nordestgaard and Ellervik22–Reference Obermayer-Pietsch, Bonelli and Walter25) . In Norway, some dairy products, such as widely consumed low-fat milk, milk sent to schools, milks soured with culture and margarines, are now commonly fortified with vitamin D(26). I wanted to determine if consuming dairy products could explain some of the observations in the present study. Hence, I looked at concentrations of the micronutrient vitB12, which is naturally abundant in milk, although vitB12 is not exclusively acquired from dairy products. In contrast to 25(OH)D, serum vitB12 concentrations were lower in individuals with a genetic LP variant compared with genetically determined lactase non-persistent individuals (P < 2 × 10⁻¹⁶; Fig. 3(a)). There was no observable seasonal pattern in this difference (Fig. 3(b)), although in both genetically determined LP and lactase non-persistent groups, serum vitB12 concentration dropped in early summer (Fig. 3(a)). The effect size of the rs4988235 (T) allele on serum vitB12 was negligible to small (d = 0 to 0·3; Fig. 4). Conversely, the effect size of the rs4988235 (T) allele on 25(OH)D was medium to large (Cohen's d = 0·5 to 1; Fig. 4).
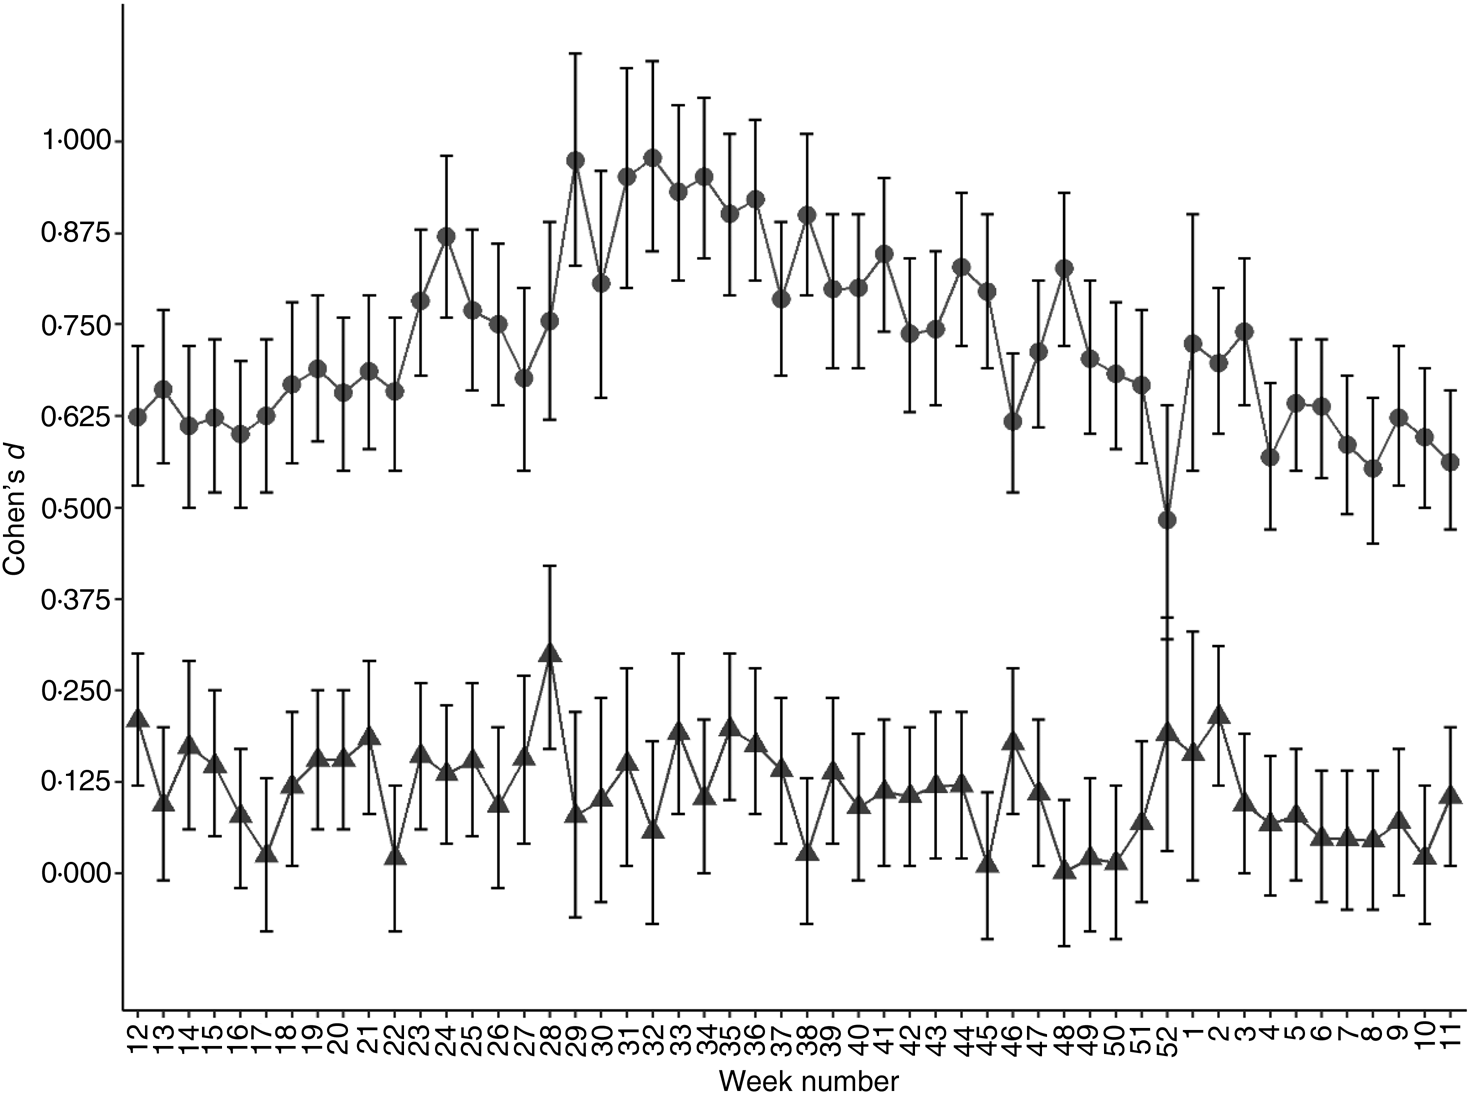
Fig. 4. Standardised effect size of genetic lactase persistence variant (rs4988235 CC v. CT/TT) on serum micronutrient concentration. Values are Cohen's d effect size for 25-hydroxyvitamin D (●) and vitamin B12 (▲) for each week of the year starting with the week with the vernal equinox, with 95% confidence intervals represented by vertical bars.
In multiple linear regression analysis, presence of the rs4988235 (T) allele, daylight hours, sex, age and an introduced interaction variable, rs4988235 (T) allele × sex, all remained independent determinants of serum 25(OH)D (adjusted R 2 0·15; P < 2·2 × 10−16; Table 2). In multiple regression of serum vitB12, rs4988235 (T) allele, daylight hours, age and the interaction variable, rs4988235 (T) allele × sex, remained determinants of serum vitB12 concentration (R 0·02; P = 1·4 × 10−12), but in an inverse relationship with less effect (Table 2). Sex remained an independent determinant of serum vitB12 in a model without interaction (data not shown). In these models, having CT/TT was associated with an increase of 14·2 nm serum 25(OH)D and a 1·9 pm decrease in vitB12. Being female was associated with a 2·8 nm increase in serum 25(OH)D. Being female and having CT/TT was associated with a 4·8 nm increase in serum 25(OH)D and a 10·4 pm decrease in serum vitB12. Every 1 h increase in daylight led to an average of 1·2 nm increase in serum 25(OH)D and 1·7 pm decrease in serum vitB12. Every 1-year increase in age led to an associated increase of 0·2 nm serum 25(OH)D and 0·5 pm decrease in serum vitB12 (Table 2).
Table 2. Multiple regression analysis of serum micronutrient concentration on LCT-13910 T-allele conditioned on daylight hours on week of micronutrient test date, age, sex and the interaction LCT-13910 T-allele × sex

LCT, lactase gene.
* 5 and 112 588 df.
† 5 and 120 286 df.
Discussion
The genetic basis of LP in Eurasians is a single C to T mutation, 13 910 bp upstream of the lactase gene (LCT) that leads to individuals not switching off synthesis of the enzyme lactase phlorizin hydrolase in their lifetime(Reference Ségurel and Bon27). Although most individuals without the LP variant seem to tolerate moderate amounts of lactose-containing dairy products(Reference Shaukat, Levitt and Taylor28,Reference Sibley29) , individuals with the genetic LP variant tend to drink more unfermented milk and possibly consume more dairy products(Reference Alharbi and El-Sohemy16,Reference Bergholdt, Nordestgaard and Varbo23,Reference Ding, Huang and Bergholdt30) . In a Mendelian randomisation study of Caucasians of European descent living in Canada, the Eurasian LP variant, when used as an instrument for dairy product consumption, associated dairy product consumption with higher levels of serum 25(OH)D(Reference Alharbi and El-Sohemy16). This was attributed to vitamin D supplementation of dairy products. Similarly, European countries with high LP in the population tend do have less vitamin D deficiency in the population despite lower UVB exposure(Reference Sorthe and Moghaddam20). In a different study of 210 individuals tested for primary adult-type lactose malabsorption (PALM) using the same genetic marker, subjects with PALM had lower levels of vitamin D and higher levels of the bone resorption marker, CrossLaps, compared with controls(Reference Enko, Kriegshäuser and Stolba31). However, in the latter study, frequency of smokers was higher in the PALM group and seasonality of vitamin D measurements was not considered. I wanted to determine whether in a country such as Norway, which is situated at high latitude and consequently with limited UVB exposure, the same pattern of 25(OH)D concentration in individuals with and without a LP variant could be observed. In Norway, approximately 50 % of the milk consumed, a lightly fat-reduced milk, is supplemented with vitamin D(26,32) . Furthermore, I hypothesised that if there is a difference in vitamin D status in genetically determined LP and lactase non-persistent individuals, it should reduce in summer months, as vitamin D forms rapidly in skin after exposure to UVB, with excess compound converted to inactive metabolites(Reference Gilchrest33,Reference Rockell, Skeaff and Williams34) . In this analysis of over 100 000 individuals, I could confirm that mean serum 25(OH)D was noticeably higher in individuals with a genetic LP variant compared with individuals without. In addition, there was a non-linear dose–response: individuals with two copies of the LP rs4988235 (T) variant (TT) had detectably higher level of serum 25(OH)D compared with those with one copy (CT; P < 2 × 10⁻¹⁶; Fig. 1). A dose–response to T-allele copy number has been reported in some studies(Reference Alharbi and El-Sohemy16,Reference Obermayer-Pietsch, Bonelli and Walter25) but is mostly undetectable in studies of dairy product consumption(Reference Bergholdt, Nordestgaard and Ellervik22,Reference Yang, Lin and Au Yeung35,Reference Lember, Torniainen and Kull36) . Mean serum 25(OH)D level at different times of the year followed but lagged the sinusoid curve seen by mean daylight hours per d, used here as a proxy for UVB exposure (Fig. 1), in all three populations stratified according to Eurasian LP allele copy number. However, in contrast to the pre-study hypothesis, there was no clear diminishing of the difference in mean serum 25(OH)D concentrations between the three genotypes in summer months. In fact, the opposite seems to be true as seen in volcano plots of P v. fold-change in mean serum 25(OH)D concentrations (Fig. 1(b)); after a period of longer daylight hours, difference in serum 25(OH)D levels between genetically determined LP individuals and lactase non-persistent individuals increased. Milk is naturally high in vitB12 and although it is not the only source of vitB12, it is a significant source for populations living in countries with strong dairy industries(Reference Van Rossum, Fransen and Verkaik-Kloosterman17,Reference Manios, Moschonis and Grammatikaki37) . Hence it was hypothesised that milk consumption could be positively associated with serum vitB12 levels independent of UVB exposure. The second novel finding of the present study, albeit counterintuitive, was that persons with a genetic LP variant had equal or lower levels of vitB12 (Fig. 3). The positive effect size of the LP rs4988235 (T) allele on serum 25(OH)D was medium to large (d = 0·5 to 1) compared with that of its negative effect size on serum vitB12 concentration, which was low to negligible (d = 0 to 0·3; Fig. 4). Based on these two observations, I cannot exclude pleiotropic factors, not related to dairy product consumption, such as sunscreen use, skin pigmentation or clothing worn outdoors, to cause the difference in vitamin D levels seen in the population stratified by the LP rs4988235 (T) allele.
The third novel observation was that the effect of sex on serum 25(OH)D concentration was remarkably higher in the genetically LP sub-population (70·4 nm in women v. 62·6 nm in men; d = 0·3) compared with the genetic lactase non-persistent sub-population (50·9 nm in women v. 48·1 nm in men; d = 0·1; Table 1). Smith et al. (Reference Smith, Coltell and Sorlí38) have recently reported a sex-specific association of LP with higher CVD and mortality in women but not in men(Reference Smith, Coltell and Sorlí38). Although sex itself is not a driver of lactose intolerance(Reference Lapides and Savaiano39), diet modulation due to actual and perceived lactose intolerance may be different in men and women(Reference Afify and Pali-Schöll40). In the present study, an interaction between the LP rs4988235 (T) allele and sex was introduced in multiple regression analyses that was significant in both the regression of serum 25(OH)D and serum vitB12 (Table 2). This interaction reduced the coefficient for the LP rs4988235 (T) allele from 17·1 (data not shown) to 14·0 (Table 2) in the vitamin D group but did not affect coefficients for daylight hours, age or sex alone. In the vitB12 study group, the interaction reduced the coefficient for the rs4988235 (T) allele from −8·6 (data not shown) to −1·9 and sex alone became an insignificant determinant of serum vitB12 (Table 2). Interaction between genetic LP variant and daylight hours was small in the vitamin D group and insignificant in the vitB12 group (data not shown) and consequently not included in the model.
There are several weaknesses to the present study. Firstly, measurements of milk consumption by the study subjects was not available. Consequently, this is an observational study that can partially but not wholly support the causal study of Alharbi et al. (Reference Alharbi and El-Sohemy16). Secondly, the study subjects come from patients seeking health care, and consequently they cannot be classified as healthy subjects. Physicians would have ordered a test for lactose intolerance if the patient complains of frequent diarrhoea, gas, bloating, nausea or cramps or to determine if any symptoms are due to secondary lactose intolerance such as in coeliac disease. Furthermore, some ailments such as kidney and liver diseases, cystic fibrosis, Crohn's disease, coeliac disease as well as obesity can cause vitamin D deficiency or simply reduce bioavailability of vitamin D(Reference Nair41). None of these diseases is associated with inherited adult-type LP and stratification of such a large study population using genetic LP variant should have led to equal randomisation with respect to these diseases. Given the large sample size, it is likely that only a small fraction of the study subjects has health problems related to lactose intolerance, vitamin D deficiency or vitB12 deficiency. These tests would have been largely ordered by physicians in order to rule out potential causes. Hence the study subjects are likely to be representative of the whole population because of the large sample size. To look for signs of selection bias, I examined deviations from Hardy–Weinberg equilibrium in the study population (n 112 594) and in all patients that had been tested for genetic LP in the laboratory database (n 198 650). The latter contain patients that have not been tested for vitamin D, children under 10 years, patients with extreme vitamin concentrations or patients that have been tested in the laboratory outside of the study dates. Both the study population and the total patient population deviate significantly from Hardy–Weinberg equilibrium (P < 0·05; data not shown) but deviations in both groups were the same, with frequencies of TT, TC and CC being 0·47, 0·33 and 0·20, respectively, for both populations. Furthermore, I did not find a significant association between serum 25(OH)D levels and another SNP with high penetrance, namely HFE C282Y that leads to altered iron metabolism(Reference Allen, Gurrin and Constantine42) in subjects taken from the same database of Norwegian citizens, when adjusted for sex, daylight hours and age (n 15 881, data not shown). It would be of interest to determine if associations reported in the present study can be observed in a healthy sample population living at a similar latitude. Indeed, such a study is a logical follow-up of the present study findings. Assuming a cut-off of 50 nm for vitamin D deficiency(Reference Bouillon4), throughout the year apart from summer (weeks 26 to 39; Fig. 1), 10 444 out of 18 013 (58 %) of genetically determined lactase non-persistent individuals and 20 861 out of 71 024 (29 %) of genetically determined LP individuals would have been classified as vitamin D deficient. In summer months, vitamin D deficiency would have been 2184 out of 5200 (42 %) and 1997 out of 18 357 (11 %) in the two groups, respectively. There was no evidence that genetically determined lactase non-persistent individuals were overrepresented in the database in darker months as the percentage of T-allele in the study subjects remained mostly constant at 79 % throughout the year (Fig. 1(c) and (d)). A third weakness to the study is that records of ethnicity, socio-economic status, skin pigmentation, clothing habits, smoking habits and BMI of the study subjects were not available. In the study population of Enko et al. (Reference Enko, Kriegshäuser and Stolba31), subjects with primary lactose malabsorption tended to smoke more than their LP counterparts(Reference Enko, Kriegshäuser and Stolba31). However, it is well documented that cigarette smoking reduces plasma vitB12 considerably(Reference Piyathilake, Macaluso and Hine43). It is also well documented that lighter skin leads to more rapid vitamin D synthesis when exposed to UVB(Reference Rockell, Skeaff and Williams34). All study subjects would have been Norwegian citizens as a national personal number was used to link together micronutrient readings, genotypes and demographics. At the time of writing this paper, 81·4 % of the population in Norway are Scandinavian, Finnish or Icelandic(44). It is not known whether immigrants from low-LP populations are disproportionally represented in primary health care in Norway and hence if their numbers are skewed in the present study population. Phenotypic LP frequency in ethnic Norwegians is reported to be 97 %(Reference Liebert, López and Jones45). It is tempting to hypothesise that the Eurasian LP variant is correlated with a potential confounder such as the extent of skin pigmentation, and that such counfounder is more important for vitamin D status than modern dairy product consumption habits. If individuals without a genetic LP variant generally have darker skin, at high latitude they would have lower serum 25(OH)D because of limited UVB exposure, especially in darker months(Reference Clemens, Adams and Henderson46). In fact, lower vitamin D levels are reported in both the male and female immigrant population living in Norway(Reference Holvik, Meyer and Søgaard47). If light skin among genetically determined LP individuals, and not dairy product consumption, is the primary reason for higher serum 25(OH)D levels, that would explain why individuals with a genetic LP variant do not necessarily have higher vitB12 levels, i.e. more vitamin D and vitB12 are not acquired by genetically LP individuals through dairy product consumption. However, this does not explain the observation that in summer vitB12 concentrations drop in individuals without a genetic LP variant at a similar rate to that of genetically determined LP individuals (Fig. 3), as darker skin should protect against UVB-mediated destruction(Reference Juzeniene, Baturaite and Lagunova48,Reference Juzeniene and Nizauskaite49) . Secondly, it does not explain why there is a sex difference in serum vitamin D levels in genetically determined LP individuals but minimal in genetically determined lactase non-persistent individuals (Fig. 4). Lastly, using LDlink(Reference Machiela and Chanock50) the Eurasian LP rs4988235 SNP was found not to be in linkage disequilibrium with eight SNP associated with skin pigmentation(Reference Hart, Kimura and Mushailov51) nor with SNP in eight genes associated with vitamin D metabolism(Reference Li, Gao and Zhang52–Reference Jiang, Kiel and Kraft54) (data not shown).
In conclusion, analysis of a large population of patients attending primary healthcare confirms the findings that people who carry the Eurasian LP rs4988235 (T) allele and live at high latitude have a higher level of serum 25(OH)D compared with those who are genetically lactase non-persistent. This difference is apparent throughout the year and does not diminished in the summer months at times of higher UVB irradiation. Higher serum vitamin D in high-latitude regions as a result of LP would advantageously enhance Ca homeostasis directly (Ca assimilation hypothesis(Reference Flatz and Rotthauwe55)) and not just through lactose-enhancing Ca absorption or through general acquirements of micronutrients from dairy products. That I find women with a genetic LP variant have higher serum 25(OH)D compared with their male counterparts points to an additional potential selective advantage, that of giving birth to offspring without abnormal bone growth or low weight, as well as reducing likelihood of costly miscarriage(Reference Andersen, Jørgensen and Jensen56). There are suggestions that vitamin D levels resulting from seasonal patterns of sunshine and skin pigmentation may be a determinant of birth outcomes in differing races(Reference Conway and Trudeau57). If there was a selective advantage for this allele in Northern Europe at the time of animal domestication through acquiring nutrients from milk, this did not extend to selective advantage of acquiring vitB12. Lastly, these data raise the possibility of using a non-invasive and cheap SNP test to identify individuals living at high latitude who are at higher risk of vitamin D deficiency, prior to implementing a more demanding and costly serum 25(OH)D test. Alternatively, it is very possible that optimal vitamin D cut-off levels, as set by various agencies(Reference Bouillon4), would automatically classify many genetically lactase non-persistent individuals as vitamin D insufficient, when in fact their natural vitamin D status does not reflect their health status. Even in countries with excessive sunshine, such as in Pakistan, the population is found to be vitamin D insufficient, if international agencies’ guidelines are taken into consideration(Reference Sheikh, Saeed and Jafri58). Lastly, these data confirm the importance of stratifying adult study subjects according to genetic LP variant when studying indicators of vitamin D status in individuals.
Acknowledgements
A. M. thanks his employer, Fürst Medisinsk Laboratorium, for encouraging unsupervised and ethical research and publication.
A. M. declares that no external financial support was received for this study.
A. M. formulated the research questions, designed the study, carried out the research and the analysis, and wrote the article.
There were no conflicts of interest.


 Open access